Abstract
It is a common recommendation not to attempt a reliability analysis with a small sample size. However, this is feasible after considering certain statistical methods. One such method is meta-analysis, which can be considered to assess the effectiveness of a small sample size by combining data from different studies. The method explores the presence of heterogeneity and the robustness of the fresh large sample size using sensitivity analysis. The present study describes the approach in the reliability estimation of diesel engines and the components of industrial heavy load carrier equipment used in mines for transporting ore. A meta-analysis is carried out on field-based small-sample data for the reliability of different subsystems of the engine. The level of heterogeneity is calculated for each subsystem, which is further verified by constructing a forest plot. The level of heterogeneity was 0 for four subsystems and 2.23% for the air supply subsystem, which is very low. The result of the forest plot shows that all the plotted points mostly lie either on the center line (line of no effect) or very close to it, for all five subsystems. Hence, it was found that the grouping of an extremely small number of failure data is possible. By using this grouped TBF data, reliability analysis could be very easily carried out.
1. Introduction
Mining and the mineral industry are often the backbone of a country’s economy. Mining of ore in India is mostly done by the open-pit mining method. Most of the open-pit mines use dumpers or dump trucks as the equipment for transporting ore from the mine. Dumpers are powered by diesel engines [1,2,3,4,5]. The engine consists of different subsystems and is the most significant functioning unit of a dumper. Uninterrupted operation of the engines is imperative to meet the production target of the mine. Although scheduled maintenance at different time intervals is indicated by the manufacturers for the dumper engines, breakdown of dumper engines still could not be eliminated and will always remain a bottleneck. A reliability analysis can help to identify the blocks in the system [4,5,6,7,8]. The difficulty faced during a reliability study is the availability of a large pool of failure data. In this research work, it is recommended to deal with a small sample size that groups the failure data from each of the subsystems of three similar types of engines. Before grouping the failure data, a meta-analysis test and a sensitivity analysis test are carried out, which will check whether grouping is possible or not so that the grouped failure data may be utilized further for the reliability analysis.
From the literature review, it is evident that a very scarce amount of research related to the reliability and maintainability of equipment used in mining has been carried out. D.H. Olwell et al. [9] supplemented limited filed data with prior information using the Weibull probability distribution. This paper carried out a survival analysis of the motor used in missiles under field conditions using the Maximum Likelihood Estimation (MLE) method and the Bayesian method [9,10,11]. R M. Mayer et al. [12] reported on grouping a small amount of failure data in order to obtain a larger pool of statistical data to be used in statistical interpretation [12,13]. G Wang et al. [14] proposed a method that determined which small-sample failure data of diesel engines could be used for a reliability estimation. The method was based on failure mode effects and criticality analysis (FMECA). The paper written by L. Qin et al. [15] discussed the increasing number of failure data of bearings, based on performance degradation data, in order to estimate distribution parameters. The authors concluded that the small size of the failure data could be used in a reliability analysis [13,14,15,16,17,18]. W. Si et al. [19] suggested the reliability model for repairable systems. The failure time data used here is incomplete failure data. The proposed model can be used to model a single system as well as multiple systems. L. Zhang et al. [20] used the Bayesian method to evaluate the reliability of a very small amount of failure data. The authors performed the reliability analysis on a wet friction plate that is used in a hydraulic control.
A review of the literature shows that the reliability studies conducted so far have used a small amount of failure data [19,20,21,22,23,24,25,26,27,28]. The methods used for reliability analyses of small-size data mostly make use of the Bayesian approach, the FMECA, and the Monte Carlo method. Studies on the reliability of engine subsystems that make use of an extremely small sample size of failure data have not been reported. The present study uses the meta-analysis test, which has been used only in the medical field and not in the industrial field. Using this method, the small failure data of any machine or system (in this case, the diesel engine) can be grouped and easily used for further reliability analysis.
In an engine, maintenance philosophies involve performing maintenance after given time intervals, usually after a set number of runtimes. In spite of the scheduled maintenance, engine failure is inevitable, thereby decreasing the availability of dumpers and reducing the production cost. A reliability analysis of engine subsystems is essential in the formulation of maintenance strategies, which will decrease the downtime of an engine and increase its availability. A main obstacle was the deficiency of adequate data for the appropriate statistical analyses [23,24,25,26,27,28,29,30]. The present study gives specific guidelines for using the meta-analysis test, which will solve the problem related to small-size failure data. After the meta-analysis test, the failure data may be grouped and used for statistical analysis.
1.1. Related Works
A meta-analysis is a typical statistical analysis that combines the outcomes of multiple scientific studies. Meta-analysis can be carried out when there are multiple scientific studies addressing similar questions, with each individual study reporting assessments that are expected to have some degree of erroneous results.
1.2. Methods for Meta-Analysis
The Time between Failure (TBF) data should be considered from the historical records of the concerned equipment. The data grouping of failure data from each subsystem of similar types of equipment has to be carried out. Prior to grouping the TBF data, the level of heterogeneity of the failure data should be verified using a meta-analysis test. Meta-analysis must be carried out to inspect whether or not the statistical results obtained from the TBF data of individual equipment will be of a similar nature to the statistical results obtained from the pooled TBF data of the relevant equipment. A sensitivity analysis test also has to be performed for meta-analysis. In the sensitivity analysis test, a forest plot was carried out for all the concerned subsystems of the concerned machineries.
1.3. Related Mathematical Formulae and Their Significances
The outcome or effect size (ES) is calculated as follows:
This formula will calculate the character of the performance of the concerned equipment.
Standard Error (SE) for equipment must be calculated using the following formula:
Rate of outcome = Outcome × 100
This formula will calculate the rate of outcome of the concerned equipment based on standard error.
The failure data for each subsystem must be weighed (W) against its variance, and must be calculated using this formula:
This formula will determine the weight against variance of each of the relevant machinery based on standard error.
The weighted effected size for each equipment must be computed by the product of the effect size and the study weight:
(W × ES)
Other important variables, W × , must be calculated for each equipment required for estimating Q statistics. Q test measures the studies’ heterogeneity.
The formula is:
Finally, the level of heterogeneity, i.e., , must be calculated. The i2 is used for quantifying heterogeneity and is mentioned as a total variability percentage in a set of effect sizes due to real heterogeneity, which is the variability between the failure data.
The formula is:
where “df” stands for degrees of freedom, which is equal to n − 1, where n is the number of engines under study; in this case, it is 3 − 1 = 2.
For Confidence Interval (CI)
CI LOWER = Outcome − 1.96 × SE
Effect summary must be calculated as = .
The standard error is:
The heterogeneity compares the criticality of differential performance of various similar equipment based on standard error.
2. Research Methodology
The engine considered in this study is the Dumper engine. Dumpers have a wide range of carrying capacity—from 35 tons to 496 tons. A diesel engine consists of a number of subsystems and components, of which a few are repairable and the others are non-repairable. This makes the diesel engine a complex repairable system. The engines under study are turbocharged compression ignition (C.I.) engines with 12 cylinders, V-type, and a maximum power rating of 900 hp, rotating at 2100 rpm. In CI engines, air is compressed in the combustion chamber such that the injected liquid fuel can easily catch fire and burn progressively for power generation. Table 1 shows a list of the repairable and non-repairable components of the engine subsystem chosen for study and their importance in the operation of the engine.

Table 1.
List of repairable and non-repairable components of the engine subsystem.
The Time between Failure (TBF) data is collected from the log book of the surface mining project. In this research work, we performed a small sample size grouping of the failure data for each of the subsystems of three similar type of engines. Before grouping the TBF data, the level of heterogeneity of the failure data is checked using a meta-analysis test. Meta-analysis checked whether the statistical results obtained from the TBF data of each engine were similar to the statistical results obtained from the pooled TBF data of the three engines. A sensitivity analysis test was also carried out for meta-analysis. In the sensitivity analysis test, forest plot was performed for all five subsystems of the engine. Figure 1 shows the steps followed for meta-analysis and sensitivity analysis in this paper.
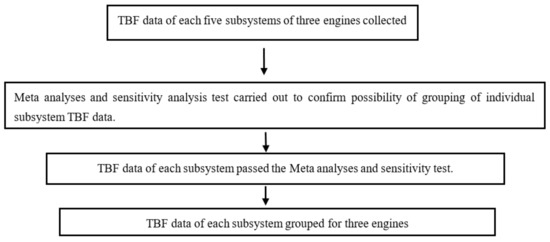
Figure 1.
Steps followed for meta-analysis and sensitivity analysis.
3. Experimentation
3.1. Collection of Field Data
The failure data of each subsystem of three engines are presented in Table 2. The data were collected from maintenance record book of the mine for three years. All TBF data are in hours.

Table 2.
TBF of engine subsystems.
3.2. Grouping of Data
Meta-Analysis Test
To check the level of heterogeneity, the meta-analysis test was used. In the present study, variability of the failure data among the three engines for each subsystem was tested using meta-analysis. Variability means the differences in statistical results obtained between the individual failed data and the pooled failure data for a particular subsystem.
In Table 3, the column “downtime hours” describes the total non-operational hours of a particular engine due to the problems related to the specific subsystem mentioned at the top of the table. The “total run of engine” column indicates the total time in hours that the engine was in operation.

Table 3.
Level of Heterogeneity (i2) values of all five subsystems.
The outcome or effect size (ES) column is calculated [11] as follows:
Standard Error (SE) for each engine is calculated using the formula:
Rate of outcome = Outcome × 100
The failure data for each subsystem is weighed (W) against its variance, and it is calculated using the following formula:
where weighted effected size for each engine is determined by computing the product of effect size and study weight.
(W × ES)
Other important variables, W × , are calculated for each engine, which are required for estimating Q statistics. The Q test measures the studies’ heterogeneity.
The formula is:
Finally, the level of heterogeneity, i.e., , is calculated. The i2 is used for quantifying heterogeneity and is stated as a total variability percentage in a set of effect sizes due to real heterogeneity, which is variability between the failure data.
The formula is:
where “df” stands for degrees of freedom, which is equal to n − 1, where n is the number of engines under study; in this case, it is 3 − 1 = 2.
For Confidence Interval (CI), the formula is as follows:
CI LOWER = Outcome − 1.96 × SE
Effect summary is calculated as = .
The standard error is calculated with the SE:
Confidence Interval at 95% level is calculated as follows:
4. Results and Discussions
To date, meta-analysis has not been used on industrial equipment, especially on dumper engines. J.P T Higgins et al. [8] in 2003 measured inconsistency in meta-analysis. E. Ahn et al. [16] used meta-analysis in Anesthesiology. Recently, C. Krittanawong et al. [22] carried out meta-analysis on different machine learning algorithms used for cardiovascular disease. R.M. Ghazy et al. [24] in 2020 used meta-analysis to obtain the statistical details of the effects of different medicines on COVID-19 treatment. In this paper, the first attempt has been made to use meta-analysis and Forest plot on industrial equipment failure data. The novelty of this work lies in the fact that it addresses an industrial issue of the non-availability of a representative number of failure data for reliability analysis [25,26,27].
4.1. Meta-Analysis Test
It can be observed from Table 3 that the level of heterogeneity value is negative for self-starting, fuel supply, lubrication, and cooling subsystems [27,28,29,30]. Negative values for the level of heterogeneity can be treated as equal to zero [10]. The level of heterogeneity value for air supply subsystem is 2.23%, which is very low [11]. The zero value for four subsystems and the low value of the level of heterogeneity for one subsystem indicates that there is no variability among the failure data of three engines for all the five subsystems. This suggests that all the samples came from same underlying distribution, thereby supporting the result of the CBH test, which allows for the pooling of the failure data of the three engines for each subsystem.
The heterogeneity value provides a comprehensive description, through several characteristics, of the differential performance of the three engines in terms of various subsystems. They are quite similar values, which can also be obtained from simpler statistical calculations; however, heterogenity provides the confidence in the assessment of the differential levels of performance.
4.2. Sensitivity Analysis
The forest plot is employed in the sensitivity analysis. Forest plots are graphical representations of the meta-analysis test [10]. A forest plot, also known as a blobbogram, is a graphical display of calculated overall results. The forest plot allows us to directly compare the individual studies and the quality of the result.
4.2.1. Sample Steps to Draw a Forest Plot for the Air Supply Subsystem
To draw forest plot data from the Air supply subsystem, data from Table 4 are used. The following steps are performed:

Table 4.
Data for forest plot of all five subsystems.
- First, a scatter plot is drawn in excel. X axis and Y axis values are taken from the Rate column and the Ordinal number column of Table 4, respectively.
- The error bars are subsequently added by clicking the “Error Bar” button on the right side. After right-clicking on the data series, click “format data series”, then choose the “X error bar” Table. In this window, assign the columns CI lower and CI upper as the lower and upper limit.
- The line marking values are then added to the summary effect value, first by right-clicking on the graph, followed by Select Data. Then click on “add” and choose X and Y values from the central tendency column of the table.
- A new set of points is seen on the graph. By right-clicking on any of the dots, “format data series” can be selected. The “no marker” and “solid line” can be chosen on the Marker Options and Line Color tabs.
- The X axis is further formatted by right-clicking on it and choosing the logarithmic scale, which also formats the Y axis up to value 5.
The same process is repeated for all remaining four subsystems.
The forest plot for all five subsystems is shown below in Figure 2, Figure 3, Figure 4, Figure 5 and Figure 6.
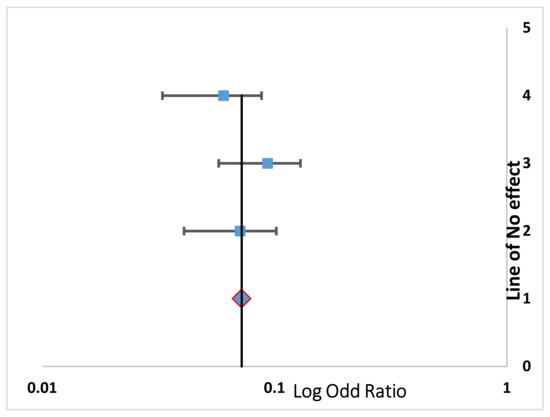
Figure 2.
Forest plot of the Air Supply subsystem.
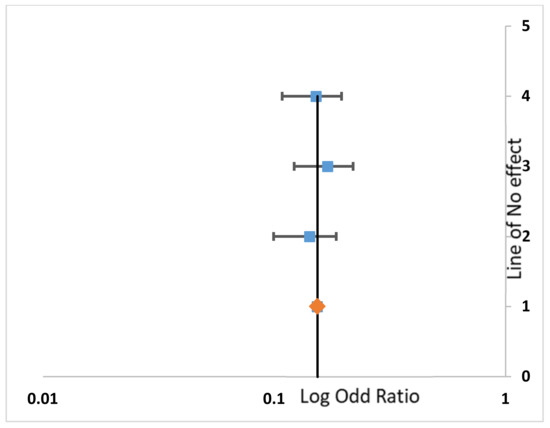
Figure 3.
Forest plot of the Self-starting subsystem.
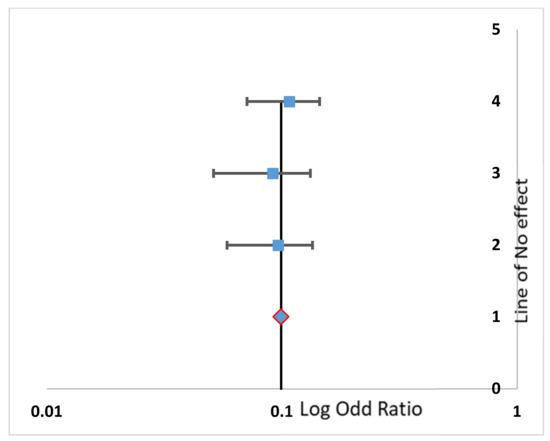
Figure 4.
Forest plot of the Fuel Supply subsystem.
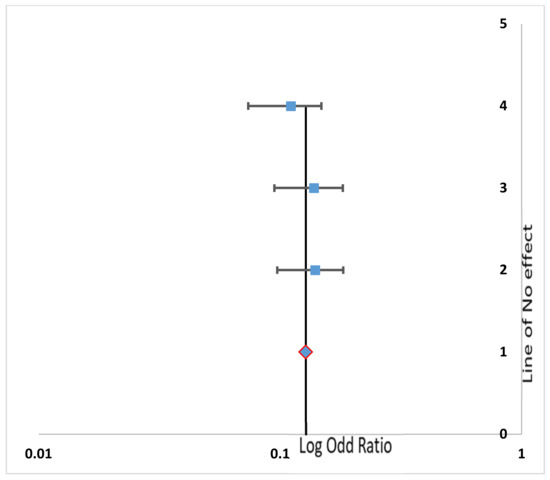
Figure 5.
Forest plot of the Lubrication subsystem.
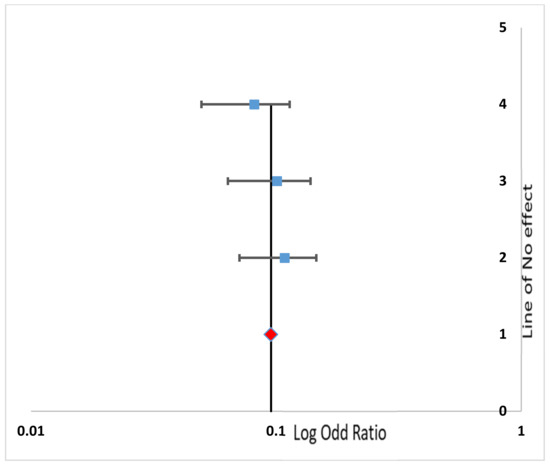
Figure 6.
Forest plot of the Cooling subsystem.
In the forest plot, the horizontal axis displays the odds ratio (OR) or a relative risk (RR). A vertical line represents the no-effect line. The diamond shape in the graph shows the overall effect of the studies.
From the plot, it can be seen that all the plotted points mostly lie either on the center line (line of no effect) or very close to it. Only two points in the air supply subsystem lie at small distance away from the center line. This could also be verified from the arithmetic value (Table 3), i.e., the i2 level of heterogeneity value, which is 2.23% for the air supply subsystem. The level of heterogeneity for the remaining four subsystems are all at 0%.
4.2.2. Log Odds Ratio
The odds ratio is the probability of success/probability of failure. As an equation, that is P(A)/P(−A), where P(A) is the probability of A, and P(−A) the probability of ‘not A’ (i.e., the complement of A).
The meta-analysis test and sensitivity analysis test carried out on the failure data of the engine subsystems in this study allow for the pooling of the failure data of three engines. Furthermore, the pooled data can successfully be used for reliability analysis. The grouped TBF data, in hours, are shown in Table 5.

Table 5.
Grouped TBF data of three engines.
5. Conclusions
The problem associated with reliability analysis using an extremely small amount of failure data has been solved in this paper. This research work serves as a guide, which can be used for reliability analysis of any repairable system and its subsystems when extremely small sample sizes of failure data are available. Using meta-analysis, the level of heterogeneity can be obtained for systems and subsystems. Sensitivity analysis carried out by creating a forest plot also supports the results obtained from meta-analyses. After completing the tests above, the extremely small failure data can thus be pooled. Furthermore, the grouped failure data can effectively and easily be used for reliability analyses.
Author Contributions
Conceptualization, B.K.D., A.K.M., S.C., S.S., and J.M.; methodology, B.K.D., A.K.M., S.C., and S.S.; formal analysis, B.K.D., A.K.M., S.C., S.S., and J.M.; investigation, B.K.D., A.K.M., S.C., S.S., and J.M.; resources, B.K.D., A.K.M., S.C., and S.S.; writing—original draft preparation, B.K.D., A.K.M., S.C., and S.S.; writing—review and editing, B.K.D., A.K.M., S.C., S.S., and J.M.; supervision, B.K.D., A.K.M., S.C., and S.S.; funding acquisition, S.S. and J.M. All authors have read and agreed to the published version of the manuscript.
Funding
The authors are grateful to FCT—Fundação para a Ciência e Tecnologia—who financially supported this work through the RD Units Project Scope: UIDP/04077/2020 and UIDB/04077/2020.
Institutional Review Board Statement
Not applicable.
Informed Consent Statement
Not applicable.
Data Availability Statement
The data presented in this study are available on request from the corresponding author.
Conflicts of Interest
The authors declare no conflict of interest.
References
- Crow, L.H. Reliability analysis for complex repairable systems. In Reliability and Biometry; Proschan, F., Serfling, R.J., Eds.; SIAM: Philadelphia, PA, USA, 1975; pp. 379–410. [Google Scholar]
- Military Handbook. Reliability Growth Management; MIL-HDBK-189; U.S. Department of Defense: Washington, DC, USA, 1981.
- Littlewood, B.; Ascher, H.; Feingold, H. Repairable Systems Reliability: Modelling, Inference, Misconceptions and their Causes. J. R. Stat. Soc. Ser. A 1985, 148, 165. [Google Scholar] [CrossRef]
- Ascher, H.; Feingold, H. Repairable System Reliability; Dekker: New York, NY, USA, 1984. [Google Scholar]
- Jones, B.; Bethea, R.M.; Duran, B.S.; Boullion, T.L. Statistical Methods for Engineers and Scientists. J. R. Stat. Society. Ser. A 1985, 148, 390. [Google Scholar] [CrossRef]
- Crow, L.H. Evaluating the Reliability of Repairable Systems. In Proceedings of the Annual Reliability and Maintainability Symposium, Los Angeles, CA, USA, 23–25 January 1990; pp. 275–279. [Google Scholar]
- Charles, E.E. An Introduction to Reliability and Maintainability; McGraw-Hill Companies, Inc.: New York, NY, USA, 2000. [Google Scholar]
- Higgins, J.; Thompson, S.G.; Deeks, J.; Altman, D. Measuring inconsistency in meta-analyses. BMJ 2003, 327, 557–560. [Google Scholar] [CrossRef] [PubMed] [Green Version]
- Olwell, D.H.; Sorell, A. Warranty Calculations for Missiles with only Current-Status Data. In Proceedings of the Using Bayesian Methods, Annual Reliability and Maintainability Symposium, Philadelphia, PA, USA, 22–25 January 2001; pp. 144–148. [Google Scholar]
- Crombie, I.; Davies, H.T. What Is Meta-Analysis? 2nd ed.; Evidence Based Medicine; Hayward Medical Publishing: Little Bookham, UK, 2009; pp. 1–8. [Google Scholar]
- Neyeloff, J.L.; Fuchs, S.C.; Moreira, L.B. Meta-analyses and Forest plots using a microsoft excel spreadsheet: Step-by-step guide focusing on descriptive data analysis. BMC Res. Notes 2012, 5, 52. [Google Scholar] [CrossRef] [PubMed] [Green Version]
- Mayer, R.M.; Larean, J.P.; Crowford, S.L.; Anderson, M.T. Review of Literature on Model Assisted Probability Detection; Pacific Northwest National Laboratory (PNNL): Richland, WA, USA, 2014.
- Deepika. Reliability Analysis of Transit Fuel System in Diesel Engine. Bull. Pure Appl. Sci. Math. Stat. 2017, 36E, 51. [Google Scholar] [CrossRef]
- Wang, G.; Zhou, Y.; Zhang, Q.; Wang, S. The Small Sample Failure Distribution Model of Diesel Engine Component Parts Using the FMECA Approach. Int. J. Model. Optim. 2017, 7, 19–23. [Google Scholar]
- Qin, L.; Shen, X.; Chen, X.; Gao, P. Reliability Assessment of Bearings Based on Performance Degradation Values under Small Samples. J. Mech. Eng. 2017, 63, 248–254. [Google Scholar] [CrossRef]
- Ahn, E.J.; Kang, H. Introduction to Systematic Review and Meta-Analysis. Korean J. Anaesthesiol. 2018, 71, 103–112. [Google Scholar] [CrossRef] [PubMed] [Green Version]
- Dai, W.; Chi, Y.; Lu, Z.; Wang, M.; Zhao, Y. Research on Reliability Assessment of Mechanical Equipment Based on the Performance–Feature Model. Appl. Sci. 2018, 8, 1619. [Google Scholar] [CrossRef] [Green Version]
- Xintao, X.; Zhen, C.; Lijun, Z.; Xiaowei, Y. Estimation on Reliability Models of Bearing Failure Data. Math. Probl. Eng. 2018, 2018, 6189527. [Google Scholar] [CrossRef] [Green Version]
- Si, W.; Yang, Q.; Monplaisir, L.; Chen, Y. Reliability Analysis of Repairable Systems with Incomplete Failure Time Data. IEEE Trans. Reliab. 2018, 67, 1043–1059. [Google Scholar] [CrossRef]
- Zhang, L.; Jin, G.; You, Y. Reliability Assessment for Very Few Failure Data and Weibull Distribution. Math. Probl. Eng. 2019, 2019, 8947905. [Google Scholar] [CrossRef]
- Darmanto, S.; Atmanto, I.S.; Permana, B.H. Reliability Analysis of Diesel Engine at LNG Plant Using Counting Process. J. Vocat. Stud. Appl. Res. 2019, 1, 1–4. [Google Scholar]
- Krittanawong, C.; Virk, H.U.H.; Bangalore, S.; Wang, Z.; Johnson, K.W.; Pinotti, R.; Zhang, H.; Kaplin, S.; Narasimhan, B.; Kitai, T.; et al. Machine learning prediction in cardiovascular diseases: A meta-analysis. Sci. Rep. 2020, 10, 16057. [Google Scholar] [CrossRef] [PubMed]
- Kumar, N.S.H.; Choudhary, R.P.; Murthy, C.S. Reliability-based analysis of probability density function and failure rate of the shovel–dumper system in a surface coal mine. Model. Earth Syst. Environ. 2020. [Google Scholar] [CrossRef]
- Ghazy, R.M.; Almaghraby, A.; Shaaban, R.; Kamal, A.; Beshir, H.; Moursi, A.; Ramadan, A.; Taha, S.H.N. A systematic review and meta-analysis on chloroquine and hydroxychloroquine as monotherapy or combined with azithromycin in COVID-19 treatment. Sci. Rep. 2020, 10, 22139. [Google Scholar] [CrossRef] [PubMed]
- Agrawal, A.K.; Murthy, V.M.S.R.; Chattopadhyaya, S. Investigations into reliability, maintainability and availability of tunnel boring machine operating in mixed ground condition using Markov chains. Eng. Fail. Anal. 2019, 105, 477–489. [Google Scholar] [CrossRef]
- Agrawal, A.; Chattopadhyaya, S.; Murthy, V.; Legutko, S.; Krolczyk, G. A Novel Method of Laser Coating Process on Worn-Out Cutter Rings of Tunnel Boring Machine for Eco-Friendly Reuse. Symmetry 2020, 12, 471. [Google Scholar] [CrossRef] [Green Version]
- Bisht, V.; Kumar, S.; Agrawal, A.K.; Siddiqui, M.A.H.; Chattopadhyaya, S. Prediction of breakdown hours of load haul dumper by long short term memory network. In IOP Conference Series: Earth and Environmental Science; IOP Publishing: Bristol, UK, 2021; Volume 1104, p. 12006. [Google Scholar]
- Vashishta, S.; Kumar, S.; Agrawal, A.K.; Siddiqui, M.A.H.; Chattopadhyaya, S. Reliability and Maintainability Analysis of LHD Loader at Saoner Mines, Nagpur, India. In IOP Conference Series: Earth and Environmental Science; IOP Publishing: Bristol, UK, 2019; Volume 691, p. 12013. [Google Scholar]
- Kumar, G.; Agrawal, A.K.; Chattopadhyaya, S.; Siddiqui, M.A.H. Reliability and maintainability analysis of universal drill machine at Saoner mines, Nagpur, India. In IOP Conference Series: Earth and Environmental Science; IOP Publishing: Bristol, UK, 2021; Volume 691, p. 12014. [Google Scholar]
- Dinkar, B.K.; Mukhopadhyay, A.K.; Chattopadhyaya, S.; Sharma, S.; Alam, F.; Machado, J. Statistical Reliability Assessment for Small Sample of Failure Data of Dumper Diesel Engines Based on Power Law Process and Maximum Likelihood Estimation. Appl. Sci. 2021, 11, 5387. [Google Scholar] [CrossRef]
Publisher’s Note: MDPI stays neutral with regard to jurisdictional claims in published maps and institutional affiliations. |
© 2021 by the authors. Licensee MDPI, Basel, Switzerland. This article is an open access article distributed under the terms and conditions of the Creative Commons Attribution (CC BY) license (https://creativecommons.org/licenses/by/4.0/).