Article

Analysis of Psychometric Properties and Validation of the Personal Learning Environments Questionnaire (B-PLE) in Higher Education Students

by
José Luis Carrasco-Sáez
1,2,*,
Marcelo Careaga Butter
3,4,
María Graciela Badilla-Quintana
3,4 and
Juan Molina-Farfán
5
1
Faculty of Education, Universidad Católica de la Santísima Concepción, Concepción 4090541, Chile
2
Corporación Pewün Kimeltu, Concepción 4080713, Chile
3
Researcher of ICT Nucleus, ICT in Educational and Intercultural Contexts, Universidad Católica de la Santísima Concepción, Concepción 4090541, Chile
4
CIEDE-UCSC, Universidad Católica de la Santísima Concepción, Concepción 4090541, Chile
5
Department of Science of Language and Literature, Universidad Católica de la Santísima Concepción, Concepción 4090541, Chile
*
Author to whom correspondence should be addressed.
Sustainability 2021, 13(16), 8736; https://doi.org/10.3390/su13168736
Submission received: 18 May 2021 / Revised: 26 July 2021 / Accepted: 3 August 2021 / Published: 5 August 2021
(This article belongs to the Special Issue ICTs in Sustainable Education Environments)

Abstract

:
We are living through a cultural transition, characterized by technological disruption and the erosion of the modern ideology, which are redefining the behavior of citizens in their physical and digital spaces. Virtuality emerges as a new human dimension, making it necessary to rethink social and educational paradigms for a new two-dimensional citizen. In this context, the psychometric features and validation procedure of an instrument (B-PLE) for analyzing Personal Learning Environments (PLE) in students of higher education institutions in the Biobío Region of Chile are described. There were four phases to the validation method: (i) content validity, as determined by six experts in education and ICT; (ii) pilot test, with a non-probabilistic sample of 327 subjects; (iii) principal components analysis (PCA); and (iv) confirmatory factor analysis (CFA). The results of the dimensional analysis made it possible to define the structure of the new instrument, explaining 72% of the total variance. The reliability analysis yielded an alpha coefficient of 0.92. The confirmatory factor analysis showed fit indexes that support the proposed theoretical model. In conclusion, the instrument was composed of three latent variables: Open learning (OL), with six questions, Information management (IM), with two questions, and Knowledge creation and transfer (KCT), with three questions.

1. Introduction

We are now in the process of a cultural shift that demands new ways of thinking about society, human cohabitation, and education. We are in the midst of a crisis of thought, of philosophical and scientific knowledge [1,2,3,4,5,6,7], which requires the development of new definitions.
Part of these shifts are the result of technological disruptions, one of which is the creation of virtuality as a new human dimension, complementary to modern space and time [5]; the concept of the two-dimensional or digital citizen emerges as an individual who tends to develop a unique cultural identity in relation to the human group to which he belongs, as well as a global identity at the level of culture on a human scale, leading him to relate to natural and artificial social systems in real and virtual spaces—that is, in two-dimensional contexts—who tends to develop a unique cultural identity with respect to the human group to which he belongs, as well as a global identity at a human scale, which leads him to relate to natural and artificial social systems in real and virtual spaces—that is, in two-dimensional contexts.
Figure 1 suggests a structure that represents these relationships between the individual, systems, language, knowledge, and learning. It is based on the fact that there are not only bio-anthropological conditions of knowledge [8], but also, correlatively, socio-cultural conditions for the production of all knowledge, including scientific knowledge; in other words, the paradigm that produces a culture is, at the same time, the paradigm that reproduces that culture.
Different cycles can be seen in Figure 1. The different colors show that both interactions and language can have different levels of depth. Analyzing the complexities between language, knowledge, and learning implies assuming that at least some of the loops present in Table 1 and Table 2 can occur. Scaffolds can emerge in the subject’s interactions mediated by language, systems (Table 1), or knowledge (Table 2). Although the interactions can also be considered as a part of language, they are made explicit to consider the relationship between systems and knowledge, as well as the relationship of knowledge with learning.
Each of these loops can become a learning path for individuals that contributes to their adaptation to the changing conditions of the environment. For Aguado-Aguilar [9], learning is:
A process of change in the subject’s state of knowledge and, consequently, in his or her behavioral capabilities: as such, it is always a process of acquisition through which new knowledge and/or new behaviors and ways of reacting to the environment are incorporated.
Learning, on the other hand, according to Siemens [10], is a network formation process. A subject is a node in a network of interconnected nodes, adding to the network’s linkages with contents, people, groups, services, and repositories [11]. This is emergent, connected, and adaptive learning, in which knowledge remains in the individual, but resides in the collective [10].
The previous reflections suggest that new perspectives on society, education, how individuals learn, access to information, and how knowledge is created and transferred are required [5,7,12]. In the face of these issues, the formal education system continues to be decontextualized, according to various authors [4,5,10,12,13]. Incompatibilities emerge between a society that learns with technology and a society that learns exclusively with the traditional means of a school centered on the teacher’s protagonism, on standardized evaluations, and on a situated knowledge that is limited to the time and space of the classroom [13]. In this regard, the OECD [14] suggests that:
Education systems will need to adapt to the changes brought on by automation, teaching children and teenagers the skills necessary to fully benefit from the present wave of technological implementation. This involves cognitive and social intelligence, as well as the abilities required to function effectively in a digital environment, both as specialists and as users of digital technology.
Personal Learning Environments, known as PLE (Personal Learning Environment), have become an emerging position in international research in recent years to address the challenges outlined above. The term was first coined in 2001 as part of the Northern Ireland Integrated Managed Learning Environment project, which aimed to propose the concept of a learner-centered environment with a variety of learning resources [15]. Cabero, Barroso, and Llorente [16] understand PLE as an environment constituted by different communication tools that allow the creation of the personal communicative and formative scenography of a subject, which will be able, according to his interests and needs, to enhance both formal and informal learning, decentralized from the rigid principles mobilized by a training institution, open to the environment and people, and controlled by the individual—the latter in the sense of encouraging individuals to organize their own learning, that is, a learning that is halfway between formal and informal, and in which the individual takes responsibility for his or her own learning.
A basic structure for a PLE is proposed by Castañeda and Adell [17]. This is divided into three sections: (i) reading tools and techniques (for gaining access to information sources); (ii) reflection tools and strategies (for transforming information in settings or services); and (iii) relationship tools and strategies (environments for interacting with other people from whom it is possible to learn).
The importance and international relevance of the PLE has led to a great deal of research. The PLE, according to the studies reviewed, makes the individual the protagonist of his or her own learning, allowing students to take on a new role because they have more control over what they learn and how they learn it in two-dimensional contexts, regardless of their geographic location [6,17,18,19,20,21].
With respect to the validation of instruments, in the context of the CAPPLE project [19], an instrument was validated to study what the PLEs of future Spanish professionals are like. A procedure based on expert judgement, a round of cognitive interviews, and a pilot test with 224 subjects were used for validation. After concluding the procedures, the authors were able to validate an instrument consisting of 48 questions distributed in four basic dimensions for a PLE (self-perception, information management, management of the learning process, and communication).
Despite international evidence, little research on the use of PLEs in primary, secondary, and higher education has been conducted in Chile. Badilla, Carrasco, and Prats [22] conducted a study that focused on the development of lessons, activities, and projects that contribute to the development of the thinking skills and mental habits of first-year college students of technical engineering education from a Technical Training Center. The main findings included the development of a methodological and evaluative model that facilitates theoretical learning, based on the paradigm of learning with ICT, for example, to promote a higher competency development in students, seamlessly incorporating ICT into a learning activity and increasing motivation and collaborative work in physical and virtual classrooms.
A research conducted by the Ministry of Education in 2013 [23], in which an ICT questionnaire (SIMCE TIC) was employed, was another empirical reference discovered so far. A total of 11,185 s grade students from 492 subsidized and private schools took part in the survey. Only 1.8 percent of them exhibited advanced performance in the use of ICT for learning in four dimensions, according to the findings (information, communication, ethics and social impact, functional use of ICT).
In this context, the main goal of this research is to validate an instrument for studying PLE in higher education students as a means of contributing to the educational challenges that higher education institutions face in an uncertain future, marked by increasing automation and the polarization of labor.
These findings correspond to one of the doctoral dissertation’s phases: Bidimensional Pedagogical Model to Enhance Self-Regulated Learning in Higher Education Students in Chile’s Eighth Region [7]—the main goal of which was to propose a bidimensional pedagogical model based on the evaluation of the effect and the influence of the type of higher education institution (IES), to facilitate their development in ecological and complex contexts—the Personal Learning Environment (PLE), and the study of a knowledge cluster in the beliefs and practices of the self-regulation of learning of higher education students.

2. Materials and Methods

2.1. Research Design

During the second semester of the 2019 academic year, a non-experimental, descriptive, transactional study [24,25] was conducted. The factors studied in the original version of the instrument were out of the researchers’ direct control.

2.2. Participants

The respondents for the evaluation of the instrument’s psychometric qualities were chosen using a non-probabilistic convenience sampling method [26]. The non-random sample consisted of 327 volunteer students from the Biobío Region, belonging to the three levels of higher education (university, professional, and technical higher education). Regarding the sample size, there are two positions [27] on how to carry out a principal components analysis: (i) those that suggest a minimum size (N); (ii) those that define the proportion of people per item (N/p). The authors’ suggestions were followed, with a ratio of persons per item ranging from 5 to 15 subjects per question and a sample size of no fewer than 100 people [28,29,30].

2.3. The Instrument

The Questionnaire for the Study of the PLE of 8th Grade Students from 15 Schools in the Biobío Region of Chile (CUPLEB) was used as a reference for the initial version of the B-PLE instrument [6]. The psychometric analysis of this instrument obtained a Cronbach’s alpha coefficient of 0.89. The dimensional analysis was composed of a three-dimensional structure that explained 55% of the total variance. The final CUPLEB instrument was composed of 19 questions grouped into three latent variables: Open Learning (OL), with an alpha of 0.86; Information Management (IM), with an alpha of 0.86; and Knowledge Creation and Transfer (KCT), with an alpha of 0.70. One nominal question with three categories (Yes/No/I don’t know) and one nominal question with five categories (I learned alone/My teachers/My family/My friends/I don’t know how to do this) are among the 19 items accessible in the final version of the questionnaire.
The initial version of the B-PLE instrument consisted of 18 questions (Table 3). The wording of some questions of CUPLEB was modified to adapt them to the language of higher education, and some ICT tools that contribute to the management of information by students were included. Of the 18 questions available in the B-PLE instrument, 15 correspond to a seven-level scale; one has the scale: Yes/No (but I know it)/I do not know it; one corresponds to the frequency: Every day, two hours or more/Every day less than two hours/A few times a week/A few times a month/Never; and one question has answers of the type I learned: alone (a)/with my teachers/with my family/with my friends/I do not know how to do this.
The technologies and strategies that drive a person to learn and transmit knowledge in two-dimensional environments are referred to as the OL dimension. The instruments and tactics that a person employs to search for and organize information are referred to as the IM dimension. The KCT dimension is linked to the equipment and tactics used to process data, produce knowledge, and communicate it.

2.3.1. Instrument Validation

The validation method included four stages: (i) construct validation through expert judgment; (ii) a pilot test; (iii) principal component analysis (PCA); and (iv) confirmatory factor analysis (CFA).

Expert Judgment

Expert judgment can be used to validate a research instrument [31], and it is also an useful tool for assessing its content validity [32]. Since it was difficult to get all of the experts together at the same time, expert judgment by individual aggregates was used. Six specialists in the fields of education and information technology were chosen. Each one received the instrument’s validation format, which consisted of a table for each question, through the internet. They independently evaluated each question’s relevance with respect to the dimension to which it belongs. In addition, a space for observation was established so that they could make any relevant comment with respect to the importance of each sub item and the uniqueness of the language. Their suggestions were used to construct the second version of the instrument, which was then applied in the pilot test stage.
Based on the expert judgment analysis process, two questions were eliminated, the wording of some questions was modified, and questions were regrouped into other categories (Table 4).
The second version of the instrument was composed of 3 dimensions, with 13 questions distributed in 10 categories, as shown in Table 5.

Pilot Test

The pilot was carried out with 327 students from higher education (Universities, Professional Institutes, and Technical Training Centers) in the Province of Concepción, in the Biobío Region, Chile. The students who gave their consent participated online, guaranteeing the confidentiality of the information provided. The application of the questionnaire was carried online out during the second semester of 2019. The form had an explanation for the students about the objective of the study, with the option of not participating if they considered it appropriate. It took about 20 min to complete the application.

Statistical Analysis

Measures of internal consistency were generated using Cronbach’s alpha coefficient, and measures of correlation were calculated using Pearson’s correlation coefficient to evaluate the components that make up the instrument. To evaluate whether it was possible to perform a principal component analysis, the Bartlett’s Test of Sphericity and the Measure of Sample Adequacy (KMO) were used. The principal components method and an oblique rotation using the Oblimin technique were used in the analysis. Only the questions in the questionnaire with scalar variables were subjected to this test’s results (13 questions).
To corroborate the results of the psychometric properties obtained in the exploratory factor analysis, a confirmatory factor analysis was carried out, which allows for the representation of the relationships of the latent variables with their observed or indicator variables [33,34], to confirm that all the questions fit the proposed model [35,36,37].
The analyses were performed with the R Software from RStudio statistical software (version 1.2.5033, Boston, MA, USA). In specific, the fa.parallel function was used, and the following packages: the lavaan and the semPlot.

3. Results

The results of the study are analyzed in two steps: main component analysis, confirmatory factor analysis.

3.1. Main Component Analysis

The initial data exploration reveals that some students did not want to participate by answering the questionnaire, so the valid sample consisted of 319 students, as shown in Table 6. Forty-one percent of the respondents were male, while 59% were female. Regarding the type of institution, 49% came from Universities, 13% from Professional Institutes, and 38% from Higher Level Technical Training Centers.
The responses were analyzed according to a Likert scale from 1 to 7, where 1 was strongly disagree and 7 was strongly agree (Table 7).
The collinearity of the variables was investigated using a Pearson correlation matrix. When using the matrix determinant, a p-value of 0.01 was achieved. This indicates that the set of variables in the correlation matrix has a high level of collinearity. Bartlett’s test of sphericity was employed for multicollinearity assumptions, yielding a p-value of 0.0001; and the Kaiser–Meyer–Olkin (KMO) sample adequacy measure provided a value of 0.93. A main component analysis was carried out based on these findings. Two criteria were analyzed to extract the components: the parallel analysis, which suggested three components, and the variance percentage criterion, which took the variance explained by the three components suggested in the previous analysis. The results of the first oblique rotation are summarized in Table 8.
Then, after three rotations, the items with comparable scores in more than one dimension were removed, affecting the total variance explained. Table 9 shows the final findings of the rotated components, which exclude items 1 and 3.
The final version of the instrument was created based on the results collected. Two questions (Q01 and Q03), as well as two categories (information organization and teamwork), were removed. The Planning category was moved to the KCT dimension. The last 11 topics were divided into three categories: Component 1 (Open Learning), which included six questions; Component 2 (Information Management), which included two questions; and Component 3 (Knowledge Creation and Transfer), which included three questions.
The reliability analysis of the instrument yielded a Cronbach’s alpha coefficient = 0.92, which is considered very good according to Landero and González [38]. The analysis for each component was as follows: IM component α = 0.87; KCT component α = 0.79; and OL component α = 0.90. The final version of the questionnaire contains 14 questions, 11 of which correspond to a seven-level scale, and one to the scale: Yes/No (but I know it)/I do not know it; one corresponds to the frequency: Every day, two hours or more/Every day less than two hours/A few times a week/A few times a month/Never; and one question has answers of the type I learned: alone (a)/with my teachers/with my family/with my friends/I do not know how to do this.
The final structure of the B-PLE instrument with three validated components, which explain 72% of the total variance, is presented in Table 10.
In terms of component correlations, a weak positive correlation was found between IM and KCT (rs = 0.48, p < 0.001) and a moderate positive correlation between IM and OL (rs = 0.57, p < 0.001) and KCT and OL (rs = 0.60, p < 0.001).

3.2. Confirmatory Factor Analysis

A Confirmatory Factor Analysis (CFA) was performed to validate the results of the psychometric properties obtained from the principal components analysis. This technique is considered a type of structural equation modeling (SEM). Its purpose is to analyze the structure and conformation of items and indicators of a previously hypothesized latent variable [39] and to represent their relationships with observed or indicator variables [33,34], to confirm that all questions fit the proposed model [27,35].
In the CFA, subjects’ scores on each item are due to an unobserved variable (or latent factor), which explains the variability of scores on each item. It is likely that the latent factor does not fully explain the variability of responses on each item; this unexplained situation is known as measurement error [40]. The CFA was carried out in three stages: (i) proposal of the measurement model; (ii) analysis of indices and goodness-of-fit criteria of the model; and (iii) re-specifying the model.
Stage 1. Measurement model proposal
According to the results obtained in the principal component analysis, the proposed model is composed of 11 observed variables, grouped into 3 latent variables: IM, with two questions; KCT, with three questions; and OL, with six questions (see Table 10).
Stage 2. Analysis of the indexes and goodness-of-fit criteria of the model
In this stage, the structural equation modeling methodology was used, implemented in the lavaan package of the R Studio statistical software. This package is used to analyze multivariate statistical models, CFA, structural equation models, and growth curve models [41].
The procedure consists of analyzing the covariance structure to confirm that the measurement model matches the proposed model structure by comparing two covariance structures: the covariance matrix was obtained from the observed variables and the covariance matrix that the model reproduces [42].
To load the model, the notation presented in Table 11 should be considered:
The proposed model can be represented in the statistical software R Studio with the following notation:
Model1 <-’IM =~ Q03 + Q04
KCT =~ Q01 + Q02 + Q07
OL =~ Q05 + Q06 + Q08 + Q09 + Q09 + Q10 + Q11’.
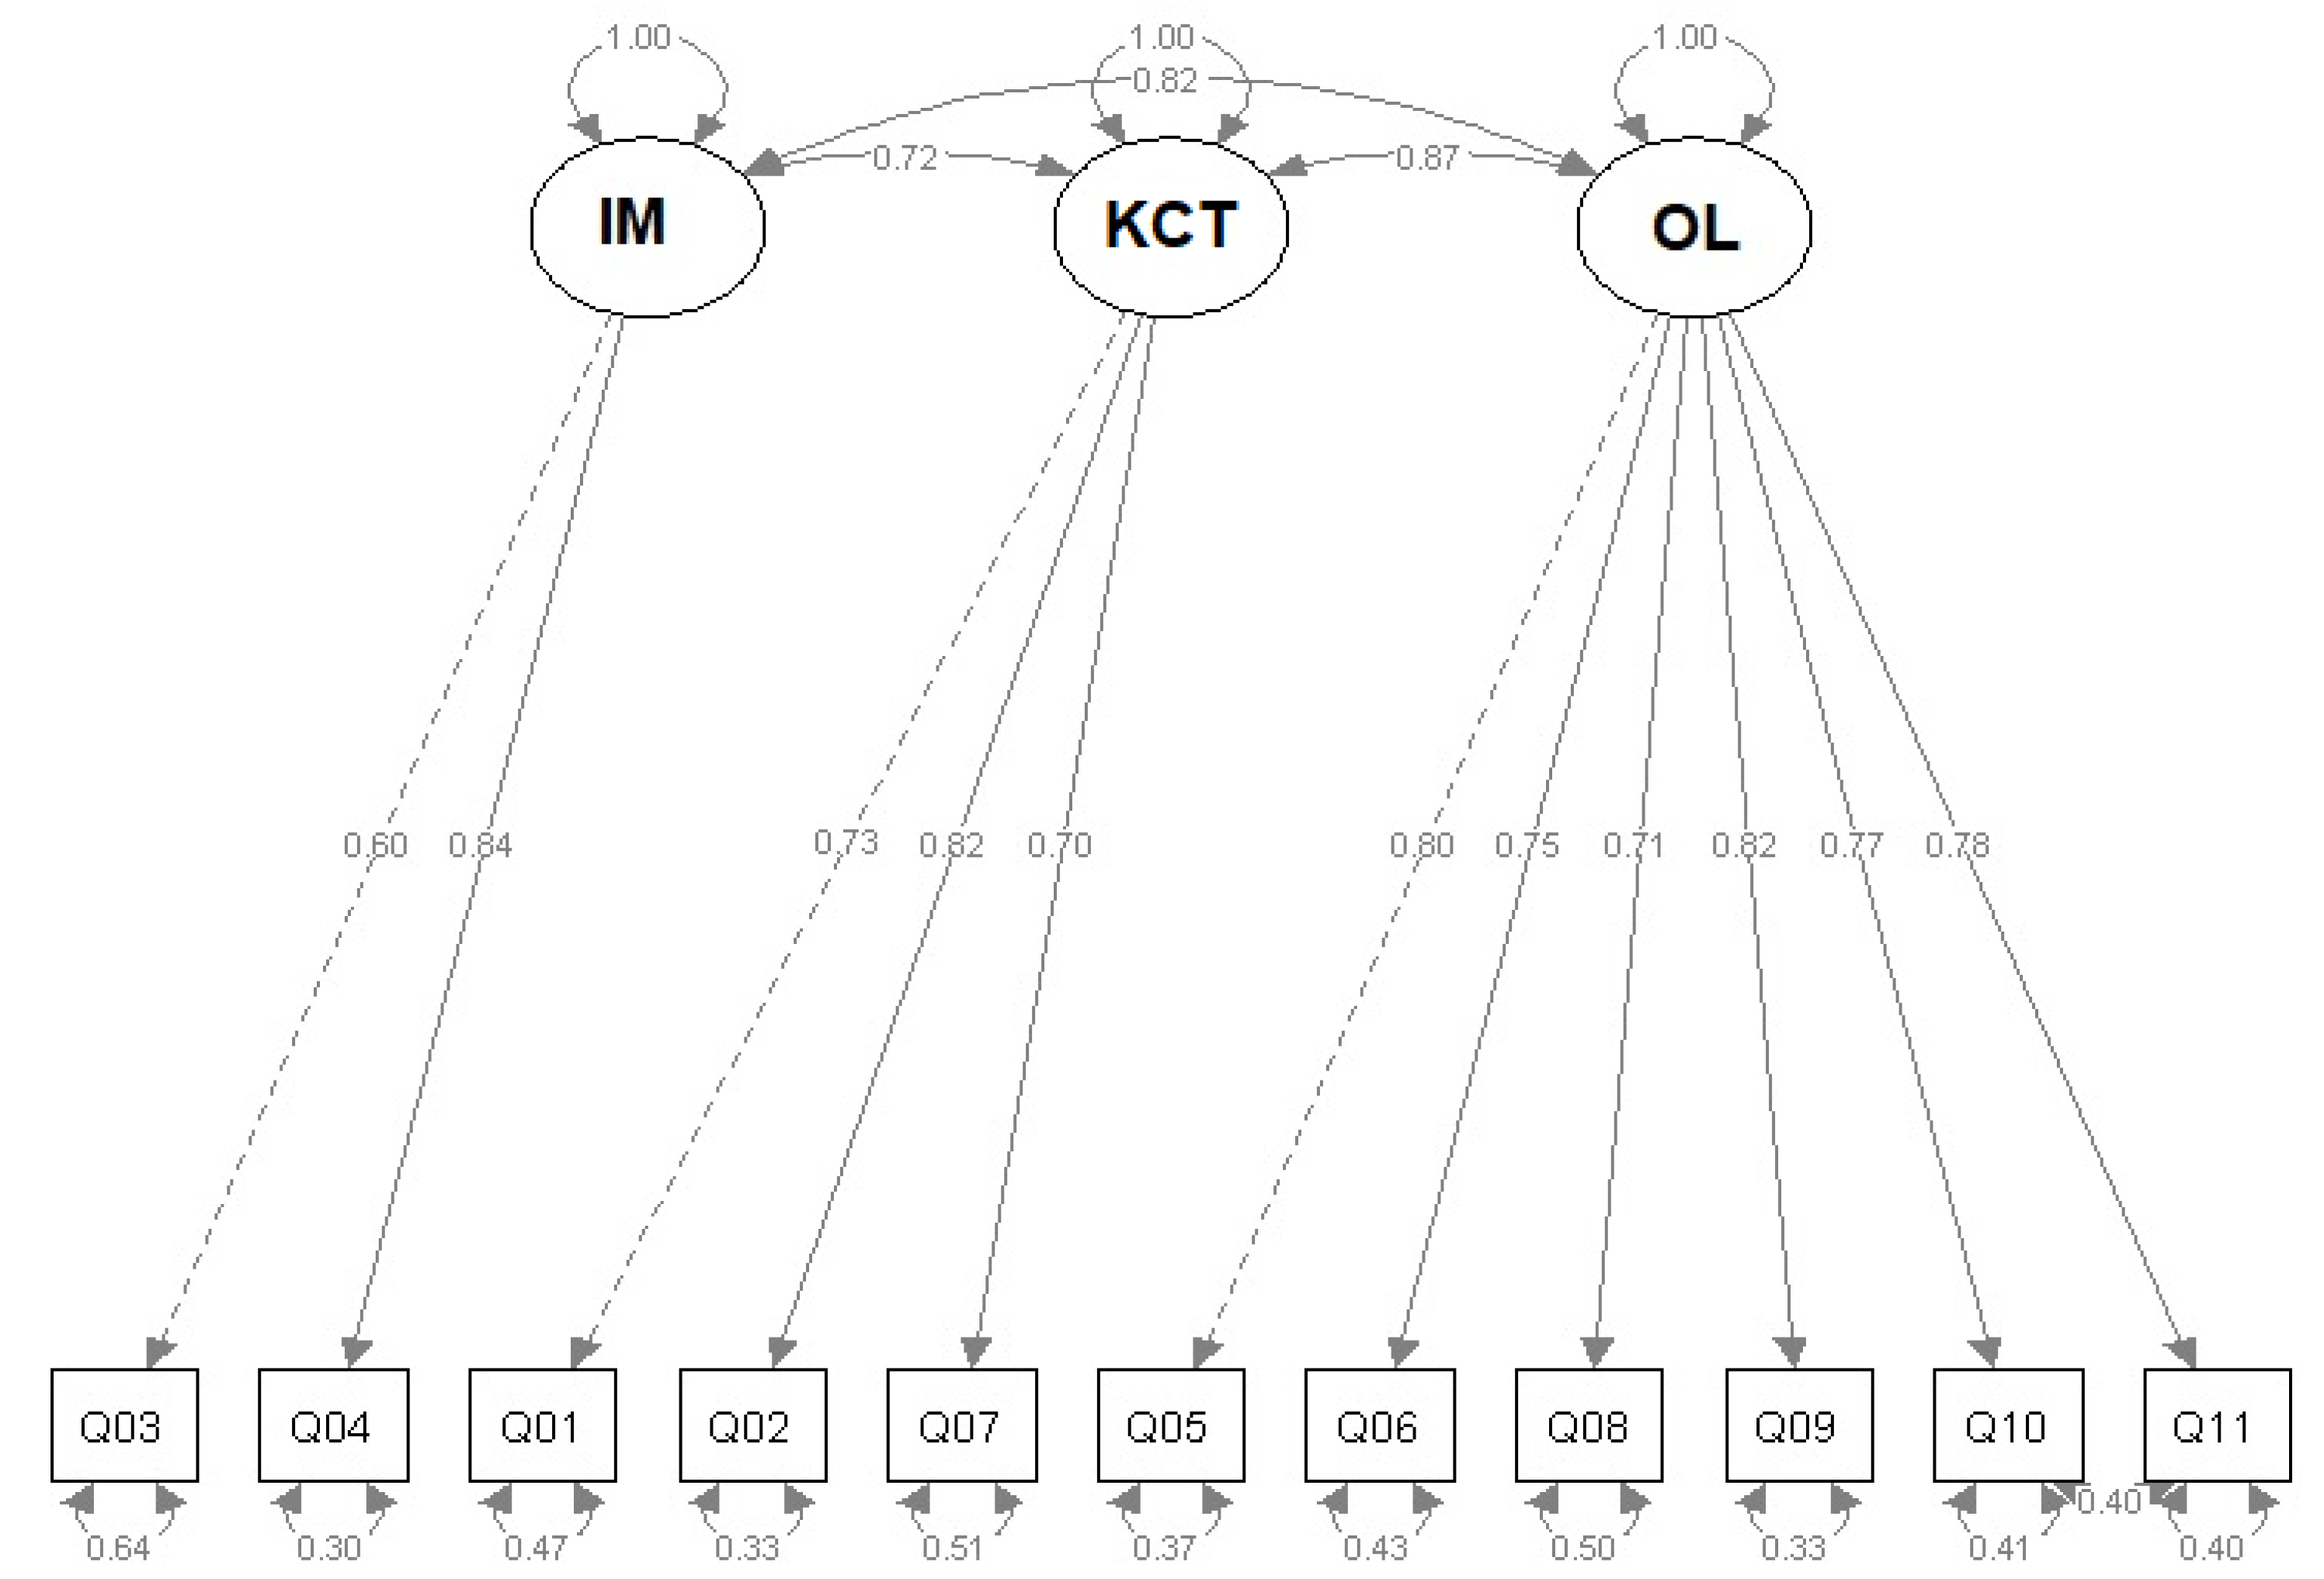
By complementing the lavaan package with the semPlot package, it is possible to graphically represent the proposed conceptual structure, as shown in Figure 2. The ovals represent the three latent variables (or constructs), and the squares represent the 11 observed variables, which together make up the dimensionality of the instrument. The bidirectional arrows represent covariances between the latent variables. The latent variables’ influence on observable variables is represented by the unidirectional arrows.
To analyze the model fit, there are different indices and criteria. The first goodness-of-fit index is the χ2 (Chi-square) statistic, which is proposed to represent the point of best fit or the minimum discrepancy between the compared matrices [43]. With this index, the overall fit of the measurement model is evaluated. The model has an acceptable fit if the Chi-square/gl values are 2 to 3 and with limits up to 5 [35]. This statistic is very sensitive when used in samples with more than two hundred subjects. In these cases, it is suggested to omit the χ2 interpretation and evaluate the model fit with other goodness-of-fit indices [34,42,44,45], which are explained below.
The Comparative Fit Index (CFI), developed by Bentler [46], compares the χ2 discrepancies between an independent model that maintains that there is no relationship between the variables in the model and the model proposed by the researcher [40]. CFI values range from 0 to 1. If the CFI value is greater than 0.90, it is considered a reasonable fit between the model and the data [42]. The unnormalized fit index (NNFI), also known as Tucker–Lewis index (TLI), considers the complexity of the model by comparing the degrees of freedom of the independent model with those of the proposed model. TLI values vary between 0 and 1. Values greater than 0.9 are considered as a good model fit. Values greater than 1 indicate an overparameterization of the model [34]. The root mean squared error of approximation (RMSEA) refers to the amount of variance not explained by the model per degree of freedom [40]. It is interpreted as the absolute measure of the difference between the relationship structures between the proposed model and the covariances in the measured population [47]. When the RMSEA presents values less than 0.10, it is considered a reasonable fit between the measurement model and the structure of the data. If the RMSEA is less than 0.05, the fit is superior; if the RMSEA value is less than 0.01, the fit is outstanding [42]. Another index used is the RMSR, which analyzes the absolute measure of the differences between the elements of the covariance matrix reproduced by the model and the covariance matrix derived from the observed sample data. It is interpreted in its standardized version, known as SRMR. If this value is less than 0.05, it is considered a reasonable model fit [42]. The summary of the indicators analyzed is presented in Table 12.
In addition to the indicators analyzed, Herrero [40] suggests that it is necessary to consider the standardized variances and covariances, to corroborate that there is no negative variance (Heywood cases) and that none of the correlations between the variables of the model exceeds ±1. If this happens, the results of the model are invalidated, because it offers a solution that is not possible (negative variance or correlation exceeding ±1).
The inspection of the goodness-of-fit indicators associated with the proposed model is presented in Table 13.
As can be seen, the proposed model complies with the minimum parameters suggested in each goodness-of-fit index, except for the χ2 indicator, which, in the case of samples with more than 200 subjects, it is suggested to omit.
Stage 3. Re-specifying the model
Although the indicators are acceptable, it is possible to analyze the relationships of the original proposed model and evaluate whether it is possible to improve them by reviewing the modification indexes option. Table 14 presents some of the values of the output obtained with the modindices function, available in the lavaan package. Each row indicates the amount by which the χ2 value would decrease if any of the proposed relationships were included. For example, the first row (Q10~~Q11) suggests that there would be a 42-point change in the χ2 value (the current value is 172.893). The two questions pertain to the same latent variable. The difference between the two is that the context changes. Q10 refers to activities with ICT use in class period, while Q11 refers to activities with ICT use outside class time. This could be one of the reasons why this correlation in measurement errors between the two variables is suggested.
The new evaluation model would be as follows:
Model2 <-’IM =~ Q03 + Q04
KCT =~ Q01 + Q02 + Q07
OL =~ Q05 + Q06 + Q08 + Q09 + Q10 + Q11
# Error correlation
Q10 ~~ Q11’
With the re-specification of the model, a modification index was obtained that reduced the χ2 value by 42 points, improving the rest of the global goodness-of-fit indexes of the empirical model, complying (as with model 1) with four of the five proposed indicators. The comparison of the goodness-of-fit indicators associated with the two models is presented in Table 15.
In Figure 3, the graphical representation of model 2 is presented. Some changes in the values of the regression coefficients are observed, compared to model 1 (see Figure 2); and a covariance relationship of 0.40 emerges between the error terms of variables Q10 and Q11. This implies that both observed variables share an alternative source of variance, different from the latent variables of model 2 [42].
The regression coefficients are understood as follows. The first two values from left to right (0.60 and 0.84) are interpreted as the influence of the latent variable IM on the observed variables Q03 and Q04. This implies that when the latent variable increases by one unit, Q03 (Digital identity) and Q04 (Information seeking) increase by proportions of 0.6 and 0.84, respectively. For the rest of the latent variables the same analysis is followed. When the latent variable KCT increases by one unit, the observed variables Q01 (Knowledge construction), Q02 (Information processing), and Q07 (Planning) increase in proportions of 0.73, 0.82, and 0.70, respectively. Finally, when the latent variable OL increases by one unit, the observed variables Q08, Q10, and Q11 (linked to the category Open-ended Learning) increase by 0.71, 0.77, and 0.78, respectively, while the observed variables Q06 (Knowledge transfer), Q05, and Q09 (linked to the Motivation category) increase by 0.75, 0.80, and 0.82 respectively, when the latent variable OL increases by one unit.
To confirm the accuracy of the results, the coefficient omega, a reliability estimator used in multidimensional factorial models [48,49,50], was calculated [51]. This indicator is suggested because of its higher sensitivity compared to other estimators [52], its resistance to sampling in heterogeneous populations, and the reduced risk of overestimation of reliability [50,53].
Using the MBESS library and the ci.reliability function of the statistical software R Studio, the result shown in Table 16 is obtained.
According to the results obtained for the coefficient, the instrument has an internal consistency of 0.91; additionally, according to the level of confidence, there is a 95 percent chance that the true value of omega is found in the interval (0.893, 0.934).
To be considered an acceptable level of confidence, the omega coefficient must be between 0.70 and 0.90 [51,54,55].

4. Conclusions

As a result of technological disruption, the incorporation of the virtual dimension into human activities is causing a cultural transition, characterized by a new generation of citizens who grow up in both physical and virtual environments, which some authors refer to as the space of flows [56] or a resonant interval [57]. The two-dimensional citizens of the cultural transition are facing an unprecedented moment in human history: they are working so that machines tend to think better than they do, making the differences between mind and consciousness increasingly blurred [58]. Perhaps it is the journey of no return to what Kurzweil [59] enunciated as a technological singularity, whose ontological foundations lie in transhumanism [60,61].
These trends create new needs, that require the redefinition of roles and new scenarios in higher education in order to address the human formation of two-dimensional citizens who are already transcending the traditional modern classroom’s time and space constraints by actively incorporating cyberspace into more autonomous and self-regulated learning processes.
In this regard, several studies have related the use of ICTs with improvements in student learning and performance, showing that favorable attitudes towards the use of ICTs can influence the development of their PLEs, to build ecosystems that allow them to develop in physical and virtual scenarios, being able to self-regulate in formal and informal environments throughout their lives [62,63,64,65,66,67].
The validation process of an instrument (B-PLE) for the study of PLE in higher education students in the Biobío region of Chile was detailed in this context. A PLE is a frame of reference that can help to understand how the two-dimensional citizen is able to influence and be influenced by social systems, natural and artificial, in which he or she is required to fulfill needs as a subject…singular needs on a local scale and global needs as a member of a global culture [7,68]. Knowing more about students’ PLE will enable educators to design training paths that are tailored to their needs, including open learning, information management, and knowledge generation and transfer [69,70], stimulating their self-regulated learning in formal and informal environments throughout their lives [65,71], so that they are able to cope in uncertain work and social scenarios, as a result of technological disruption.
Regarding the B-PLE instrument, as a result of a meticulous design and validation process, a final version was obtained consisting of 11 questions grouped into three principal components (OL, IM, KCT) that explain 72% of the total variance. Expert judgment, a pilot sample, a principle components analysis, and a confirmatory factor analysis were all used in the validation process. Two psychometric tests were used to determine the primary components: The p value of 0.0001 (significant) was obtained using Bartlett’s sphericity test (to guarantee that the correlation matrix is not the same as the inverse or identity matrix). The total alpha of the instrument was = 0.92. Five goodness-of-fit indices were employed to assess the suggested model’s fit: χ2 (Chi-square), RMSEA, CFI, TLI, and SRMR. Except in the case of χ2, the findings were favorable, as four suitable values could be obtained in the indices described.
Despite the international importance of the PLE concept, little research on the characteristics and perceptions of students in their personal learning environments has been conducted in Chile and Latin America [22,70,72]. We anticipate that by publishing this work we will be able to contribute with an instrument that can be used by other researchers in various settings to validate the final components linked with the PLE presented in this preliminary line of research and to investigate the findings in greater depth.
Finally, another component of this study is the prospect of undertaking research that will help to rebuild the notion of PLE in the Chilean and Latin American context by incorporating the possibilities afforded by artificial intelligence and Web 4.0.

5. Limitations

It is possible that running a PCA plus a CFA will result in the factors being overfitted [73,74]. The factor structure discovered should be replicated in future investigations. Furthermore, the ability to acquire fresh data will enable the creation of a nomological network to test the new scale with theoretically related constructs like learning success.

Author Contributions

Conceptualization, J.L.C.-S. and M.C.B.; data curation, J.L.C.-S.; formal analysis, J.L.C.-S.; methodology, J.L.C.-S.; supervision, M.C.B.; validation, J.L.C.-S., M.G.B.-Q., and J.M.-F.; visualization, J.M.-F.; writing—original draft, J.L.C.-S.; writing—review & editing, M.C.B., M.G.B.-Q. and J.M.-F. All authors have read and agreed to the published version of the manuscript.

Funding

This research received no external funding.

Institutional Review Board Statement

The study was conducted according to the guidelines of the Declaration of Helsinki, and approved by the Ethics Committee of Universidad Católica de la Santísima Concepción (19 August 2019).

Informed Consent Statement

Informed consent was obtained from all subjects involved in the study.

Data Availability Statement

The data presented in this study are available on request from the corresponding author. The data are not publicly available due to privacy issues.

Acknowledgments

This work has been carried out thanks to the support of the National Agency for Research and Development, ANID, Ministry of Science and Technology, Chile, through the Doctoral Scholarship (Beca Nacional de Doctorado), BECAS CHILE, awarded to José Luis Carrasco-Sáez [No. 21171389].

Conflicts of Interest

The authors declare no conflict of interest.

References

  1. Capra, F. La Trama de la Vida. Una Nueva Perspectiva de los Sistemas Vivos, 2nd ed.; Editorial Anagrama: Barcelona, Spain, 1999. [Google Scholar]
  2. Lyotard, J.-F. La Condición Postmoderna, 7th ed.; Ediciones Cátedra: Madrid, Spain, 2000. [Google Scholar]
  3. Habermas, J. El Discurso Filosófico de la Modernidad; Editorial Katz: Madrid, Spain, 2008. [Google Scholar]
  4. Morin, E. La vía Para el Futuro de la Humanidad; Editorial Paidós: Madrid, Spain, 2011. [Google Scholar]
  5. Careaga, M.; Avendaño, A. Currículum Cibernético y Gestión del Conocimiento. In Fundamentos y Modelos de Referencia; RIL Editores; Editorial UCSC: Santiago, Chile, 2017; ISBN 978-956-01-0397-0. [Google Scholar]
  6. Carrasco-Sáez, J.L.; Careaga, M.; Badilla-Quintana, M.G.; Jiménez, L.; Molina, J. Sociological Importance and Validation of a Questionnaire for the Sustainability of Personal Learning Environments (PLE) in 8th Grade Students of the Biobío Region in Chile. Sustainability 2019, 11, 1301. [Google Scholar] [CrossRef] [Green Version]
  7. Carrasco-Sáez, J.L. Modelo Pedagógico Bidimensional para Potenciar el Aprendizaje Autorregulado en Estudiantes de Educación Superior de la Octava Región, Chile. Ph.D. Thesis, Universidad Católica de la Santísima Concepción, Concepción, Chile, 2020. [Google Scholar]
  8. Morin, E. La Epistemología de la Complejidad. En Gazeta de Antropología, 2004, No. 20, Article 2. Available online: https://digibug.ugr.es/bitstream/handle/10481/7253/G20_02Edgar_Morin.pdf?sequence=10&isAllowed=y (accessed on 19 August 2020).
  9. Aguado-Aguilar, L. Aprendizaje y Memoria. Rev. Neurol. 2001, 32, 373–381. Available online: https://moodle2.unid.edu.mx/dts_cursos_mdl/lic/ED/TA/AM/02/Aprendizaje_y_memoria.pdf (accessed on 19 August 2020). [PubMed]
  10. Siemens, G. Connectivism: A learning theory for the digital age. Int. J. Instruct. Technol. Distance Learn. 2005, 2, 3–10. Available online: http://www.itdl.org/Journal/Jan_05/article01.htm (accessed on 19 August 2020).
  11. Bartolomé, A. Conectivismo: Aprender em Rede e na Rede. En Marcelo Brito Carneiro Leão: Tecnologias na Educaçao: Uma Abordagem Crítica para Uma Atuaçao Práctica; UFRPE: Recife, Brazil, 2011; pp. 71–86. Available online: https://www.researchgate.net/publication/255937655_Conectivismo_aprender_em_rede_e_na_rede (accessed on 18 September 2020).
  12. Igelmo, J.; Laudo, X. Las teorías de la desescolarización y su continuidad en la pedagogía líquida del siglo XXI. Educ. XXI Fac. Educ. UNED 2014, 20, 37–56. [Google Scholar]
  13. Fadel, C.H.; Bialik, N.; Trilling, B. Four-Dimensional Education: The Competencies Learners Need to Succeed; Center for Curriculum Redesign: Boston, MA, USA, 2015. [Google Scholar]
  14. OCDE. Future of work and skills. In Proceedings of the 2nd Meeting of the G20 Employment Working Group, Hamburg, Germany, 15–17 February 2017; Available online: http://bcn.cl/28mxu (accessed on 25 September 2020).
  15. Brown, S. From VLEs to learning webs: The implications of Web 2.0 for learning and teaching. Interact. Learn. Environ. 2010, 18, 1–10. [Google Scholar] [CrossRef]
  16. Cabero, J.; Barroso, J.; Llorente, M.C.Y. E-actividades para la formación del profesorado en tecnologías de la información y comunicación en el proyecto DIPRO 2.0. Pixel-Bit Rev. Medios Educ. 2014, 47, 233–234. [Google Scholar]
  17. Castañeda, L.; Adell, J. La anatomía de los PLEs. In Entornos Personales de Aprendizaje: Claves Para el Ecosistema Educativo en Red; Castañeda, E.L., Adell, J., Eds.; Marfil: Alcoy, Spain, 2013; pp. 11–27. [Google Scholar]
  18. Gallego-Arrufat, M.-J.; Chaves-Barboza, E. Tendencias en estudios sobre Entornos Personales de Aprendizaje (Personal Learning Environments -PLE-). Edutec. Rev. Electrón. Tecnol. Educ. 2014, 281, a281. [Google Scholar] [CrossRef]
  19. Prendes-Espinosa, M.P.; Castañeda-Quintero, L.; Solano-Fernández, I.; Roig-Vila, R.; Aguiar-Perera, M.; Serrano-Sánchez, J.L. Validación de un cuestionario sobre hábitos de trabajo y aprendizaje para futuros profesionales: Explorar los Entornos Personales de Aprendizaje. Relieve 2016, 22. [Google Scholar] [CrossRef] [Green Version]
  20. Meza, J.; Morales, M.; Flores, R. Variables individuales relacionadas con la instrucción en el uso de entornos personales de aprendizaje. Educación 2016, 25, 87–106. [Google Scholar] [CrossRef] [Green Version]
  21. García, L.; Bona, Y. Ambientes colectivos de aprendizaje: Una propuesta para repensar la literatura sobre los Personal Learning Environments. In Futuro de los Sistemas y Ambientes Educativos Mediados por las TIC; En Giraldo Ramírez, M.E., Sánchez Arias, V.C., Paquienséguy, F., Zapata Ros, M., García Ruvalcaba, L.G., Bona Beauvois, Y.P., Chan Núñez, M.E., Eds.; Universidad de Guadalajara, Sistema de Universidad Virtual: Guadalajara, Mexico, 2017; Available online: http://148.202.167.116:8080/jspui/bitstream/123456789/1833/1/Futuro%20de%20los%20sistemas%20y%20ambientes%20educativos%20mediados%20por%20las%20TIC.pdf (accessed on 10 October 2020).
  22. Badilla, M.; Carrasco, J.; Prats, M. Use of PLEPortfolio to Assess the Competency-Based Learning through Web 2.0 in Technical Engineering Education. Int. J. Eng. Educ. 2014, 30, 675–682. [Google Scholar]
  23. Ministerio de Educación de Chile (MINEDUC). Informe de Resultados SIMCE TIC Segundo año Medio; Centro de Educación y Tecnologías Enlaces: Santiago, Chile, 2013. [Google Scholar]
  24. Kerlinger, F.; Lee, H. Investigación del Comportamiento: Métodos de Investigación en Ciencias Sociales, 4th ed.; McGraw-Hill: Ciudad de Mexico, Mexico, 2002. [Google Scholar]
  25. Hernández, R.; Fernández, C.; Baptista, P. Metodología de la Investigación; McGraw-Hill: Ciudad de Mexico, Mexico, 2004. [Google Scholar]
  26. McMillan, J.; Schumacher, S. Investigación Educativa, 5th ed.; Pearson Educación: Madrid, Spain, 2005. [Google Scholar]
  27. Lloret-Segura, S.; Ferreres-Traver, A.; Hernández-Baeza, A.; Tomás-Marco, I. El Análisis Factorial Exploratorio de los Ítems: Una Guía Práctica, Revisada y Actualizada. An. Psicol. 2014, 30, 1151–1169. Available online: https://revistas.um.es/analesps/article/view/analesps.30.3.199361 (accessed on 17 August 2020). [CrossRef]
  28. Gorsuch, R.L. Factor Analysis, 2nd ed.; Erlbaum: Hillsdale, NJ, USA, 1983. [Google Scholar]
  29. Velicer, W.F.; Fava, J.L. Effects of variable and subject sampling on factor pattern recovery. Psychol. Methods 1998, 3, 231–251. [Google Scholar] [CrossRef]
  30. Field, A.; Miles, J.; Field, Z. Discovering Statistics Using R; SAGE Publications: Thousand Oaks, CA, USA, 2012. [Google Scholar]
  31. Crocker, L.; Algina, J. Introduction to Classical and Modern Test Theory; Holt, Rinehart and Winston: New York, NY, USA, 1986. [Google Scholar]
  32. Best, J.; Kahn, J. Research in Education; Pearson: Boston, MA, USA, 2006. [Google Scholar]
  33. Bollen, K.A. Structural Equations with Latent Variables; John Wiley & Sons: New York, NY, USA, 1989. [Google Scholar]
  34. Lara, A. Introducción a las Ecuaciones Estructurales en AMOS y R; Universidad de Granada: Granada, Spain, 2014; Available online: http://masteres.ugr.es/moea/pages/curso201314/tfm1314/tfm-septiembre1314/%20memoriamasterlarahormigoantonio/ (accessed on 29 March 2020).
  35. Hair, J.; Anderson, R.; Tatham, R.; Black, W. Análisis Multivariante, 5th ed.; Prentice-Hall: Madrid, Spain, 1999. [Google Scholar]
  36. Flora, D.; Curran, P. An empirical evaluation of alternative methods of estimation for confirmatory factor analysis with ordinal data. Psychol. Methods 2004, 12, 406–491. [Google Scholar] [CrossRef] [Green Version]
  37. Curran, P.; Bauer, D. Building path diagrams for multilevel models. Psychol. Methods 2007, 12, 283–297. [Google Scholar] [CrossRef] [PubMed] [Green Version]
  38. Landeros, R.; González, M. Estadística con SPSS y Metodología de la Investigación; Universidad Autónoma de San Luis Potosí: San Luis Potosi, Mexico, 2006. [Google Scholar]
  39. Brown, T.A. Confirmatory Factor Analysis for Applied Research, 2nd ed.; The Guilford Press: London, UK, 2015. [Google Scholar]
  40. Herrero, J. El Análisis Factorial Confirmatorio en el estudio de la Estructura y Estabilidad de los Instrumentos de Evaluación: Un ejemplo con el Cuestionario de Autoestima CA-14. Intervención Psicosocial 2010, 19, 289–300. [Google Scholar] [CrossRef]
  41. Rosseel, Y. Lavaan: An R Package for Structural Equation Modeling. J. Stat. Softw. 2012, 48, 1–36. Available online: http://www.jstatsoft.org/v48/i02/ (accessed on 29 July 2020). [CrossRef] [Green Version]
  42. González-Montesinos, M.-J.; Backhoff, E. Validación de un cuestionario de contexto para evaluar sistemas educativos con Modelos de Ecuaciones Estructurales. Relieve 2020, 16, 1–17. Available online: http://www.uv.es/RELIEVE/v16n2/RELIEVEv16n2_1.htm (accessed on 2 September 2020). [CrossRef] [Green Version]
  43. Blalock, H.M. Causal Inference in Non-Experimental Research; University of North Carolina Press: Chapel Hill, NC, USA, 1964. [Google Scholar]
  44. Wheaton, B.; Muthen, B.; Alwin, D.F.; Summers, G. Assessing Reliability and Stability in Panel Models. Sociol. Methodol. 1977, 8, 84–136. Available online: https://www.jstor.org/stable/270754?origin=crossref&seq=1 (accessed on 1 December 2020). [CrossRef]
  45. Fujikoshi, Y. Transformations with Improved Chi-Squared Approximations. J. Multivar. Anal. 2000, 72, 249–263. [Google Scholar] [CrossRef] [Green Version]
  46. Bentler, P. Comparative fix indexes in structural models. Psychol. Bull. 1990, 107, 238–246. [Google Scholar] [CrossRef]
  47. Steiger, J.H. Structural model evaluation and modification: An interval estimation approach. Multivariate Behav. Res. 1990, 25, 173–180. [Google Scholar] [CrossRef] [Green Version]
  48. Rodríguez, A.; Reise, S.P.; Haviland, M.G. Evaluating bifactor models: Calculating and interpreting statistical indices. Psychol. Methods 2016, 21, 137–150. [Google Scholar] [CrossRef]
  49. Ventura-León, J.L.; Caycho, T. El coeficiente omega: Un método alternativo para la estimación de la fiabilidad (carta al Editor). Revista Latinoamérica Ciencias Sociales Niñez Juventud 2017, 15, 625–627. [Google Scholar]
  50. Flora, D.B. Your Coefficient Alpha Is Probably Wrong, but Which Coefficient Omega Is Right? A Tutorial on Using R to Obtain Better Reliability Estimates. Adv. Methods Prac. Psychol. Sci. 2020, 484–501. [Google Scholar] [CrossRef]
  51. McDonald, R.P. Test Theory: A Unified Treatment; Lawrence Erlbaum Associates, Inc.: Mahwah, NJ, USA, 1999. [Google Scholar]
  52. Zinbarg, R.; Revelle, W.; Yovel, I.; Li, W. Cronbach’s, Revelle’s, and Mcdonald’s: Their relations with each other and two alternative conceptualizations of reliability. Psychometrika 2005, 70, 123–133. [Google Scholar] [CrossRef]
  53. Waller, N.G. Commingled samples: A neglected source of bias in reliability analysis. Appl. Psychol. Meas. 2008, 32, 211–223. [Google Scholar] [CrossRef]
  54. Katz, M.H. Multivariable Analysis, 2nd ed.; Cambridge University Press: Cambridge, UK, 2006. [Google Scholar]
  55. Campo-Arias, A.; Oviedo, H.C. Propiedades psicométricas de una escala: La consistencia interna. Rev. Salud Pública 2008, 10, 831–839. [Google Scholar] [CrossRef] [PubMed] [Green Version]
  56. Castells, M. La era de la información. In Economía, Sociedad y Cultura; Blackwell Inc.: St. Louis, MO, USA, 1996; Volume 1, Available online: http://herzog.economia.unam.mx/lecturas/inae3/castellsm.pdf (accessed on 1 March 2020).
  57. Mcluhan, M.; Powers, B. La aldea global. In Transformaciones en la Vida y los Medios de Comunicación en el Siglo XXI; Editorial Gedisa: Barcelona, Spain, 1989; Available online: https://www.amazon.com/aldea-global-village-Transformaciones-globalizacion/dp/8474324033 (accessed on 30 March 2020).
  58. Penrose, R. The Emperor’s New Mind: Concerning Computers, Minds, and the Laws of Physics; Oxford University Press: Oxford, UK, 1989; ISBN 0-19-851973-7. [Google Scholar]
  59. Kurzweil, R. La Singularidad está Cerca. Cuando los Humanos Trascendamos la Biología; Cimpapres: Barcelona, Spain, 2005. [Google Scholar]
  60. Ferry, L. La Revolución Transhumanista: Cómo la Tecnomedicina y la Uberización del Mundo Van a Transformar Nuestras Vidas; Alianza Editorial: Madrid, Spain, 2017. [Google Scholar]
  61. Kaku, M. El Futuro de la Humanidad; Editorial Penguin Random House: Madrid, Spain, 2018. [Google Scholar]
  62. García-Martínez, J.-A.; Fuentes-Abeledo, E.-J.; Rodríguez-Machado, E.-R. Attitudes towards the Use of ICT in Costa Rican University Students: The Influence of Sex, Academic Performance, and Training in Technology. Sustainability 2021, 13, 282. [Google Scholar] [CrossRef]
  63. Martínez, J.A.G.; Rosa-Napal, F.-C.; Romero-Tabeayo, I.; López-Calvo, S.; Fuentes-Abeledo, E.-J. Digital Tools and Personal Learning Environments: An Analysis in Higher Education. Sustainability 2020, 12, 8180. [Google Scholar] [CrossRef]
  64. Benítez, L.M.; Sevillano, M.L.; Vásquez, E. Effects on academic performance in secondary students according to the use of ICT. IJER 2019, 12, 90–108. [Google Scholar]
  65. Fiedler, S.H.D.; Väljataga, T. Modeling the personal adult learner: The concept of PLE re-interpreted. Interact. Learn. Environ. 2020, 28, 658–670. [Google Scholar] [CrossRef]
  66. Demirel, M.; Akkoyunlu, B. Prospective Teachers’ Lifelong Learning Tendencies and Information Literacy Self-Efficacy. Educ. Res. Rev. 2017, 12, 329–337. [Google Scholar]
  67. Seijas, E.J.; Val, J.C.; Cadavid, M.A.M.; Antelo, B.G. La formación del profesorado universitario en competencias lifelong learning a partir de las demandas de empleadores y egresados. Rev. Investig. Educ. 2015, 34, 69. [Google Scholar] [CrossRef] [Green Version]
  68. Carrasco-Sáez, J.; Careaga, M.; Badilla-Quintana, M. The New Pyramid of Needs for the Digital Citizen: A Transition Towards Smart Human Cities. Sustainability 2017, 9, 2258. [Google Scholar] [CrossRef] [Green Version]
  69. Gusc, J.; Heijes, C. Oh This Learning, what a Thing It Is!”—Putting Sustainability First in Teaching Techniques and in Content. Sustainability 2018, 10, 2803. [Google Scholar] [CrossRef] [Green Version]
  70. Cabero, J. El Aprendizaje Autorregulado Como Marco Teórico Para la Aplicación Educativa de las Comunidades Educativas y Virtuales y los Entornos Personales de Aprendizaje. Rev. Teoría Educ. Educ. Cult. Soc. Inf. 2013, 14, 133–156. Available online: http://revistas.usal.es/index.php/eks/article/view/10217/10626 (accessed on 12 November 2020).
  71. Dabbagh, N.; Castaneda, L. The PLE as a framework for developing agency in lifelong learning. Educ. Technol. Res. Dev. 2020, 68, 1–15. [Google Scholar] [CrossRef]
  72. Rosário, P.; Pereira, A.; Högemann, J.; Nunes, A.R.; Figueiredo, M.; Núñez, J.C.; Fuentes, S.; Gaeta, M.L. Autorregulación del aprendizaje: Una revisión sistemática en revistas de la base SciELO. Univ. Psychol. 2014, 13, 781–798. [Google Scholar] [CrossRef] [Green Version]
  73. Fokkema, M.; Greiff, S. How Performing PCA and CFA on the Same Data Equals Trouble. Eur. J. Psychol. Assess. 2017, 33, 399–402. [Google Scholar] [CrossRef]
  74. Horn, J.L. A rationale and test for the number of factors in factor analysis. Psychometrika 1965, 30, 179–185. [Google Scholar] [CrossRef]
Figure 1. Scaffolding between systems, interactions, language, knowledge, and learning. Reprinted with permission from ref. [7]. 2020, UCSC.
Sustainability 13 08736 g001
Figure 2. Graphical representation of the proposed model, using lavaan and semPlot.
Sustainability 13 08736 g002
Figure 3. Graphical representation of model 2, using lavaan and semPlot.
Sustainability 13 08736 g003
Table 1. Loops emerging from the systems (social, natural, and artificial). Reprinted with permission from ref. [7]. 2020, UCSC.
LoopDescription
L1Systems-interaction-knowledge
L2Systems-interaction-knowledge-language
L3Systems-interaction-knowledge-language-systems
L4Systems-interaction-knowledge-interaction-language-learning
L5Systems-interaction-knowledge-interaction-knowledge-interaction-learning-language-knowledge
L6Systems-interaction-knowledge-interaction-interaction-learning-learning-language-systems
L7Systems-interaction-knowledge-interaction-learning-interaction-learning-language-language-language-interaction-learning-language-language-systems-interaction-knowledge
Table 2. Loops emerging from knowledge. Reprinted with permission from ref. [7]. 2020, UCSC.
LoopDescription
L1Knowledge-interaction-learning-learning
L2Knowledge-interaction-learning-learning-language-knowledge
L3Knowledge-interaction-learning-learning-language-systems-knowledge
L4Knowledge-interaction-learning-learning-language-language-systems-interaction-knowledge
L5Knowledge-interaction-learning-learning-language-systems-interaction-knowledge-interaction-learning-language-systems-interaction-knowledge-interaction-learning-language-knowledge
Table 3. Dimensions, categories, and questions of the B-PLE instrument’s initial version. Reprinted with permission from ref. [7]. 2020, UCSC.
DimensionCategoriesQuestions
Open learning (OL)Open learningQ10, Q11, Q13, Q14, Q15
Intrinsic motivationQ7, Q12
Knowledge transferQ9
Information Management (IM)Information searchQ6
Information organizationQ1
Digital identityQ5
FeedbackQ8
Knowledge Creation (KC)Information processingQ4
Knowledge constructionQ2
Team workQ3
Table 4. Summary of changes suggested by experts. Reprinted with permission from ref. [7]. 2020, UCSC.
Question Modification
Q08Deleted
Q13Deleted
Q12Changed to OL category
Feedback category Replaced by planning category
Q10Changed to planning category
Table 5. Dimensions, questions and categories of the instrument used in the pilot test. Reprinted with permission from ref. [7]. 2020, UCSC.
DimensionCategoryQuestions
Open LearningOpen learningQ10, Q12, Q13
MotivationQ07, Q11
Knowledge transferQ08
Information ManagementInformation searchQ06
Information organizationQ01
Digital identityQ05
PlanningQ09
Knowledge creationInformation processingQ04
Knowledge constructionQ02
Team workQ03
Table 6. Number of participants by gender and type of higher education institutions.
Type of InstitutionMaleFemaleTotal
University (UNIV)5997156
Professional Institute (PI)261642
Technical Training Center (TTC)4675121
TOTAL131188319
Table 7. Levels of response in pilot test application.
MeaningAbbreviationAnswer
Totally DisagreeTD1
Strongly DisagreeSD3
DisagreeD3
Neither agree nor disagreeNAND4
AgreeA5
Strongly agreeSA6
Totally AgreeTA7
Table 8. Matrix of rotated components for the first analysis with the 13 questions.
Components
Questions123
Q090.80
Q120.770.37
Q080.730.35
Q130.690.47
Q040.66 0.55
Q020.57 0.51
Q030.510.430.51
Q05 0.76
Q070.450.68
Q100.440.65
Q06 0.590.54
Q110.540.540.32
Q01 0.530.37
Table 9. Final matrix of rotated components with 11 questions.
Components
Questions123
Q120.790.40
Q130.760.34
Q100.67 0.42
Q080.640.48
Q070.62 0.54
Q110.610.350.44
Q04 0.81
Q090.400.74
Q02 0.680.35
Q05 0.81
Q06 0.370.76
Table 10. Components, categories, and questions of the final version of the B-PLE instrument.
ComponentsCategoriesQuestions
Open LearningOpen learningQ08, Q10, Q11
MotivationQ05, Q09
Knowledge transferQ06
Information ManagementDigital IdentityQ03
Information searchQ04
Knowledge Creation and transferInformation processingQ02
Knowledge constructionQ01
PlanningQ07
Table 11. Notation for the creation of lavaan models.
SyntaxDescription
=~Latent variable
~Regression
~~Co-variance between errors or variance of the indicator
~1Intercept
Table 12. Indicators used to analyze the adjustment of the model.
Indicator Acceptable Adjustment Levels
χ2Max. 5 degrees of freedom
CFI>0.90
TLI>0.90
RMSEA<0.10 reasonable; <0.05 superior; <0.01 outstanding
SRMR<0.05
Table 13. Goodness-of-fit indicators for the proposed model.
Modelχ2DfPCFITLIRMSEASRMR
Model1172.893410.0000.930.910.0850.047
Table 14. Summary of change rates output.
LhsOpRhsMi
Q10~~Q1142.185
IM=~Q1032.257
IM=~Q0525.732
Q04=~Q1022.903
Q07=~Q0617.387
IM=~Q0713.625
Q04=~Q0713.580
Q04=~Q0512.144
OL=~Q0211.807
Q05~~Q1011.410
Table 15. Goodness-of-fit indicators for the two proposed models.
Modelχ2DfPCFITLIRMSEASRMR
Model 1172.893410.0000.930.910.0850.047
Model 2132.660400.0000.950.940.0690.044
Table 16. Output ci.reliability function for the Omega Coefficient.
$est
[1] 0.9150344
$se
[1] 0.01105104
$ci.lower
[1] 0.8933201
$ci.upper
[1] 0.9346272
$conf.level
[1] 0.95
$type
[1] “omega”
$interval.type
[1] “bca bootstrap”
Publisher’s Note: MDPI stays neutral with regard to jurisdictional claims in published maps and institutional affiliations.

