Article

The Spatial–Temporal Changes of the Coupling Relationship among Agricultural Labor Force, Agricultural Economy, and Farmland in Chongqing

1
College of State Governance, Southwest University, Chongqing 400700, China
2
School of Geographical Sciences, Southwest University, Chongqing 400700, China
*
Author to whom correspondence should be addressed.
Sustainability 2021, 13(16), 8780; https://doi.org/10.3390/su13168780
Submission received: 5 June 2021 / Revised: 25 July 2021 / Accepted: 27 July 2021 / Published: 5 August 2021
(This article belongs to the Special Issue Sustainable Land Use Change)

Abstract

:
Agricultural labor force, agricultural economy, and farmland use are momentous components of sustainable development in rural areas, as well as essential causes of drastic changes in the urban–rural transformation. This paper studies the spatial–temporal characteristics of the labor–farmland–economy coupling structure from 2000 to 2018 in rural areas of Chongqing using spatial analysis technology. The study has four main results. First and foremost, not only has the average annual rate of the agricultural labor force in Chongqing reduced by 3.73%, but the reduction rates in Jiangbei District, Dadukou District, Nan’an District, Shapingba District, and Yubei District have exceeded 15%. Then, the average annual rate of the agricultural economy has increased by 9.32%, but it has been in a downward trend in Dadukou District, Jiangbei District, and Shapingba Districts. Furthermore, the average annual decline rate of farmland area is 0.34% with larger reduction occurring in the nine of the central urban districts, Chengkou County and Wushan County. Ultimately, there have been 33 districts and counties with the temporal–spatial characteristics of labor–farmland–economy coupling above primary coordination, which includes 16 districts and counties reaching a high coordination. This provides theoretical and methodical supports for the coordinated development of human and land industries in different regions.

1. Introduction

Agriculture serves as a prerequisite for the survival and advancement of humankind and plays a unique role in the economic society. It is quite valuable for rural areas in agricultural production and ecological conservation; issues related to farmers, agriculture, and rural areas are fundamental to the national economy and people’s livelihoods, and agricultural and rural modernization forms the foundation for a modern country [1]. During the period of rapid industrialization and urbanization, labor, land, capital, and other factors of production continue to gather in cities [2]; the income disparity between the agricultural sector and the non-agricultural sector has widened, and the income structure of farmers is undergoing significant changes [3]. All aspects of gap between urban areas and rural areas in China have been widened, and the income ratio between the two areas has expanded from 2.57 in 1978 to 2.72 in 2016. The “rural diseases”—older and weaker people forming most of the population, a poor economy, vacant and waste land, and environmental pollution—have become increasingly serious, resulting in the rapid recession of agriculture and rural areas [4].
Population, land, and industry are three main factors of the urban–rural system, as well as important indicators that reflect the urban–rural transformation and development [5]. With the continuous reduction in agricultural benefits and the rapid increase in wages and income in the non-agricultural industry [6], the large-scale outflow of rural young and middle-aged populations lead to a “hollowing” in rural areas, with only “old and weak” residents been left behind. This, in turn, causes the dilemmas of empty homesteads, abandoned farmland, slow agricultural development, and low benefits, as well as significant changes to rural land use [7]. Since the beginning of the 21st century, the imbalance between population and land in urbanization has gradually been expanded [8], and the proportion of the added value of agriculture, forestry, animal husbandry, side-line production, and fishery in the national GDP has decreased [9]. Therefore, more attention should be paid to rural revitalization in the process of rapid urbanization [10]. The coupling coordination of agricultural labor force, agricultural economy, and land is the key to the sustainable development of rural areas. The revitalization of population, industry, and land forms the basis for activating the rural vitality and enhancing development capability [11].
The transfer of agricultural surplus labor will improve agricultural efficiency [12]; economic policy reform, science, and technology progress will enhance agricultural production efficiency and benefits, thus, reducing employment opportunities for agricultural labor [13]. The migration of the agricultural labor force to non-agricultural sectors is helpful to land transfers [14], increasing farmers’ income, and, thus, promoting the development of the agricultural economy [15]. It has been shown that when the transfer of agricultural labor exceeds a critical value, it promotes the transfer of agricultural land and scale management [16]; however, with the increase in labor transfer, agricultural production is affected negatively. The excessive outflow of agricultural labor force will accelerate the aging of the old and reduce land revenue [17], thus, resulting in the decrease in farmland use intensity [7] and the acceleration of farmland abandonment [18]. To sum up the previous studies, an adaptive level of labor transfer is an effective means to promote a sustainable economy.
Labor force is a crucial factor restricting the development of rural industries. On the one hand, the excessive outflow and decrease in labor force have a more negative influence on the sustainable development with population aging, farmland abandonment, and village hollowing. [19]. Due to the scarcity of a young and middle-aged labor force, as well as the decline of human capital, the effect of cultivated land on the population agglomeration in mountainous areas has weakened [20]; the labor cost of industrial development continues to rise, which squeezes the benefits of agricultural industry and seriously does not motivate the development of secondary and tertiary industries [21]. On the other hand, the introduction of high-quality talents in rural areas is insufficient. Under the background of rural revitalization, industrial development is gradually moving toward a large-scale intensification and modernization. Furthermore, management talents of rural skilled labor force are scarcer. The transferred agricultural labor force is mostly composed of the higher education population, but the weak labor force stays in rural areas [22], showing a serious imbalance between the outflow of labor and introduction of labor. It is difficult to maintain the labor security of agricultural modernization, resulting in difficulties in improving the output efficiency of agricultural land, which has not fully activated the role of rural labor in the intensive use of land for industrial development. It is not conducive to the sustainable development of agricultural production [23], and farmers and policy makers must deal with the current labor challenge [24].
The 38 counties of the Chongqing Municipality are grouped into the following categories: central city, new districts of the main city, Northeast Chongqing, and Southeast Chongqing, which consist of 9, 12, 11, and 6 counties, respectively. These groupings are determined based on the geographical location and the economic and cultural conditions of the counties and in combination with the construction plan of Chongqing’s main urban areas in 2020 (Figure 1).

2. Relationship among Agricultural Labor, Agricultural Economy, and Farmland

2.1. Interaction between Agricultural Labor Transfer and Farmland Use

A reasonable transfer of agricultural labor force will be conducive to the intensive use of farmland, while an unreasonable transfer will lead to the inefficient use of farmland (Figure 1). The tension between humans and land has become prominent in China; at the same time, the shortage and fragmentation of farmland resources restrict the large-scale agricultural operation [25]. The transfer of agricultural labor force helps not only alleviate the contradiction between rural people and land, promote the transfer of farmland and the large-scale management, facilitate the application of modern agricultural advanced technology and machinery, but also improve the output rate of farmland and agricultural benefits [26,27]. Unreasonable labor transfer will lead to the abandonment of some farmland without cultivation and the cultivated farmland will shrink in production capacity and benefits due to the decrease in input of the agricultural means of production and management of time [7,28]. Farmland use also affects labor transfers (Figure 1) since the intensive use of farmland and the capacity improvement can effectively liberate the labor force, increase the demand for agricultural labor force, and promote non-agricultural employment [29]; despite of a surplus of rural labor force, the fragmented farmland management retains more labor force [30]; thus, limiting the transfer of labor force.
Conclusively, the transfer of agricultural labor force is closely related to the development of the agricultural economy and land use, which is an essential element of rural revitalization. However, the current studies focus on discussing the unilateral influence of regional agricultural labor force on the agricultural economy or that of agricultural labor force on farmland use, lack of research on the coupling relationship among agricultural labor force, agricultural economy, and farmland.

2.2. Interaction between Agricultural Labor Transfer and Development of Agricultural Economy

The appropriate transfer of agricultural labor force will promote the development of the agricultural economy, while too much or too little transfer will lead to a low-level development of the agricultural economy (Figure 2). A suitable labor transfer will help farmers acquire new skills, improve the quality of the labor force, promote the application of agricultural technologies, advance agricultural production efficiency, and boost the development of the agricultural economy [31,32]. In addition, the transfer of agricultural labor force can promote the optimal allocation of rural resources among industries and promote large-scale agricultural operation [33]. On the one hand, given the fact that the young and middle-aged (or high-quality) population forms the chunk of the transferred labor force, any excessive transfer of labor force will lead to the shortage of rural human resources, and agricultural production will have to be operated mainly by old-aged and weak people. As a result, agricultural development and the rural economy will be obstructed [34]. On the other hand, the development of the agricultural economy will promote or restrict the transfer of the agricultural labor force (Figure 2). A heightened agricultural economy is conducive to the prosperity of industries in rural areas [35]. As the agricultural industry continues to grow and the industrial chain of agricultural products extends, agriculture will provide more jobs and a higher income for rural residents, and promote the transfer of the agricultural labor force and social development. However, the lack of motivation for the development of the agricultural economy will reduce the employment opportunities and income of the labor force and reduce the flow of population, land, and other factors. This will eventually cause such problems as the gradual depression of the social economy and regional poverty.

3. Materials and Methods
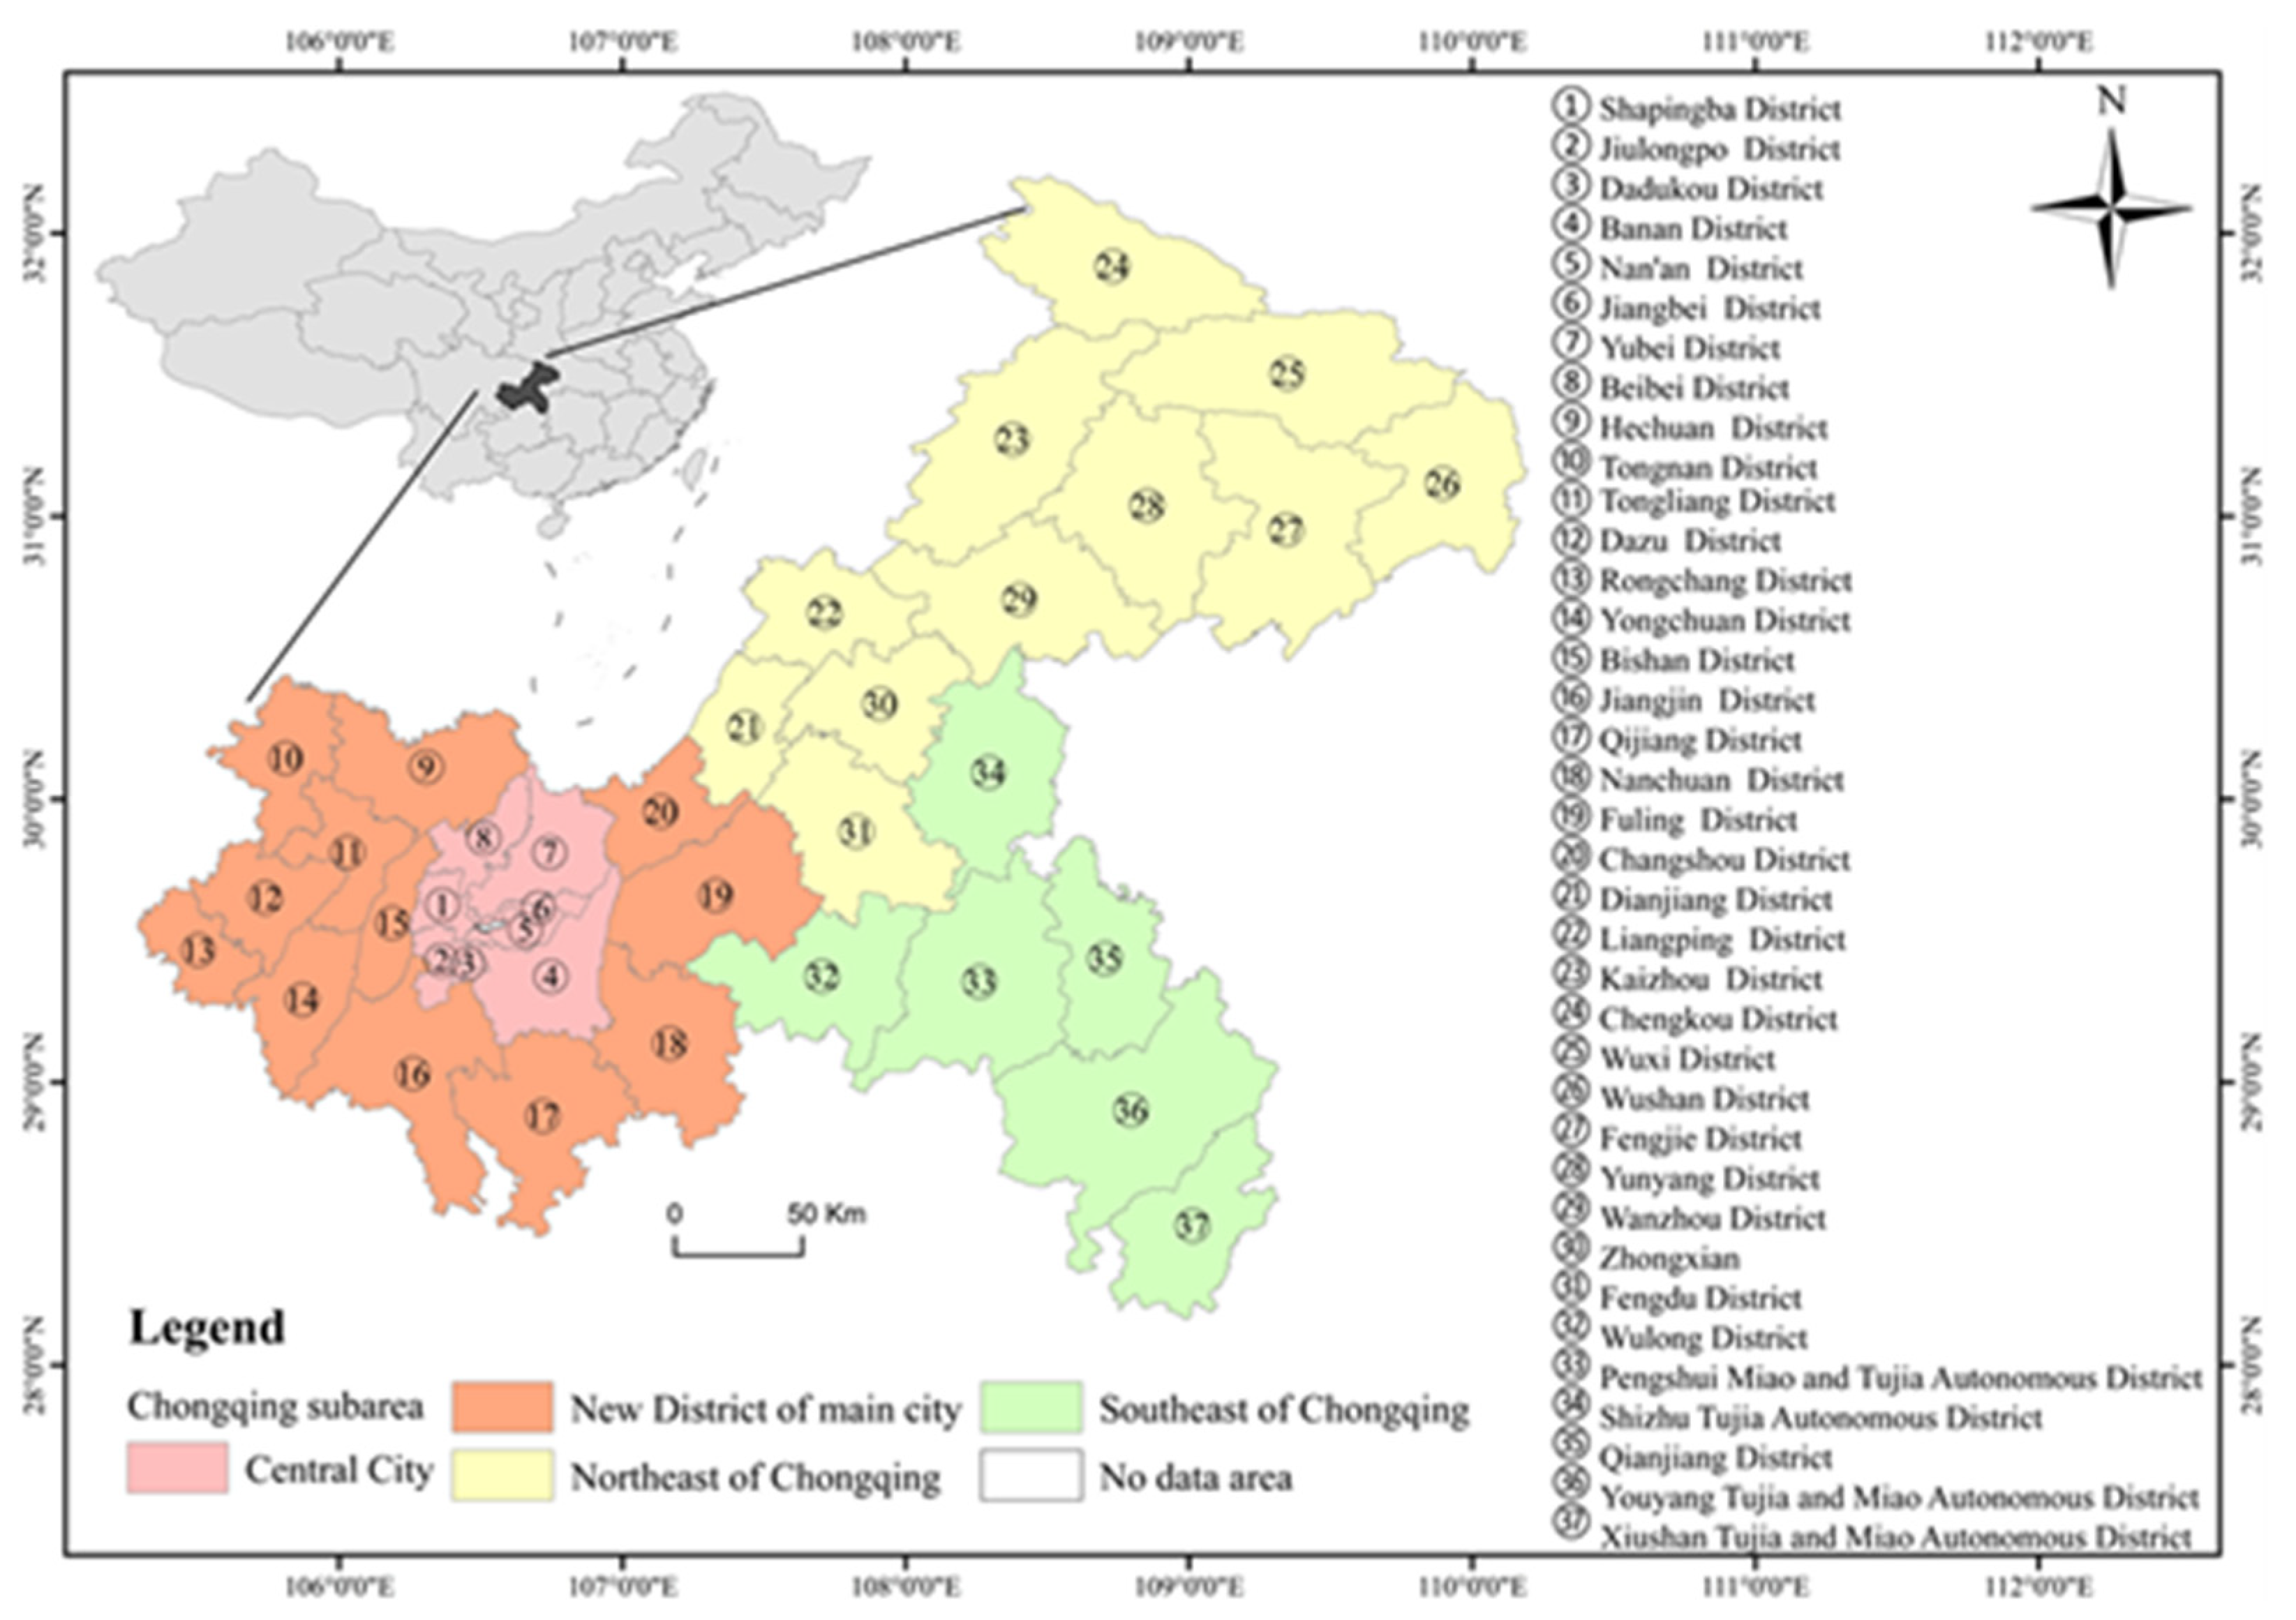
3.1. Data Source

Located in the west of China, Chongqing has 38 counties (districts or county-level cities, same below). Since there is no rural population in Yuzhong District, Chongqing, it has not been included in this study. Its rural population is large in size, with a low-level farmland area per capita. Consequently, it faces such problems as a high-outflow rate of the agricultural population and the aging of the population, and its rural development is at a medium level [36]. Land fragmentation reduces agricultural labor productivity and production efficiency; thus, indirectly driving the transfer of agricultural labor to the non-agricultural sectors [25]. Previous studies have shown that the transfer of the agricultural labor force in Chongqing had produced significant effects in economic growth, agricultural output, and agricultural income, which provided solid support for the overall planning of both its urban and rural areas [37]. Some other studies show that the transfer of rural labor force in Chongqing has only increased farmers’ income, but has not significantly improved the city’s agricultural output [38]. Since the launching of the targeted poverty alleviation campaign, significant changes have taken place in population, land use, and industry in rural areas. It is urgent to conduct research on the coupling relationship among agricultural labor force, rural economy, and farmland changes in Chongqing. This research will support policy making for consolidating and expanding the achievements of poverty alleviation, and promote rural revitalization and urban–rural integration and development. Therefore, the main contents of this study are as follows: (1) constructing a logical framework of agricultural labor transfer, agricultural economy, and farmland use; (2) analyzing the temporal–spatial change of rural labor force, development of agricultural economy, and farmland in Chongqing; (3) explaining the temporal–spatial coupling characteristics of the labor–farmland–economy structure in Chongqing and the formation mechanism.
The data in this study include the number of agricultural workers and the total output value of the agricultural economy and farmland from 2000 to 2017. These data came from the Chongqing Statistical Yearbook and the data of the stated counties. Some missing data were supplemented by the linear interpolation formula or the mean difference compensation method, in combination with the data as released in the government work reports of the counties. In addition, to make the data of different years comparable, this paper ignored the influence of price changes.

3.2. Research Methods

3.2.1. Labor–Farmland Elastic Coefficient

Using the Labor–Farmland Elastic Coefficient (LFEC), this paper analyzed the change direction and relative speed of the agricultural labor force and farmland area, and revealed the spatial–temporal coupling characteristics of the agricultural labor force and farmland area in Chongqing. The LFEC refers to the ratio of the change rate of the agricultural labor force to that of farmland area in a certain period of time [39]. The calculation formula is as follows:
L F E C i j = L C R i j F C R i j = L i j L i 0 L i 0 F i j F i 0 F i 0
In this formula, L F E C i j represents the L F E C in region i in year j . L C R i j and F C R i j represent the change rate of the number of agricultural workers and of the farmland area, respectively, in region i in year j . L i j and F i j represent the number of agricultural workers and the farmland area, respectively, in region i in year j . Finally, L i 0 and F i 0 represent the number of agricultural workers and farmland area, respectively, in region i in the base year.
Based on the LFEC, this paper classified the coupling of agricultural labor force and farmland area change into the Labor–Farmland Growth Type and the Labor–Farmland Recession Type (Table 1).

3.2.2. Economy–Labor Elastic Coefficient

Using the Economy–Labor Elastic Coefficient (ELEC) [27], this paper analyzed the change direction and relative speed of the agricultural economy and agricultural labor force and revealed the spatial–temporal coupling characteristics of the agricultural economy and agricultural labor force in Chongqing. The calculation formula is as follows:
E L E C i j = E C R i j L C R i j = E i j E i 0 E i 0 L i j L i 0 L i 0
In this formula, E L E C i j represents the E L E C of region i in year j . E C R i j and L C R i j represent the change rate of the agricultural economy and of the number of agricultural workers, respectively, of region i in year j . E i j and L i j represent the total agricultural economic output value and the number of agricultural workers, respectively, in region i in year j . E i 0 and L i 0 represent the total agricultural economic output value and the number of agricultural workers, respectively, in region i in the base year.
Based on the ELEC, this paper divided the coupling of agricultural economic development and the agricultural labor change into the Economy–Labor Growth Type, Economy–Labor Extensive Type, Economy–Labor Intensive Type, Economy–Labor Backward Type, Economy–Labor Decline Type and Economy–Labor Recession Type (Table 2).

3.2.3. Types of Labor–Farmland–Economy Coupling

Based on the division of the Labor–Farmland Elastic Type and the Economy–Labor Elastic Type, the coupling analysis of them was carried out. Labor–Farmland Elastic Type includes the Labor–Farmland Growth Type and the Labor–Farmland Recession Type. Based on the principle of priority of cultivated land protection, types of labor–farmland–economy coupling under the Labor–Farmland Growth Type were divided into 6 types and 1–6 coordination levels preferentially and then types of labor–farmland–economy coupling under the Labor–Farmland Recession Type were divided into 6 types and 2–7 coordination levels. In this study, there were 12 types of labor–farmland–economy coupling in the rural system, which can be divided into seven types of coordination (Table 3).
The coupling type featuring labor–farmland growth and intensive economy–labor was the best. It is conducive to improving the regional human–land relationship, increasing agricultural productivity, promoting farmers’ income, and promoting rural economic development. However, the coupling of the economy–labor backward type will lead to the insufficient utilization of the rural labor force; thus, hindering the improvement of labor productivity and restricting the development of the rural economy [32]. Both the Economy–Labor Decline Type and the Economy–Labor Recession Type will hinder rural development; there is no doubt that the migration of high-quality agricultural labor to the non-agricultural sectors, along with the outflow of agricultural production factors, deserve more attention.

4. Results

4.1. Spatiotemporal Characteristics of Agricultural Labor Force Change

From 2000 to 2010, the average annual rate of the agricultural labor force in Chongqing reduced by 3.86%, and the rate in 20 districts and counties showed a decreasing trend. The reduction rate in Jiangbei District, Dadukou District, Nan’an District, Shapingba District, and Yubei District exceeded 15.00%; the reduction rate in Jiangbei District was as high as 44.83%. The agricultural labor force in 17 districts and counties showed an increasing trend, and the growth rate of Chengkou County, Rongchang District, Kaizhou District, Dianjiang County, and Tongliang District was higher, exceeding 15% (Figure 3a). From 2010 to 2018, the average annual reduction rate of the agricultural labor force in Chongqing was 3.56%; the rate in 29 districts and counties showed a decreasing trend. The reduction rate in seven districts and counties exceeded 30.00%, and the rate in Jiangbei District was as high as 71.30%. Only eight districts and counties showed an increasing trend in the agricultural labor force; these districts were mainly concentrated in the northeast of Chongqing (Figure 3b). From 2000 to 2018, the average annual reduction rate of the agricultural labor force in Chongqing was 3.73%, and the agricultural labor force in 25 districts and counties showed a decreasing trend. Among them, Jiangbei District, Dadukou District, Shapingba District, Yubei District, Dazu District, Beibei District, and Changshou District witnessed a reduction rate of over 30.00%; the reduction rate of Jiangbei District was as high as 84.17%. There were 12 districts and counties with increased agricultural labor force, among which Rongchang District, Kaizhou District, Nan’an District, and Dianjiang County registered an increase rate of more than 15.00%, and Nan’an District registered an increase rate of 85.00% (Figure 3c).

4.2. Characteristics of Spatial–Temporal Coupling of the Labor–Farmland–Economy Structure

4.2.1. Characteristics of the Economy–Labor Coupling Types

From 2000 to 2010, there were 20 ECIT counties in Chongqing which were mainly distributed in the central cities and the northeast of Chongqing, and there were 17 ECGT counties which were mainly distributed in the connecting zone between Qijiang District and Chengkou County (Figure 4a). From 2010 to 2018, the number of ECIT counties in Chongqing increased to 25. However, Dadukou District, Jiangbei District, and Shapingba District, as the main cities, showed an ECRT trend, while Jiulongpo District and Nan’an District showed the trends of ECDT and ECBT, respectively (Figure 4b). From 2000 to 2018, there were 22 ECIT counties in Chongqing, which were mainly distributed in the central cities and the northeast of Chongqing, and there were 11 ECGT counties. Dadukou District, Jiangbei District, and Shapingba District, as the main cities, showed the ECRT trend, while Nan’an District showed the ECET trend (Figure 4c).
The change of the agricultural economy showed typical features. From 2000 to 2010, the growth rate of the agricultural economy of Chongqing registered 137.61%, with an average annual growth rate of 9.04%. The development of the agricultural economy of all counties showed an upward trend. The growth rate of the agricultural economy of the central cities and the southeast of Chongqing was slow. For example, the growth rate of Shapingba District, a main city, was only 8.39%, while those of Fuling District and Wanzhou District in the new districts and Rongchang District in Northeast Chongqing were 185.56%, 183.35%, and 165.41%, respectively (Figure 5a). From 2010 to 2018, Chongqing’s agricultural economy grew by 109.33%, with an average annual growth rate of 9.67%. The agricultural economy of 32 districts and counties showed a growing trend, among which 26 districts and counties grew by more than 100% and seven districts and counties grew by more than 120%. Five districts with a declining agricultural economy were mainly distributed in the main cities, especially in Jiangbei District and Dadukou District, with reduction rates of 62.44% and 34.85%, respectively (Figure 5b). From 2000 to 2018, Chongqing’s agricultural economy grew by 397.40%, with an average annual growth rate of 9.32%. The growth rate of seven districts and counties was higher than 420%, among which Wanzhou District registered the highest growth rate of 517.70%. Dadukou District, Jiangbei District, and Shapingba District, all main cities, showed a downward trend, with the reduction rates of 19.54%, 18.32%, and 3.16%, respectively (Figure 5c).

4.2.2. Characteristics of Labor–Farmland Coupling

From 2000 to 2010, there were 14 LFGT counties in Chongqing, which were mainly distributed in the new districts of main cities and the southeast of Chongqing. There were 23 LFRT counties, which were mainly distributed in the central cities and the northeast of Chongqing (Figure 6a). From 2010 to 2018, the number of LFGT counties in Chongqing increased to 24, while the number of LFRT counties decreased to 13 (Figure 6b). From 2000 to 2018, there were 19 LFGT counties in Chongqing, which were mainly distributed in the new districts of main cities and the northeast of Chongqing, and there were 18 LFRT counties (Figure 6c).
It also showed spatial–temporal change in farmland. From 2000 to 2010, the average annual reduction rate of farmland area in Chongqing was 0.32%, showing a decreasing trend in 26 districts and counties. The reduction rate of farmland area in Nan’an District, Dadukou District, Shapingba District, Jiangbei District, Jiulongpo District, and Banan District exceeded 30%. The farmland area of 11 districts and counties showed an increasing trend, and the increase rate of Pengshui Miao and Tujia Autonomous County, Tongnan District, Qijiang District, and Qianjiang District exceeded 15% (Figure 7a). From 2010 to 2018, the average annual reduction rate of farmland area in Chongqing was 0.36%, and the farmland area in 33 districts and counties showed a decreasing trend. The farmland area reduction rate in Jiangjin District, Jiangbei District, Dadukou District, Nan’an District, and Jiulongpo District exceeded 30%; only Qianjiang District, Liangping District, Wanzhou District, and Xiushan Tujia and Miao Autonomous County showed an increasing trend in farmland area (Figure 7b). From 2000 to 2018, the average annual reduction rate of farmland area in Chongqing was 0.34%, and the farmland area in 29 districts and counties showed a decreasing trend. The reduction rate of farmland area in Dadukou District, Jiangbei District, Nan’an District, and Jiulongpo District in the central cities exceeded 60%, and the reduction rates in Chengkou County, Wushan County, and Fengdu County in the northeast of Chongqing were 30.61%, 16.51%, and 24.63%, respectively. Eight counties with an increased farmland area were mainly distributed in the southeast and northeast of Chongqing, and Pengshui Miao and Tujia Autonomous County registered an increase rate of over 30% in farmland (Figure 7c).

4.2.3. Characteristics of the Rural Labor–Farmland–Economy Coupling

There are seven types of rural labor–farmland–economy coupling in each district or county of Chongqing, among which, from 2000 to 2010, the spatial pattern characteristics of the rural labor–farmland–economy coupling were demonstrated as high coordination, intermediate coordination, and primary coordination. The numbers of counties in these three groups were 10, 14, and 13, respectively (Figure 8a). From 2010 to 2018, the spatial pattern characteristics of the rural labor–farmland–economy coupling were divided into five types: high coordination, intermediate coordination, primary coordination, mild disorders, and serious disorders. Among them, the number of counties with high coordination increased to 20, while the number of counties with intermediate coordination and primary coordination decreased significantly; however, the central cities showed a state of disorder (Figure 8b). From 2000 to 2018, the spatial pattern characteristics of the rural labor–farmland–economy coupling were divided into six types: high coordination, intermediate coordination, primary coordination, on the verge of disorders, mild disorders, and moderate disorders. Among them, the numbers of counties with high coordination, intermediate coordination, and primary coordination were 16, 7, and 10, respectively. Shapingba District, Dadukou District, Jiangbei District, and Nan’an District, as the main cities, were regarded as out of order (Figure 8c).
According to the spatial–temporal coupling types, from 2000 to 2018, the districts and counties featuring high coordination accounted for the largest proportion in the coordination types of spatial–temporal coupling in the rural labor–farmland–economy structure. During the period from T1 to T2, the proportion of counties featuring high coordination increased by 27.03%, those featuring mild disorders increased by 10.81%, and those featuring serious disorders increased by 2.70%. The proportion of counties featuring intermediate coordination decreased by 21.62% and those featuring primary coordination decreased by 18.92%. The counties that transformed from intermediate coordination and primary coordination to high coordination accounted for 21.62% and 16.22%, respectively, in all counties (Table 4).

5. Discussion

For much of its history, China was a large, traditional, and agricultural country. Since the reform and opening up was initiated, talent, land, capital, and other resources in rural areas have rapidly flowed to cities, making great contributions to China’s rapid economic development. However, problems such as “hollowing” villages and abandoned land have become increasingly serious [8]. The relationship between farmers and land has also undergone a fundamental change because of rapid urbanization [40]. Young and middle-aged farmers as well as educated farmers took the lead in entering cities. After obtaining stable, high-income jobs, they brought their children and other family members to reside in cities [41]; thus, resulting in a decline in the rural population and a shortage of labor there. From 2000 to 2018, the agricultural labor force in Chongqing showed a decreasing trend, especially in the central cities (Figure 3), which was related to the rapid economic development, more employment opportunities, and a greater attraction to farmers there. Since the targeted poverty alleviation policy was adopted, poverty alleviation by means of developing industries has gradually expanded. This has provided more jobs to rural residents, especially the poor left behind [42], and it has drawn some outsiders to the countryside to become involved in the agricultural economy. Therefore, the agricultural labor force in some regions of the southeast and northeast of Chongqing increased (Figure 3).
In the process of rapid urbanization, the problems of the non-agricultural use of agricultural land related to infrastructure construction the development of enterprises, industry, and commerce and community construction have been intensified; thus, resulting in the gradual reduction or even the complete loss of farmland in some villages [8]. The transfer of labor force between urban and rural areas has also changed the way in which farmers use farmland [43]. Young and middle-aged laborers are unwilling to return home to farm after obtaining a job in the city, and they have transferred their farmland to other villagers or abandoned it [14,18]. However, some studies have shown that the transfer of agricultural labor force is conducive to the transfer of farmland and large-scale operation and promotes industrial development [14,16]. “Amphibious people” in both urban and rural areas have also accelerated the problem of farmland being converted for non-agricultural purposes. Migrant workers return to their country homes during busy farming seasons or holidays, and use the funds earned from their non-agricultural work to repair their houses, and even expand their living space there [44]. At the same time, as the rural economy developed, some urban people went to the countryside to start businesses, bring along with them capital, technology, and resources. From 2000 to 2018, the farmland area of 78.38% counties in Chongqing showed a downward trend. This trend is most prominent in the central cities and the new districts of the main cities (Figure 5). Since China’s Western Development Program was initiated, the central cities and the new districts of the main cities have created key development advantages in Chongqing, turned into a growth pole of high-quality development for the future, and became one of the major engines of the Chengdu–Chongqing Economic Circle. Its dependence on new city construction, industrial cluster cultivation, and public facilities allocation for farmland was higher than other regions. The remediation projects for degraded, empty, and waste land and the policies for poverty alleviation in association with land use could not only supplement farmland resources, but provide high-standard farmland and agricultural development models for agricultural production [45,46]. The southeast of Chongqing and the northeast of Chongqing are the key areas for implementing the policy of “balancing the occupation and supplementation of farmland.” The land remediation projects related to rural homestead reclamation and wasteland reclamation suitable for agriculture continued; thus, effectively supplementing the area of farmland.
From 2000 to 2018, the degree of coupling and coordination of human, land and industry in poverty-stricken counties of Chongqing is gradually becoming better, and the degree of coupling and coordination of human, land and industry in central urban area is gradually becoming worse (Figure 6). Among the 14 national poverty-stricken counties in Chongqing, the rural labor–farmland–economy coupling type in 11 counties showed a trend of gradual coordinated change. The reason is that during the period of targeted poverty alleviation, the creation of job opportunities had effectively promoted the transfer of the agricultural labor force. The development of relevant industries and financial services had encouraged and driven a large portion of the poor population to participate in the development of such industries and make efficient use of farmland. This improved the scale and intensification of farmland utilization and enhanced the agricultural economic aggregate and efficiency. In the future, Chongqing should focus on industrial development, introduce high-caliber talent, improve the interest-based mechanism in the agricultural industry, upgrade the quality of leading industries, promote the development of rural areas and agriculture, and effectively facilitate rural revitalization. There were five districts in the central cities where the coupling and coordination degree of labor–farmland–economy gradually decreased, accounting for 50% of the total decreasing counties. The occupation of farmland due to rapid urbanization led to the transfer of the agricultural labor force in the central cities (Figure 3), a decline of farmland area (Figure 4), and a decrease in the total agricultural economic aggregate (Figure 4). In the future, it will be necessary to increase the transfer of the agricultural population and promote the transformation of farmers into citizens by providing them with jobs in the central cities. In particular, Chongqing should vigorously develop the tertiary industry to enhance the value of the agricultural industry and promote the integration and development of both urban and rural areas. In addition, Wuxi County, Fengjie County, Qianjiang District, Kaizhou District, and Yongchuan District featured a lower-level rural labor–farmland–economy coordination (Figure 6). This was mainly manifested in the decrease in farmland and the increase in the agricultural labor force, and the insufficient development of the agricultural economy, the low-level mechanization in the remote rural areas, and the difficulty of farming with a labor force consisting of mainly older and disabled workers [47]. As a result, they lacked sufficient management in farmland which led to low efficiency. During the period when the targeted poverty alleviation effectively facilitates rural revitalization, Chongqing kept protecting farmland and transferring agricultural labor. Qianjiang District in the southeast of Chongqing strove to improve the efficiency of farmland use and the agricultural industrial benefits, and moderately increased the transfer of agricultural labor. It is worth noting that under the influence of policies such as returning farmland to forests and ecological protection, Chengkou County, Wushan County, and Fengdu County in the northeast of Chongqing had become the most prominent in the decrease in farmland, and the rural labor–farmland–economy coupling and coordination there was becoming better. In the future, Chongqing should keep making full use of resources of green water and green mountains and realize the coordinated rural labor–farmland–economy development by adhering to the development concept of “ecological industrialization” such as organic agriculture, ecological agriculture and eco-tourism.

6. Conclusions

Using the cross-sectional data of the agricultural labor force, agricultural economy, and farmland area in Chongqing in 2000, 2010, and 2018, this paper discussed the spatial–temporal coupling relationship between the agricultural labor force and agricultural economy, and between the agricultural labor force and farmland. This provided theoretical and methodical support for the coordinated development of human and land industries in different regions.
From the perspective of rural labor, farmland, and economy in the development of the rural system, this paper researched the spatial–temporal characteristics of the rural labor–farmland–economy coupling in different districts and counties of Chongqing by studying the changes of three factors: agricultural labor force, agricultural economy, and farmland area. The results showed that, from 2000 to 2018, the number of agricultural workers in Chongqing decreased by 49.53%, and the reduction rate was highest in the central cities. The growth rate of the agricultural economy in Chongqing was 397.4%; the growth trend in the northeast of Chongqing was the highest; the growth rate in the main cities was relatively slow. The farmland area in 29 districts and counties showed a decreasing trend, while that in 8 districts and counties showed an increasing trend, and the farmland area in the main cities decreased the fastest.
There are 16 districts and counties (43.24% of the total) in Chongqing whose rural labor–farmland–economy coupling type has been regarded as the Labor–Farmland Growth Type and the Economy–Labor Intensive Type. They are mainly distributed in the northeast of Chongqing and the new districts in main cities. The coupling types in all districts and counties in association with the change of the agricultural labor force and the development of the agricultural economy and farmland have developed in a benign direction as a whole.
In the context of rural revitalization in the future and under the combined action of the endogenous driving force for rural development and the external driving force for development in cities, there will occur a change to the rural labor–farmland–economy structure. It is essential to attract talent to rural development and construction, to protect the quantity and quality of farmland, to promote the upgrading of the agriculture-related industrial structure, and to enhance development vitality in rural areas. This has become the key to consolidating the achievements of poverty alleviation and promoting rural revitalization and sustainable development. In the future, it should strengthen research on the Labor–Farmland Elastic Coefficient, the minimum average arable land area per agricultural worker, and the threshold of the ELEC in its different areas. This will be of important guiding significance for promoting the flow of urban and rural talents, intensive land management, and the rapid development of the agricultural economy. In sum, it will support rural revitalization and urban–rural integration.

Author Contributions

Methodology, L.Z.; validation, L.Z. and H.L.; formal analysis, L.Z. and M.Y.; data curation, W.L. and H.H.; writing—review and editing, L.Z., M.Y., W.L., and H.L.; visualization, H.H.; project administration, L.Z. and H.L.; funding acquisition, L.Z. All authors have read and agreed to the published version of the manuscript.

Funding

This research was funded by The Social Science Planning Project of Chongqing in 2019, 2019YBGL076; the Chongqing Technology Foresight and Institutional Innovation Project, cstc2020jsyj-zzysbAX0077; The Open Fund of the Key Laboratory of Analysis and Simulation of Regional Sustainable Development by the Chinese Academy of Sciences, KF2020-01; postdoctoral (No. 145316) research.

Institutional Review Board Statement

Not applicable.

Informed Consent Statement

Not applicable.

Data Availability Statement

(1) A publicly available dataset was analyzed in this study. These data can be found here: (http://tjj.cq.gov.cn/ (accessed on 7 October 2020)). The National Bureau of Statistics, 2001, 2002, 2003, 2004, 2005, 2006, 2007, 2008, 2009, 2010, 2011, 2012, 2013, 2014, 2015, 2016, 2017, 2018, and 2019. China Statistical Yearbook (County Level). (2) Data were obtained from the Chongqing planning and the Natural Resources Bureau and are available from the authors with the permission of the Chongqing planning and Natural Resources Bureau.

Conflicts of Interest

The authors declare no conflict of interest. The funders had no role in the design of the study; in the collection, analyses, or interpretation of data; in the writing of the manuscript, or in the decision to publish the results.

References

  1. Liu, Y. The basic theory and methodology of rural revitalization planning in China. Acta Geogr. Sin. 2020, 75, 1120–1133. (In Chinese) [Google Scholar]
  2. Long, H.; Liu, Y.; Li, X.; Chen, Y. Building new countryside in China: A geographical perspective. Land Use Policy 2010, 27, 457–470. [Google Scholar] [CrossRef]
  3. Rigg, J.; Salamanca, A.; Thompson, E.C. The puzzle of East and Southeast Asia’s persistent smallholder. J. Rural Stud. 2016, 43, 118–133. [Google Scholar] [CrossRef]
  4. Liu, Y. Research on the urban-rural integration and rural revitalization in the new era in China. Acta Geogr. Sin. 2018, 73, 637–650. (In Chinese) [Google Scholar]
  5. Yang, Y.; Liu, Y.; Li, Y.; Li, J. Measure of urban-rural transformation in Beijing-Tianjin-Hebei region in the new millennium: Population-land-industry perspective. Land Use Policy 2018, 79, 595–608. [Google Scholar] [CrossRef]
  6. Marrit Van Den Berg, M.; Hengsdijk, H.; Wolf, J.; Van Ittersum, M.K.; Wang, G.; Roetter, R.P. The impact of increasing farm size and mechanization on rural income and rice production in Zhejiang province, China. Agric. Syst. 2007, 94, 841–850. [Google Scholar] [CrossRef]
  7. Liu, G.; Wang, H.; Cheng, Y.; Zheng, B.; Lu, Z. The impact of rural out-migration on arable land use intensity: Evidence from mountain areas in Guangdong, China. Land Use Policy 2016, 59, 569–579. [Google Scholar] [CrossRef]
  8. Liu, Y.; Fang, F.; Li, Y. Key issues of land use in China and implications for policy making. Land Use Policy 2014, 40, 6–12. [Google Scholar] [CrossRef]
  9. Wang, Y.; Wen, Q.; Liu, Y. Achieving effective connection between rural revitalization and targeted poverty alleviation in poverty-stricken regions. Sci. Geogr. Sin. 2020, 40, 1840–1847. [Google Scholar]
  10. Liu, Y.; Li, Y. Revitalize the world’s countryside. Nature 2017, 548, 275–277. [Google Scholar] [CrossRef]
  11. Cheng, M.; Liu, Y.; Jiang, N. Study on the spatial pattern and mechanism of rural population-land-industry coordinating development in Huang-Huai-Hai Area. Acta Geogr. Sin. 2019, 74, 1576–1589. (In Chinese) [Google Scholar]
  12. Lewis, A. Duality Economy Theory; Beijing University of Economics Press: Beijing, China, 1989. [Google Scholar]
  13. Ibrahim, S.; Osama, E. Impact of technological changes and economic liberalization on agricultural labor employment and Productivity. Contemp. Egypt 1996, 8, 3–18. [Google Scholar]
  14. Deininger, K.; Jin, S. The potential of land rental markets in the process of economic development: Evidence from China. J. Dev. Econ. 2005, 78, 241–270. [Google Scholar] [CrossRef]
  15. Ma, Z.; Zhang, W.; Liang, Z.; Cui, H. Labour migration as a new determinant of income growth in rural China. Popul. Res. 2004, 28, 2–10. [Google Scholar]
  16. Gao, J.; Song, G. Impact of Rural Labor Transfer Scale on Farmland Transfer. Econ. Gerogr. 2020, 40, 172–178. [Google Scholar]
  17. Lieskovský, J.; Bezák, P.; Špulerová, J.; Lieskovský, T.; Koleda, P.; Dobrovodská, M.; Burgi, M.; Gimmi, U. The abandonment of traditional agricultural landscape in Slovakia—Analysis of extent and driving forces. J. Rural Stud. 2015, 37, 75–84. [Google Scholar] [CrossRef]
  18. Xu, D.; Deng, X.; Guo, S.; Liu, S. Labor migration and farmland abandonment in rural China: Empirical results and policy implications. J. Environ. Manag. 2018, 232, 738–750. [Google Scholar] [CrossRef]
  19. Gao, T.M.; Anna, L.; Vasilii, Y. Sustainable Rural Development in Northern China: Caught in a Vice between Poverty, Urban Attractions, and Migration. Sustainability 2018, 10, 1467. [Google Scholar]
  20. Liao, L.W.; Long, H.L.; Ma, E.P. Rural Labor Change and Farmland Use Transition. Econ. Geogr. 2021, 41, 148–155. (In Chinese) [Google Scholar]
  21. Qu, Y.B.; Zhao, L.J.; Chai, Y.F.; Li, Y.F.; Zhu, W.Y.; Ping, Z.L. Multidimensional form identification and targeted governance of hollow villages from the rural revitalization perspective: Taking Fangsi Town of Yucheng City in Shangdong Province as an example. Resour. Sci. 2021, 43, 776–789. (In Chinese) [Google Scholar]
  22. Ma, L.; Long, H.L.; Zhang, Y.N.; Tu, S.S.; Ge, D.Z. Spatio-temporal coupling relationship between agricultural labor changes and agricultural economic development at county level in China and its implications for rural revitalization. Acta Geogr. Sin. 2018, 73, 2364–2377. (In Chinese) [Google Scholar]
  23. Yang, M.N.; Zhang, Y.; Yang, Q.S.; Liu, J.; Huang, F. Coupling Relationship between Agricultural Labor and Agricultural Production Against the Background of Rural Shrinkage: A Case Study of Songnen Plain, China. Sustainability 2019, 11, 5804. [Google Scholar] [CrossRef] [Green Version]
  24. Brown, C.; Lava, P.Y.; Zhang, J.; Zhouma, D.Q. Sustainability of Agricultural Diversity in the Farm Households of Southern Tibet. Sustainability 2019, 11, 5756. [Google Scholar] [CrossRef] [Green Version]
  25. Lu, H.; Xie, H.; Yao, G. Impact of land fragmentation on marginal productivity of agricultural labor and non-agricultural labor supply: A case study of Jiangsu, China. Habitat Int. 2019, 83, 65–72. [Google Scholar] [CrossRef]
  26. Feng, S. Land rental, off-farm employment and technical efficiency of farm households in Jiangxi Province, China. NJAS Wagening. J. Life Sci. 2008, 55, 363–378. [Google Scholar] [CrossRef] [Green Version]
  27. Ma, L.; Long, H.; Zhang, Y.; Tu, S.; Ge, D.; Tu, X. Agricultural labor changes and agricultural economic development in China and their implications for rural vitalization. J. Geogr. Sci. 2019, 29, 163–179. [Google Scholar] [CrossRef] [Green Version]
  28. Robson, J.P.; Berkes, F. Exploring some of the myths of land use change: Can rural to urban migration drive declines in biodiversity? Glob. Environ. Chang. 2011, 21, 844–854. [Google Scholar] [CrossRef]
  29. Gollin, D.; Parente, S.; Rogerson, R. The role of agriculture in development. Am. Econ. Rev. 2002, 92, 160–164. [Google Scholar] [CrossRef] [Green Version]
  30. Sherlund, S.M.; Barrett, C.B.; Adesina, A.A. Smallholder technical efficiency controlling for environmental production conditions. J. Dev. Econ. 2002, 69, 85–101. [Google Scholar] [CrossRef]
  31. Eberhardt, M.; Vollrath, D. The effect of agricultural technology on the speed of development. World Dev. 2016, 109, 483–496. [Google Scholar] [CrossRef]
  32. Long, H.L.; Tu, S.S.; Ge, D.Z.; Li, T.T.; Liu, Y.S. The allocation and management of critical resources in rural China under restructuring: Problems and prospects. J. Rural Stud. 2016, 47, 392–412. [Google Scholar] [CrossRef] [Green Version]
  33. Guo, Y.; Zhou, Y.; Han, Y. Population aging in rural China: Spatial-temporal pattern and countermeasures for rural revitalization. Geogr. Res. 2019, 38, 667–683. (In Chinese) [Google Scholar]
  34. Ge, D.Z.; Long, H.L.; Zhang, Y.N.; Tu, S.S. Analysis of the coupled relationship between grain yields and agricultural labor changes in China. J. Geogr. Sci. 2018, 28, 93–108. [Google Scholar] [CrossRef] [Green Version]
  35. Kyle, E. Agricultural productivity and the sectoral reallocation of labor in rural India. J. Dev. Econ. 2018, 135, 488–503. [Google Scholar]
  36. Zhou, Y.; Guo, Y.; Liu, Y. Areal types and their development paths in rural China. Geogr. Res. 2019, 38, 467–481. (In Chinese) [Google Scholar]
  37. Zhang, H. Research on Rural Labor Transfer under the Background of Urban-Rural Development in Chongqing; Southeast University: Chongqing, China, 2011. [Google Scholar]
  38. Yu, F. The Effects of the Rural Labor Transfer on Agricultural Production in Chongqing—Based on the Investigation of 402 Peasant Households in Chongqing; Sichuan Agricultural University: Chengdu, China, 2013. [Google Scholar]
  39. Liu, Y.; Li, Y. Spatio-temporal coupling relationship between farmland and agricultural labor changes at county level in China. Acta Geogr. Sin. 2010, 65, 1602–1612. (In Chinese) [Google Scholar]
  40. Wang, Y.H.; Xin, L.J.; Zhang, H.Z.; Li, Y.Q. An Estimation of the Extent of Rent-Free Farmland Transfer and Its Driving Forces in Rural China: A Multilevel Logit Model Analysis. Sustainability 2019, 11, 3161. [Google Scholar] [CrossRef] [Green Version]
  41. Chen, R.; Ye, C.; Cai, Y.; Xing, X.; Chen, Q. The impact of rural out-migration on land use transition in China: Past, present and trend. Land Use Policy 2014, 40, 101–110. [Google Scholar] [CrossRef]
  42. Wang, Y.; Li, Y. Promotion of degraded land consolidation to rural poverty alleviation in the agro-pastoral transition zone of northern China—Science Direct. Land Use Policy 2019, 88, 104114. [Google Scholar] [CrossRef]
  43. Xu, D.; Yong, Z.; Deng, X.; Zhuang, L.; Qing, C. Rural-urban migration and its effect on land transfer in rural China. Land 2020, 9, 81. [Google Scholar] [CrossRef] [Green Version]
  44. Fu, C.; Liu, Y. Coordinated development between land use change and population change in urbanizing China. Econ. Geogr. 2013, 33, 47–51. (In Chinese) [Google Scholar]
  45. Liu, Y.; Wang, Y. Rural land engineering and poverty alleviation: Lessons from typical regions of China. J. Geogr. Sci. 2019, 29, 643–657. [Google Scholar] [CrossRef] [Green Version]
  46. Wang, Y.; Liu, Y. New material for transforming degraded sandy land into productive farmland. Land Use Policy 2020, 92, 104477. [Google Scholar] [CrossRef]
  47. Yu, Y.; Xu, T.; Wang, T. Outmigration drives cropland decline and woodland increase in rural regions of southwest China. Land 2020, 9, 443. [Google Scholar] [CrossRef]
Figure 1. Administrative division map of the study site.
Sustainability 13 08780 g001
Figure 2. Framework between agricultural labor transfer, agricultural economic development, and farmland use.
Sustainability 13 08780 g002
Figure 3. (a) Spatial–temporal pattern of agricultural labor force changes in districts of Chongqing from 2000 to 2010; (b) Spatial–temporal pattern of agricultural labor force changes in districts of Chongqing from 2010 to 2018; (c) Spatial–temporal pattern of agricultural labor force changes in districts of Chongqing from 2000 to 2018. Note: Data came from China Statistical Yearbook (County Level) (2001–2019) and Chongqing planning and Natural Resources Bureau.
Sustainability 13 08780 g003
Figure 4. (a) Spatial–temporal pattern of economy–labor of Chongqing from 2000 to 2010; (b) Spatial–temporal pattern of economy–labor of Chongqing from 2010 to 2018; (c) Spatial–temporal pattern of economy–labor of Chongqing from 2000 to 2018. Note: Data came from China Statistical Yearbook (County Level) (2001–2019) and Chongqing planning and Natural Resources Bureau.
Sustainability 13 08780 g004
Figure 5. (a) Spatial–temporal pattern of agricultural economic development of Chongqing from 2000 to 2010; (b) Spatial–temporal pattern of agricultural economic development of Chongqing from 2010 to 2018; (c) Spatial–temporal pattern of agricultural economic development of Chongqing from 2000 to 2018. Note: Data came from China Statistical Yearbook (County Level) (2001–2019) and Chongqing planning and Natural Resources Bureau.
Sustainability 13 08780 g005
Figure 6. (a) Spatial–temporal pattern of labor–farmland of Chongqing from 2000 to 2010; (b) Spatial–temporal pattern of labor–farmland of Chongqing from 2010 to 2018; (c) Spatial–temporal pattern of labor–farmland of Chongqing from 2000 to 2018. Note: Data came from China Statistical Yearbook (County Level) (2001–2019) and Chongqing planning and Natural Resources Bureau.
Sustainability 13 08780 g006
Figure 7. (a) Spatial–temporal pattern of farmland area change of Chongqing from 2000 to 2010; (b) Spatial–temporal pattern of farmland area change of Chongqing from 2010 to 2018; (c) Spatial–temporal pattern of farmland area change of Chongqing from 2000 to 2018. Note: Data came from China Statistical Yearbook (County Level) (2001–2019) and Chongqing planning and Natural Resources Bureau.
Sustainability 13 08780 g007
Figure 8. (a) Spatial–temporal pattern of labor–farmland–economy of Chongqing from 2000 to 2010; (b) Spatial–temporal pattern of labor–farmland–economy of Chongqing from 2010 to 2018; (c) (c) Spatial–temporal pattern of labor–farmland–economy of Chongqing from 2000 to 2018. Note: Data came from China Statistical Yearbook (County Level) (2001–2019) and Chongqing planning and Natural Resources Bureau.
Sustainability 13 08780 g008
Table 1. Characteristics of rural labor–farmland elastic.
TypeLCRFCRLFECCharacteristics of Rural Labor–Farmland Elastic
Labor–Farmland Recession TypeLCR > 0FCR > 0LFEC > 1The growth rate of agricultural labor force is faster than that of farmland
Labor–Farmland Growth TypeLCR > 0FCR > 00 < LFEC < 1The growth rate of agricultural labor force is slower than that of farmland
Labor–Farmland Recession TypeLCR > 0FCR < 0LFEC < 0The agricultural labor force has increased and the farmland has decreased
Labor–Farmland Growth TypeLCR < 0FCR > 0LFEC < 0The agricultural labor force has decreased and the farmland has increased
Labor–Farmland Growth TypeLCR < 0FCR < 0LFEC > 1The reduction rate of agricultural labor force is faster than that of farmland
Labor–Farmland Recession TypeLCR < 0FCR < 00 < LFEC < 1The reduction rate of agricultural labor force is slower than that of farmland
Table 2. Characteristics of rural economy–labor elastic.
TypeECRLCRELECCharacteristics of Rural Economy–Labor Elastic
Economy–Labor Growth TypeECR > 0LCR > 0ELEC > 1The growth rate of agricultural economy is faster than that of labor force
Economy–Labor Extensive TypeECR > 0LCR > 00 < ELEC < 1The growth rate of agricultural economy is slower than that of labor force
Economy–Labor Intensive TypeECR > 0LCR < 0ELEC < 0The agricultural economy has increased and the labor force has decreased
Economy–Labor Backward TypeECR < 0LCR > 0ELEC < 0The agricultural economy has decreased and the labor force has increased
Economy–Labor Decline TypeECR < 0LCR < 0ELEC > 1The reduction rate of agricultural economy is faster than that of labor force
Economy–Labor Recession TypeECR < 0LCR < 00 < ELEC < 1The reduction rate of agricultural economy is slower than that of labor force
Table 3. Coupling classification and characteristics of the rural labor–farmland–economy structure.
Labor–Farmland Elastic CoefficientEconomy–Labor Elastic CoefficientTypes of The Rural Labor–Farmland–Economy CouplingTypes of Coordination
Labor–Farmland Growth Type (LFGT)Economy–Labor Intensive Type (ECIT)Labor–Farmland Growth Type and
Economy–Labor Intensive Type
1 High coordination
Economy–Labor Growth Type (ECGT)Labor–Farmland Growth Type and
Economy–Labor Growth Type
2 Intermediate coordination
Economy–Labor Extensive Type (ECET)Labor–Farmland Growth Type and
Economy–Labor Extensive Type
3 Primary coordination
Economy–Labor Backward Type (ECBT)Labor–Farmland Growth Type and
Economy–Labor Backward Type
4 On the verge of disorders
Economy–Labor Recession Type (ECRT)Labor–Farmland Growth Type and
Economy–Labor Recession Type
5 Mild disorders
Economy–Labor Decline Type (ECDT)Labor–Farmland Growth Type and
Economy–Labor Decline Type
6 Moderate disorders
Labor–Farmland Recession Type (LFRT)Economy–Labor Intensive Type (ECIT)Labor–Farmland Recession Type and
Economy–LaborIntensive Type
2 Intermediate coordination
Economy–Labor Growth Type (ECGT)Labor–Farmland Recession Type and
Economy–Labor Growth Type
3 Primary coordination
Economy–Labor Extensive Type (ECET)Labor–Farmland Recession Type and
Economy–Labor Extensive Type
4 On the verge of disorders
Economy–Labor Backward Type (ECBT)Labor–Farmland Recession Type and
Economy–Labor Backward Type
5 Mild disorders
Economy–Labor Recession Type (ECRT)Labor–Farmland Recession Type and
Economy–Labor Recession Type
6 Moderate disorders
Economy–Labor Decline Type (ECDT)Labor–Farmland Recession Type and
Economy–Labor Decline Type
7 Serious disorders
Table 4. Transformation characteristics of coupling types in the labor–farmland–economy structure.
T1T2
High Coordination (%)Intermediate Coordination (%)Primary Coordination (%)On The Verge of Disorders (%)Mild Disorders (%)Moderate Disorders (%)Serious Disorders (%)Reduction (%)
High coordination (%)16.222.705.410.002.700.000.0010.81
Intermediate Coordination (%)21.620.005.410.008.110.002.7037.84
Primary Coordination (%)16.2213.515.410.000.000.000.0029.73
On The Verge of Disorders (%)0.000.000.000.000.000.000.000.00
Mild Disorders (%)0.000.000.000.000.000.000.000.00
Moderate Disorders (%)0.000.000.000.000.000.000.000.00
Serious Disorders (%)0.000.000.000.000.000.000.000.00
New Increment37.8416.2210.810.0010.810.002.70
Net Growth27.03−21.62−18.920.0010.810.002.70
Note: “New increment” means the difference between the percentage of the number of counties of each type in the total number of counties in this study during the time period of T2 and the percentage of such unchanged counties in the total number of counties in this study during the time period of T1–T2. “Decrement” means the difference between the percentage of the number of counties of each type in the total number of counties in this study during the time period of T1 and the percentage of such unchanged counties of this type in the total number of counties in this study during the time period of T1–T2. The net growth refers to the difference between the new increment and the decrement.
Publisher’s Note: MDPI stays neutral with regard to jurisdictional claims in published maps and institutional affiliations.

