Abstract
Firms aim at achieving their economic interests without neglecting the needs of local and regional communities and the environment itself. The process involves defining and implementing Social Responsibility strategies that leverage organizational competitiveness and sustainability. In this context, the current study purposes to demonstrate how Corporate Social Responsibility (CSR) and a sustainable orientation influence the satisfaction and loyalty of academic tourists to the Metro of Porto (in Portugal). More specifically, our study aims to assess the satisfaction of academic tourists with the Metro of Porto and, additionally, to analyze the variables that determine the satisfaction and loyalty of these tourists to this specific transport company, which has never been achieved before. Our proposed research model seeks to determine how CSR and a sustainable orientation influence academic tourists’ loyalty to the Metro of Porto transport services as well as their link to Service Quality, Perceived Value, Corporate Image and Tourist Satisfaction. From a sample of 256 academic tourists, customers of the Metro of Porto, a quantitative analysis was carried out using the structural equation model (SEM-PLS). The results obtained allow us to conclude that CSR and Service Quality have an impact on academic tourists’ satisfaction and loyalty to the Metro of Porto. The development of a region is intrinsically linked to transport networks that promote the integration and growth of productive systems. Our results demonstrate the relationship between regional development and business sustainability strategies that integrate Social Responsibility practices. We show the importance that Social Responsibility policies have for companies as a precursor to customer satisfaction and loyalty to a company. Hence, as a guarantee of obtaining economic results, firms must simultaneously contribute to the sustainable development of territories.
1. Introduction
Academic tourism is an important opportunity for the tourism industry and for the growth of academic knowledge [1]. Thus, the continued growth of academic tourism has provided opportunities for tour operators, as well as for educational service providers, so that students have become a potential source of long-term investments for destinations [2]. In addition, transport and mobility opportunities in tourist destinations are extremely relevant for academic tourism, especially as a result of the fact that transport can be considered as a primary factor in tourism [3]. More specifically, the unavailability of transport will negatively affect the image of a particular tourist destination, which will, therefore, lead to a reduction in the likelihood that that destination will be visited again [4,5,6,7,8]. However, while academic tourism has been one of the fastest growing tourism alternatives in the tourism and travel industry over the past 40 years, this area has been ignored by tourism and marketing professionals [3]. Similarly, although transport infrastructure provides the basis for transport services, this has been an often-overlooked element in the literature [9]. Accordingly, and in view of the importance attributed to academic tourism, as well as to the transport that enables tourism in general, the present investigation aims to assess the satisfaction of academic tourists with Metro do Porto and also analyze the variables that determine the satisfaction and loyalty of these tourists to this transport company.
The justification of the present investigation is based on the premise that the development of tourism in any region is directly dependent on the development of the transport system. In this sense, the understanding of the use of the transport system by its users is of paramount importance to increase the competitiveness of the destination, since the availability and quality of transport from a given destination have a significant impact on the tourist experience and, consequently, on their satisfaction [4]. In addition, the transport system plays a significant role in the development of tourism, as it enables the creation and successful development of new attractions, in addition to stimulating the growth of existing attractions [10].
This paper is divided into six parts. In addition to this brief introduction, the present investigation is structured in five other sections. The following is the theoretical framework, in which academic tourism, transport and regional development are discussed, as well as the mediators of satisfaction and loyalty in Metro do Porto. Then, the research method used and the research hypotheses established to achieve the objectives proposed in that research are exposed. Subsequently, the results are presented, constituting the focal point of the investigation and, finally, the main conclusions obtained in this study are presented.
2. Literature Review
2.1. Academic Tourism
There is a gap in the literature regarding the definition of academic tourism; however, it can be characterized as a stay of usually less than a year, spent for academic reasons, outside the usual environment of a particular individual, with the aim of completing an academic degree in a university or attending language courses offered by these institutions [11]. Adding to that, academic tourism can contribute substantially to the development of the tourism sector more broadly [12], since characteristics such as change, leadership and innovation are prevalent in academic tourism [13].
Academic tourism can be characterized by two aspects, related to domestic academic tourism, carried out by students who move to study within their own country, or with international academic tourism, in which students go beyond the borders of their own countries [14]. In addition, given its characteristics, academic tourism can be considered as more sustainable than conventional tourism because it has a greater relative economic impact than conventional tourism (i.e., it is more efficient), does not generate significant impacts on the environment, and contributes to socio-cultural sustainability (i.e., it enables the expansion of knowledge through the interrelationships between different students with different backgrounds) [15,16]. In this sense, academic tourism has a series of elements that distinguish it from traditional tourism, such as the length of stay, rental patterns of accommodation and the large consumption of local goods, while maintaining similarities with conventional tourism, such as standard choice of destination or frequency of sightseeing [17].
Ref. [2], when investigating the economic and non-economic determinants of academic tourism demand, using panel data from 31 countries during the period from 2000 to 2010, found empirical evidence that transport costs together with variables such as living standards and relative prices between different countries are determining factors for modeling demand for international academic tourism. In the same sense, the authors of [11], when evaluating the determinants of demand for academic tourism in Galicia, Spain, using a sample of 324 observations from a panel composed of students from 36 countries during the period between 2001 and 2009, found evidence that among the economic factors analyzed, only the cost of travel was significant to model the demand for academic tourism. With regard to the economic impacts of academic tourism, the authors of [17] point out that the economic effects of this type of tourism remain small and that its economic impact is mainly driven by student spending channels, according to an assessment using panel data from 29 European countries during the 2000–2016 period.
2.2. Transport and Regional Development
Among the multiple factors related to the attractiveness of a given destination, from a tourist perspective, accessibility is one of the factors that is of great relevance. Although a given region has important tourist attractions, such as beautiful natural landscapes, beaches and historic monuments, its success as a tourist destination depends largely on the transport infrastructure, which must be convenient, comfortable and safe [18]. It has also been found that tourists will be more likely to change their tourist destinations if they are inhibited in any way by inefficiencies in the transport system [19]. The transport infrastructure promotes easy access to tourist destinations in addition to enabling an increase in business activities in a given region, substantially impacting the living standards of its residents [20]. In this sense, the development of infrastructure and the sustainable development of a region are closely related, so that the infrastructure system is an important basis for the construction and implementation of the local development of a given region, exercising a direct influence on this development by bringing tourist opportunities to less frequented areas [21]. In addition, it is known that infrastructure is also an essential element for the development of the described function in the most valuable natural areas [22].
More exactly, tourist flows tend to be concentrated in areas that have a greater number of attractions and other well-developed objects of tourist interest; one of the criteria of great relevance for this concentration is the available infrastructure in which they are inserted. Transport can, in turn, be one of the fundamental elements for regional development, since an efficient transport system in all areas can favor the development of tourism in other less visited or internationally famous areas [23].
When assessing the importance of transport infrastructure in the attractiveness of a tourist destination, using panel data from 28 countries during the 1990–2000 period, the authors of [9] found empirical evidence that transport infrastructure has significant influence in the flow of tourism to a given destination.
Similarly, the authors of [24], when investigating the factors that impact the satisfaction of tourists in a city in Vietnam, found empirical evidence that, among other factors such as historical and cultural attractions, infrastructure services have a significant impact on the satisfaction of tourists. In the same sense, the authors of [25] identified, through an exploratory investigation using a sample of 155 tourists in Vietnam, that infrastructure services, together with the safety of tourists, are a factor of significant influence for the profitability of tourism companies.
Specifically, with regard to academic tourism, the authors of [26], when assessing the critical determinants of the selection of tourist destinations by students from countries such as Canada, Poland and Trinidad and Tobago, found evidence that the quality and efficiency of transportation services’ locations are determinant factors for the choice of students, being closely related to their ease of use and the costs associated with their use.
2.3. Mediators of Satisfaction and Loyalty to Metro do Porto
Social Responsibility has come to be seen as a key factor for companies to contribute to sustainable development and achieve competitive advantages. Corporate Social Responsibility consists of the voluntary adoption of policies, strategies and measures that contribute to a more equitable society and a less polluted environment. According to the authors of [27], Social Responsibility for companies can be understood as an investment that creates benefits for the company, society and the environment. In this way, Social Responsibility can be integrated as a policy or into the main business strategies, allowing the organization to improve its competitive advantage, which can be a relevant component to differentiate itself from the competition and maintain sustainable relationships with stakeholders [28]. In the wake of the understanding of Social Responsibility and its effects, as a strategy that fosters the growth of corporate profitability and stimulates the customer’s perception, the customer will look for companies whose products will be able to satisfy them and simultaneously involve social sustainability and environmental practices. In this way, Social Responsibility strengthens the company’s image towards customers and society. Implementing an SR policy is, therefore, relevant and essential for sustainable operations and the long-term development of a company. The adoption of good Social Responsibility practices is a differentiating and enhancing element of the image of companies, territories and tourist destinations in which they are inserted [29]. This sense of responsibility contributes to regional and local development and the image of tourist destinations with national and international tourists. To sum up, Social Responsibility is recognized as an ethical theory comprising the civic duty of individuals as well as their underlined actions to benefit the welfare of the society.
Within the concept of customer loyalty there are several academic and scientific works, which address the evolution and the different points of the concept loyalty as well as analyze the variables that foster Customer Satisfaction and Loyalty. According to several scientific studies, in the area of service marketing, which point to the importance of companies assessing the determinants of Customer Satisfaction and Loyalty, the authors of [30,31,32,33,34,35,36,37,38,39,40,41,42,43,44,45,46] also argue that customer loyalty should be seen as a commitment established in the mission and culture of business organizations. Therefore, organizations must develop their operations without neglecting Social Responsibility, Quality of Service, Perceived Value, Corporate Image, and Customer Satisfaction since these studies concluded that these dimensions contribute positively to the promotion of customer loyalty.
Thriving companies balance profitability and profit objectives with social objectives, incorporating social and environmental concerns into their main operation, policies and business strategy [47]. The present work aims to show the response of a transport company to meet the needs, when the company’s image can be environmentally friendly and socially responsible and, consequently, bring reflections at the level of the destination for academic tourists.
3. Methodology
The main objective of the study is to evaluate the Satisfaction and Behavioral Intentions of academic tourists in relation to Metro do Porto; more specifically, it is intended to analyze how Social Responsibility can affect the loyalty of academic tourists as users/customers, through their interaction with the Quality of Service, the Corporate Image, the Perceived Value and Satisfaction of the academic tourist. As a data collection instrument, a questionnaire survey was used, adapted from [30], to assess the perception of academic tourists in relation to the transport company Metro do Porto. Subsequently, data were collected from this research study, through a questionnaire survey, applied to 256 students, who elected higher education institutions in the city of Porto and are users of the transport service of the company Metro do Porto. To successfully achieve random selection, the researchers received a list of students meeting the criteria and randomly selected 256 people from this list.
The application of the questionnaire was carried out in 2019, the questionnaires were prepared on the Google platform and also on paper, and were distributed in person, at Metro do Porto stations/stops, to students who moved from their areas of residence to carry out their studies, at Higher Education Institutions (HEI) in the city of Porto, and also disseminated through the network of authors and friends, through email and Facebook, to academic tourists who use Metro do Porto’s transport services [48,49,50,51,52]. The questionnaire is structured in three parts, the first part is composed of questions related to the characterization of the perception of the quality of transport service, Social Responsibility, and also the antecedents of Satisfaction and Behavioral Intentions of the academic tourist, such as: the Perceived Value and the Corporate Image of Metro do Porto. The second part refers to the characterization of the use of transport by the academic tourist. The third part seeks to obtain the sociodemographic characteristics of the respondents. To measure the importance of attributes, the Likert scale was used, which has five possible answers: 1—Totally disagree (TD); 5—Totally agree (TA).
After data collection, statistical treatment was carried out, which was processed with the help of the SPSS program-Statistical Package for Social Sciences, version 21. For the treatment of the information provided by the data, descriptive statistics techniques were used. In the characterization of the results, tables of relative and absolute frequencies were used, as well as the statistical measures: minimum, maximum, average and standard deviation. For the evaluation of the psychometric properties of the latent variables of the first order of Corporate Social Responsibility and Quality of Service, and for the analysis of the measurement model and the structural model, the software Amos (v.21, SPSS Inc., Chicago, IL, USA) was used using the maximum likelihood method applied to the original items. The results obtained were considered in the adjustment analysis: for the comparative fit index (CFI), which must be greater than 0.9, for the Parsimony Gooddness of Fit Index (PGFI), which must be greater than 0.6, and for the root mean square error of approximation (RMSEA), which must be less than 0.10, in order to consider the quality of the adjustment good. In the confirmatory factor analysis, the Cronbach’s Alpha coefficient and the composite reliability were used as reliability measures, considering that composite reliability values above 0.7 indicate an appropriate construct reliability. For Cronbach’s Alpha values between 0.7 and 0.8, the internal consistency is reasonable, for values between 0.8 and 0.9, the consistency is good, and for values above 0.9, the consistency is very good [53]. Validity is the property of the instrument and consists of three components: factorial, convergent and discriminant. Factorial validity is generally assessed by standardized factorial weights, it is usual to assume that if these are at least 0.5, the factor has factorial reliability. The square of the standardized factorial weights designates the individual reliability of the item; this is appropriate if the value obtained is at least 0.25. Convergent validity occurs when the items are a reflection of a factor, that is, they are strongly saturated in that factor; in other words, the behavior of the items is essentially explained by this factor. This validity is assessed using the average extracted variance (AVE); if this value is at least 0.5, then there is adequate convergent validity. In turn, the discriminating validity assesses whether items that reflect one factor are not correlated with other factors. The discriminant validity is demonstrated by calculating the correlation coefficients of the constructs that must present statistically significant values and the values of the square root of the AVE that must be higher than the correlations between the constructs [54].
The defined methodology enables the answering of the study objectives according to the development of the research model based on a previous study [30], which makes it possible to obtain the necessary data for the development of a conceptual model that aims to assess: (1) Social Responsibility contributes directly to the perceived Quality of Service, the Corporate Image, the Perceived Value, the Satisfaction and the Behavioral Intentions of academic tourists; (2) the quality of the perceived service directly influences the Satisfaction of the academic tourist, the Brand Image, the Perceived Value and the Behavioral Intentions; (3) the Perceived Value contributes directly to the Satisfaction of the academic tourist and to the Corporate Image; (3) the Corporate Image contributes directly to the Satisfaction and Behavioral Intentions of the academic tourist; (5) academic Tourist Satisfaction contributes directly to their Behavioral Intentions (intention to return and service recommendation). To this extent, this model aims to respond to the following research hypotheses:
Hypothesis 1 (H1).
Corporate Social Responsibility (CSR) has a direct influence on Service Quality.
Hypothesis 2 (H2).
Social Responsibility has a direct impact on Perceived Value and Corporate Image.
Hypothesis 3 (H3).
Service Quality has a direct impact on the Corporate Image and Perceived Value.
Hypothesis 4 (H4).
CSR, QS, Perceived Value and Corporate Image have a direct and positive influence on academic Tourist Satisfaction.
Hypothesis 5 (H5).
The Satisfaction of academic tourists has a direct impact on their Behavioral Intentions.
Hypothesis 6 (H6).
The Quality of Service has a direct influence on the Behavior Intentions of the academic tourist.
Hypothesis 7 (H7).
Corporate Social Responsibility contributes directly and positively to the Behavioral Intentions of the academic tourist.
Hypothesis 8 (H8).
The Corporate Image contributes positively and significantly to the Behavioral Intentions of the academic tourist.
4. Data Analyses and Discussion
4.1. Sociodemographic Characterization and Transport Utilization Process
The sample is composed of 256 students who chose educational institutions, located in the city of Porto, to carry out their studies, and use Metro do Porto for travel, of which 54.7% (140) are female. It is observed that 23% attend secondary education (59) and 77% (197) attend higher education. As for the average annual income, it is verified that 51.2% (127) stated that it varied between 10,000 and 27,500 euros. The majority, 65.6% (168), answered that they had a driving license and 60.5% (155) stated that they did not have a motor vehicle. It is observed that the majority, 60.2% (154), have a pass, and that 55.9% (143) are frequent customers. In fact, 42.2% (108) said they used the metro almost every day and 25.4% (65) said they did it one to four times a week. The most relevant reason for using the metro is commuting to school. The majority of students, 57% (146), reported that they did not transfer between metro trains. Regarding the waiting time at the stop, it is observed that in 87.9% (225) of the cases it is less than 10 min.
4.2. Evaluation of the Measurement Model and the Structural Model
4.2.1. Assessment of the Psychometric Properties of Latent Variables of the First Order of the Perception of Social Responsibility
The absolute values of asymmetry and flatness are within the limits proposed by [55] for all constructs, which allows the assumption of normality; therefore, according to [56], given a set of variables that have a normal univariate distribution, the conditioned distribution of the variables is normal multivariate. The estimated model showed a good adjustment, according to the adjustment quality indicators used: CFI = 0.943; PGFI = 0.645; RMSEA = 0.072.
Regarding the reliability of the constructs, it is observed that the values of composite reliability vary between 0.839 and 0.955, exceeding the cut-off point of 0.70 that is considered acceptable. The reliability measured by Cronbach’s Alpha coefficient is also an indicator of good results since the minimum observed was 0.729. This is appropriate if the value obtained is at least 0.25, which is verified in this study (Table 1). In terms of the individual reliability of the items, all standardized coefficients have values greater than 0.5 (Table 1), which translates into factorial reliability. The square of the standardized factorial weights designates the individual reliability of the item; this is appropriate if the value obtained is at least 0.25, which is verified in this study (Table 1). Convergent validity, composite reliability (CR) and average extracted variance (AVE) were calculated for the measurement model, as shown in Table 2. The convergent validity is assessed through the average extracted variance (AVE), which is intended to be at least 0.5. Table 2 shows that the AVE values vary between 0.463 (close to 0.5) and 0.818, which translates into the verification of convergent validity.

Table 1.
Statistics of the Social Responsibility Model.
Table 2.
Reliability and validity measures, correlations between the dimensions of Social Responsibility.
In turn, the discriminating validity assesses whether items that reflect one factor are not correlated with other factors. The verification of the discriminant validity was performed considering the correlation coefficients of the constructs that present statistically significant values and the values of the square root of the AVE, which must be higher than the correlations between the constructs [54]; this allows us to conclude that none of the constructs verify the condition of discriminant validity, as shown in Table 2.
4.2.2. Evaluation of Psychometric Properties of Latent Variables of First Order of Perception of Quality of Service
The absolute values of asymmetry and flatness are within the limits proposed by the authors of [55] for all constructs, which allows the assumption of normality; therefore, according to [56], given a set of variables that have a normal univariate distribution, the conditioned distribution of the variables is normal multivariate. The estimated model presented a good adjustment, according to the adjustment quality indicators used: CFI = 0.859; PGFI = 0.644; RMSEA = 0.085. Regarding the reliability of the constructs, it is observed that the values of composite reliability vary between 0.899 and 0.916, exceeding the cut-off point of 0.70 that is considered acceptable. The reliability measured by Cronbach’s Alpha coefficient is also an indicator of good results, given that the minimum observed was 0.884. As for the individual reliability of the items, all standardized coefficients have values greater than 0.5 (Table 3), which translates into factorial reliability, after excluding item 33 “The Metro in Porto always has seats available” in the Response Capacity construct, which had a coefficient of less than 0.5. The square of the standardized factorial weights designates the individual reliability of the item; this is appropriate if the value obtained is at least 0.25, which is verified in this study (Table 3). The convergent validity is evaluated through the average extracted variance (AVE), which is intended to be at least 0.5. Convergent validity, composite reliability (CR) and average extracted variance (AVE) were calculated for the measurement model, as shown in Table 4. Table 4 shows that the AVE values vary between 0.604 and 0.698, which translates into the verification of convergent validity.
Table 3.
Service Quality Model Statistics.
Table 4.
Reliability and validity measures, correlations between the Service Quality dimensions.
In turn, the discriminating validity assesses whether items that reflect one factor are not correlated with other factors. The verification of the discriminant validity was performed considering the correlation coefficients of the constructs that present statistically significant values and the values of the square root of the AVE, which must be higher than the correlations between the constructs [54], which allows us to conclude that all the constructs check the condition of the discriminating validity, as shown in Table 4.
4.2.3. Measurement Model
In the validation of the measurement model relative to the proposed model, the reliability of the constructs, factorial validity, convergent validity and discriminant validity were evaluated, also following the recommendations mentioned by [57,58,59]. The estimated model presented a good adjustment, according to the indicators of the quality of the adjustment used: CFI = 0.909; PGFI = 0.663; RMSEA = 0.073. Regarding reliability, it is observed that the values of composite reliability vary between 0.758 and 0.938, exceeding the 0.70 cut off point that is considered acceptable by several authors [53,54]. The reliability measured by Cronbach’s alpha coefficient is also an indicator of good results, given that the minimum observed was 0.740. As for the individual reliability of the items, all standardized coefficients have values greater than 0.5 (Table 5), with the exception of the environment in Corporate Social Responsibility, which is approximately 0.5, which translates into factorial reliability. The square of the standardized factorial weights designates the individual reliability of the item, this is appropriate if the value obtained is at least 0.25, which is verified in this study (Table 5). Convergent validity, composite reliability (CR) and average extracted variance (AVE) were calculated for the measurement model, as shown in Table 6. The convergent validity is verified through the condition of the AVE of at least minus 0.5, it can be seen in Table 6 that the AVE values vary between 0.477 (approximately 0.5) and 0.775, which translates into the verification of convergent validity. In turn, the discriminating validity assesses whether items that reflect one factor are not correlated with other factors.
Table 5.
Measurement model statistics.
Table 6.
Reliability and validity measures, correlations between the dimensions of the measurement model.
In turn, the discriminating validity assesses whether items that reflect one factor are not correlated with other factors. The verification of the discriminant validity was performed considering the correlation coefficients of the constructs that present statistically significant values and the values of the square root of the AVE, which must be higher than the correlations between the constructs [54], which allows us to conclude that all the constructs verify the condition of the discriminating validity, as shown in Table 6. However, this condition was not always verified, because the square root of the AVE of the CSR factor is slightly lower than the correlation between the Image and CSR factors. As a consequence, the items that reflect these factors may be correlated with the other factors mentioned.
4.2.4. Characterization of the Dimensions of the Measurement Model
Table 7 presents the descriptive statistical measures of the dimensions of the scales: Corporate Social Responsibility (CSR), Service Quality (QS) and the dimensions of the measurement model: CSR, QS, Perceived Value, Image, Satisfaction and Behavioral Intentions. Given these results, it appears that, in all dimensions, they vary between a minimum of one and a maximum of five points. In average terms, it is observed that the registered values are all higher than the theoretical average value (three points), with the exception of the Environment in Social Responsibility. Therefore, it can be inferred that in all dimensions the average satisfaction exceeds the expected amount, which translates into satisfaction on the part of academic tourists. There is also some dispersion of results across all dimensions, although this is moderate.
Table 7.
Descriptive measures of the dimensions of the measurement model.
4.3. Structural Model of the Proposed Final
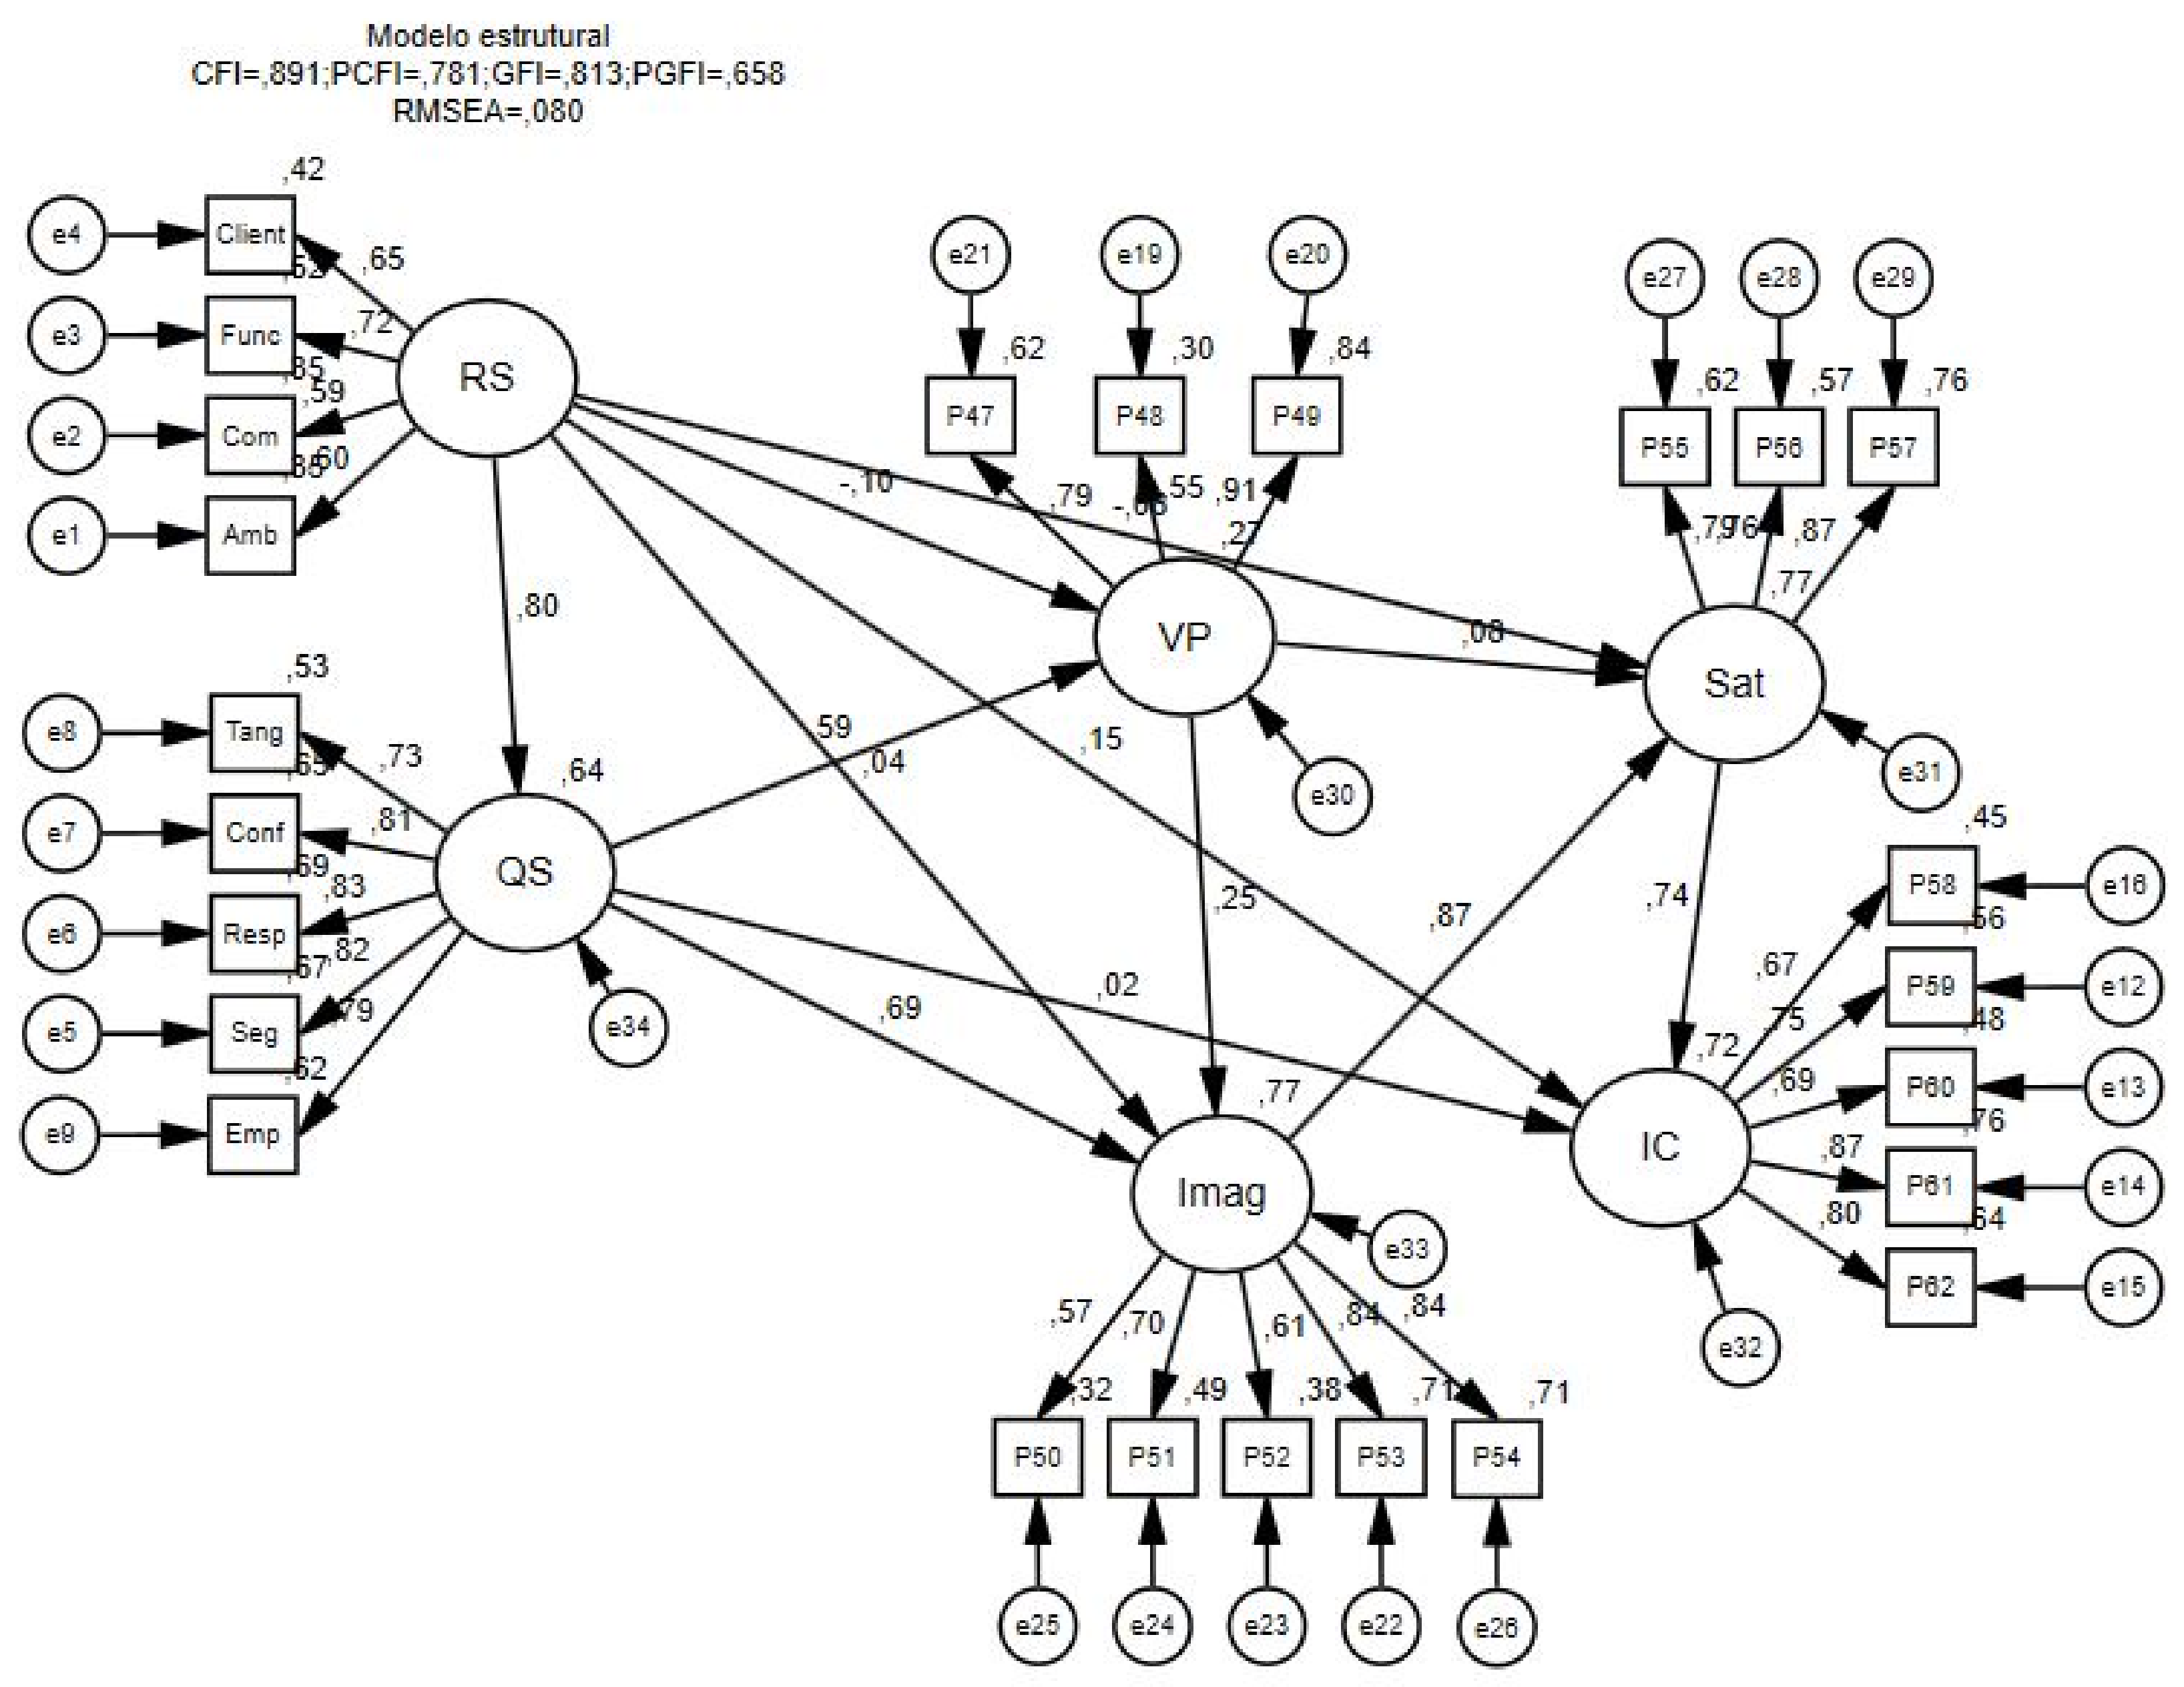
The Social Responsibility measurement model of the consumer’s Behavioural Intentions was evaluated using the Amos software (v.21, SPSS Inc., Chicago, IL, USA) using the maximum likelihood method applied to the original items. In adjusting the model, a two-step strategy was used: in the first step, the measurement model was adjusted, and in the second step, the structural model was adjusted. In assessing the quality of the model, the CFI and PGFI indexes were used, considering that they indicated an acceptable adjustment for values above 0.8 and 0.7, respectively, as previously mentioned [56]. RMSEA was also used: if it is less than 0.10 the adjustment is good and if less than 0.05 the adjustment is very good. The significance of the structural coefficients was assessed with a Z test produced by the AMOS software (Critical Ratio and p-value); the parameter estimates with p ≤ 0.05 were considered statistically significant. The estimates of the model coefficients are given in a standardized form. Therefore, it appears that the model under analysis presents a good adjustment: CFI = 0.891; PCFI = 0.781; RMSEA = 0.080. The percentage of variability in the customers’ behavioural intentions explained by the model is 72%.
The analysis of Figure 1 reveals that the direct causal trajectories: “Social Responsibility → Academic Tourist Satisfaction”; “Quality of Service → Behavioural Intentions” and “Social Responsibility → Behavioural Intentions” are not statistically significant. On the other hand, the causal trajectories of direct effects that are statistically significant are: “Social Responsibility → Service Quality” β = 0.800 and p = 0.016; “Social Responsibility → Perceived Value” β = 0.376 and p = 0.009; “Quality of Service → Corporate Image” β = 0.838 and p = 0.011; “Corporate Image → Academic Tourist Satisfaction” β = 0.865 and p = 0.007; “Academic Tourist Satisfaction → Behavioural Intentions” β = 0.741 and p = 0.019. The total statistically significant effects on Behavioural Intentions through Satisfaction are: “Social Responsibility → Behavioural Intentions” β = 0.585 and p = 0.036”; and “Image → Behavioural Intentions” β = 0.642 and p = 0.005.
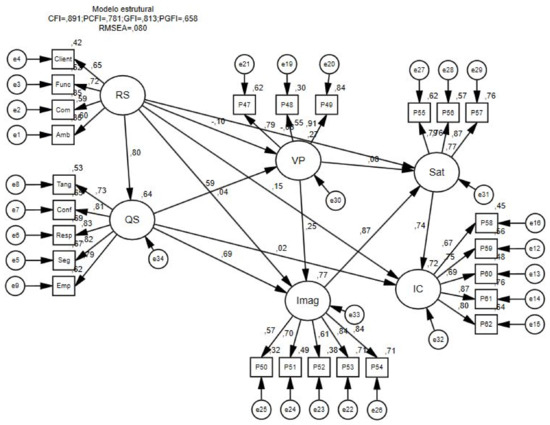
Figure 1.
Structural model. Source: Authors’ elaboration.
In this sense, it can be concluded that all investigative hypotheses have been validated, except for the sixth hypothesis that has been refuted. It can be said that Social Responsibility contributes significantly and positively to the Quality of Service, which has a positive and statistically significant impact on the Perceived Value, on the Corporate Image of Metro do Porto and on the satisfaction of the academic tourist. Social Responsibility and Service Quality contribute significantly and positively to the Perceived Value of academic tourism while using Metro do Porto. Social Responsibility, Perceived Value and Service Quality significantly influence and have a positive impact on the Corporate Image. Social Responsibility and Perceived Value significantly and positively influence the Corporate Image of this transport company. Service Quality, Perceived Value and Corporate Image contribute directly and positively to the satisfaction of academic tourists. Finally, the satisfaction of the academic tourist has a direct and positive influence on the Behavioral Intentions of Academic Tourism in relation to the transport services of Metro do Porto and, through the Satisfaction of the Academic Tourist, Social Responsibility and the Corporate Image contribute significantly to the intention of reuse and recommendation of the transport services of Metro do Porto.
5. Conclusions and Limitations
Transport promotes easy access to tourist destinations in addition to enabling the growth of business activities in a given region, substantially impacting the living standards of its residents [20]. In addition, transport and mobility opportunities in tourist destinations are extremely relevant for academic tourism, especially as a result of the fact that transport can be considered as a primary factor in tourism [3]. More specifically, the unavailability of transport will negatively affect the image of a given tourist destination, which will, therefore, lead to a reduction in the likelihood that that destination will be visited again or recommended [4]. In this sequence, this study had, as a main objective, the evaluation of how the Social Responsibility policy of Metro do Porto can affect the satisfaction and loyalty of the academic tourist, through its interaction with the Quality of Service, the Corporate Image, the Perceived Value and the Satisfaction of the tourist; these concepts play a fundamental role in the guarantee of sustainable operations and in the development of the organizations and, consequently, of the territories where they are inserted. We sought to obtain the perception of the performance of students from outside the city of Porto, who selected educational institutions in this city to carry out their training courses, in relation to the variables that integrate the research model, dimensions that reveal an impact on their satisfaction. Tourists can also provide a visualization of the capacity of this transport company, Metro do Porto, to attract and retain customers and promote a higher Quality of Service to the local community (and tourists and visitors) [60].
Overall, the results obtained through the structural model are in line with those proposed by the literature in this area, namely as pointed out in the studies by [30,61,62]. The final structural model suggests that Social Responsibility helps to reinforce the academic tourist’s loyalty to Metro do Porto through the mediating effect of this client’s satisfaction, which demonstrates that RS increases the Service Quality perceived by academic tourists from Metro do Porto, and in turn, indirectly fosters Metro do Porto’s Corporate Image and directly fosters its Perceived Value. The model also confirms that Service Quality acts as a strong mediator in the relationship between CSR, Corporate Image and Customer Satisfaction. This mediating effect explains how CSR indirectly influences Customer Satisfaction and Corporate Image through the Quality of Service perceived by academic tourism. On the other hand, research shows that tourist satisfaction works as a strong mediator in the relationship between Social Responsibility, Quality of Service and behavioural intentions of academic tourism. This finding seems to imply that offering Social Responsibility policy and a good Quality of Service to academic tourists who use Metro do Porto can be an important means to achieve the intention of reusing and recommending Metro do Porto for academic tourists. Social responsibility helps to strengthen the Corporate Image, and the Perceived Value and Satisfaction of the tourist, through the mediating effect of the Quality of Service, and fosters the loyalty of this tourist to Metro do Porto, through the mediating effect of their satisfaction. This result may be partially related to the disclosure of the CSR policy adopted by Metro do Porto, given that, according to the authors of [63], CSR promotes behavioural intentions that are consistent with customer loyalty. Additionally, the study by the authors of [64] demonstrates that customers’ perception of a company’s CSR activities is a condition for their favourable behavioural intentions towards the company. As demonstrated by the results of this study, the perception of academic tourists about the company’s CSR activities is good, especially in the Customers and Employees dimension. This indicates that this company should continue to invest in the effective dissemination of its CSR policy to its customers, to ensure the reuse and recommendation of this transport company. Briefly, the result of its CSR policy on the satisfaction and loyalty of academic tourists will be significant if the CSR actions carried out were disclosed to its customers, which will directly foster the Quality of Service and the Perceived Value and indirectly foster the Corporate Image and increase the Satisfaction of academic tourists as a result of their loyalty, as well as contributing to the sustainability of their operations and increasing the competitiveness and profitability of Metro do Porto.
This study is particularly pertinent, since it allows the identification of the variables that contribute to the Quality of Service, Customer Satisfaction and Loyalty and also makes it possible to design organizational strategies and implement action measures in order to overcome these inefficiencies and increase sustainability and business competitiveness. Undoubtedly, Metro do Porto is one of the largest light rail networks in Europe, causing very positive impacts on society and the territory, in social, environmental and economic terms. In several companies, there is a great concern to achieve Customer Satisfaction, given that it plays a fundamental role in obtaining customer loyalty and even sustainability and business development, while simultaneously stimulating the attractiveness of these territories as tourist destinations. Moreover, taking into account the rules of managing modern urban spaces, the subway and its academic users fit perfectly into the smart city and metropolitan society convention. This study presents a limitation in terms of the large robustness of the sample, due to the fact that the sample of 256 students is perhaps not largely representative. Regarding future research, it is suggested that interviews are conducted with the agents involved in a quantitative manner. The possibility of carrying our comparative studies with other cities is another future research suggestion that has been pointed out.
Author Contributions
Conceptualization, C.M.V. and C.E.W.; methodology, C.M.V. and C.E.W.; software, C.M.V.; validation, C.M.V., C.E.W., B.S., M.A.-Y.-O., V.S. and M.V.; formal analysis, C.M.V. and C.E.W.; investigation, C.M.V. and C.E.W.; resources, B.S., M.A.-Y.-O.; data curation, M.V.; writing—original draft preparation, C.M.V. and C.E.W.; writing—review and editing, B.S., M.A.-Y.-O. and M.V.; visualization, V.S.; supervision, C.M.V., B.S. and M.A.-Y.-O.; Project administration, B.S., M.A.-Y.-O. and M.V.; funding acquisition, V.S. All authors have read and agreed to the published version of the manuscript.
Funding
This research received no external funding.
Institutional Review Board Statement
Not applicable.
Informed Consent Statement
Not applicable.
Data Availability Statement
Not applicable.
Conflicts of Interest
The authors declare no conflict of interest.
References
- Pelucio-Grecco, M. Academic Tourism: A Great Opportunity. J. Tour. Hosp. 2015, 4, 1000146. [Google Scholar] [CrossRef] [Green Version]
- Bento, J.P.C. The Determinants of International Academic Tourism Demand in Europe. Tour. Econ. 2014, 20, 611–628. [Google Scholar] [CrossRef]
- Unurlu, Ç. Academic Tourism and Dynamics of Tourism Destinations. In Academic Tourism. Tourism, Hospitality & Event Management; Cerdeira Bento, J.P., Martínez-Roget, F., Pereira, E.T., Rodríguez, X.A., Eds.; Springer: Cham, Switzerland, 2021; pp. 21–43. [Google Scholar]
- Virkar, A.R.; Mallya, P.D. A Review of Dimensions of Tourism Transport Affecting Tourist Satisfaction. Indian J. Commer. Manag. Stud. 2018, 9, 72–80. [Google Scholar] [CrossRef]
- Ahmad, A.; Jamaludin, A.; Zuraimi, N.S.M.; Valeri, M. Visit Intention and Destination Image in Post-Covid-19 Crisis Recovery. Curr. Issues Tour. 2020, 1–6. [Google Scholar] [CrossRef]
- Chemli, S.; Toanoglou, M.; Valeri, M. The Impact of Covid-19 Media Coverage on Tourist’s Awareness for Future Travelling. Curr. Issues Tour. 2020, 1–8. [Google Scholar] [CrossRef]
- Toanoglou, M.; Chemli, S.; Valeri, M. The Organizational Impact of Covid-19 Crisis on Travel Perceived Risk across Four Continents. J. Organ. Chang. Manag. 2021. [Google Scholar] [CrossRef]
- Valeri, M. Tourism Risk. Crisis and Recovery Management; Emerald Publishing: Bingley, UK, 2021. [Google Scholar]
- Khadaroo, J.; Seetanah, B. The Role of Transport Infrastructure in International Tourism Development: A Gravity Model Approach. Tour. Manag. 2008, 29, 831–840. [Google Scholar] [CrossRef]
- Kaul, R.N. Dynamics of Tourism: A Trilogy, Transportation and Marketing; Sterling Publishers: New Delhi, India, 1985; Volume III. [Google Scholar]
- Rodríguez, X.A.; Martínez-Roget, F.; Pawlowska, E. Academic Tourism Demand in Galicia, Spain. Tour. Manag. 2012, 33, 1583–1590. [Google Scholar] [CrossRef]
- Bird, J.; van de Mortel, T.; Holt, J.; Walo, M. Academics’ Perceptions of Continuous and Collaborative Curriculum Review: An Australian Case Study. J. Int. Hosp. Leis. Tour. Manag. 2015, 24, 18–24. [Google Scholar] [CrossRef] [Green Version]
- Martínez-Roget, F.; Rodríguez, X.A. Academic Tourism: Conceptual and Theoretical Issues. In Academic Tourism: Perspectives on International Mobility in Europe; Cerdeira Bento, J.P., Martínez-Roget, F., Pereira, E.T., Rodríguez, X.A., Eds.; Springer: Cham, Switzerland, 2021; pp. 7–20. [Google Scholar]
- Arcodia, C.; Novais, M.A.; Cavlek, N.; Humpe, A. Educational Tourism and Experiential Learning: Students’ Perceptions of Field Trips. Tour. Rev. 2020, 76, 241–254. [Google Scholar] [CrossRef]
- Rodríguez, X.A.; Martinez-Roget, F.; Pawlowska, E. Academic Tourism: A More Sustainable Tourism. Reg. Sect. 2013, 13, 89–98. [Google Scholar]
- Rodríguez, X.A.; Martínez-Roget, F. Academic Tourism and Sustainability. In Academic Tourism; Cerdeira Bento, J.P., Martínez-Roget, F., Pereira, E.T., Rodríguez, X.A., Eds.; Springer: Cham, Switzerland, 2021; pp. 161–172. [Google Scholar]
- Pereira, E.T.; Cerdeira Bento, J.P.; Osteikaité, A. Economic Impact of Academic Tourism in European Countries. In Academic Tourism; Cerdeira Bento, J.P., Martínez-Roget, F., Pereira, E.T., Rodríguez, X.A., Eds.; Springer: Cham, Switzerland, 2021; pp. 173–185. [Google Scholar]
- Albalate, D.; Campos, J.; Jiménez, J.L. Tourism and High Speed Rail in Spain: Does the AVE Increase Local Visitors? Ann. Tour. Res. 2017, 65, 71–82. [Google Scholar] [CrossRef] [Green Version]
- Prideaux, B. The Role of the Transport System in Destination Development. Tour. Manag. 2000, 21, 53–63. [Google Scholar] [CrossRef]
- Kanwal, S.; Rasheed, M.I.; Pitafi, A.H.; Pitafi, A.; Ren, M. Road and Transport Infrastructure Development and Community Support for Tourism: The Role of Perceived Benefits, and Community Satisfaction. Tour. Manag. 2020, 77, 1–10. [Google Scholar] [CrossRef]
- Mai, A.; Thi, K.; Thi, T.; Le, T. Factors Influencing on Tourism Sustainable Development in Vietnam. Manag. Sci. Lett. 2020, 10, 1737–1742. [Google Scholar] [CrossRef]
- Kulczyk-Dynowska, A.; Stacherzak, A. Selected Elements of Technical Infrastructure in Municipalities Territorially Connected with National Parks. Sustainability 2020, 12, 4015. [Google Scholar] [CrossRef]
- Petrova, M.; Dekhtyar, N.; Klok, O.; Loseva, O. Regional Tourism Infrastructure Development in the State Strategies. Probl. Perspect. Manag. 2018, 16, 259–274. [Google Scholar] [CrossRef]
- Khuong, M.N.; Nguyen, N.A.T.; Nguyen, T.M.P. Elements Influence International Tourists’ Satisfaction. Manag. Sci. Lett. 2020, 10, 2463–2476. [Google Scholar] [CrossRef]
- Nguyena, T.L.H.; Nguyena, N.T.; Nguyen, V.C. Identifying Factors Influencing on the Profitability of Tourist Enterprises: Evidence from Vietnam. Manag. Sci. Lett. 2019, 9, 1933–1940. [Google Scholar] [CrossRef]
- Dębski, M.; Nasierowski, W. Criteria for the Selection of Tourism Destinations by Students from Different Countries. Found. Manag. 2017, 9, 317–330. [Google Scholar] [CrossRef] [Green Version]
- Pohle, G.; Hittner, J. Attaining Sustainable Growth through Corporate Social Responsibility; IBM Global Services: Somers, NY, USA, 2008. [Google Scholar]
- Carroll, A.B.; Shabana, K.M. The Business Case for Corporate Social Responsibility: A Review of Concepts, Research and Practice. Int. J. Manag. Rev. 2010, 12, 85–105. [Google Scholar] [CrossRef]
- Roseta, P.; Sousa, B.B.; Roseta, L. Determiners in the Consumer’s Purchase Decision Process in Ecotourism Contexts: A Portuguese Case Study. Geosciences 2020, 10, 224. [Google Scholar] [CrossRef]
- Chang, Y.-H.; Yeh, C.-H. Corporate Social Responsibility and Customer Loyalty in Intercity Bus Services. Transp. Policy 2017, 59, 38–45. [Google Scholar] [CrossRef]
- Ferreira, J.; Sousa, B.M.; Gonçalves, F. Encouraging the Subsistence Artisan Entrepreneurship in Handicraft and Creative Contexts. J. Enterp. Communities People Places Global Econ. 2019, 13, 64–83. [Google Scholar] [CrossRef]
- Hsin-Hui, H.; Kandampully, J.; Juwaheer, T.D. Relationships and Impacts of Service Quality, Perceived Value, Customer Satisfaction, and Image: An Empirical Study. Serv. Ind. J. 2009, 29, 111–125. [Google Scholar]
- Kim, Y.-E.; Lee, J.W. Relationship between Corporate Image and Customer Loyalty in Mobile Communications Service Markets. Afr. J. Bus. Manag. 2010, 4, 4035–4100. [Google Scholar]
- Krystallis, A.; Chrysochou, P. The Effects of Service Brand Dimensions on Brand Loyalty. J. Retail. Consum. Serv. 2014, 21, 139–147. [Google Scholar] [CrossRef]
- Lang, B. How Word of Mouth Communication Varies across Service Encounters. Manag. Serv. Qual. An Int. J. 2011, 21, 583–598. [Google Scholar] [CrossRef]
- Liu, C.-H.S.; Lee, T. Service Quality and Price Perception of Service: Influence on Word-of-Mouth and Revisit Intention. J. Air Transp. Manag. 2016, 52, 42–54. [Google Scholar] [CrossRef]
- Martínez, P.; del Bosque, I.R. CSR and Customer Loyalty: The Roles of Trust, Customer Identification with the Company and Satisfaction. Int. J. Hosp. Manag. 2013, 35, 89–99. [Google Scholar] [CrossRef]
- Meesala, A.; Paul, J. Service Quality, Consumer Satisfaction and Loyalty in Hospitals: Thinking for the Future. J. Retail. Consum. Serv. 2018, 40, 261–269. [Google Scholar] [CrossRef]
- Monteiro, A.; Veloso, C. Measuring Service Quality, Brand Image, Perceived Value, Customers’ Satisfaction and Behavioural Intentions in the Hotel Industry: A Study of the Hotel in the North of Portugal. In Proceedings of the 6th Annual EuroMed Conference of the EuroMed Academy of Business, Cascais, Portugal, 23–24 September 2013; pp. 1568–1582. [Google Scholar]
- Nadiri, H.; Hussain, K. Perceptions of Service Quality in North Cyprus Hotels. Int. J. Contemp. Hosp. Manag. 2005, 17, 469–480. [Google Scholar] [CrossRef]
- Nguyen, H.; Nguyen, H.; Nguyen, N.; Phan, A. Determinants of Customer Satisfaction and Loyalty in Vietnamese Life-Insurance Setting. Sustainability 2018, 10, 1151. [Google Scholar] [CrossRef] [Green Version]
- Sousa, B.M.; Alves, G.M. The Role of Relationship Marketing in Behavioral Intentions of Medical Tourism Services and Guest Experiences. J.Hosp. Tour. Insights 2019, 2, 224–240. [Google Scholar] [CrossRef]
- Veloso, C.; Magueta, D.; Fernandes, P.; Ribeiro, H. The Effects of Customer Satisfaction, Service Quality and Perceived Value on Behavioral Intentions in Retail Industry. In Proceedings of the Economic and Social Development Book of Proceedings, Madrid, Spain, 15–16 September 2017; pp. 330–342. [Google Scholar]
- Veloso, C.M.; Monte, A.P. Validation of a Scale of Measurement of Service Quality, Image, Customer Satisfaction and Loyalty in Traditional Trade. Tour. Manag. Stud. 2019, 15, 27–35. [Google Scholar] [CrossRef]
- Veloso, C.M.; Magueta, D.; Sousa, B.B.; Carvalho, J.L. Measuring E-Service Quality, Satisfaction and Loyalty of Customer in the Online Channel of Modern Retail. IBIMA Bus. Rev. 2020, 2020, 1–15. [Google Scholar] [CrossRef]
- Yu, W.; Ramanathan, R. Retail Service Quality, Corporate Image and Behavioural Intentions: The Mediating Effects of Customer Satisfaction. Int. Rev. Retail Distrib. Consum. Res. 2012, 22, 485–505. [Google Scholar] [CrossRef]
- Porter, M.E.; Kramer, M.R. Strategy and Society: The Link between Competitive Advantage and Corporate Social Responsibility. Harv. Bus. Rev. 2006, 84, 78–92. [Google Scholar]
- Valeri, M. Networking and Cooperation Practices in the Italian Tourism Business. J. Tour. Herit. Serv. Mark. 2016, 2, 30–35. [Google Scholar]
- Baggio, R.; Valeri, M. Network Science and Sustainable Performance of Family Businesses in Tourism. J. Fam. Bus. Manag. 2020. [Google Scholar] [CrossRef]
- Valeri, M.; Baggio, R. Increasing the Efficiency of Knowledge Transfer in an Italian Tourism System: A Network Approach. Curr. Issues Tour. 2021, 1–16. [Google Scholar] [CrossRef]
- Valeri, M.; Baggio, R. Social Network Analysis: Organizational Implications in Tourism Management. Int. J. Organ. Anal. 2020, 29, 342–353. [Google Scholar] [CrossRef]
- Valeri, M.; Baggio, R. Italian Tourism Intermediaries: A Social Network Analysis Exploration. Curr. Issues Tour. 2021, 24, 1270–1283. [Google Scholar] [CrossRef]
- Pestana, M.H.; Gageiro, J.N. Análise de Dados Para Ciências Sociais: A Complementaridade Do SPSS, 6th ed.; Robalo, M., Ed.; Sílabo Lisboa: Lisbon, Portugal, 2014. [Google Scholar]
- Hair, J.F., Jr.; Black, W.C.; Babin, B.J.; Anderson, R.E. Multivariate Data Analysis; Pearson Education: Upper Saddle River, NJ, USA, 2010; Volume 7. [Google Scholar]
- Kline, R.B. Principles and Practice of Structural Equation Modeling, 4th ed.; The Guilford Press: New York, NY, USA, 2015; Volume 2, ISBN 9781462523344. [Google Scholar]
- Marôco, J. Análise de Equações Estruturais: Fundamentos Teóricos, Software & Aplicações; ReportNumber Lda: Pero Pinheiro, Portugal, 2010; ISBN 9789899676312. [Google Scholar]
- Hair, J.F.; Ringle, C.M.; Sarstedt, M. Partial Least Squares: The Better Approach to Structural Equation Modeling? Long Range Plan. 2012, 45, 312–319. [Google Scholar] [CrossRef]
- Hair, J.F.; Ringle, C.M.; Sarstedt, M. Partial Least Squares Structural Equation Modeling: Rigorous Applications, Better Results and Higher Acceptance. Long Range Plan. 2013, 46, 1–12. [Google Scholar] [CrossRef]
- Gefen, D.; Rigdon, E.E.; Straub, D. Editor’s Comments: An Update and Extension to SEM Guidelines for Administrative and Social Science Research. Miss. Q. 2011, 35, 3–14. [Google Scholar] [CrossRef]
- Sarkar, A.; Chakraborty, P.; Valeri, M. People’s Perception on Dark Tourism: A Quantitative. Curr. Issues Tour. 2021. [Google Scholar] [CrossRef]
- Kaplan, S.; de Abreu e Silva, J.; Di Ciommo, F. The Relationship between Young People’s Transit Use and Their Perceptions of Equity Concepts in Transit Service Provision. Transp. Policy 2014, 36, 79–87. [Google Scholar] [CrossRef] [Green Version]
- Cardoso, R. Responsabilidade Social E Fidelização de Clientes Nos Transportes Públicos-Metro Do Porto. Master’s Thesis, Instituto Politécnico de Bragança, Bragança, Portugal, 2019. [Google Scholar]
- Carrigan, M.; Attalla, A. The Myth of the Ethical Consumer—Do Ethics Matter in Purchase Behaviour? J. Consum. Mark. 2001, 18, 560–578. [Google Scholar] [CrossRef] [Green Version]
- Bhattacharya, C.B.; Sen, S. Doing Better at Doing Good: When, Why, and How Consumers Respond to Corporate Social Initiatives. Califor. Manag. Rev. 2004, 47, 9–24. [Google Scholar] [CrossRef]
Publisher’s Note: MDPI stays neutral with regard to jurisdictional claims in published maps and institutional affiliations. |
© 2021 by the authors. Licensee MDPI, Basel, Switzerland. This article is an open access article distributed under the terms and conditions of the Creative Commons Attribution (CC BY) license (https://creativecommons.org/licenses/by/4.0/).