Article

Spent Coffee Grounds’ Valorization towards the Recovery of Caffeine and Chlorogenic Acid: A Response Surface Methodology Approach

by
Georgia-Christina Mitraka
1,2,
Konstantinos N. Kontogiannopoulos
1,2,
Maria Batsioula
3,
George F. Banias
3 and
Andreana N. Assimopoulou
1,2,*
1
Laboratory of Organic Chemistry, School of Chemical Engineering, Aristotle University of Thessaloniki, 54124 Thessaloniki, Greece
2
Natural Products Research Centre of Excellence (NatPro-AUTh), Center of Interdisciplinary Research and Innovation of Aristotle University of Thessaloniki (CIRI-AUTh), 57001 Thessaloniki, Greece
3
Institute for Bio-Economy and Agri-Technology (iBO), Center for Research and Technology–Hellas (CERTH), 57001 Thessaloniki, Greece
*
Author to whom correspondence should be addressed.
Sustainability 2021, 13(16), 8818; https://doi.org/10.3390/su13168818
Submission received: 29 June 2021 / Revised: 29 July 2021 / Accepted: 30 July 2021 / Published: 7 August 2021

Abstract

:
The amount of spent coffee grounds (SCGs) created, represents an environmental challenge worldwide. In this context, the aim of the present study was to exploit the potential of SCGs as a source of bioactive compounds that can be utilized in high value-added products. Thus, a cost-effective and environmentally friendly extraction technique was developed to ensure extracts with high total phenolic content and antioxidant activity, as well as significant amounts of caffeine and chlorogenic acid. Response surface methodology was implemented to evaluate the effects of the main extraction parameters (i.e., time, temperature, and ethanol-to-water ratio) and their interactions on the defined responses. The ethanol ratio was found to be the most significant variable. Then, a set of optimum values was determined (i.e., 7 min, 75 °C, and ethanol:water ratio 5:95), where the predicted values for responses were found to be 5.65% for the yield (Y1), 152.68 mg gallic acid equivalents per L for total phenolic content (Y2), 0.797 μmol Trolox equivalent per mL for the antioxidant activity (Y3), 30.5 ppm for caffeine concentration (Y4), and 17.4 ppm for chlorogenic acid concentration (Y5). Furthermore, the corresponding high experimental values from the validation experiment fitted well to these predictions, clearly clarifying the high potential of SCG extracts for use in high value-added applications.

1. Introduction

Coffee is one of the most popular beverages in the world and a characteristic example of agri-food activity, producing huge quantities of byproducts worldwide. According to the International Coffee Organization, global coffee production is estimated at 169.60 million 60 kg bags for coffee year 2020/21, representing a 0.3% increase over 2019/20. On the other hand, global coffee consumption is projected at 167.23 million bags in 2020/21, and is expected to grow steadily at a healthy annual rate of 2.2% over the next years [1]. The main byproduct that has increasingly accumulated with the growth of coffee consumption is a solid residue known as spent coffee grounds (SCGs), which is usually a mixture of two main species of genus Coffea, Coffea arabica and Coffea canephora, widely known as Arabica and Robusta, respectively [2]. SCGs’ high organic content and the presence of compounds such as caffeine and polyphenols have negative effects on the environment. According to Poore and Nemecek [3], coffee has a significant impact on climate change, since greenhouse gas (GHG) emissions are measured at 16.50 kg carbon dioxide equivalent (CO2eq) per kilogram of coffee. Compared to other agri-food products, only beef products (59.60 kg CO2eq per kilogram), cheese (21.20 kg CO2eq per kilogram), and dark chocolate (18.70 kg CO2eq per kilogram) appear to be more carbon-intensive products than coffee.
With respect to SCGs, according to Kamil et al. [4], one (1) ton of SCG generates 682 kg of CO2eq, while the landfilling of SCGs produces 28.644 million tons of CO2eq per year, a quantity comparable to the CO2 generated by 10.6 million liters of burned diesel fuel [4]. Thus, the disposal of SCGs needs to be properly managed to reduce their environmental impact. However, most SCGs are currently being incinerated or dumped in a landfill [5,6], although a more sustainable waste-management method has been investigated in recent years. This has stimulated efforts to find ways to valorize SCGs within the concept of the circular economy, minimizing the massive quantities that are disposed by exploiting SCGs as a potential feedstock. The main valorization routes for SCGs proposed in the literature include their direct use in waste-to-energy applications (e.g., biogas and electricity production) [7]; in food [8], cosmetic [9,10,11] and pharmaceutical industries [12,13]; as well as soil amendment, green composites, and biosorbents [5,14,15,16,17]. It should be highlighted that other opportunities for the optimal utilization of SCGs include their use as a source of biofuel production [18,19,20] and animal feed [21]. As a result, their valorization as a raw material for the recovery of these bioactive substances seems to be a business opportunity to produce high value-added products [22],which can be recognized as an approach embedded in the general idea of the circular economy.
Recent studies indicated that the antioxidant capacity of SCGs ranges from 74.57 to 172 μmol Trolox equivalents/g dry SCG [19,23], and the total phenolic content between 20 and 30 mg gallic acid equivalents (GAE)/g dry SCG [24]. Furthermore, chlorogenic acid (CGA) and its derivatives are the major phenolic compounds found in SCGs, and are formed by esterification of a quinic acid and a hydroxycinnamic acid such as caffeic, ferulic, or p-coumaric acid [25]. This is in accordance with the study of Okur et al. [26], who reported that chlorogenic acid was found as the main phenolic compound in SCGs, irrespective of the method used for their extraction. In addition, concentration of CGAs in SCGs was found to be four (4) to seven (7) times higher than their corresponding content in coffee brews [19]. Furthermore, coffee grounds contain methylxanthines, with caffeine being the major compound recovered, constituting 1% to 2% of the dry SCG [2]. It should be underlined that both caffeine and CGA’s remarkable health benefits are associated with their strong antioxidant properties, which provide protection against free radical damage and oxidative stress as a result of a hydrogen atom donation.
On the above basis, SCGs could be considered as a source of bioactive compounds of potential interest to the pharmaceutical and cosmetic industries. In the literature, there are many studies applying solid/liquid extraction for the recovery of phenols and antioxidants from SCGs, while studying the effects of the main extraction parameters (i.e., time, temperature, type of solvent) [18,25,26,27,28,29,30]. The most widely used solvents include distilled water, ethanol, or methanol, as well as their mixtures with water at different proportions [31].
Among the most conventional technologies that are used for the recovery of bioactive compounds (such as caffeine and polyphenols) from SCGs are Soxhlet extraction and gravity filtration. However, in order to achieve a reduction in energy consumption and processing costs, to replace toxic solvents with environmentally friendly ones, and therefore to reduce the negative impact on the environment, new alternative extraction techniques using supercritical fluids [27], microwaves [32,33], ultrasound [23,34] and high pressure [35,36] are preferred [37]. Green technologies that employ solvents at high temperatures and pressures aim to increase the extraction efficiency. High temperature reduces the viscosity and surface tension of the solvent while increasing the solubility of a compound, resulting in faster diffusion rates [38]. By means of high pressure, the boiling point of solvents is increased. As a result, when temperature is high, solvents remain liquid and have better extraction and mass-transfer properties [39]. Therefore, a combination of high pressure and temperature can allow a quick and efficient extraction (5–30 min), with the amount of solvent consumed being dramatically reduced by up to 90% [40].
In view of all the above, this work was undertaken to assess the potential content of SCGs in bioactive substances and conduct a systematic study aiming to develop a cost-efficient and environmentally friendly process to obtain SCG extracts with high total phenolic content and antioxidant activity, and significant amounts of caffeine and chlorogenic acid. Hereby, we provide a systematic research comparing the conventional Soxhlet extraction technique, with the more “green” ultrasound-assisted extraction (UAE) and accelerated solvent extraction (ASE) ones, using different solvents and extraction parameters. Specifically, the present work succeeds, for the first time, to compare ASE with other extraction techniques, while applying response surface methodology (RSM) by considering all process parameters simultaneously. Therefore, in this study emphasis was placed on optimizing the technique presenting the best results during screening experiments, employing a face-centered composite (FCC) design. Through RSM, it was feasible to evaluate the interactions between the analyzed factors, construct a desired space (DSp), and find an optimum combination of process parameters in which all the responses (yield, total phenolic content, antioxidant activity, caffeine and chlorogenic acid concentration) maximized their values, while reducing the number of necessary experiments and minimizing the use of chemicals. Subsequently, this research can be considered as the initial driving force for further investigation on how to exploit and manage SCGs and increase the sustainability of the extraction process, as an environmentally friendly approach in the context of bioeconomy.

2. Materials and Methods

The experimental part of this study was conducted during 2019 and 2020. The main hypothesis concerned the potential capacity of SCGs in antioxidants and bioactive compounds. That stimulated our interest in valorizing these coffee residues to recover the bioactive caffeine and chlorogenic acid with a method optimized to present high efficacy and the lowest possible cost and environmental footprint.

2.1. Materials

Methanol, ethanol, and n-hexane were purchased from Honeywell (Honeywell International Inc, Charlotte, NC, USA). Folin−Ciocalteu phenol reagent, 2,2-diphenyl-1-picrylhydrazyl radical (DPPH), gallic acid, 6-hydroxy-2,5,7,8-tetramethylchroman-2-carboxylic acid (Trolox), sodium carbonate, chlorogenic acid, and caffeine standards were purchased from Merck KGaA (Darmstadt, Germany). Distilled water was used in all experiments. All UHPLC-grade solvents (methanol and formic acid) were purchased from Merck KGaA (Darmstadt, Germany), and water for HPLC was produced from a Milli-Q apparatus (Merck KGaA, Darmstadt, German).
Regarding the espresso SCGs, five different blends of two different varieties were collected from six local stores and were utilized for the purposes of the adopted experimental approach. Local coffee stores (mainly distributing take-away coffee) were randomly selected throughout the Municipality of Kalamaria, Thessaloniki, Greece, which we kindly acknowledge. It should be noted that the first was a single blend of 100% Arabica, while the other four were different coffee blends that consisted of Arabica mixed with Robusta in different proportions (20%, 30%, 40%, 85%). The different coffee blends were collected in order to evaluate the effect of Robusta variety in the antioxidant properties of the extracts and their content in phenols, CGA, and caffeine. All samples were dried at 104 °C for 24 h in a Binder Model ED 56 heating–drying oven (BINDER GmbH, Tuttlingen, Germany) to remove humidity and prevent microbial growth. Dried SCGs were stored in the dark until further use.

2.2. Preliminary Screening

During preliminary experiments, SCG extraction was performed using a Soxhlet apparatus, UAE and ASE. In order to evaluate the three techniques in terms of the solid yield they could extract, exhaustive extractions of 100% Arabica SCGs were performed, with the use of either: (i) hexane, (ii) ethanol, or (iii) aqueous ethanol solution at a ratio of 50:50 v/v as solvents. A single blend of 100% Arabica was used during the preliminary experiments so the results would be comparable. The extraction conditions applied were based on preliminary experiments. All extracts were collected in flasks to separate the solvent from the solid residue by means of a rotary evaporator (EYELA Rotary Vacuum, Evaporator NN Series, Digital Water bath SB-651, Tokyo, Japan).

2.3. SCG Extraction Techniques

SCGs (100% Arabica) were used for the extractions with the Soxhlet apparatus and lasted 3, 12.5, and 24.5 h for hexane, EtOH, and EtOH:H2O, respectively, until an exhaustive extraction was performed. For each experiment, approximately 43 g of dry SCGs and 350 mL of solvent were used.
Ultrasound-assisted extraction of 100% Arabica SCGs was furthermore performed in a Sonorex Digital 10P ultrasonic bath (Bandelin, Germany). For each experiment, 43 g of dried SCGs were mixed with 100 mL of solvent in a 250 mL conical flask, and the extraction was performed in three successive cycles lasting 60 min (each cycle) at 18 °C. At the end of each cycle, the extract was separated from the solid residue by filtration and replenished by an equal amount of fresh solvent.
Finally, accelerated solvent extraction of 100% Arabica SCGs was performed with a Dionex™ ASE™ 150 (Thermo Scientific™, Waltham, MA, USA). The amount of dried sample (g) was placed in a 22 mL stainless steel extraction cell and loaded into the ASE oven, preheated to the desired temperature. Then, a static extraction was performed, and the extract was collected into the removable collection vial for further analysis. The total solvent volume used and the extraction parameters selected in each case are presented in Table 1.

2.4. Experimental Design

A face-centered composite design of three factors and three levels was used to study the effects of experimental variables: time, XA; temperature, XB; and ethanol ratio, XC; as well as their interactions, on five responses; i.e., extraction yield (%), Y1; total phenolic content (TPC), Y2; antioxidant activity, Y3; and caffeine and chlorogenic acid concentration (Y4 and Y5, respectively) [41,42]. The design matrix of the employed FCC is shown in Table 2. The variable ranges chosen were based on preliminary experiments, theoretical background knowledge, and literature.
All experiments were carried out in triplicate for a total of 46 extraction tests, performed in a randomized order to minimize the effects of variability in the observed responses. The type of waste raw material used for all the experiments was 100% Arabica.
Statistical significance of the independent variables was evaluated by means of analysis of variance (ANOVA) and values were considered significant when p-value < 0.05. Multivariate data analysis using multilinear regression (MLR) was employed, and two-factor interactions (2FI) or quadratic polynomial models were fitted to the experimental data. The quality of the fit of the polynomial model was expressed by the value of correlation coefficient (R2). The main indicators, demonstrating the significance and adequacy of the used model, include the adequate precision (signal to noise ratio > 4), the reproducibility of the model (coefficient of variation < 10%), and the predicted residual sum of square (PRESS) (values as small as possible were selected as the fittest). The optimal region of the independent variables (desired space, DSp) was determined by conducting three-dimensional response surface analysis of the independent and dependent variables.
Experimental design was carried out using RStudio (v.1.3.959, RStudio, PBC, Boston, MA, USA) in combination with Design Expert® (v. 12 free trial, Stat-Ease Inc. Minneapolis, MN, USA) [42,43].

2.5. Chemical Characterization and Antioxidant Activity of the Extracts

2.5.1. Determination of Total Phenolic Content

The Folin-Ciocalteau (F-C) method [44] was used to determine the total phenolic content in the resulting ASE extracts. Briefly, a certain amount of each sample was placed in a 25 mL volumetric flask together with distilled water, so that the final volume was 10 mL. Then, 0.5 mL of F-C reagent was added, and the solution was left for 5 min under stirring. Finally, 5% w/v Na2CO3 solution and distilled water were added to reach a final volume of 25 mL. At the same time, a blank solution was prepared.
All solutions prepared were left in the dark for 90 min. Absorbance was measured by means of a UV–vis spectrophotometer (UV-1900 Spectrophotometer, HITACHI High Technologies Corporation, Tokyo, Japan) at a wavelength of 750 nm and expressed as absorbance units (AU). The total phenolic content was expressed as mg gallic acid equivalents (GAE) per L of solution, using the following calibration curve:
GAE   ( mg L ) = 1365.90 × Absorbance 4.0586 ;   ( R 2 = 0.9995 )

2.5.2. Determination of Antioxidant Activity

Antioxidant activity was evaluated using the 2,2-diphenyl-1-picrylhydrazyl (DPPH˙) assay. A 6 × 10⁻⁵ mol/L DPPH˙ solution was first prepared by diluting 2.3 mg of DPPH in 100 mL of methanol. Its absorbance was measured immediately after preparation at 517 nm by means of an ultraviolet (UV–vis) spectrophotometer. For all samples, 100 μL of extract solution (1 mg/mL in MeOH) was added to 3.9 mL of the previously prepared DPPH solution. Samples were left in the dark for 60 min, and their absorbance was measured at 517 nm, using pure methanol as blank. The antioxidant activity was expressed as μmol of Trolox equivalents per mL of solution using a calibration curve of Trolox standards, based on the equation:
Trolox   equivalent   ( μ mol mL ) = 1.7762 × Absorbance + 1.0543 ;   ( R 2 = 0.9991 )

2.5.3. Caffeine and Chlorogenic Acid Content

The quantification of caffeine and chlorogenic acid was performed by ultra-high-performance liquid chromatography (UHPLC) using an ECOM (ECOM spol. s r.o., Chrastany, Czech Republic) system (model ECS05). The system comprised a quaternary gradient pump (ECP2010H), a gradient box with degasser (ECB2004), a column heating/cooling oven (ECO 2080), an autosampler (ECOM Alias), and a diode array detector (ECDA2800 UV-VIS PDA Detector). A Phenomenex® reversed-phase column (Synergi™ Max-RP 80 Å; 4 μm particle size, 150 × 4.6 mm) was used at 25 °C. The sample injection was 10 μL. Chromatographic analysis was performed using a gradient of Milli-Q water with 0.1% formic acid (solvent A) and methanol with 0.1% formic acid (solvent B), at a constant flow rate of 0.5 mL/min. The gradient program was as follows: solvent A was decreased from 70% to 55% after 5 min; followed by another decrease to 35% until 15 min; and it was finally reduced to 10% at 18 min. Then, solvent A was maintained at 10% for 2 min and returned to initial conditions (70% solvent A). Detection was accomplished with the diode array detector, and chromatograms were recorded at 276 nm for caffeine and 330 nm for chlorogenic acid. Identification of caffeine and chlorogenic acid was performed by comparing both their retention time and UV–vis spectra with those of the standards used. Their quantification was established with the aid of calibration curves (ranging from 5 to 100 mg/L for caffeine and 5–50 mg/L for chlorogenic acid; Equations (3) and (4), respectively). All chromatographic data were analyzed with Clarity Chromatography Software v8.2. Final results of the concentration of compounds in the SCG extract were expressed as mg of each compound per L (ppm).
Caffeine   Concentration   ( ppm ) = 0.0511 × Peak   Area 0.8929 ;   ( R 2 = 0.9995 )
Chlorogenic   acid   Concentration   ( ppm ) = 0.0415 × Peak   Area + 0.6909 ;   ( R 2 = 0.9999 )
A characteristic chromatogram from the UHPLC analysis is shown in Figure S1.

2.6. Statistical Analysis

Results are shown as mean value ± standard deviation (S.D.) of three independent experiments. Statistical significance in the differences of means was evaluated by using Student’s t-test or one-way ANOVA (Tukey and Scheffe tests) for the single or multiple comparisons of experimental groups, respectively. Difference with p-value (p*) < 0.05 was considered statistically significant. All statistical analyses were performed using SPSS 25.0.

3. Results and Discussion

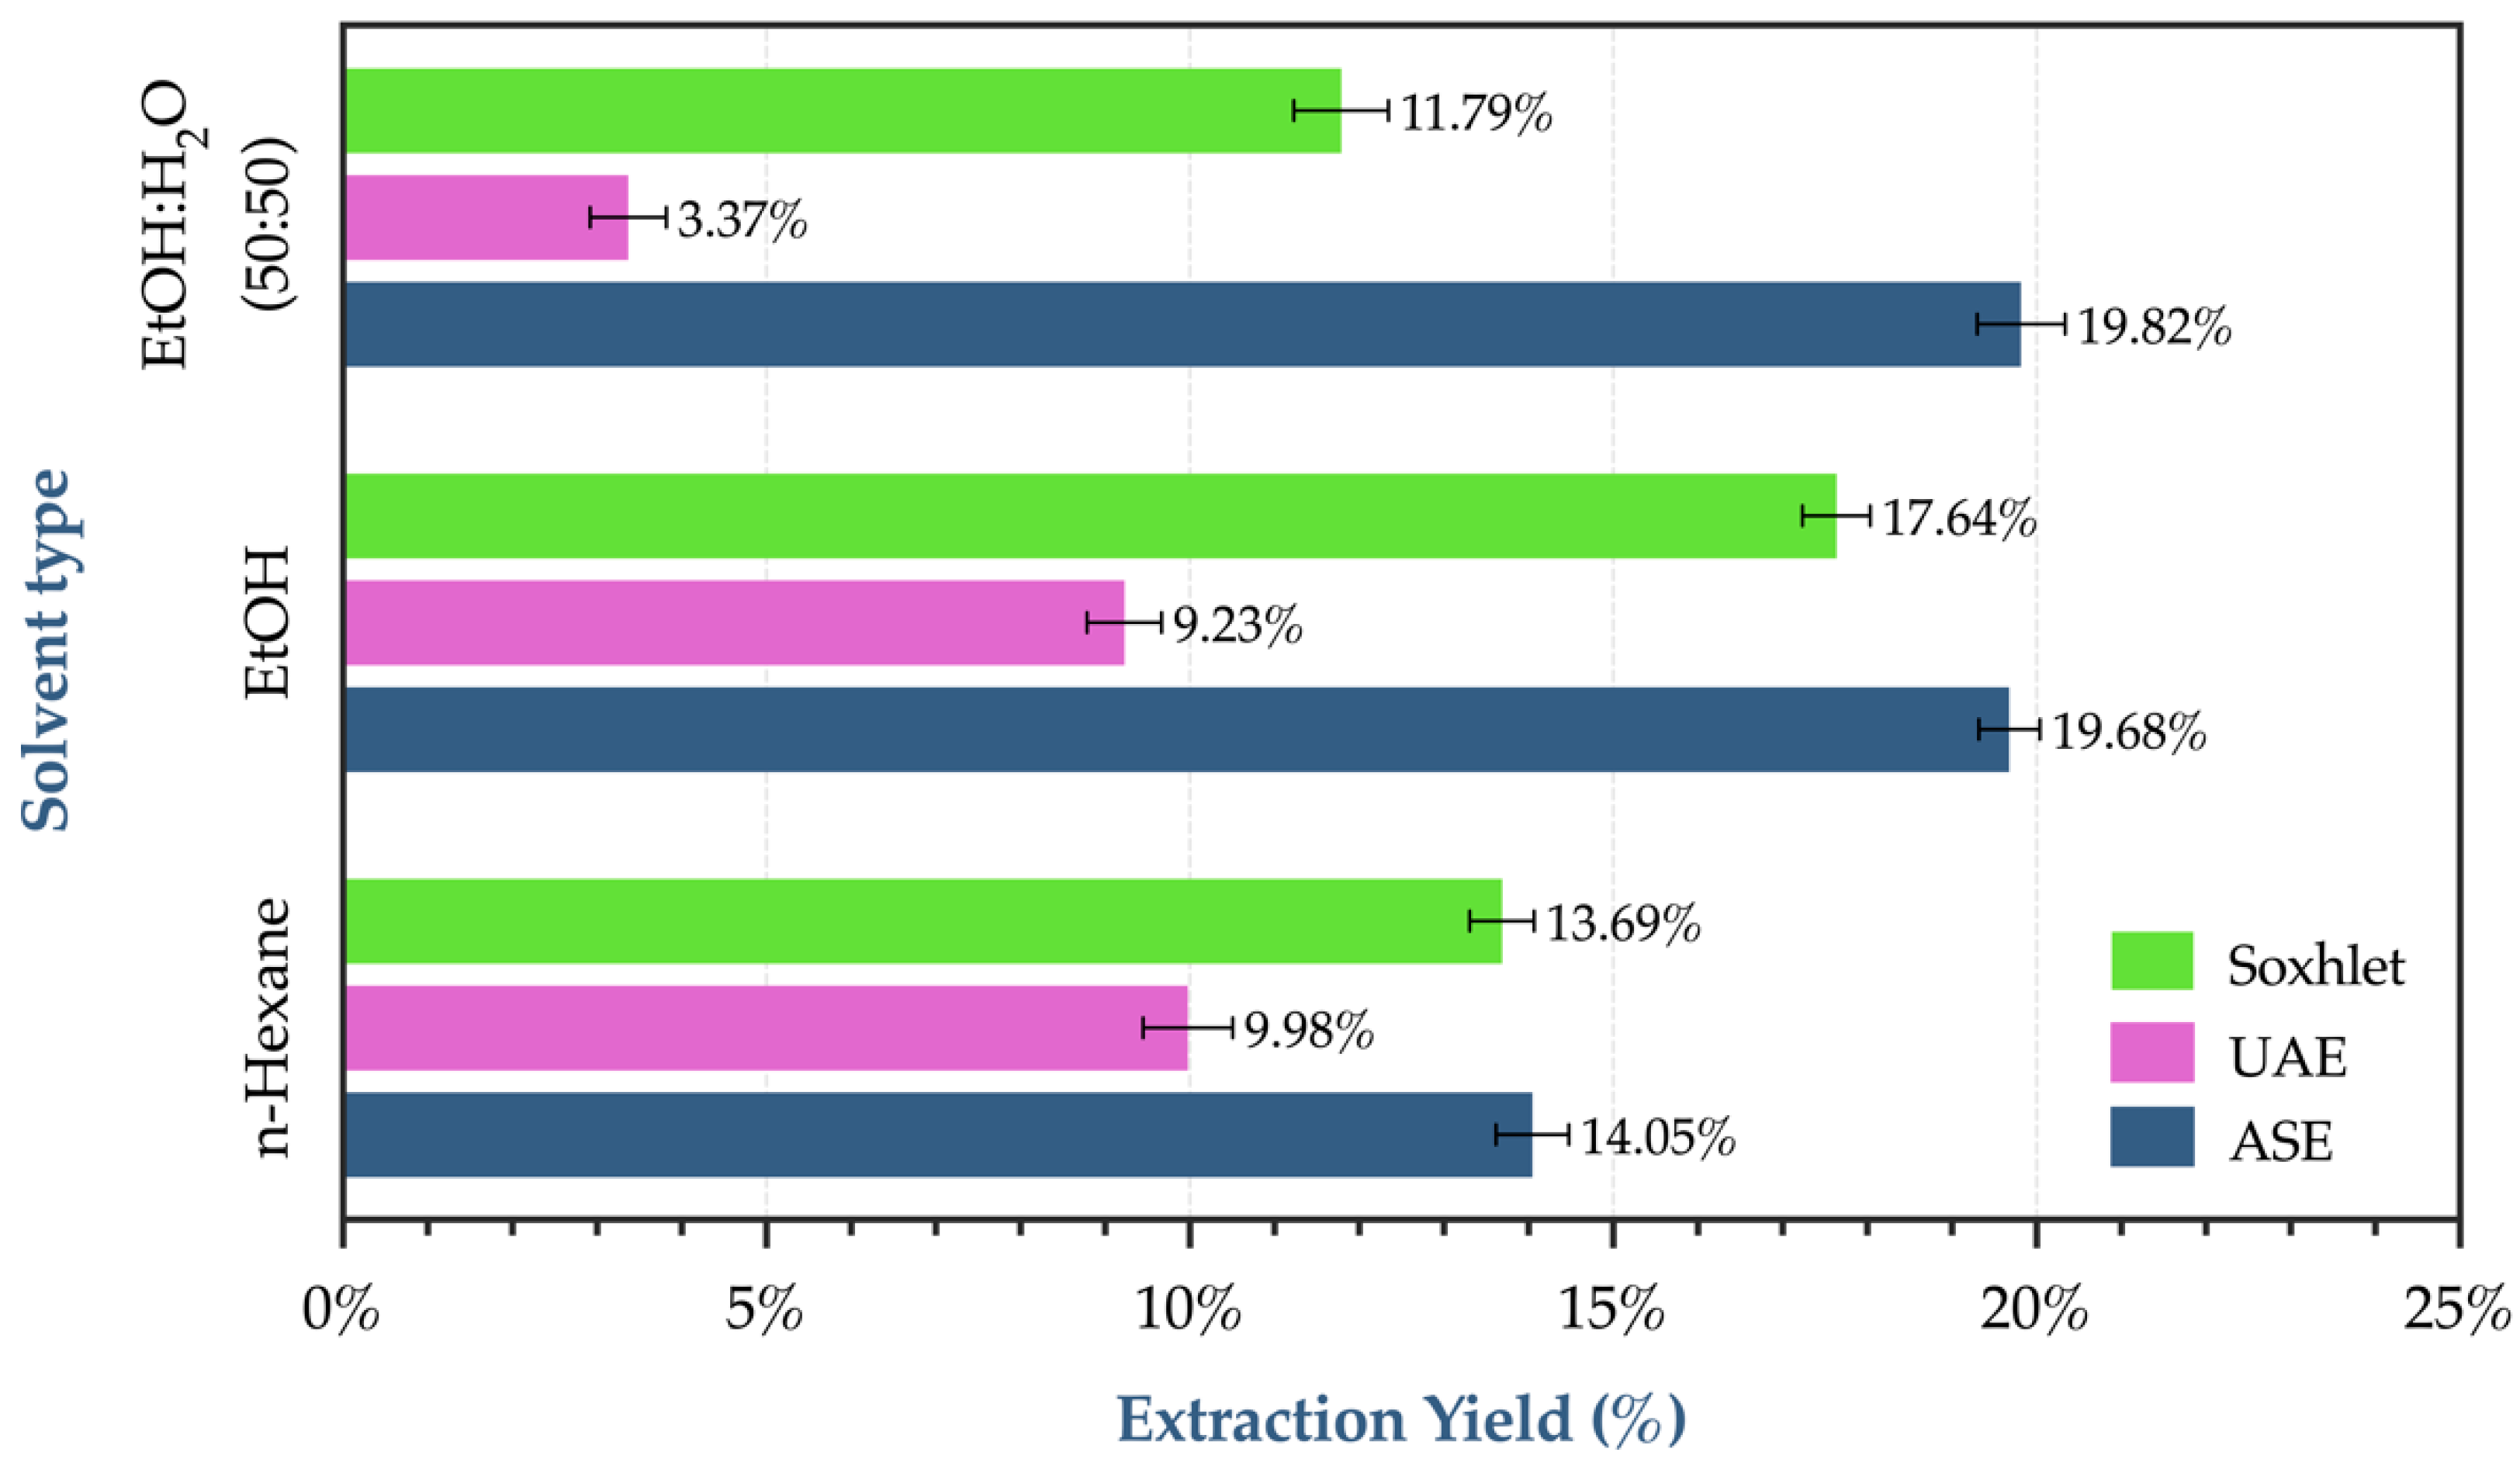
3.1. Preliminary Experiments

An integral part of the whole process was the conduction of the preliminary screening. Those experiments took place in order to evaluate the efficacy of all three extraction techniques based on the extracting efficiency of the different solvents employed. Within the reviewed literature, there are many research groups who studied the influence of several solvents on SCG extraction efficiency. Indicatively, Mussatto et al. [30] reported that methanol and its aqueous mixtures as extraction solvents did not cause significant differences in the polyphenolic yield compared to those with ethanol, whereas Murthy and Naidu [45] reported that methanol was less effective in extracting polyphenolic compounds and must be removed from the extract due to its toxicity. Somnuk et al. [46] also scrutinized the best selection among four solvents for coffee oil extraction from SCGs to obtain the highest oil yield. Although hexane achieved the best results, the second-highest yield was obtained when anhydrous ethanol was used. Methanol, on the other hand, was found to be the least effective. Furthermore, Somnuk et al. [46] presented that when the environmental effects were considered, anhydrous ethanol and hydrous ethanol were favorable due to their environmentally friendly nature compared to toxic solvents, such as hexane and methanol. In addition, there are numerous studies reporting that as long as the ethanol ratio in the aqueous mixture is increased, higher yields are achieved, regardless of the extraction method used [18,27,29]. Along with ethanol proportion in the aqueous solvent, temperature and extraction time were found to be influential factors with a positive effect on the extraction yield [29]. In most studies, extraction was carried out at ambient temperature. However, Panusa et al. [25] carried out the extractions at a higher temperature, specifically at 60 °C, proving that the increase in temperature resulted in higher polyphenolic yields.
The results of the present work showed that in the case of Soxhlet extraction, ethanol achieved the highest efficiency compared to the other two solvents, achieving a yield rate equal to 17.64% w/w. This percentage is in line with the value reported by Andrade et al. [27]. On the other hand, in our work, UAE led to lower yields compared to Soxhlet, regardless of the type of solvent used. This may be attributed to the higher temperature applied in case of Soxhlet extraction and larger solvent volumes. This was also reported by other researchers for the recovery of bioactive compounds from residual coffee [25,27,47]. As evidenced by Al-Hamamre et al. [48], the higher yield was also affected by the increased duration of the extraction, which in the case of Soxhlet can take up to 24 h. However, according to the results (Figure 1), the method that prevailed over the other two was ASE, since the yields of all three solvents were higher than those obtained with either Soxhlet extraction or UAE. These results can be assigned to the fact that extraction was performed under higher than atmospheric pressure and a temperature close or above solvent’s boiling point [39]. Thus, even though the temperature was high, the pressure kept the solvent in a liquid state and facilitated the extraction of compounds located within the matrix pores [40]. In addition, the high constant operating temperature facilitated the solvent’s penetration into the pores of the matrix, improving the extraction process. Apart from this, temperature increased the solubility of the compounds [38]. Finally, high temperature can easily disrupt the interactions between compounds and solid matrix that exist due to van der Waals forces, hydrogen bonds and dipole–dipole attractions, which leads to an easier removal of solutes from the matrix [49]. Comparing the three types of solvents used in ASE, it was observed that the highest extraction yield was established with the binary mixture, reaching 19.81%, followed by ethanol (19.68%). Depending on the combination of temperature and pressure, water can change polarity as its dielectric constant is altered. Thus, water can solubilize a wide range of compounds of both medium and low polarity [39,49].

3.2. FCC Optimization Results

Based on the preliminary extraction experiments and the fact that ASE showed the best results in terms of performance compared to the other two methods, it was chosen as the technique to be optimized. Since ethanol:water mixture in a ratio of 50:50 v/v was the solvent with the highest yield, ethanol ratio (XC) was selected as one of the factors to be studied, along with time (XA) and temperature (XB). Specifically, an FCC experimental design was applied in order to optimize the extraction parameters with ASE and to examine the effects of the main extraction factors, as well as their possible interactions on the responses (i.e., extraction yield, Y1; total phenolic content, Y2; antioxidant activity, Y3; caffeine concentration, Y4; and chlorogenic acid concentration, Y5). Table 2 shows the experimental conditions of the 46 runs of the FCC design (performed in a randomized order), as well as the values of the observed responses.
The experimental data for all the responses were statistically analyzed by analysis of variance, and the significance of the independent variables was evaluated based on p-value. As shown from ANOVA results (Table 3), in the case of Y1, all independent variables (XA, XB, XC), as well as the interactions of ethanol ratio with the other two main factors (XAXC, XBXC) and the quadratic term XC2 were highly significant, as their p-values were <0.001; however, the other two quadratic terms (XA2, XC2) and the interaction between time and temperature (XAXB) were statistically insignificant. On the other hand, for Y2, the independent variables XB and XC, the interactions between time and temperature (XAXB), and between temperature and ethanol ratio (XB XC), as well as the quadratic term XC2, were statistically significant (p-value < 0.05). Among these, only ethanol ratio (XC) was highly significant, as its p-value was < 0.001. Regarding Y3, the main factor identified to be highly significant was XC; its interaction with temperature (XBXC) was also significant, with a p-value less than 0.05. As far as Y4 is concerned, the results indicated that temperature, ethanol ratio, and their interaction (XBXC) were highly significant, while the quadratic term XC2 showed a p-value < 0.05. The same terms were also highly significant for Y5, with time (XA) and its interaction with temperature (XAXB) presenting a p-value less than 0.05.
MLR model fitting on the obtained FCC results was conducted based on the ANOVA results. For Y1, Y2, and Y4, the quadratic model had the best fit (with p-values lower than 0.01), while for Y3 and Y5, a 2FI model was used. Adequate precision (depicts the value of signal-to-noise ratio; ratio greater than is preferred) and the coefficient of variation (measures the reproducibility of the model; a value less than 10% is desirable), all fell within the desirable limits. The obtained MLR regression models are shown below and can be used to predict the responses’ values based on any given independent variables:
1/Y1 = 0.289546 − 0.008050∙XA − 0.000561∙XB − 0.001418∙XC − 0.000021∙ΧAXB + 0.000029∙XAXC + 0.000012∙XBXC + 0.000354∙XA2 − 3.30204 × 10⁻⁶∙XB2 − 8.84796× 10⁻⁶∙XC2
Y2 = 113.85890 + 7.28431∙XA + 0.704917∙XB − 1.05334∙XC − 0.076259∙XAXB − 0.013568∙XAXC + 0.011135∙XBXC + 0.001512∙XA2 − 0.004141∙XB2 − 0.008323∙XC2
Y3 = 1.08144 − 0.002066∙XA − 0.003114∙XB − 0.009016∙XC − 0.000017∙XAXB + 0.000053∙XAXC + 0.000044∙XBXC
Y4 = 63.68073 + 1.02429∙XA − 0.586817∙XB − 0.520697∙XC − 0.006321∙XAXB + 0.001501∙XAXC + 0.002443∙XBXC − 0.038735∙XA2 + 0.001868∙XB2 + 0.001052∙XC2
Y5 = 25.84316 + 0.382828∙XA − 0.090138∙XB − 0.288914∙XC − 0.006717∙XAXB + 0.001669∙XAXC + 0.001681∙XBXC
Y1 response was transformed using an inverse algorithm in order to maintain the ANOVA criteria valid (data following a normal and independent distribution). A high correlation coefficient value (R2) illustrates that there is a good correlation between estimated and experimental data. According to the literature, for a satisfactory fit of the model, R2 must be greater than 0.75 [50]. In case of Y1, the polynomial model showed the highest correlation coefficient of 0.9794, while for both Y2 (R2 = 0.7759) and Y3 (R2 = 0.7543), a moderate agreement between the calculated and observed results was obtained. Regarding Y4 and Y5, the R2 values of 0.8611 and 0.8829 were satisfactory and indicated that the models developed could be used to predict the concentrations of caffeine and chlorogenic acid according to the values of the main factors with good accuracy. The correlation between predicted values obtained from the model were in good agreement with the actual experimental data, as shown in the graphs presented in Figure S2. Plots of normal probability of internally studentized residuals were also obtained (Figure S3). The normal probability plot of the residuals is an important diagnostic tool to detect whether or not a data set follows a hypothesized distribution. In case errors are normally distributed independent of each other, and the error variance is homogeneous, the data are plotted in such a way that they follow a straight line. The normal probability plots of the residuals (Figure S3) show that there were almost no serious exogenous observations, and confirmed that residuals were normally and independent distributed [43].
Based on the perturbation plots shown in Figure 2, it was possible to evaluate the effect of an independent variable on a specific response. In perturbation plots, the main factors showing a steep slope or curvature are those affecting responses the most. According to Figure 2a, ethanol ratio (XC) exhibited a steep curvature, indicating that it had a more significant impact on the extraction yield (Y1) compared to temperature (XB) and time (XA). The fact that higher yields were achieved by increasing the ethanol ratio was also reported in other studies, regardless of the extraction method used [18,27,29,37]. Furthermore, the positive effect of ΧB was because high temperatures can increase not only the solubility, but also the mass-transfer rate, and reduce the viscosity and surface tension of solvents by allowing them to penetrate inside the sample matrix [2]. Conclusively, a positive impact of time on extraction yield is expected, since prolonged contact periods between the solvent and the matrix allow the solvent to penetrate the pores of the sample and solubilize the target compounds [40].
In case of total phenolic content (Y2), a significant antagonistic effect was observed, since the slopes of all three main factors appear to be negative (Figure 2b). Specifically, the factor with the most negative effect is ethanol ratio, which as increases causes a sharp decrease in total phenolic content. On the contrary, when ethanol ratio decreases and water represents the largest percentage of the binary solvent, the total phenolic content from SCGs increases. This is due to the high polarity of the water which implies reduced selectivity [49]. In addition, water expands the material to be extracted allowing the solvent to penetrate more easily into the solid matrices, dissolving the target compounds. After all, it is well known that polyphenols are easily soluble in polar protic solvents, such as hydroalcoholic mixtures and alterations in their proportions can have different effects on the content of polyphenol fractions [37]. Temperature also influences the response but not to such an extent, as evidenced by the slope of the rectilinear section, which is not as steep as in the case of ethanol ratio. On the contrary, time does not affect total phenolic content in a statistically significant way, which is also verified by a p-value greater than 0.05. The same results were also observed for the antioxidant activity (Y3) (Figure 2c).
Regarding caffeine concentration (Y4), ethanol ratio showed the highest antagonistic effect (Figure 2d), also displaying a significantly high curvature on its perturbation curve. Thus, a higher proportion of water compared to ethanol, would probably lead to the recovery of a higher concentration of caffeine due to its water-soluble nature. Based on the slope of the line, the next factor that significantly affected Y4 was temperature, indicating an antagonistic effect on caffeine concentration. This may have been due to the fact that high temperatures can lead to the decomposition of heat sensitive compounds [49]. However, although time led to a decrease in response, it did not affect it to the same extent compared to the other two independent variables. Conclusively, the factor with the most significant negative effect on chlorogenic acid concentration (Y5) was also ethanol ratio (Figure 2e). This fact could be considered as expected, since chlorogenic acid is a highly hydrophilic compound.

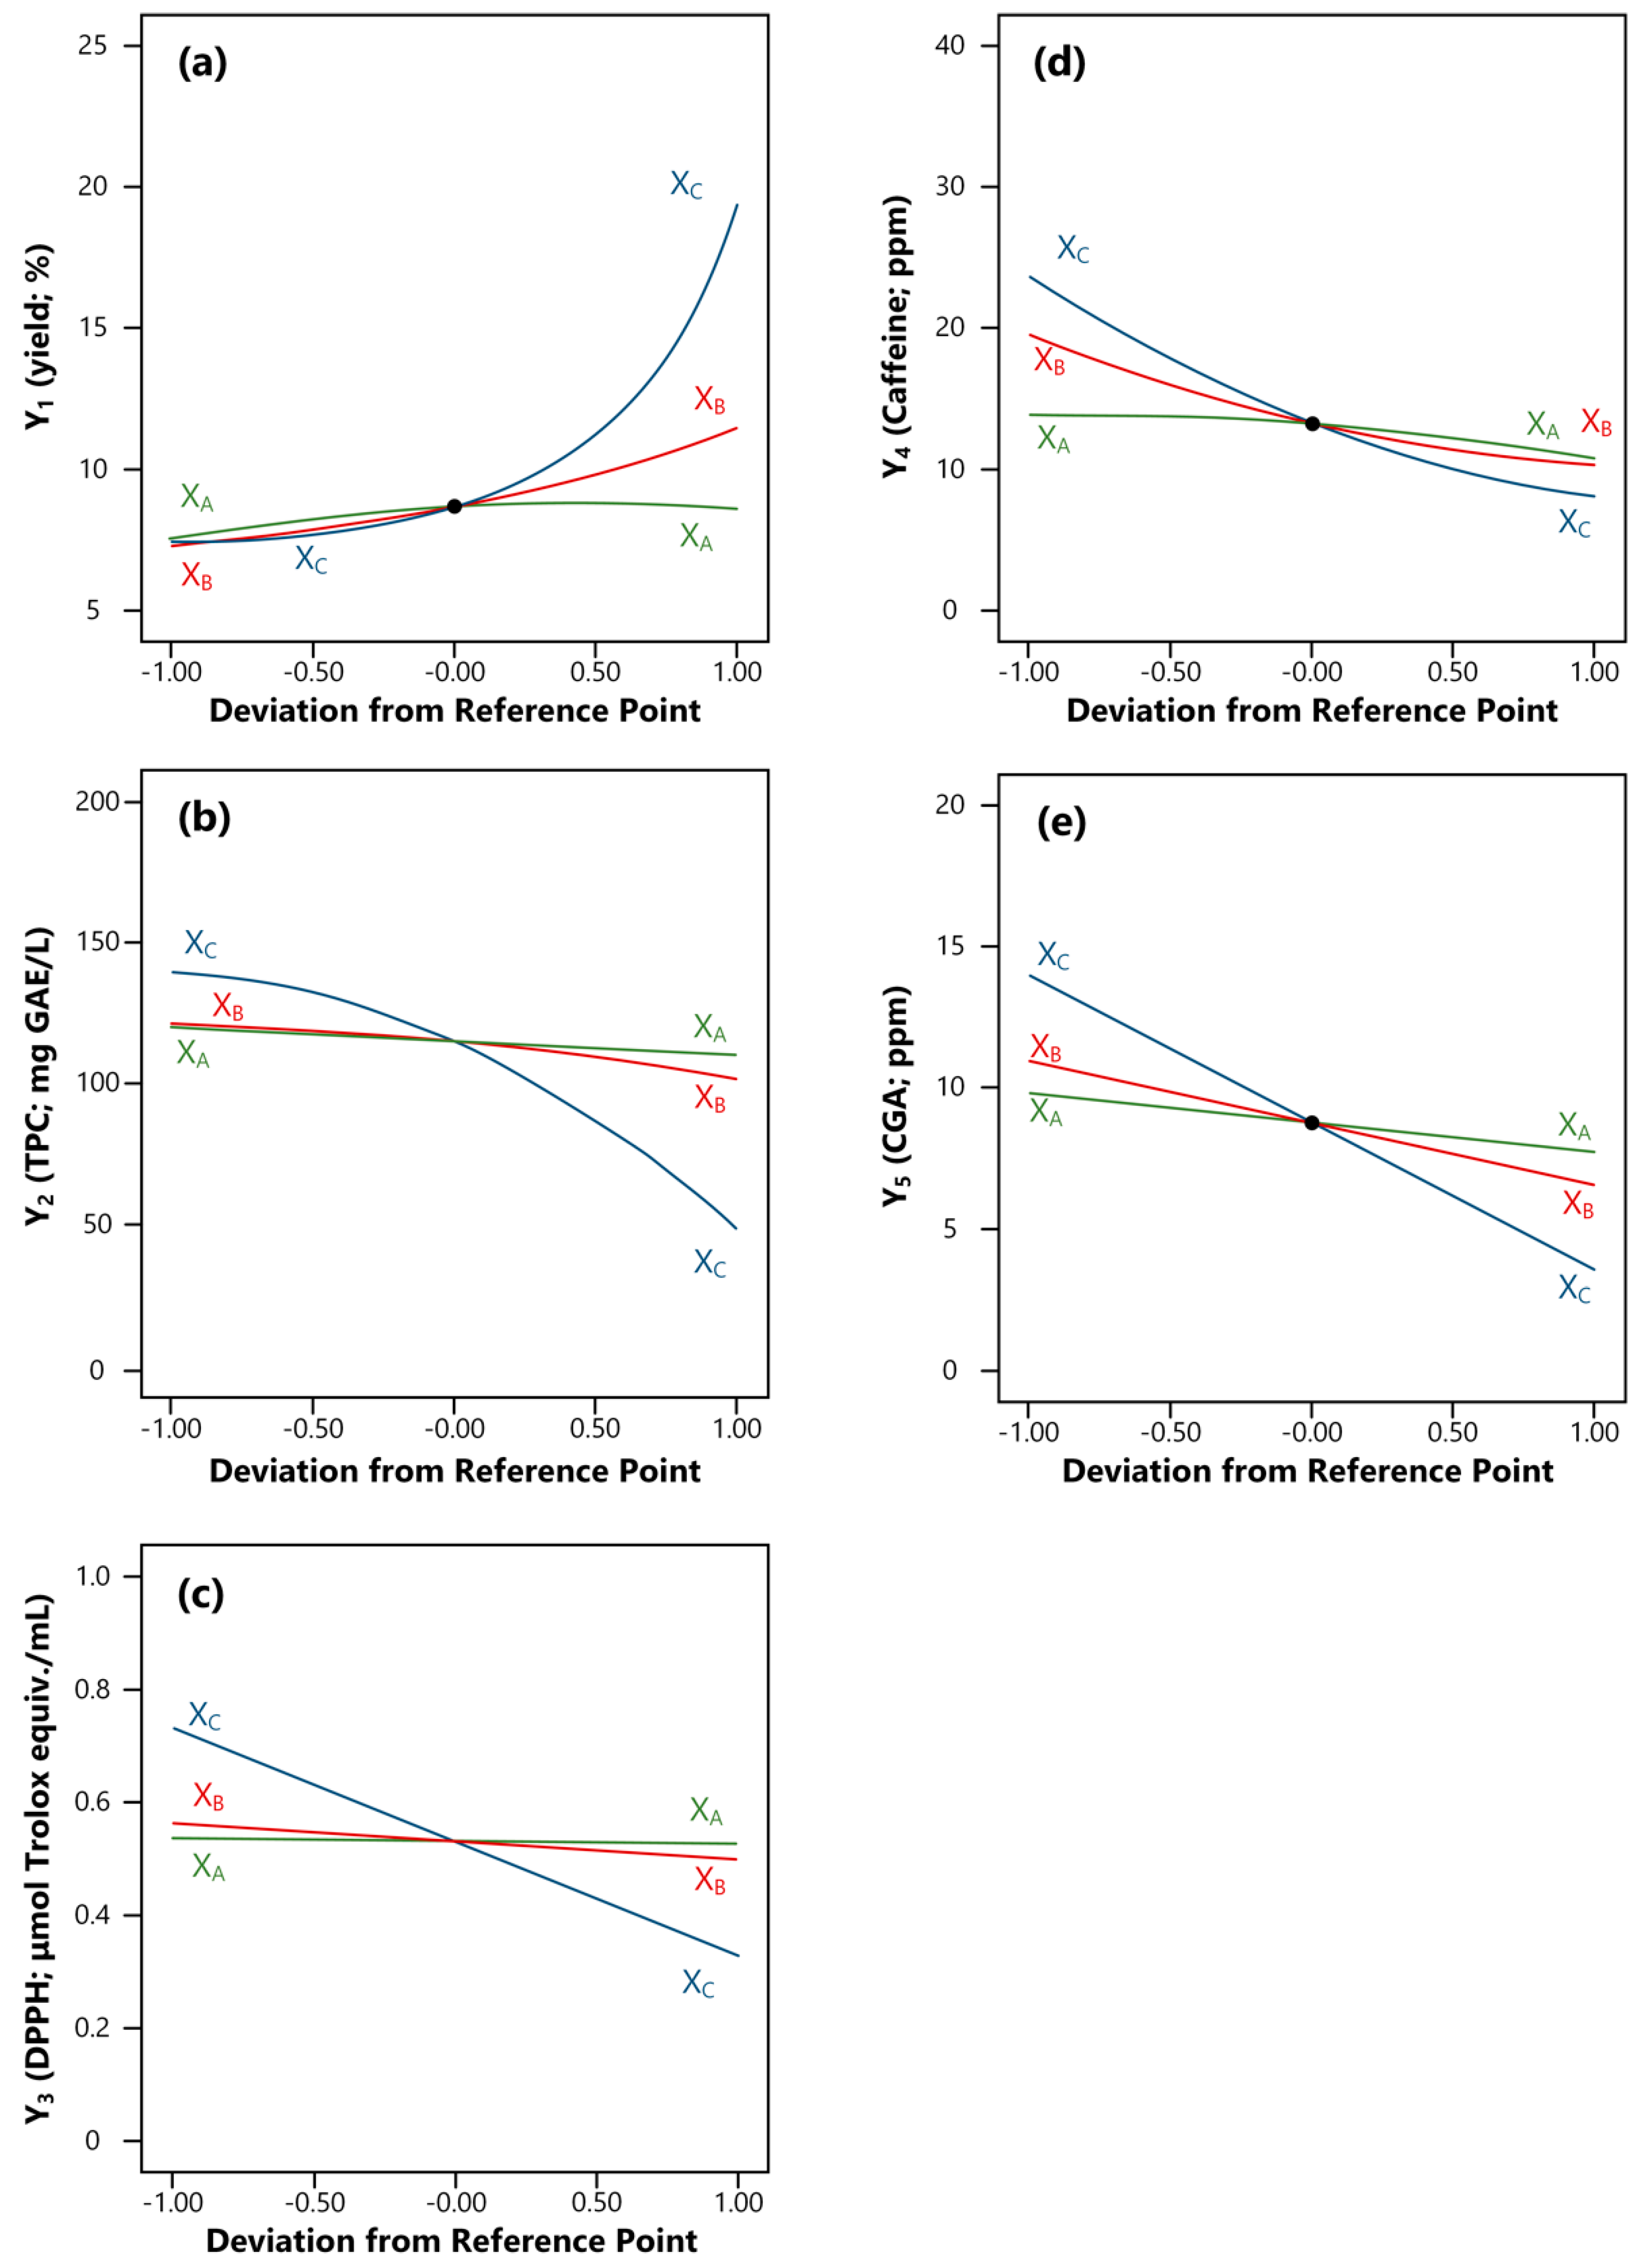
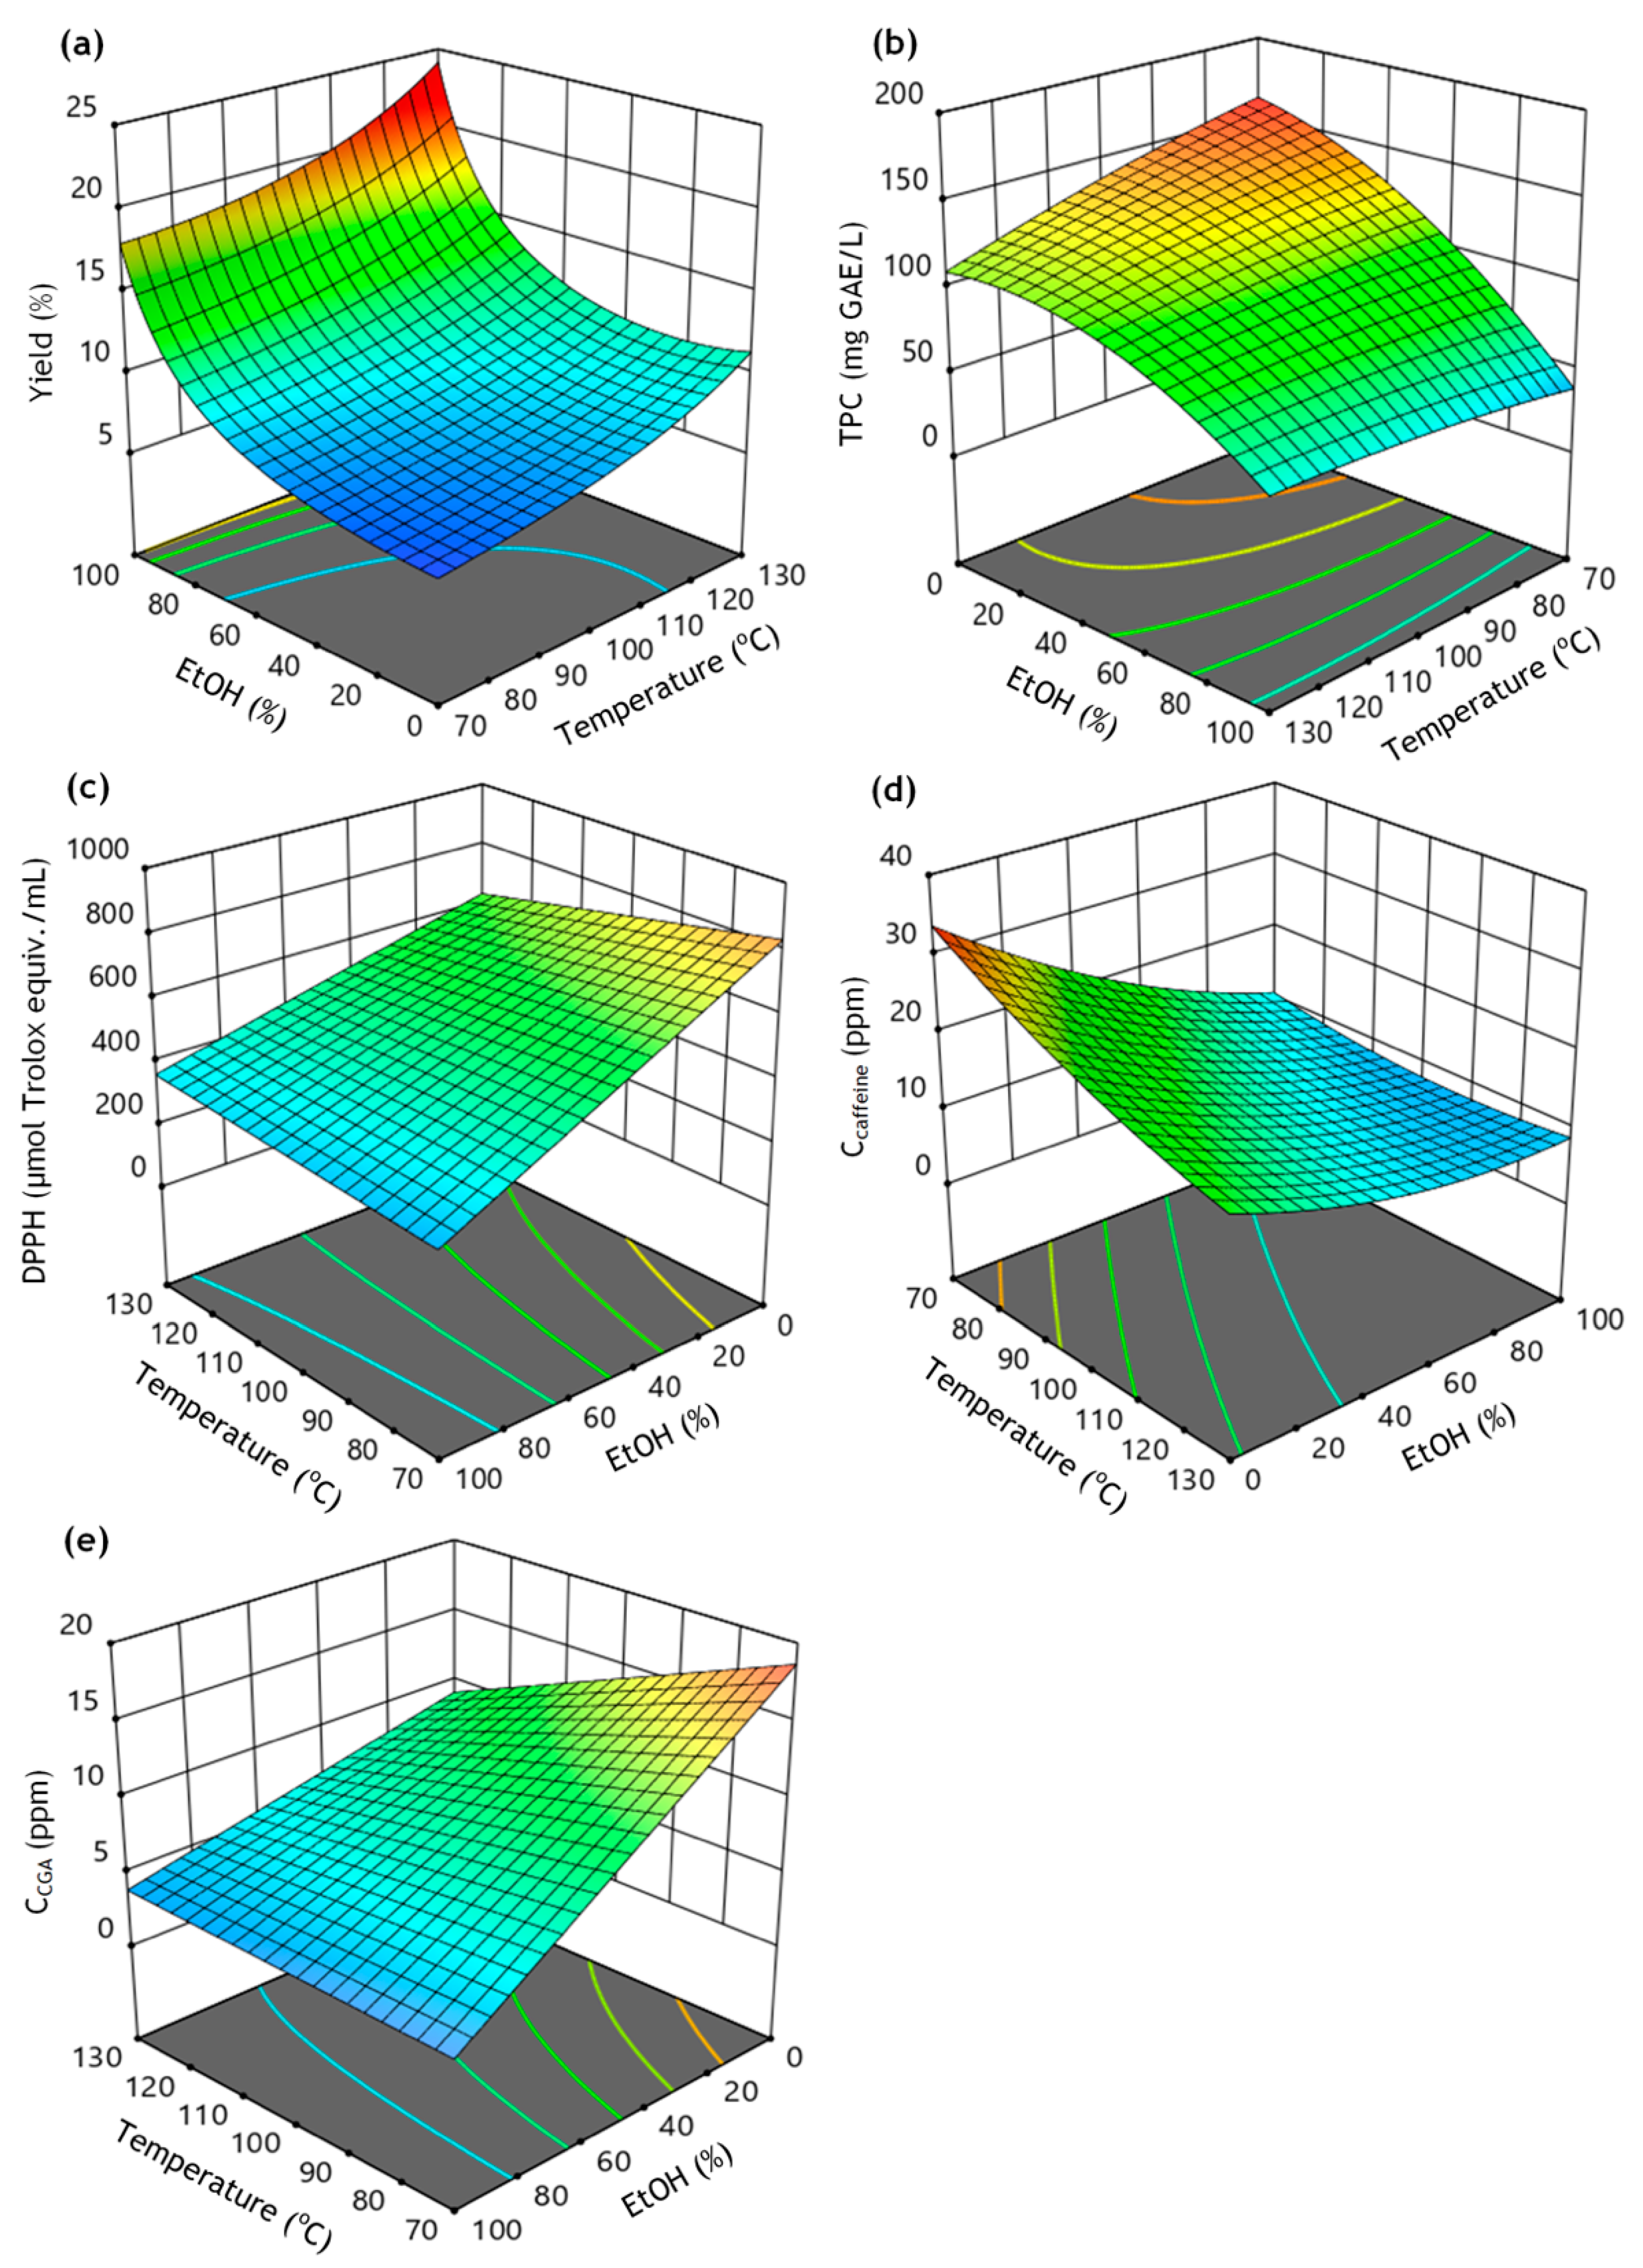
3.3. Response Surface Analysis

Using RSM, the effects of the main factors (XA, XB, XC), as well as their interaction on the responses were graphically represented by three-dimensional response surface plots and two-dimensional graphs (contour plots).
From Figure 3a, it is evident that yield (Y1) tended to grow with an increase in both ethanol ratio and temperature. The maximum extraction yield was obtained at temperatures above 120 °C and ethanol ratios that exceeded 90%. As can be observed from Figure 3b, the effect of temperature on the total phenolic content (Y2) seemed to be negligible, notably when ethanol ratio outreached 55%. However, a decrease in both factors caused an increase in the response, with the maximum value observed between 70 °C and 80 °C and ethanol ratio below 5%. According to Figure 3c, it is evident that antioxidant activity (Y3) increased with a decrease in ethanol ratio, while its maximum value was observed in the temperature range of 70–80 °C. The interaction effects of ethanol ratio and temperature on concentrations of caffeine (Y4) and chlorogenic acid (Y5) are shown in Figure 3d,e respectively. Figure 3d shows that both temperature and ethanol ratio seemed to have positive effect on the caffeine concentration. Its maximum value (30 ppm) was exhibited for ethanol ratio < 15% and temperature between 70 °C and 80 °C, while chlorogenic acid’s maximum concentration was obtained for temperatures up to 93 °C and ethanol ratios below 20% (Figure 3e).
The interaction effect of time and temperature on the responses, as well as the one of ethanol ratio with time, are depicted in Figures S4 and S5, respectively. Regarding the effect of time and temperature on the extraction yield (Y1), the latter showed an increment as the temperature rose (Figure S4a). However, when time increased, extraction yield remained the same, provided that temperature decreased. From Figure S4a, it is also evident that Y1 was maximized for extraction times longer than 9 min and temperatures above 120 °C. According to Figure S5a, the extraction yield increased with increasing ethanol ratio above 30%; while it did not appear to be significantly affected by time. It is worth noting, though, that when the ethanol ratio was greater than 70%, the effect of duration on the extraction yield was close to zero.
Based on Figure S4b, it was observed that in the temperature range of 70–83 °C and extraction time over 9 min, the total phenolic content (Y2) reached 120 mg GAE per L. On the contrary, as temperature increased above 100 °C, total phenolic content decreased, whereas the largest decrease was observed for time > 13 min. From Figure S5b, it can be concluded that Y2 decreased irrespective of time when the ethanol ratio was over 40% and increased with decreasing XC, reaching its maximum value at a time range of 5 to 9 min and ethanol ratio < 15%.
The response surface plot of XAXB (Figure S4c) indicates that antioxidant activity (Y3) decreased as temperature increased; however, Y3 did not seem to be significantly affected by the time in the temperature range of 90–115 °C. The maximum antioxidant activity of 0.560 μmol Trolox equivalents per mL was obtained in a time range of 5–13 min and temperatures below 75 °C. Based on Figure S5c, antioxidant activity was maximized for an ethanol ratio of about 15%.
Figure S4d illustrates that caffeine concentration (Y4) tended to reduce with increasing temperature and extraction time, while it was maximized for temperatures below 75 °C. Furthermore, the response surface plot of XAXC (Figure S5d) indicated an increment of caffeine concentration as ethanol ratio (XC) was being reduced, reaching its maximum value when XC was below 20%. On the other hand, extraction time seemed to affect caffeine concentration when the ethanol ratio ranged between 60% and 80%.
As depicted in Figure S4e, chlorogenic acid concentration (Y5) increased when temperature decreased from 130 °C to 110 °C, and when temperature exceeded 110 °C, Y5 showed a tendency to decrease. Finally, according to Figure S5e, chlorogenic acid concentration exhibited maximum values in the range of 5 to 10 min and ethanol ratios less than 15%.

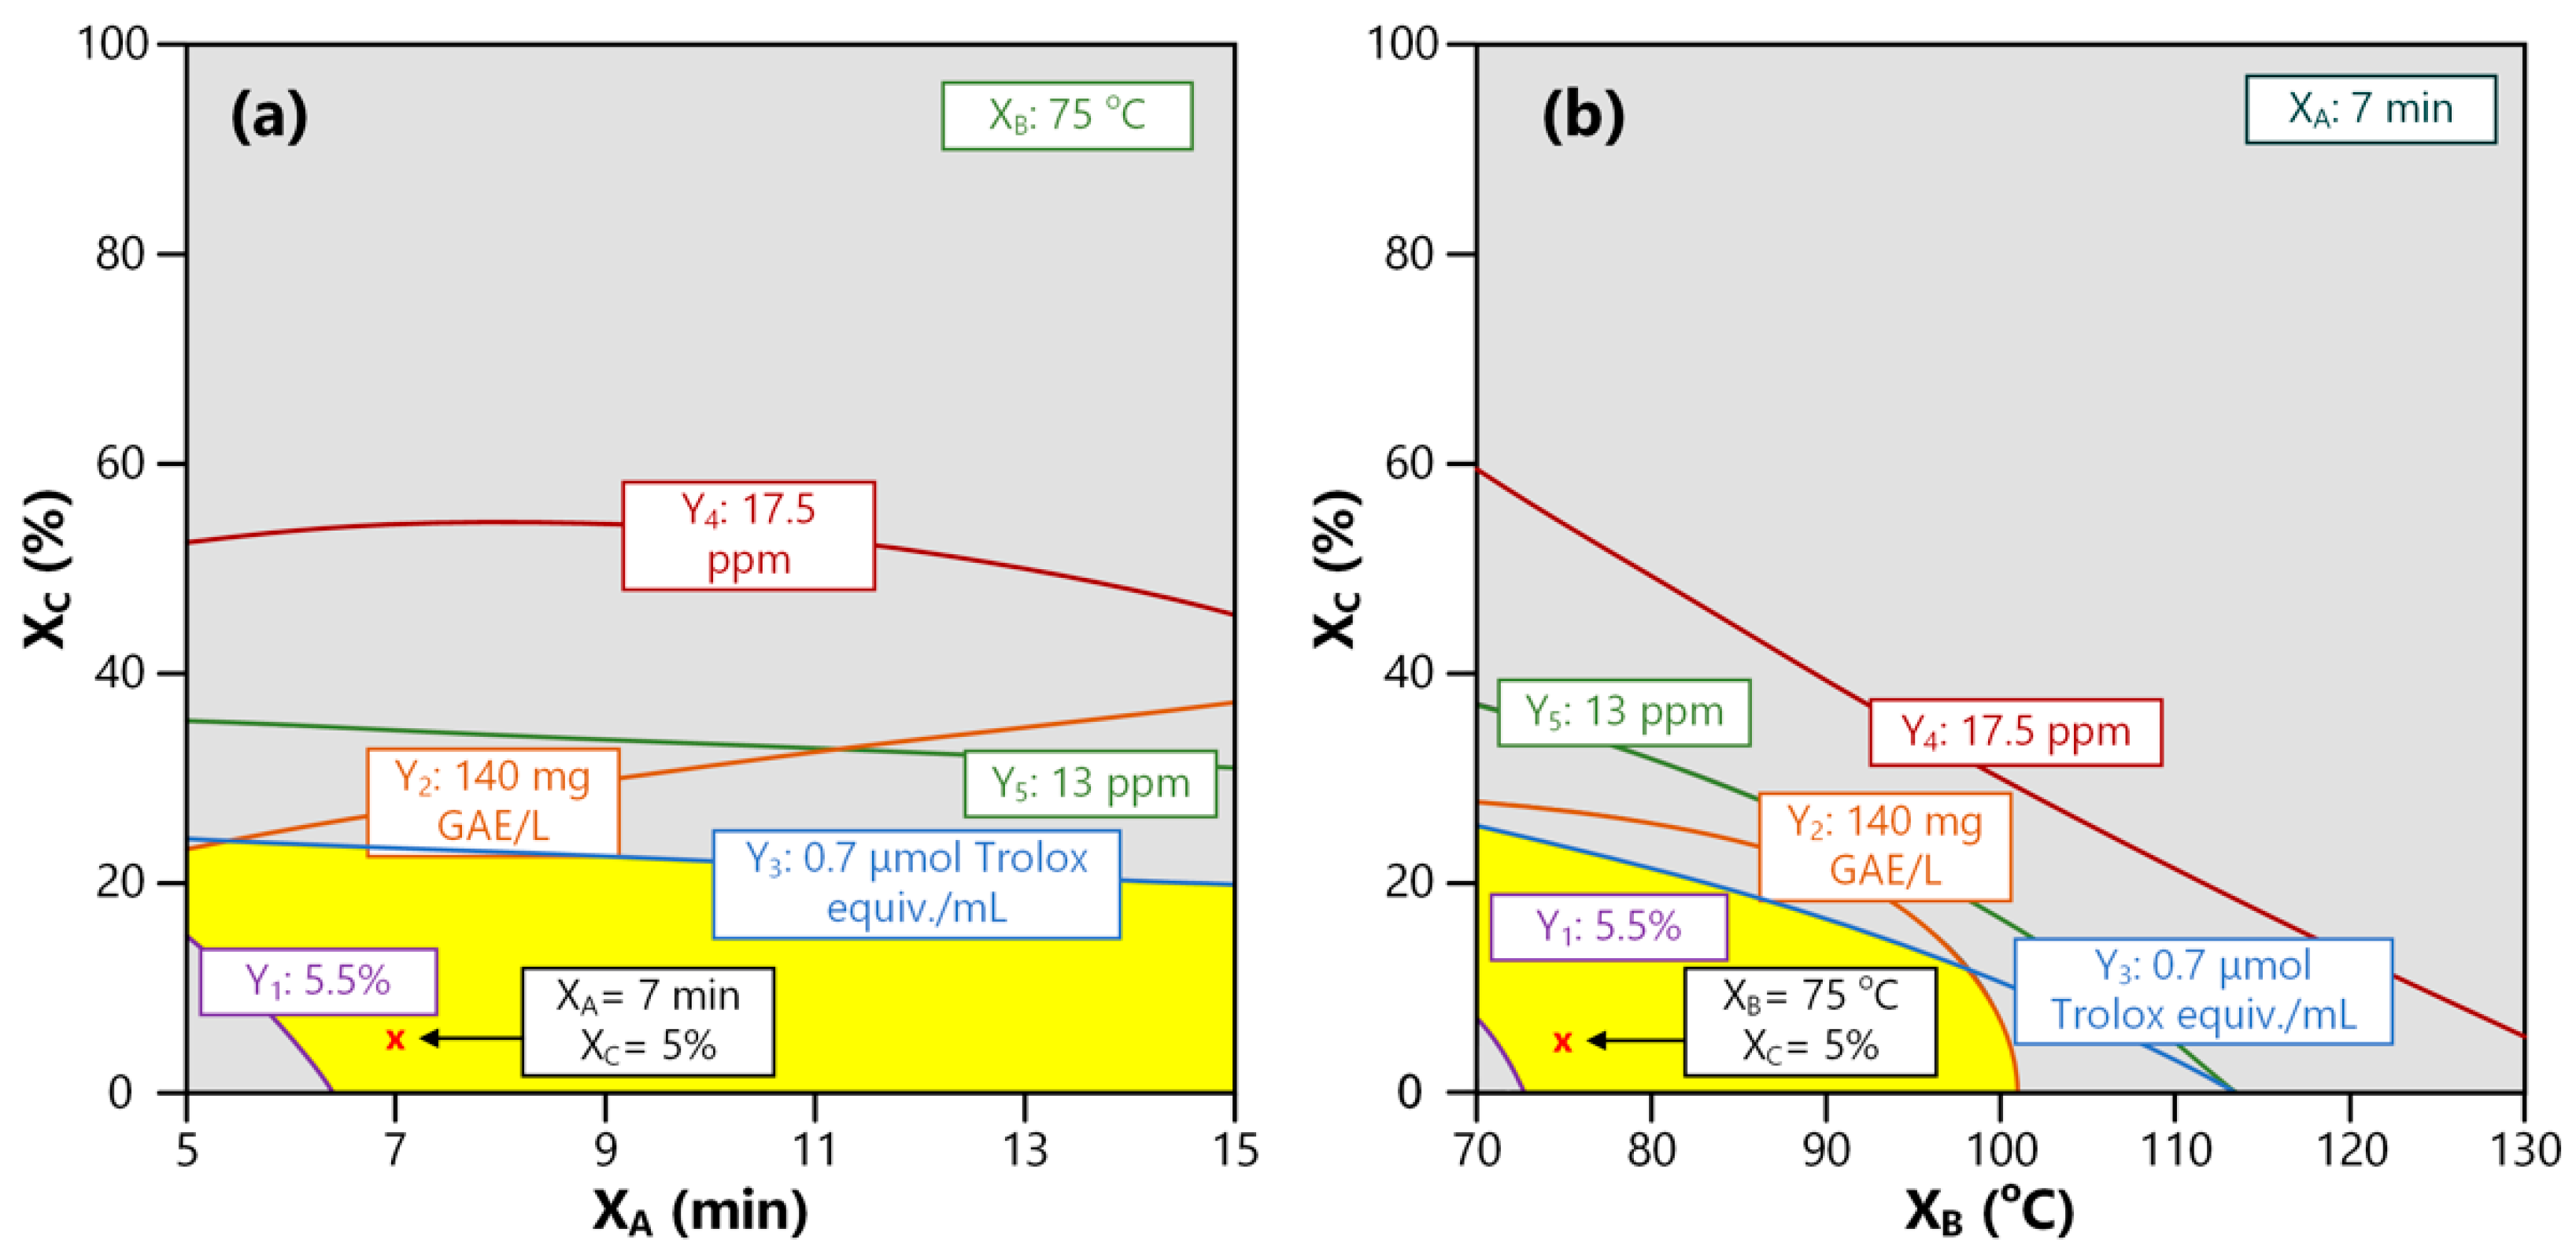
3.4. Optimization of Independent Variables and Validation Experiment

Based on the experimental design, graphical optimization was carried out using Design Expert® software (v. 12 free trial, Stat-Ease Inc. Minneapolis, MN), and a DSp was constructed via overlaying the contour plots, to establish an optimum set of extraction conditions in which most of the responses simultaneously maximized their values. To determine these optimum conditions, some lower-limit criteria were imposed for all the responses, while considering the economic viability of the process. Specifically, the desired goal for Y1 was set to be 5.5%, for Y2 ≥ 140 mg GAE per L, for Y3 ≥ 0.700 μmol Trolox equivalent per mL, for Y4 ≥ 17.5 ppm, and for Y5 ≥ 13 ppm. These values were chosen while taking into account those mentioned in other studies [18,19,23,25,28,35,51,52], but aiming to be achieved under a more economically and environmentally sustainable set of conditions (i.e., short operating times, low ethanol content, and median temperature).
The overlaying plot attained (Figure 4a,b) illustrates a bright yellow area in which all the imposed criteria were satisfied. Results showed a DSp located at low ethanol ratio (i.e., below 25%), low to moderate temperature (i.e., 72–100 °C), and a wide range of time (i.e., 7–15 min). Within this desired experimental space, the optimum set of conditions chosen for the process to be viable corresponded to time (XA) of 8 min, temperature (XB) of 75 °C, and ethanol ratio (XC) of 5%. Under the selected optimum conditions, the model predictions for all responses were: 5.65% for yield (Y1), 152.68 mg GAE per L for total phenolic content (Y2), 0.797 μmol Trolox equivalent per mL for the antioxidant activity (Y3), 30.5 ppm for caffeine concentration (Y4), and 17.4 ppm for chlorogenic acid concentration (Y5).
In order to examine the accuracy of the proposed model in terms of its effectiveness to predict the responses’ values, a validation experiment—using the same type of byproduct—was conducted under the optimal conditions selected above. Following that, characterization of the extracts was carried out; the measured values of the responses are listed in Table 4. It should be underlined that for the majority of the responses, there was a good agreement between the predicted and experimental values, with the difference between them ranging below 10% (Table 4). These results could imply the effective use of RSM in optimizing ASE to develop a sustainable cost-effective technique.
All the experimental values were in line or even better than those reported in the literature. In particular, the total phenolic content was found equal to 166.77 mg GAE/L (or 52.29 mg GAE/g dry sample) and higher compared to those obtained from other studies, which ranged between 12.58 and 17 mg GAE/g dry sample [18,25]. This value (52.29 mg GAE/g dry sample) was also better than the one reported by Shang et al. [35], who also applied pressurized liquid extraction (PLE) for the recovery of phenolics from SCGs, using water and ethanol as solvents. Similarly to total phenolic content, antioxidant activity showed a value of 252.63 μmol Trolox/g dry sample, which was higher compared to those measured in other studies [19,23].
Caffeine concentration in 100% Arabica SCGs was found to be equal to 9.01 mg per g of dry sample, in compliance with the results in corresponding literature reports [28,35]. It is worth noting that Panusa et al. [25] reported that the caffeine concentration recovered from 100% Arabica SCGs at 60 °C under continuous stirring for 30 min with distilled water as solvent was much lower, reaching a value of 0.97 mg per gram of dry sample.
On the other hand, based on the validation experiment, the chlorogenic acid concentration was measured equal to 5.24 mg/g of dry sample. This value agreed with the results of a study reporting CGA content ranging from 1.65 to 6.09 mg/g dry sample in SCGs with various ratios of Arabica/Robusta (for an extraction of 30 min under continuous stirring at 60 °C). Specifically for 100% Arabica, the CGA content reached 2.26 mg/g [25].
Similarly, Lopez-Barrera et al. [51] found that chlorogenic acid varied from 1.8 to 5.6 mg/g, while in the study of Balzano et al. [52], the values reported were much lower expect from the SCG sample formed by the 100% Robusta variety. Slightly better chlorogenic acid concentration was obtained in another study using distilled water as a solvent near the boiling temperature for approximately the same duration as in the present work [28]. The higher concentration could be attributed to: (i) the SCGs’ composition, which consisted of a proportion of Robusta variety; (ii) the fact that the temperature applied was higher; and (iii) the solvent used was water. Water generally favors the extraction of these water-soluble phenolic compounds, and at the same time can swell the solid residues, facilitating their penetration into them.
Based on the above, SCGs can be considered as a byproduct rich in bioactive compounds, and is essential to be managed and utilized as a resource for further value creation. To transform these residues into profitable substrates, cross-sector collaborations from governmental organizations to academic institutions and industry are required. In this context, new management strategies should be developed to create new opportunities for business with crucial impact in the global economy and the environment. Among these, several social and scientific impacts are also expected as a consequence of an integrated exploitation of these coffee residues. Regarding the economy, the development of new innovative cosmetic formulations with bioactive ingredients (cosmeceuticals) derived from residual coffee fits perfectly into the profile of products that can enhance the competitiveness, growth, and extroversion of the companies involved. Similarly, in the context of SCGs’ valorization, environmental awareness will be cultivated with an aim to motivate people to be concerned about the impacts of the products they consume. Additionally, due to these residues’ potential application in several fields, their utilization seems to be an opportunity for the creation of new jobs. Finally, at the scientific and research level, the expected benefits relate to the enhancement of the expertise of the research potential. Despite that, in the context of a careful plan for the protection of property rights, the possibility of exploiting the innovative ideas and technologies developed can generate significant economic revenues.

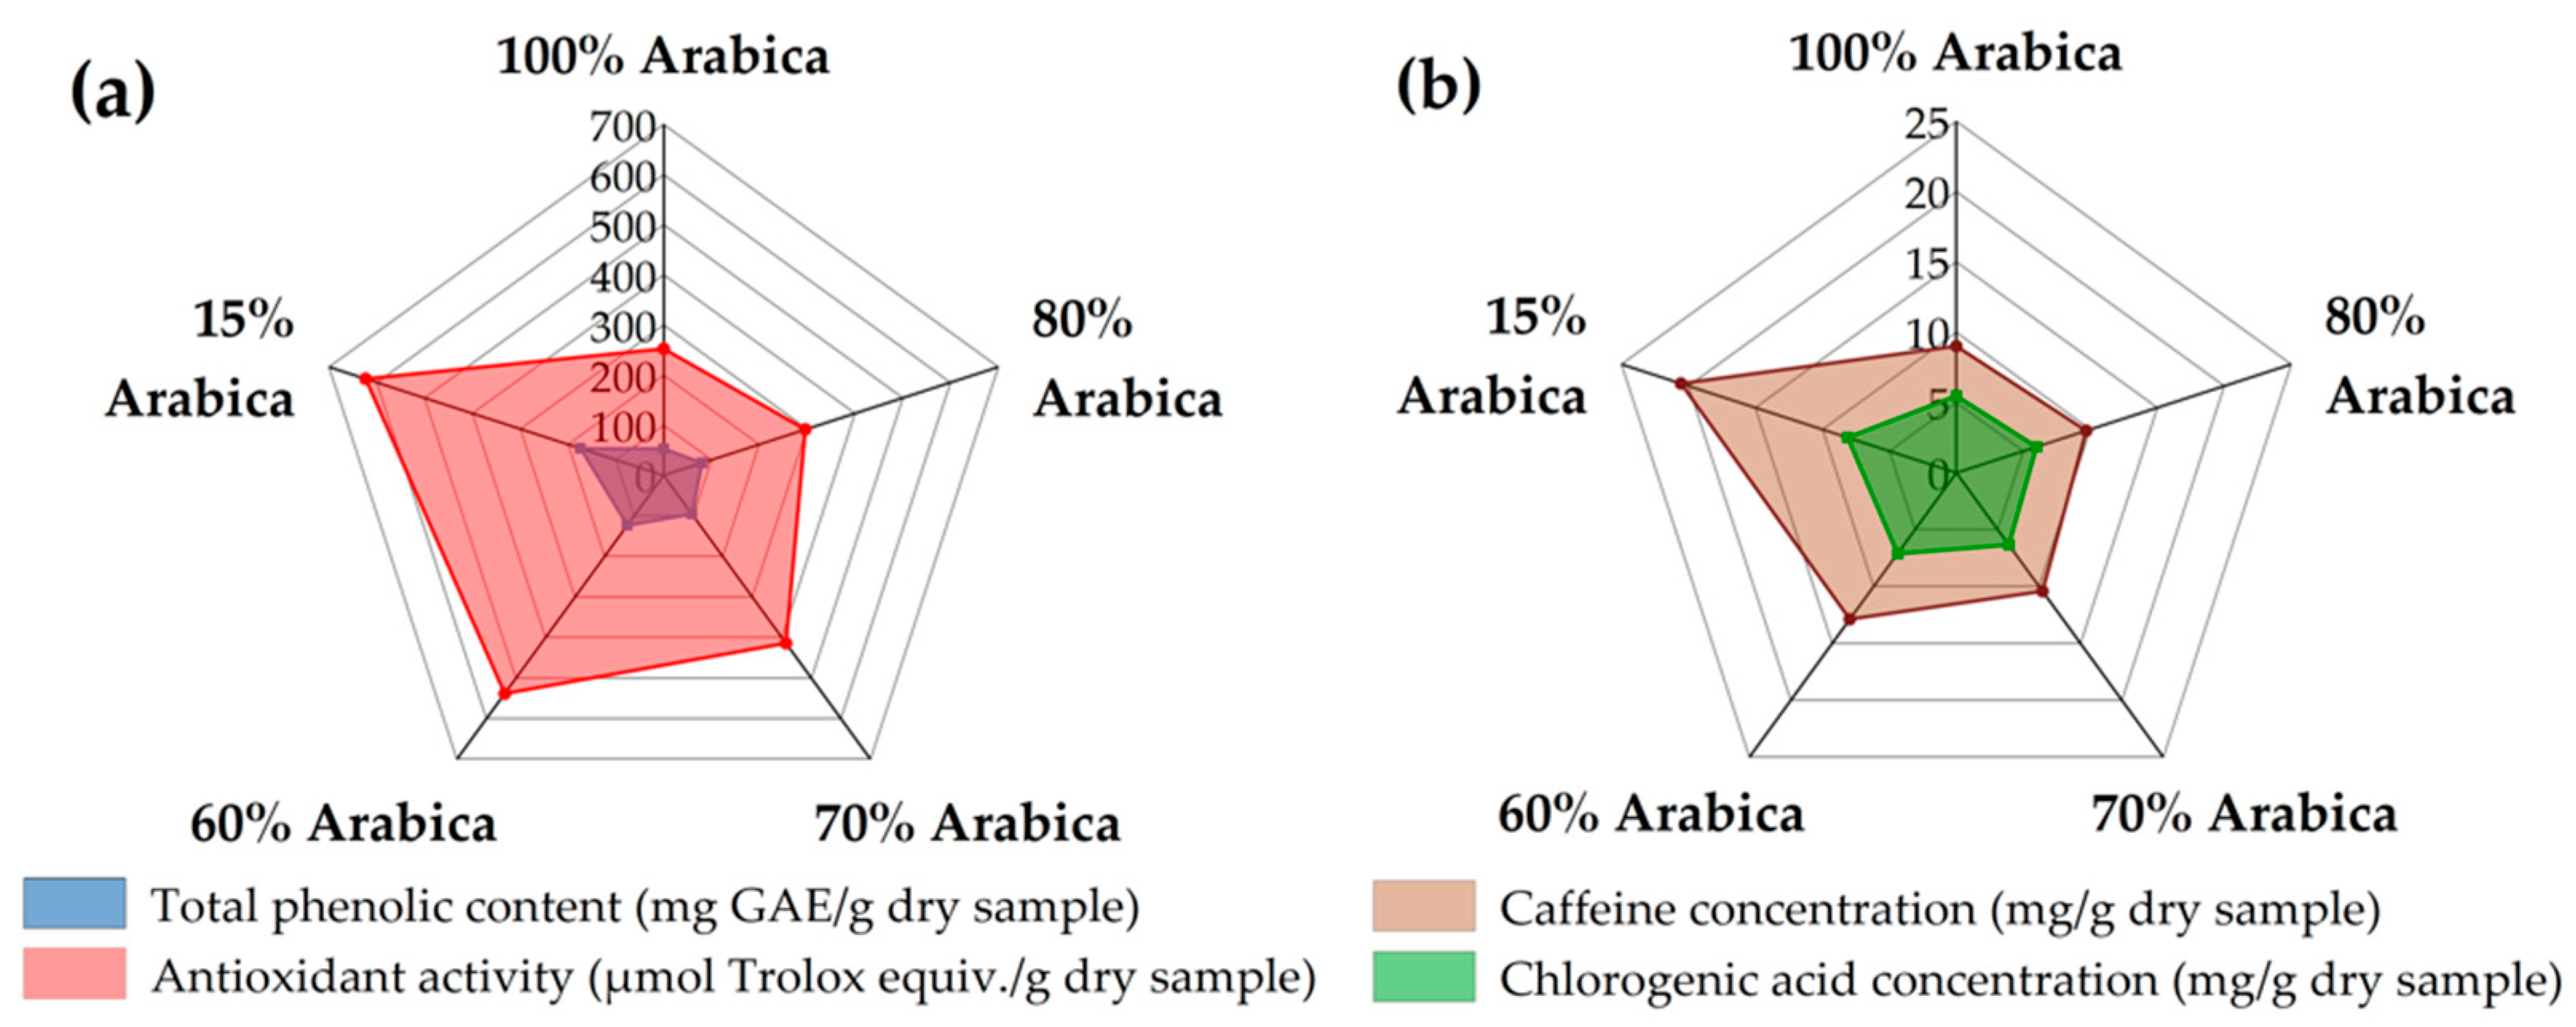
3.5. Extraction of Different Coffee Blends in Optimum Conditions

The type of byproduct used to all experiments described up to this point was 100% Arabica. In order to evaluate the effect of the Robusta variety on total phenolic content, antioxidant activity, and the concentrations of caffeine and chlorogenic acid, a series of experiments was performed on the optimal extraction conditions with ASE. These experiments were conducted using four coffee blends of different proportions of Arabica:Robusta varieties. The results are presented in Figure 5. All values are expressed per g of dry sample.
From Figure 5a,b, it is evident that the presence of the Robusta variety in the coffee blend contributed to the increase of all four measured quality characteristics. Specifically, there was an increment in the values of total phenolic content and antioxidant activity, and caffeine and chlorogenic acid concentrations, as the Robusta content in the coffee blend increased. This observation coincided with the results of similar studies in the literature [18,19,25,28,53].
In order to assess whether the differences of these values between the samples were statistically significant, ANOVA was applied. The differences are presented in Figure S6. In the case of total phenolic content, the only non-statistically significant difference was observed between dry spent coffee extracts of 80:20% and 70:30%. Regarding the antioxidant activity, the only non-statistically significant difference was detected between those of 100% and 80% Arabica (Figure S6a). Correspondingly, the differences in caffeine and chlorogenic acid concentrations were non-statistically significant between dry spent coffee extracts of 100%, 80%, and 70% Arabica in all possible combinations (Figure S6b). For all other samples, the p-value was less than 0.05, indicating the statistical significance of their differences.

4. Conclusions

The aim of the present study was to assess the potential content of SCGs in bioactive compounds, to compare different extraction techniques for the recovery of these components, and then to optimize the extraction method with the highest yield. Based on the preliminary experiments, ASE showed the best results in terms of this criterion, and its optimization was conducted aiming to develop a sustainable technique for the recovery of bioactive compounds from spent coffee grounds. For optimization, an RSM based on a three-level FCC was implemented to evaluate the effects of the three extraction variables (time, X1; temperature, X2; and ethanol ratio, X3) and their interactions to all responses (yield, Y1; total phenolic content, Y2; antioxidant activity, Y3; caffeine concentration, Y4; and chlorogenic acid concentration, Y5).
Based on ANOVA results, ethanol ratio was found to be one of the most statistically significant independent variables, with the greatest effect in all five responses. Then, ASE was optimized in order to find an optimal set of extraction conditions in which most of the responses simultaneously maximized their values. Under certain constraints on the acceptable thresholds for each response, an economically viable combination of experimental extraction conditions was chosen, with an extraction time of 7 min, a temperature of 75 °C, and an EtOH ratio of 5%.
The measured values of the responses obtained under the optimum conditions were evaluated as quite satisfactory. The high total phenolic content may be due to water, which represented the highest percentage of the binary solvent. Water’s high polarity implies reduced selectivity, thus increasing the overall rate of phenolic compounds recovered from SCGs. As a result of the high water ratio, the concentrations of caffeine and chlorogenic acid obtained were also high, possibly due to their hydrophilic nature. Additionally, the mild temperature applied played an important role in the extraction efficiency, as the decomposition of heat-sensitive compounds was prevented. The extraction duration chosen also seemed to be sufficient for the solvent to penetrate the pores of the sample and solubilize the target compounds, thus having a positive effect on the extraction efficiency. Conclusively, based on the extractions performed on four different coffee blends of Arabica and Robusta varieties, the inference reached was that the presence of the Robusta variety contributed to the increase of all the responses.
This work clearly justifies that the recovery of SCG extracts with high total phenolic content, antioxidant activity, and sufficient amounts of caffeine and chlorogenic acid can be achieved with the use of ASE, under short operation times and mild temperatures. Additionally, the results of this study provide clear evidence that water with low ethanol content can be used to obtain extracts rich in total phenolics, as well as caffeine and chlorogenic acid. In light of this, extracts do nοt need to undergo any further solvent separation steps and could be used directly for the development of cosmetic formulations. Thus, since the use of toxic solvents is excluded, the claims for ‘’green’’ and natural extracts were supported, and the sustainability analysis of the proposed extraction technique is expected to have positive economic, scientific, social, and environmental impacts. Therefore, additional collective effort from industry and research organizations is required, in order to develop a new, integrated, and holistic exploitation/management strategy to transform SCG wastes into resources of high commercial interest.

Supplementary Materials

The following are available online at https://www.mdpi.com/article/10.3390/su13168818/s1, Figure S1:Characteristic chromatogram from UHPLC analysis (blue line for diode array detection of caffeine at 276 nm and green line for diode array detection of chlorogenic acid at 330 nm); Figure S2: Correlation between predicted and experimental values for all the responses (a) extraction yield (%), Y1; (b) total phenolic content (mg GAE/L), Y2; (c) antioxidant activity (μmol Trolox equiv./mL), Y3; (d) caffeine concentration (ppm), Y4 and (e) chlorogenic acid concentration (ppm), Y5; Figure S3: Normal probability plots versus internally studentized residuals for (a) extraction yield, Y1; (b) total phenolic content, Y2; (c) antioxidant activity, Y3; (d) caffeine concentration, Y4 and (e) chlorogenic acid concentration, Y5; Figure S4: Response surfaces and contour plots for all responses (a) extraction yield, Y1; (b) total phenolic content, Y2; (c) antioxidant activity (DPPH), Y3; (d) caffeine concentration, Y4 and (e) chlorogenic acid (CGA) concentration, Y5; as a function of time (XA) and temperature (XB); Figure S5: Response surfaces and contour plots for all responses (a) extraction yield, Y1; (b) total phenolic content, Y2; (c) antioxidant activity (DPPH), Y3; (d) caffeine concentration, Y4 and (e) chlorogenic acid (CGA) concentration, Y5; as a function of time (XA) and ethanol: water ratio (XC); Figure S6: Bar charts of statistically significant differences between the samples regarding: (a) total phenolic content and antioxidant activity; (b) caffeine and chlorogenic acid concentration.

Author Contributions

Conceptualization, K.N.K. and A.N.A.; methodology, K.N.K.; validation, K.N.K. and G.F.B.; formal analysis, G.-C.M. and K.N.K.; investigation, G.-C.M.; resources, A.N.A.; data curation, K.N.K., G.-C.M., M.B., and G.F.B.; writing—original draft preparation, G.-C.M. and K.N.K.; writing—review and editing, K.N.K., M.B., G.F.B., and A.N.A.; visualization, K.N.K. and G.-C.M.; supervision, A.N.A.; project administration, A.N.A.; funding acquisition, A.N.A. All authors have read and agreed to the published version of the manuscript.

Funding

The authors would like to acknowledge the support of this work from the project “Upgrading the Plant Capital (PlantUp)” (MIS 5002803), which is implemented under the Action “Reinforcement of the Research and Innovation Infrastructure,” funded by the Operational Programme “Competitiveness, Entrepreneurship and Innovation” (NSRF 2014–2020) and co-financed by Greece and the European Union (European Regional Development Fund).

Institutional Review Board Statement

Not applicable.

Informed Consent Statement

Not applicable.

Data Availability Statement

Not applicable.

Conflicts of Interest

The authors declare no conflict of interest.

References

  1. International Coffee Organization. Coffee Market Report-June 2021. Available online: http://www.ico.org/documents/cy2020-21/cmr-0621-e.pdf (accessed on 29 July 2021).
  2. Galanakis, C. Handbook of Coffee Processing By-Products: Sustainable Applications; Academic Press: Cambridge, MA, USA, 2017. [Google Scholar]
  3. Poore, J.; Nemecek, T. Reducing food’s environmental impacts through producers and consumers. Science 2018, 360, 987–992. [Google Scholar] [CrossRef] [Green Version]
  4. Kamil, M.; Ramadan, K.M.; Olabi, A.G.; Shanableh, A.; Ghenai, C.; Al Naqbi, A.K.; Awad, O.I.; Ma, X. Comprehensive evaluation of the life cycle of liquid and solid fuels derived from recycled coffee waste. Resour. Conserv. Recycl. 2019, 150, 104446. [Google Scholar] [CrossRef]
  5. Mata, T.; Martins, A.; Caetano, N.S. Bio-refinery approach for spent coffee grounds valorization. Bioresour. Technol. 2018, 247, 1077–1084. [Google Scholar] [CrossRef]
  6. Zabaniotou, A.; Kamaterou, P. Food waste valorization advocating Circular Bioeconomy—A critical review of potentialities and perspectives of spent coffee grounds biorefinery. J. Clean. Prod. 2019, 211, 1553–1566. [Google Scholar] [CrossRef]
  7. Vítěz, T.; Koutný, T.; Šotnar, M.; Chovanec, J. On the spent coffee grounds biogas production. Acta Univ. Agric. et Silvic. Mendel. Brun. 2016, 64, 1279–1282. [Google Scholar] [CrossRef] [Green Version]
  8. Martinez-Saez, N.; García, A.T.; Pérez, I.D.; Rebollo-Hernanz, M.; Mesias, M.; Morales, F.J.; Martín-Cabrejas, M.A.; del Castillo, M.D. Use of spent coffee grounds as food ingredient in bakery products. Food Chem. 2017, 216, 114–122. [Google Scholar] [CrossRef] [PubMed]
  9. Choi, H.-S.; Park, E.D.; Park, Y.; Han, S.H.; Hong, K.B.; Suh, H.J. Topical application of spent coffee ground extracts protects skin from ultraviolet B-induced photoaging in hairless mice. Photochem. Photobiol. Sci. 2016, 15, 779–790. [Google Scholar] [CrossRef]
  10. Marto, J.; Gouveia, L.; Chiari-Andréo, B.G.; Paiva, A.; Isaac, V.; Pinto, P.; Simões, P.; Almeida, A.; Ribeiro, H. The green generation of sunscreens: Using coffee industrial sub-products. Ind. Crop. Prod. 2016, 80, 93–100. [Google Scholar] [CrossRef] [Green Version]
  11. Ribeiro, H.; Marto, J.; Raposo, S.; Agapito, M.; Isaac, V.; Chiari, B.G.; Lisboa, P.F.; Paiva, A.; Barreiros, S.; Simões, P. From coffee industry waste materials to skin-friendly products with improved skin fat levels. Eur. J. Lipid Sci. Technol. 2013, 115, 330–336. [Google Scholar] [CrossRef]
  12. Liang, N.; Kitts, D.D. Role of chlorogenic acids in controlling oxidative and inflammatory stress conditions. Nutrients 2015, 8, 16. [Google Scholar] [CrossRef] [Green Version]
  13. Girsang, E.; Lister, I.N.E.; Ginting, C.N.; Nasution, S.L.; Suhartina, S.; Munshy, U.Z.; Rizal, R.; Widowati, W. Antioxidant and anti-inflammatory activity of chlorogenic acid on lead-induced fibroblast cells. J. Phys. Conf. Ser. 2019, 1374. [Google Scholar] [CrossRef]
  14. Massaya, J.; Pereira, A.P.; Mills-Lamptey, B.; Benjamin, J.; Chuck, C.J. Conceptualization of a spent coffee grounds biorefinery: A review of existing valorisation approaches. Food Bioprod. Process. 2019, 118, 149–166. [Google Scholar] [CrossRef]
  15. Matrapazi, V.; Zabaniotou, A. Experimental and feasibility study of spent coffee grounds upscaling via pyrolysis towards proposing an eco-social innovation circular economy solution. Sci. Total Environ. 2020, 718, 137316. [Google Scholar] [CrossRef]
  16. Rivera, X.C.S.; Gallego-Schmid, A.; Najdanovic-Visak, V.; Azapagic, A. Life cycle environmental sustainability of valorisation routes for spent coffee grounds: From waste to resources. Resour. Conserv. Recycl. 2020, 157, 104751. [Google Scholar] [CrossRef]
  17. Stylianou, M.; Agapiou, A.; Omirou, M.; Vyrides, I.; Ioannides, I.M.; Maratheftis, G.; Fasoula, D. Converting environmental risks to benefits by using spent coffee grounds (SCG) as a valuable resource. Environ. Sci. Pollut. Res. 2018, 25, 35776–35790. [Google Scholar] [CrossRef]
  18. Zuorro, A.; Lavecchia, R. Spent coffee grounds as a valuable source of phenolic compounds and bioenergy. J. Clean. Prod. 2012, 34, 49–56. [Google Scholar] [CrossRef]
  19. Bravo, J.; Juaniz, I.; Monente, C.; Caemmerer, B.; Kroh, L.; Lothar, W.; de Peña, M.-P.; Cid, C. Evaluation of spent coffee obtained from the most common coffeemakers as a source of hydrophilic bioactive compounds. J. Agric. Food Chem. 2012, 60, 12565–12573. [Google Scholar] [CrossRef] [PubMed]
  20. Battista, F.; Barampouti, E.M.; Mai, S.; Bolzonella, D.; Malamis, D.; Moustakas, K.; Loizidou, M. Added-value molecules recovery and biofuels production from spent coffee grounds. Renew. Sustain. Energy Rev. 2020, 131, 110007. [Google Scholar] [CrossRef]
  21. Martin, D.S.; Orive, M.; Iñarra, B.; Garcia, A.; Goiri, I.; Atxaerandio, R.; Urkiza, J.; Zufía, J. Spent coffee ground as second-generation feedstuff for dairy cattle. Biomass Convers. Biorefinery 2021, 11, 589–599. [Google Scholar] [CrossRef]
  22. Alves, R.C.; Rodrigues, F.; Nunes, M.A.; Vinha, A.F.; Oliveira, M.B.P.P. State of the art in coffee processing by-products. In Handbook of Coffee Processing By-Products; Elsevier: Amsterdam, The Netherlands, 2017; pp. 1–26. [Google Scholar]
  23. Severini, C.; Derossi, A.; Fiore, A. Ultrasound-assisted extraction to improve the recovery of phenols and antioxidants from spent espresso coffee ground: A study by response surface methodology and desirability approach. Eur. Food Res. Technol. 2017, 243, 835–847. [Google Scholar] [CrossRef]
  24. McNutt, J.; He, Q. Spent coffee grounds: A review on current utilization. J. Ind. Eng. Chem. 2019, 71, 78–88. [Google Scholar] [CrossRef]
  25. Panusa, A.; Zuorro, A.; Lavecchia, R.; Marrosu, G.; Petrucci, R. Recovery of natural antioxidants from spent coffee grounds. J. Agric. Food Chem. 2013, 61, 4162–4168. [Google Scholar] [CrossRef] [PubMed]
  26. Okur, I.; Soyler, B.; Sezer, P.; Oztop, M.H.; Alpas, H. Improving the recovery of phenolic compounds from Spent Coffee Grounds (SCG) by environmentally friendly extraction techniques. Molecules 2021, 26, 613. [Google Scholar] [CrossRef] [PubMed]
  27. Andrade, K.; Gonçalvez, R.T.; Maraschin, M.; Ribeiro-Do-Valle, R.M.; Martínez, J.; Ferreira, S.R.S. Supercritical fluid extraction from spent coffee grounds and coffee husks: Antioxidant activity and effect of operational variables on extract composition. Talanta 2012, 88, 544–552. [Google Scholar] [CrossRef]
  28. Cruz, R.; Cardoso, M.M.; Fernandes, L.; Oliveira, M.; Mendes, E.; Baptista, P.; Morais, S.; Casal, S. Espresso coffee residues: A valuable source of unextracted compounds. J. Agric. Food Chem. 2012, 60, 7777–7784. [Google Scholar] [CrossRef]
  29. Zuorro, A.; Lavecchia, R. Polyphenols and energy recovery from spent coffee grounds. Chem. Eng. Trans. 2011, 25, 285–290. [Google Scholar] [CrossRef]
  30. Mussatto, S.I.; Ballesteros, L.F.; Martins, S.; Teixeira, J. Extraction of antioxidant phenolic compounds from spent coffee grounds. Sep. Purif. Technol. 2011, 83, 173–179. [Google Scholar] [CrossRef] [Green Version]
  31. Prado, J.; Vardanega, R.; Debien, I.C.; Meireles, M.A.D.A.; Gerschenson, L.N.; Sowbhagya, H.B.; Chemat, S. Conventional extraction. In Food Waste Recovery; Elsevier: Amsterdam, The Netherlands, 2015; pp. 127–148. [Google Scholar]
  32. Pavlović, M.D.; Buntić, A.; Šiler-Marinković, S.S.; Dimitrijevic-Brankovic, S. Ethanol influenced fast microwave-assisted extraction for natural antioxidants obtaining from spent filter coffee. Sep. Purif. Technol. 2013, 118, 503–510. [Google Scholar] [CrossRef]
  33. De Melo, M.M.; Silvestre, A.J.; Portugal, I.; Silva, C.M. Emerging technologies for the recovery of valuable compounds from coffee processing by-products. In Handbook of Coffee Processing By-Products; Elsevier: Amsterdam, The Netherlands, 2017; pp. 141–169. [Google Scholar]
  34. Carciochi, R.A.; D’Alessandro, L.G.; Vauchel, P.; Rodriguez, M.M.; Nolasco, S.M.; Dimitrov, K. Valorization of Agrifood By-Products by Extracting Valuable Bioactive Compounds Using Green Processes. In Ingredients Extraction by Physicochemical Methods in Food; Elsevier: Amsterdam, The Netherlands, 2017; pp. 191–228. [Google Scholar]
  35. Shang, Y.-F.; Xu, J.-L.; Lee, W.-J.; Um, B.-H. Antioxidative polyphenolics obtained from spent coffee grounds by pressurized liquid extraction. S. Afr. J. Bot. 2017, 109, 75–80. [Google Scholar] [CrossRef]
  36. Mariotti-Celis, M.S.; Martínez-Cifuentes, M.; Huamán-Castilla, N.; Vargas-González, M.; Pedreschi, F.; Pérez-Correa, J.R. The antioxidant and safety properties of spent coffee ground extracts impacted by the combined hot pressurized liquid extraction-resin purification process. Molecules 2017, 23, 21. [Google Scholar] [CrossRef] [Green Version]
  37. Galanakis, C.M. The universal recovery strategy. In Food Waste Recovery; Elsevier: Amsterdam, The Netherlands, 2015; pp. 59–81. [Google Scholar]
  38. Osorio-Tobón, J.F.; Meireles, M.A.A. Recent applications of pressurized fluid extraction: Curcuminoids extraction with pressurized liquids. Food Public Health 2013, 3, 289–303. [Google Scholar] [CrossRef] [Green Version]
  39. Efthymiopoulos, I.; Hellier, P.; Ladommatos, N.; Eveleigh, A.; Mills-Lamptey, B. Factors affecting the efficiency of pres-surized solvent extraction of oil from spent coffee grounds. Detritus 2019, in press. [Google Scholar] [CrossRef] [Green Version]
  40. Mottaleb, M.A.; Sarker, S.D. Accelerated solvent extraction for natural products isolation. In Methods in Molecular Biology; Springer Science and Business Media LLC: Berlin/Heidelberg, Germany, 2012; Volume 864, pp. 75–87. [Google Scholar]
  41. NIST/SEMATECH e-Handbook of Statistical Methods. Available online: https://www.itl.nist.gov/div898/handbook/ (accessed on 14 March 2020).
  42. Montgomery, D.C. Design and Analysis of Experiments, 3rd ed.; John Wiley & Sons: New York, NY, USA, 1991; pp. 521–568. [Google Scholar]
  43. Myers, R.H.; Montgomery, D.C.; Anderson-Cook, C.M. Response Surface Methodology: Process and Product Optimization Using Designed Experiments; John Wiley & Sons: New York, NY, USA, 2016. [Google Scholar]
  44. Everette, J.D.; Bryant, Q.M.; Green, A.M.; Abbey, Y.A.; Wangila, G.W.; Walker, R.B. Thorough study of reactivity of various compound classes toward the folin-ciocalteu reagent. J. Agric. Food Chem. 2010, 58, 8139–8144. [Google Scholar] [CrossRef] [Green Version]
  45. Murthy, P.S.; Naidu, M.M. Recovery of phenolic antioxidants and functional compounds from coffee industry by-products. Food Bioprocess Technol. 2012, 5, 897–903. [Google Scholar] [CrossRef]
  46. Somnuk, K.; Eawlex, P.; Prateepchaikul, G. Optimization of coffee oil extraction from spent coffee grounds using four solvents and prototype-scale extraction using circulation process. Agric. Nat. Resour. 2017, 51, 181–189. [Google Scholar] [CrossRef]
  47. Ahangari, B.; Sargolzaei, J. Extraction of lipids from spent coffee grounds using organic solvents and supercritical carbon dioxide. J. Food Process. Preserv. 2012, 37, 1014–1021. [Google Scholar] [CrossRef]
  48. Al-Hamamre, Z.; Foerster, S.; Hartmann, F.; Kröger, M.; Kaltschmitt, M. Oil extracted from spent coffee grounds as a re-newable source for fatty acid methyl ester manufacturing. Fuel 2012, 96, 70–76. [Google Scholar] [CrossRef]
  49. Sun, H.; Ge, X.; Lv, Y.-K.; Wang, A. Application of accelerated solvent extraction in the analysis of organic contaminants, bioactive and nutritional compounds in food and feed. J. Chromatogr. A 2012, 1237, 1–23. [Google Scholar] [CrossRef]
  50. Le Man, H.; Behera, S.K.; Park, H.S. Optimization of operational parameters for ethanol production from Korean food waste leachate. Int. J. Environ. Sci. Technol. 2010, 7, 157–164. [Google Scholar] [CrossRef] [Green Version]
  51. López-Barrera, D.M.; Vázquez-Sánchez, K.; Loarca-Piña, G.; Campos-Vega, R. Spent coffee grounds, an innovative source of colonic fermentable compounds, inhibit inflammatory mediators in vitro. Food Chem. 2016, 212, 282–290. [Google Scholar] [CrossRef] [PubMed]
  52. Balzano, M.; Loizzo, M.R.; Tundis, R.; Lucci, P.; Nuñez, O.; Fiorini, D.; Giardinieri, A.; Frega, N.G.; Pacetti, D. Spent espresso coffee grounds as a source of anti-proliferative and antioxidant compounds. Innov. Food Sci. Emerg. Technol. 2020, 59, 102254. [Google Scholar] [CrossRef]
  53. Mussatto, S.I.; Carneiro, L.M.; Silva, J.P.; Roberto, I.; Teixeira, J. A study on chemical constituents and sugars extraction from spent coffee grounds. Carbohydr. Polym. 2011, 83, 368–374. [Google Scholar] [CrossRef] [Green Version]
Figure 1. Spent Coffee Grounds yields using different extraction methods and solvents (Soxhlet apparatus in green bar; Ultrasound Assisted Extraction in purple bar and Accelerated Solvent Extraction in blue bar).
Sustainability 13 08818 g001
Figure 2. FCC perturbation plots for: (a) yield, Y1; (b) total phenolic content, Y2; (c) antioxidant activity (DPPH), Y3; (d) caffeine concentration-, Y4; and (e) chlorogenic acid concentration, Y5 (time, XA factor with green; temperature, XB factor with red; and ethanol:water ratio, XC factor with blue line).
Sustainability 13 08818 g002
Figure 3. Response surfaces and contour plots for all responses (a) yield, Y1; (b) total phenolic content, Y2; (c) antioxidant activity (DPPH), Y3; (d) caffeine concentration, Y4; and (e) chlorogenic acid concentration, Y5, as a function of temperature (XB) and ethanol:water ratio (XC).
Sustainability 13 08818 g003
Figure 4. Overlay contour plots depicting the optimum DSp (yellow area) (a) time, XA vs ethanol:water ratio, XC; (b) temperature, XB vs ethanol:water ratio, XC. The red x-mark shows the selected optimum conditions.
Sustainability 13 08818 g004
Figure 5. Radar diagram for: (a) total phenolic content and antioxidant activity alterations; and (b) caffeine and chlorogenic acid concentration alterations, in the coffee residue extracts of different proportions of Arabica:Robusta.
Sustainability 13 08818 g005
Table 1. Accelerated solvent-extraction conditions employed.
Accelerated Solvent Extraction
Solventn-HexaneEtOHEtOH: H2O (50:50 v/v)
Solvent vol. (mL)199187163
Dry sample (g)11.6711.3211.51
Static time (min)101010
Cycles333
Rinse volume (%)505050
Temperature (°C)909090
Table 2. FCC experimental design and observed responses for ASE of SCGs.
RunFactors Responses
XA (min)XB (°C)XC (%)Y1 (% w/w)Y2 (mg GAE/L)Y3 (μmol Trolox equiv./mL)Y4 (ppm)Y5 (ppm)
115100508.69117.470.4811.767.52
2101305011.8288.800.4110.005.73
3157010015.2166.970.3010.864.17
41010007.32152.240.9224.7913.68
51513010019.7534.800.425.912.70
657005.20146.800.7832.0018.74
715100508.9775.160.372.775.29
857010015.6528.690.2710.682.70
957005.18150.290.7635.0419.31
101070507.02148.920.6822.1914.56
111513010017.7525.990.364.042.39
121010010017.8862.870.2912.843.55
131010010019.4949.240.299.993.29
145100507.46125.760.5217.999.30
15513008.08121.600.6919.7613.73
1615100508.56159.850.6019.749.74
17513010018.6478.540.376.853.86
1810100508.6295.680.488.976.60
1957005.24143.460.8030.6918.16
20157006.00162.580.8131.5018.59
211070507.08146.860.7020.8914.01
225100506.84163.950.6418.1313.13
235100508.2287.460.4110.655.47
24513010016.2976.730.348.657.90
251010008.55146.190.9221.6312.52
26157005.62162.590.7633.8317.52
2715130012.5086.090.5212.796.72
2857010018.3843.750.348.753.81
2910100508.44148.920.6617.469.93
301070507.30144.820.7219.1513.47
31513008.52122.450.6719.8812.54
3215130012.7999.730.5512.327.31
33513010021.1080.630.4010.396.46
3415130013.11113.410.7712.167.90
3557010013.3413.700.2011.411.58
36513008.83122.970.6618.7711.34
371010006.59158.480.6927.1914.83
38157005.75161.990.7932.2118.05
39101305011.11132.530.5716.368.88
40101305012.6645.110.268.342.59
41157010015.3438.330.277.993.17
42157010015.249.600.246.742.17
4310100508.9858.770.355.895.05
441513010021.9343.750.488.904.00
4510100508.2979.260.416.654.82
461010010021.3535.550.486.183.02
XA, extraction time; XB, temperature; Xc, ethanol ratio; Y1, yield; Y2, total phenolic content; Y3, antioxidant activity; Y4, caffeine concentration; Y5, chlorogenic acid concentration.
Table 3. ANOVA results for the employed FCC experimental design of ASE of SCGs (insignificant factors were eliminated for the convenience of presentation).
FactorsResponses
Y1Y2Y3Y4Y5
Fp-ValueFp-ValueFp-ValueFp-ValueFp-Value
XA39.68<0.0001----5.270.02777.950.0075
XB376.12<0.00014.510.0407--47.71<0.000136.39<0.0001
XC1017.57<0.000195.21<0.0001107.24<0.0001136.05<0.0001204.1<0.0001
XAXB4.740.03614.840.0344----6.120.0178
XAXC24.64<0.0001--------
XCXB156.25<0.000110.310.00289.350,004023.94<0.000138.32<0.0001
XA212.340.0012-- --
XB2---- --
XC276.90<0.00015.190.0287 4.000.0530
R20.97940.77590.75430.86110.8829
XA, extraction time; XB, temperature; Xc, ethanol ratio; Y1, yield; Y2, total phenolic content; Y3, antioxidant activity; Y4, caffeine concentration; Y5, chlorogenic acid concentration.
Table 4. Confirmation factor for all responses after the validation experiment.
ResponsePredicted ValuesExperimental Values (Mean ± SD)Confirmation Factor (%)
Y1: Yield (% w/w)5.656.09 ± 0.2293
Y2: ΤPC (mg GAE/L)152.67166.77 ± 4.2692
Y3: DPPH (μmol Trolox equiv./mL)0.790.80 ± 0.0499
Y4: Ccaffeine (ppm)30.5028.72 ± 1.2094
Y5: CCGA (ppm)17.4016.72 ± 0.7396
Yield: extraction yield, total phenolic content (TPC), antioxidant activity (DPPH), caffeine concentration (Ccaffeine) and chlorogenic acid concentration (CCGA).
Publisher’s Note: MDPI stays neutral with regard to jurisdictional claims in published maps and institutional affiliations.

