Article

Spatial-Temporal Integrated Measurement of the Efficiency of Urban Land Use in Yellow River Basin

1
College of Resources and Environment, Lanzhou University, Lanzhou 730000, China
2
Northwest Institute of Eco-Environment and Resources, Chinese Academy of Sciences, Lanzhou 730000, China
3
College of Geography and Environmental Science, Northwest Normal University, Lanzhou 730070, China
*
Author to whom correspondence should be addressed.
Sustainability 2021, 13(16), 8902; https://doi.org/10.3390/su13168902
Submission received: 27 June 2021 / Revised: 5 August 2021 / Accepted: 5 August 2021 / Published: 9 August 2021
(This article belongs to the Special Issue Public Services and Environmental Sustainability)

Abstract

:
As the product of natural process, land is an essential but nonrenewable resource for humankind. Urban land use efficiency directly reflects the coupling between urban systems and land use systems. It also serves as the key indicator for measuring land productivity and regional development quality. In this study, the land use efficiency of 65 county-level cities in the Yellow River Basin has been measured by applying the Data Envelope Analysis (DEA) and Spatial Autocorrelation Analysis methods. It makes up for the deficiency and defect of the existing research. The result indicates that in 2000~2018, the overall urban land use efficiency in 65 prefecture-level cities is unbalanced, with significant gaps between cities with high efficiency and low efficiency. In 2000~2018, the average urban land use efficiency in these 65 cities shows a tendency of declining. In 2000~2018, the spatial distribution of land use efficiency of these 65 cities indicates significant positive correlation, featured by the clustering of regions with high (low) efficiency. In terms of the spatial distribution of urban land use efficiency in the Yellow River Basin, it is marked by apparent spatial clustering. Specifically, from east to west, from coastal areas to inland regions, from downstream to upstream, the urban land use efficiency differs from high value areas to low value areas. On the whole, it is featured by high value in the east and low value in the west, while declining from downstream to upstream.

1. Introduction

As the product of natural process, land is an essential but nonrenewable resource for humankind. It represents the integration of natural and economic development driven by an array of natural factors and human activities [1]. Constrained by the limited scale, fixed distribution and scarce supply of land resources, people have to use land in a rational way and make all efforts to improve its use efficiency [2]. The urban land use efficiency directly manifests the coupling level between the urban system and the land use system. It also serves as a key indicator to measure the land output capacity and the quality of regional development [3]. Since the beginning of the reform and opening up policy, the urbanization process in China has been accelerating. From 2005 to 2018, the urbanization level has increased from 45.6% to 59.98%, with an average annual growth rate of 1.03%. However, in this process, large patches of agricultural land have been converted into urban land. Worse still, such phenomena as unscientific structure of urban land use and low efficiency of urban land use still exist, which directly impedes the efficiency of urban land use [4]. In the future, a large number of rural residents will flow into cities. As a result, the scale of cities will be further expanded, along with increasing demand for urban land resources necessitated by such activities, which has been limited, driven by people’s living and industrial development at the national scale. In this way, the conflict between the supply of and demand for urban construction land will exacerbate.
The Yellow River Basin is a major river basin of great significance for China and the world as a whole. In September 2019, the Chinese government proposed to elevate the ecological preservation and high-quality development of the Yellow River Basin as a major national strategy, thus creating a new starting point for the better development of the basin and coastal areas. Originating at an elevation 4500 m in the northern Bayan Har Mountains in Qinghai Province, the Yellow River flows through nine provinces including Qinghai, Sichuan, Gansu, Ningxia, Inner Mongolia, Shanxi, Shaanxi, Henan and Shandong. It empties into the Bohai Sea, near the Kenli County in Shandong Province, with a full length of 5464 km and a total drop of 4448 m. Based on marked differences in hydrological and geographical features, the Yellow River is divided into three sections, namely the upstream, middle and downstream, with Hekou Town separating the upstream and middle stream and Taohuayu separating the middle and downstream.
The Yellow River Basin defined in this study includes two types of areas. The first type refers to the area through which the Yellow River flows, namely, the area directly involved in the Yellow River Basin, consisting of 70 prefecture-level cities; the second type includes those beyond the Yellow River Basin but with strong social and economic ties with the Yellow River. These are important Yellow River irrigation areas or recipient areas of Yellow River water diversion projects, including Shangqiu City in Henan Province, as well as Weifang and Qingdao City in Shandong Province.
A total of 65 prefecture-level cities (autonomous prefectures, leagues) in the Yellow River Basin are selected as targeted areas, while some areas of Qinghai Province are not included in the research areas due to the great lack of data, including Xining City, Haidong region, Haibei Tibetan Autonomous Prefecture, Huangnan Tibetan Autonomous Prefecture, Hainan Tibetan Autonomous Prefecture, Golog Tibetan Autonomous Prefecture, Yushu Tibetan Autonomous Prefecture, Haixi Mongolian and Tibetan Autonomous Prefecture. Such quantitative methods as Data Envelope Analysis and Spatial Autocorrelation Analysis were used to construct a measurement index system, explore the temporal evolution law of land use in the Yellow River Basin, analyze the spatial differences, and conduct a comprehensive measurement research on spatiotemporal evolution to reveal the characteristics of spatiotemporal evolution. On the one hand, it can complement and improve the research system of land use both theoretically and empirically so as to enrich the theory of land use and sustainable development, which is of certain theoretical significance. On the other hand, the data and research results of this paper will be made public to decision makers and the relevant departments, which helps to enhance the intensiveness of land use and ease the tension between the supply and demand of urban construction land so as to provide theoretical and decision-making support for the smooth implementation of regional sustainable development strategies, which is highly relevant in reality. This is the contribution of this research.
In terms of the research on urban land use efficiency, international studies mainly focus on the evaluation of land use efficiency and the analysis of influencing factors. Studies on the evaluation of land use efficiency mostly concentrate on the measurement and analysis of regional land use efficiency. Typical examples include: the spatial econometrics model applied by Gianni to study the land use efficiency of large and small cities in Lombardy, Italy [5]; an analytic hierarchy process adopted by Li et al. to create an evaluation index system from the four aspects of economy, society, resources and environment so as to measure the urban land use efficiency on the west side of the Taiwan Strait [6]; and the DEA approach adopted by Yi Chen to analyze variations of land use efficiency in China’s inland cities [7]. Alistair proposed to evaluate land use efficiency from the perspective of full life cycle and applied this method to the efficiency evaluation of vacant brownfields in Brussels [8]. Zhao used the super-efficiency DEA model and the Malmquist index to measure the urban land use efficiency in the Beijing-Tianjin-Hebei Region from economic and ecological perspective and analyzed the relationship between the development of new types of urbanization and land use efficiency [9]. Barath et al. applied the Stochastic Frontier Method (SFA) to evaluate the productivity of farm crops in Hungaria and proposed to increase the crop yields through technological advancement [10]. Alexander et al. introduced a definite index system and supporting system for land use management to assess the resource utilization efficiency in land use and incorporated the land use performance in the index of ecosystem service with the maximum land use performance based on optimized land use structure to conduct the research [11]. When it comes to the analysis of influencing factors, most studies revolve on the inquiry and analysis of various factors contributing to the efficiency of regional land use. The following are some typical examples: Masini holds that per capita disposable income and diversification of urban landscapes are exerting positive influence on the improvement of urban land use efficiency [12]. By studying the influencing factors of urban land use efficiency in Beijing, Jean found that reasonable land prices are conducive to stimulating investment, effectively supervising the land market and improving land use efficiency [13]. Wang et al. analyzed the impact of the population growth ratio, as well as the urban and rural residents’ income growth on land use efficiency through a case study on the Beijing-Tianjin-Hebei Region [14]. Penazzi S et al. created an optimized framework for the planning of urban and rural low-carbon ecosystems and found that the optimal urban configuration to reduce carbon emissions from transportation is to integrate urban and rural use and ensure high land use efficiency [15]. Onaindia et al. studied the land use efficiency of Biscay in Spain. By analyzing from the perspective of agricultural productivity and ecosystem services, they indicate that to enhance the land use efficiency of Vizcaya in Spain, it is necessary to coordinate food production with environmental protection [16]. Beatrice et al. studied the impact of environmental changes on the land in South Africa and the result confirmed that deteriorated environmental quality and excessive climate change can be detrimental to land use efficiency [17].
Although China is a latecomer when it comes to the research on urban land use efficiency, it has developed distinctive features in two aspects, namely the diversified measurement models and a wide scope of research areas. The diversified measurement models mainly refer to the diversity in measurement methods of land use efficiency, including stochastic frontier functions, data envelopment analysis and spatial econometrics models. Typical representatives are as follows. Wang Liangjian et al. introduced spatial econometrics models on the basis of stochastic frontier functions. The study pointed out that the overall urban land use efficiency in China is on the rise, but the land use efficiency and its influencing factors in different regions are significantly heterogeneous [18]. He Haojun et al. applied the data envelopment analysis method to study the interaction between urban industrial structure and land use efficiency [19]. Zhou You analyzed the impact of inter-governmental competition on urban land use efficiency from 2009 to 2015 [20]. Liang Liutao et al. created a new analytical framework to study the relationship between economic agglomeration and land use efficiency. The result indicates that economic agglomeration can significantly enhance land use efficiency [21]. Zhao Pengjun et al. adopted super-efficiency EBM to measure the economic efficiency of urban construction land in 31 provinces in China from 2008 to 2017 and applied the Spatial Durbin Dubin Model to reveal its influencing factors [22]. Based on the panel data of each province in the Yangtze River Delta from 2000 to 2015, Zhang Yinghao et al. constructed an index system to measure urban land use efficiency and used the super-efficiency DEA model to measure the regional urban land use efficiency [23]. The extensive research area indicates that the research on urban land use efficiency is no longer limited to a certain city, rather, it has been extended to urban agglomerations, regions and even the whole country. Typical representatives are listed as follows: Chen Zhenling, et al. took 31 provinces across the country as the research object and explored cities and towns as the influencing factors of land use efficiency [24]. Miao Jianjun et al. took 30 prefecture-level cities in the Yangtze River Delta urban agglomeration as the research object, used the SBM model to calculate the urban land use efficiency and used the spatial panel measurement method to explore the influencing factors that can improve the land use efficiency [25]. Huang Jiuming used the super-efficiency DEA model, the Malmquist index and the Tobit model to study the land use efficiency, changes and influencing factors of 35 cities in the three major urban agglomerations of Beijing-Tianjin-Hebei, the Yangtze River Delta and the Pearl River Delta from 2004 to 2013 [26]. Li Na conducted research on Chongqing’s land use and analyzed the variables that have an impact on the efficiency of Chongqing’s land use structure [27]. Taking the Wuhan city circle as the research object, Zhang Dongli and others analyzed the impacts on urban construction land in the two stages before the planning (1999–2007) and after the planning (2007–2013) [28]. Couto et al. studied the environmental sustainability index of the hydrology basin in southern Brazil, and the results showed that the advantage of a medium sustainability level was mainly attributed to the extent of agricultural land and the high sensitivity of soil erosion in areas with low a degree of environmental protection. In areas with native vegetation, environmental sustainability was higher than in areas with other land use types [29]. Zhang Fangfang et al., based on the actual data of 2016 and 2020 and the target data, constructed an evaluation method of the sustainable development of a city as the goal layer, using ecological economy, ecological space, ecological environment, ecological human settlements, ecological culture, ecological system as the criteria of the evaluation index system. A comprehensive weighted index method was used to build the urban sustainable development evaluation based on the ecological civilization construction quantitative model and empirical analysis of Beihai city was conducted based on ecological civilization construction of urban sustainable development status. It is found that the overall sustainable development of Beihai city is good, but the sub-systems of ecological civilization construction are quite different, and the construction of the ecological economy, ecological culture and ecological system need to be further strengthened [30]. Chen Ruishan and others systematically summarized the development process of the idea and index system of urban sustainable development evaluation, investigated the methods of urban sustainable development evaluation based on the framework of the United Nations Sustainable Development Goals (SDG) and put forward the ways to build the sustainable development index of cities and urban agglomerations. It puts forward the idea of promoting the evaluation of urban sustainable development index and establishing the “dashboard” of urban development [31].
Overall, an array of results has been accomplished on the relevant studies, but there are still some shortcomings. Firstly, from the perspective of the targeted areas for the study, most of the studies conducted so far have been done at the province and city level, divided by administrative regions, and there are relatively few studies conducted systematically on the Yellow River basin. Secondly, from the perspective of research concepts and approaches, there is a lack of comprehensive and integrated spatial-temporal measurement approach of urban land use efficiency in the Yellow River Basin with the help of GIS technology and spatial analysis models in both temporal and spatial dimensions. This study will be able to overcome the above deficiencies and shortcomings.

2. Data and Methods

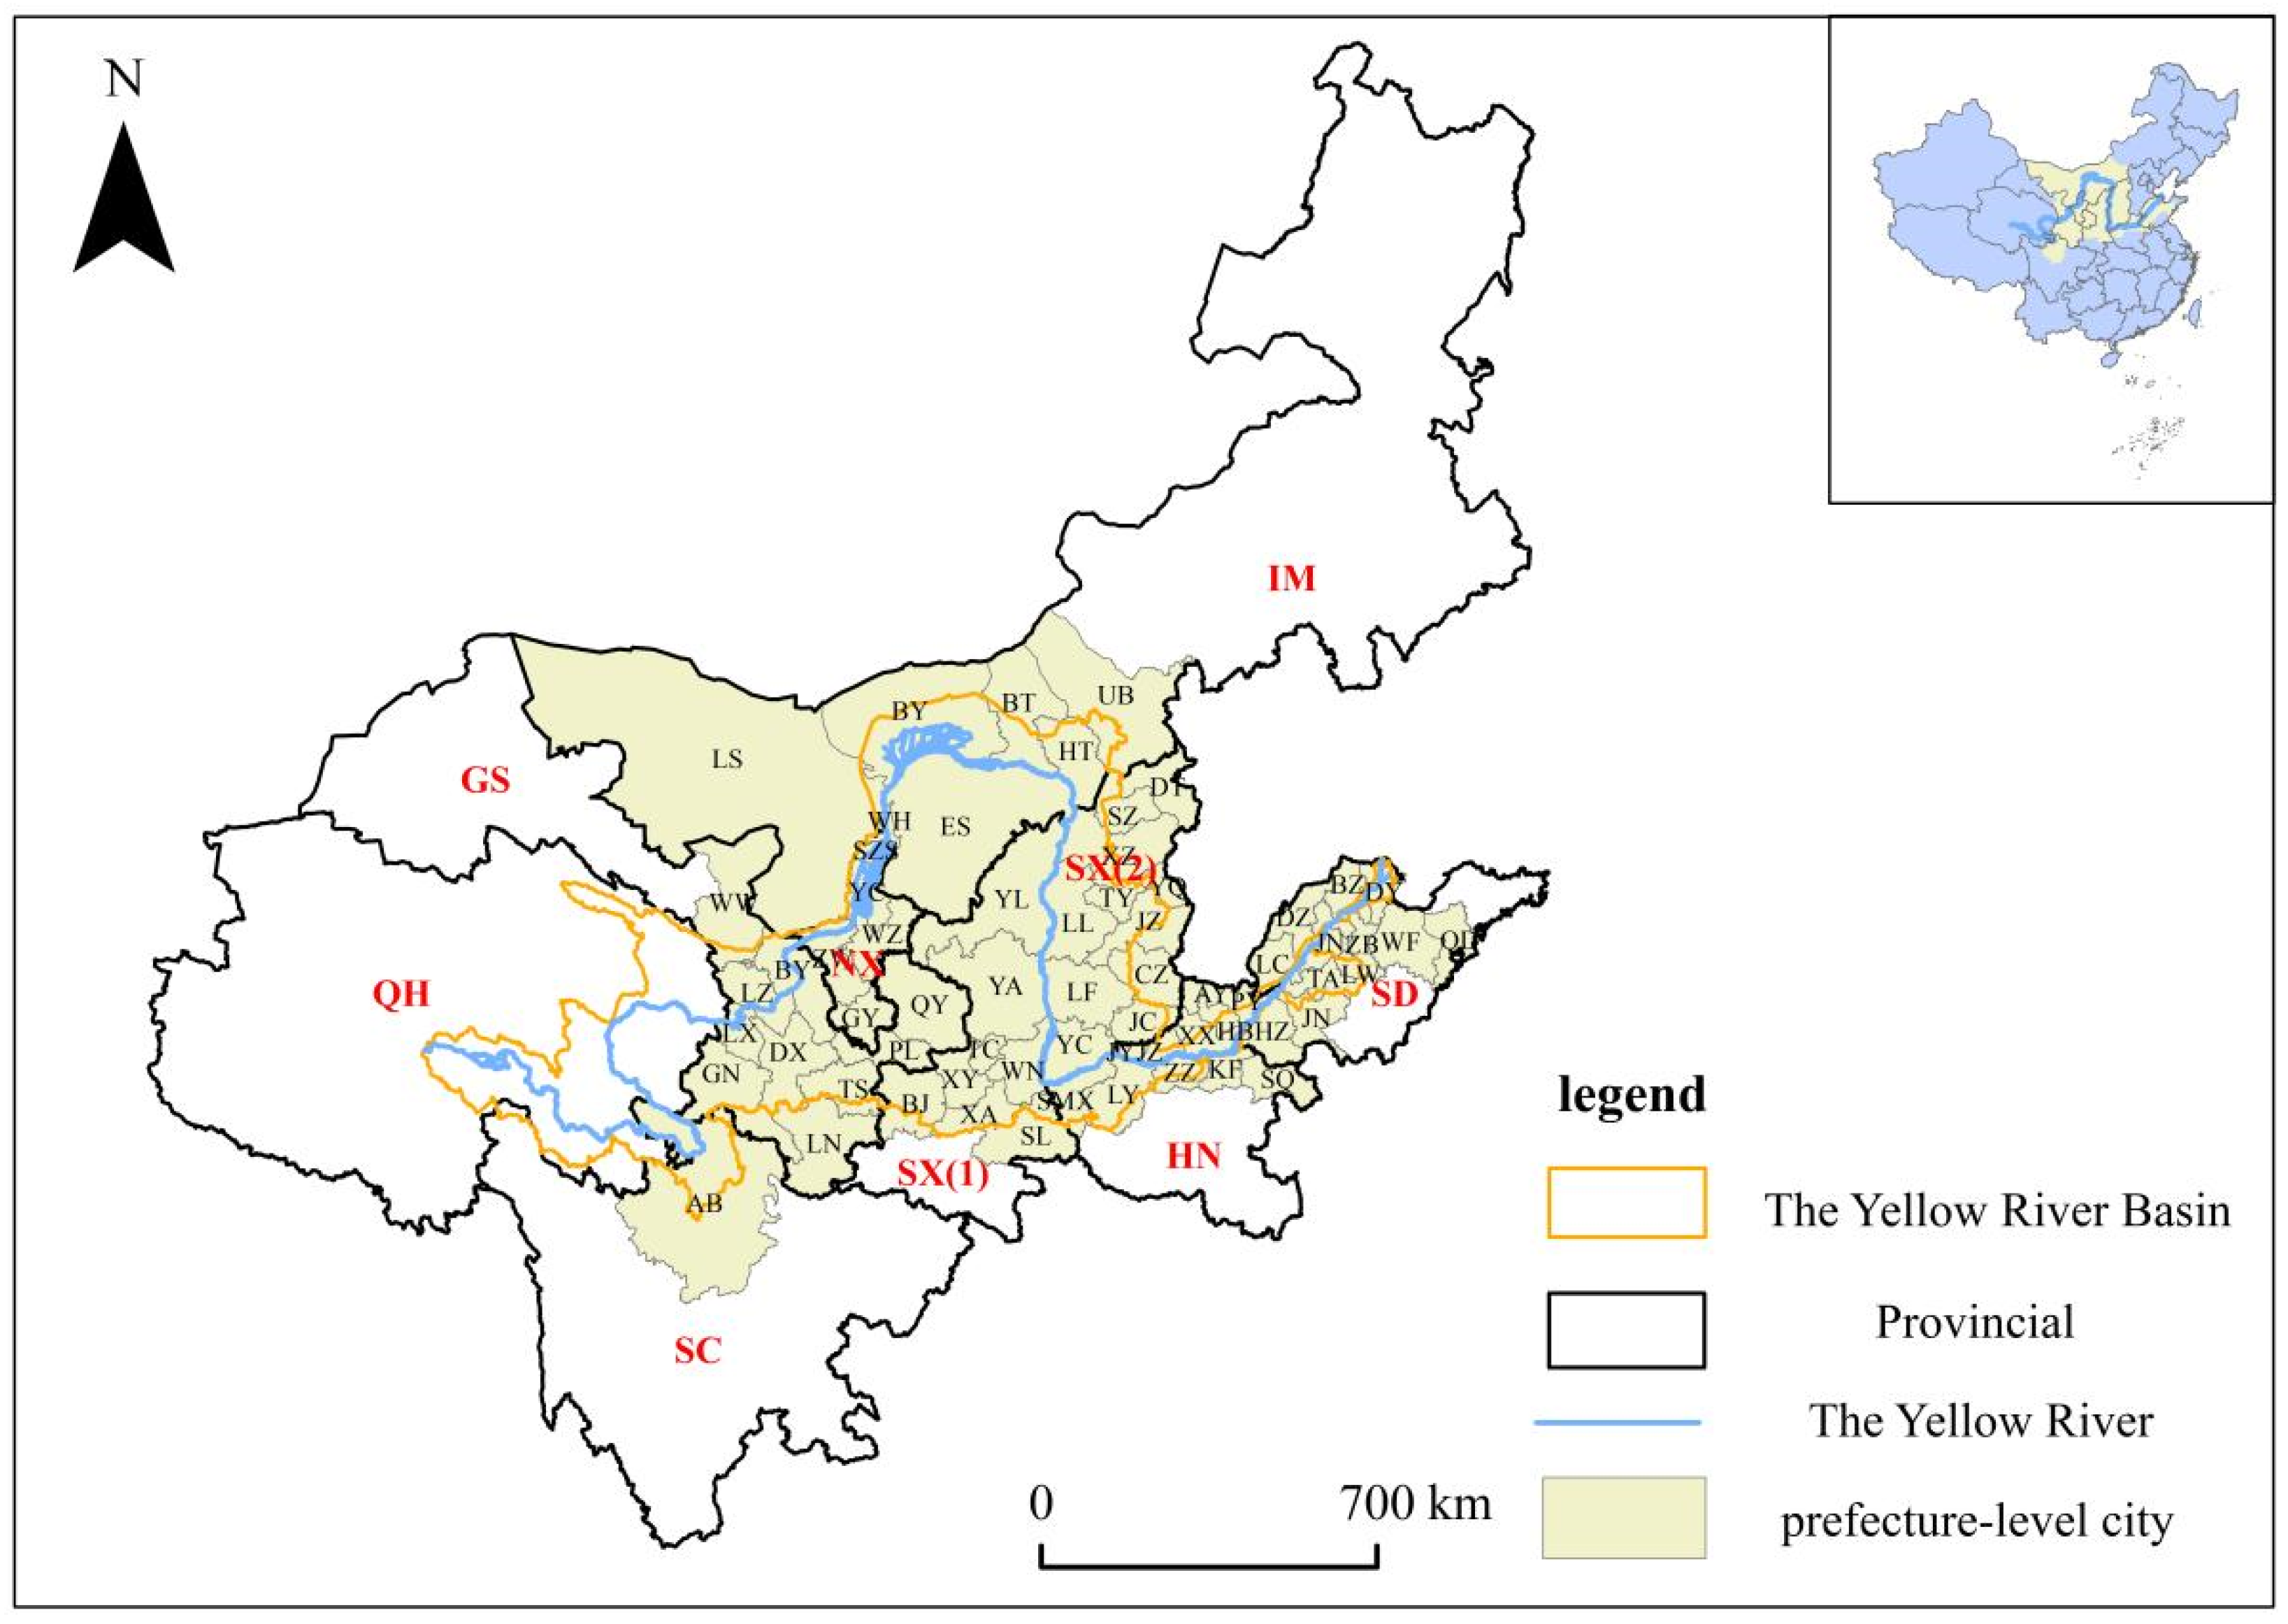
2.1. Overview of the Study Area

In this study, 65 prefecture-level cities (autonomous prefectures, leagues) in 8 provinces (autonomous regions), including Shandong, Henan, Shanxi, Inner Mongolia, Shaanxi, Gansu, Ningxia and Sichuan are selected. Among them, there are Xining City, Haidong District, Haibei Tibetan Autonomous Prefecture, Huangnan Tibetan Autonomous Prefecture, Hainan Tibetan Autonomous Prefecture, Guoluo Tibetan Autonomous Prefecture and Yushu Tibetan Autonomous Prefecture in Qinghai Province. Due to serious data deficiency, Haixi Mongol and Tibetan Autonomous Prefecture are not included in this study. For more details, please refer to the Table 1. The Figure 1 comes from Resource and Environment Science and Dete Center.CAS.

2.2. Indicator System and Data Sources

This paper drew on existing research results [32,33,34,35,36,37,38,39,40], selected indicators that are used more frequently and are representative and meet the needs of the subject of the article and established an input–output index system for measuring urban land use efficiency in the Yellow River Basin. The size of built-up area, fiscal expenditure, total amount of social fixed asset investment and the number of employees in secondary and tertiary industries were selected as input indicators. The output was divided into economic output, social output and environmental output. Among them, the gross regional production value, per capita GDP, added value of secondary and tertiary industries and total retail sales of social consumer goods were selected as indicators of the economic output; the fiscal revenue, per capita disposable income of urban residents, road area and per capita construction land area were selected as indicators of the social output, while greening coverage rate of built-up areas, comprehensive utilization rate of industrial solid waste, compliance rate of industrial wastewater discharge, compliance rate of industrial smoke emission and harmless treatment rate of domestic waste were selected as indicators of environmental output. The main data sources were China Statistical Yearbook and China City Statistical Yearbook from 2000 to 2018, the statistical yearbooks of the provinces involved from 2000 to 2018, the statistical yearbooks of 65 prefecture-level cities in the Yellow River Basin and environmental bulletins. The specific indicator system is shown in Table 2 below.

2.3. Research Method

2.3.1. Data Envelope Analysis

The data envelopment analysis method in this paper was mainly carried out by drawing on the results of other scholars [41,42,43,44,45,46,47,48,49,50,51,52,53,54]. This study selected the Slacks-based model contains undesirable output (SBM-Undesirable) to measure the urban land use efficiency of 65 prefecture-level cities in the Yellow River basin from year 2000 to year 2018, which is reasonable because the model considered undesirable output indicators, incorporated input–output slack variables into the objective function and used non-radial, non-angle measurement to improve the accuracy of efficiency evaluation, fix the deficiency that the traditional DEA method fails to consider the input–output slack and ignores the efficiency bias caused by undesirable output, etc., and can highlight the balance among inputs, desirable output and undesirable output more obviously compared with other models.
The specific principle of the SBM-Undesirable model is as follows: assuming that there are n decision units with m input indicators, s1 desirable outputs and s2 undesirable outputs, the input matrix X, desirable output matrix Y and undesirable output matrix Z for the i decision unit are:
X = ( x i 1 , x i 2 , , x i m ) R n × m , X > 0 Y = ( y i 1 , y i 2 , , y i S 1 ) R n × S 1 , Y > 0 Z = ( y i 1 , y i 2 , , y i S 2 ) R n × S 2 , Z > 0
The set of production possibilities constituted by all decision units is:
P ( x ) = { ( x , y , z ) | x λ X , y λ Y , Z λ Z , λ 0 }
The mathematical form of the model is:
ρ = m i n 1 1 m i = 1 m s i x i k 1 + 1 s 1 + s 2 ( r = 1 s 1 s r Y y r k + t = 1 s 2 s t Z z t k )
s t { x k = λ X + B y k = λ Y B Y z k = λ Z + B Z B 0 , B Y 0 , B Z 0 , λ 0
where ρ is the objective function value of SBM-Undesirable model, x k ,     y k ,   z k are the input, desirable output and undesirable output indicators, respectively, st denotes the constraint of the objective function,   s , s Y , s Z are the input, desirable output and the slack variables of undesirable output, respectively, B , B Y , B Z are the slack matrices of input, desirable output and undesirable output, respectively, and λ is the density vector, representing the weight of each element. If ρ = 1 and s = s Y = s Z   = 0, it indicates that the decision unit is valid; otherwise, the decision unit is invalid, and there is room for improving input or output.

2.3.2. Spatial Autocorrelation Analysis

Global Spatial Autocorrelation Analysis

The global spatial autocorrelation can test whether there is spatial dependence of urban land use efficiency in the Yellow River Basin, and analyze the spatial association pattern and spatial clustering pattern of urban land use efficiency in the Yellow River Basin from the region as a whole, generally by estimating the spatial autocorrelation statistic of Moran’s I to analyze the degree of spatial association and spatial variation in the region as a whole. Referred in the relevant literature, it is known that the global Moran’s I is calculated by the formula [55,56,57,58]:
I = n i = 1 n j 1 n W i j ( Y i Y ¯ ) ( Y j Y ¯ ) i = 1 n j 1 n W i j i = 1 n ( Y i Y ¯ ) 2
where I is the global Moran’s I value, n is the total number of study areas, Y ¯ is the average of the sample values of all study areas, Y i denotes the sample value of the i study area, Y j denotes the sample value of the j study area and W i j is the spatial weight matrix. The binary adjacency matrix is selected in this paper with 1 for spatial adjacency and 0 for non-adjacency. In order to further determine whether there is a spatial autocorrelation, a significance test needs to be conducted on I. The test formula is:
Z = I E ( I ) V a r ( I )
where Z is the global Moran’s I test value, E(I) is the expectation of I and Var(I) is the variance of I.

Local Spatial Autocorrelation Analysis

Global spatial autocorrelation only describes the overall spatial distribution pattern, but it averages out the differences among regions and cannot specifically reflect the spatial dependence of each region. Therefore, the local spatial autocorrelation analysis is needed to reflect the changing trends of spatial differences in urban land use efficiency in the Yellow River Basin more comprehensively and reveal the local spatial distribution characteristics. The local Moran’s I is calculated by the formula:
I i = n ( Y i Y ¯ ) j = 1 n W i j ( Y j Y ¯ ) i = 1 n ( Y i Y ¯ )
where, I i is the local Moran’s I value of the i study area, n is the total number of study areas, Y ¯ is the average of the sample values of all study areas, Y i denotes the sample value of the i study area, Y j denotes the sample value of the j study area, and W i j is the spatial weight matrix.
To further determine whether there is spatial autocorrelation, a significance test for I i is required, and the test formula is:
Z ( I i ) = I i E ( I i ) V a r ( I i )
where Z ( I i ) is the local Moran’s I test value for the i study area, E ( I i ) is the expectation of Ii and Var(Ii) is the variance of Ii.
According to the calculation results, the spatial correlations can be classified into four types: high-high (H-H), low-high (L-H), high-low (H-L) and low-low (L-L). Among them, H-H and L-L are positive spatial autocorrelations, and L-H and H-L are negative spatial autocorrelations.

3. Results and Discussion

3.1. Analysis of Land Use Efficiency Measurements

The urban land use efficiency of 65 prefecture-level cities in the Yellow River Basin from 2000 to 2018 was calculated using DEA Solver pro 5 software. Due to the limitation of the length of the article, only the results for year 2000, 2002, 2004, 2008, 2010, 2012, 2014, 2016 and 2018 are presented. See Appendix A (Table A1) for the specific calculation results.
In order to present the overall landscape and changing trend of urban land use efficiency of 65 prefecture-level cities in the Yellow River Basin more clearly, this paper produced a bar chart of the average urban land use efficiency of 65 prefecture-level cities in the Yellow River Basin from the year 2000 to 2018 (Figure 2), and a line graph of the average urban land use efficiency of 65 prefecture-level cities in the Yellow River Basin from the year 2000 to 2018 (Figure 3).
From Appendix A and Figure 2 and Figure 3, it can be seen that:
(1)
The average values of the urban land use efficiency of the 65 prefecture-level cities in the Yellow River Basin from 2000 to 2018 showed an unbalanced distribution trend in general. The cities with the highest urban land use efficiency among the 65 prefecture-level cities in the Yellow River Basin from 2000 to 2018 include Qingdao and Zhengzhou, both reaching an effective DEA, that is, the efficiency value of 1, and the cities with the lowest efficiency are the Gannan Tibetan Autonomous Prefecture and Linxia Hui Autonomous Prefecture, with values of 0.074 and 0.085, respectively. The difference between the high and low value areas is 0.926 and 0.915, showing a large gap. It is obvious that the urban land use efficiency of cities in the lower reaches of the Yellow River, such as Jinan, Qingdao, Dongying and Zhengzhou, is higher, while the urban land use efficiency of cities in the middle and upper reaches of the Yellow River, such as Gannan Tibetan Autonomous Prefecture, Linxia Hui Autonomous Prefecture, Longnan City, Aba Tibetan and Qiang Autonomous Prefecture and Dingxi City, is lower, showing the overall trend of high in the east and low in the west, high in the lower reaches and low in the middle and upper reaches.
(2)
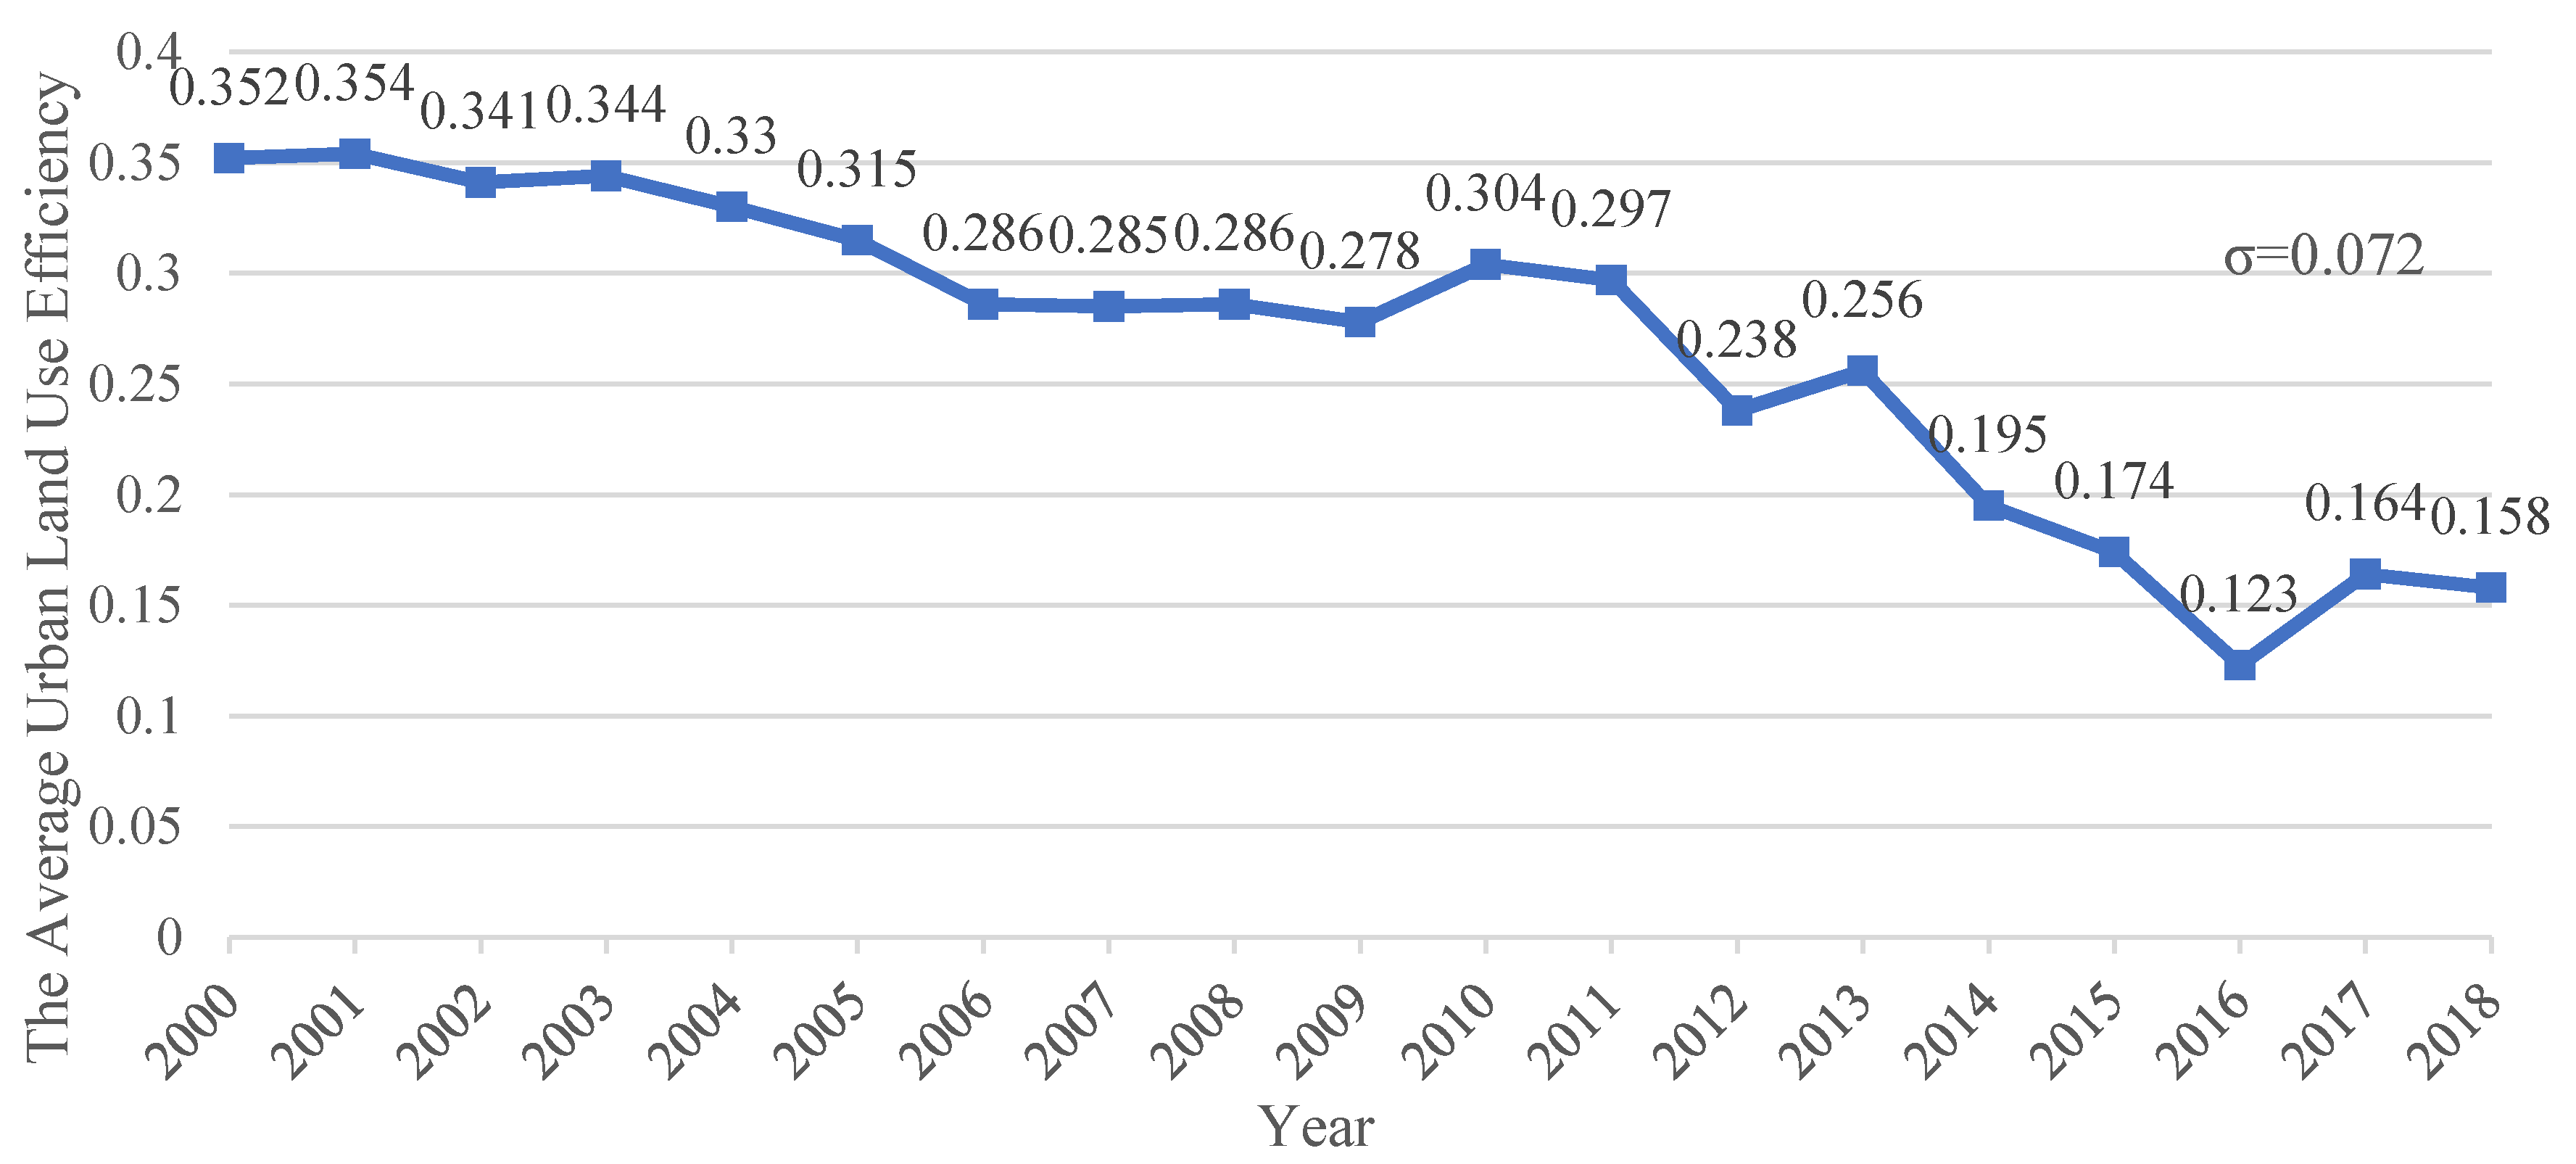
The average urban land use efficiency of the 65 prefecture-level cities in the Yellow River Basin from 2000 to 2018 showed a decreasing trend, changing from 0.352 in 2000 to 0.158 in 2018 with a decrease of 0.194, indicating that the urban land use efficiency in the Yellow River Basin from 2000 to 2018 is low and the overall urban structure arrangement is less rational. The reason for this is that the rapid economic development, the rapid population growth and the concentration of a large number of migrant workers toward the cities have led to the rapid expansion of the urban scale. As a result, the properties of a large size of land have been changed, accompanied by irrational urban construction planning, causing the reduction in the urban land use efficiency.

3.2. Spatial Pattern Analysis of Land Use Efficiency

3.2.1. Global Spatial Autocorrelation Analysis

Based on the calculation method of the global spatial autocorrelation analysis (global Moran’s I), this paper calculated the global Moran’s I index of the urban land use efficiency of 65 prefecture-level cities in the Yellow River basin from the years 2000 to 2018 as a way to test their spatial autocorrelation and cluster status. The specific results were shown in Table 3 below.
As can be seen from Table 3, the z-values of the global Moran’s I index were greater than 1.96 from 2000 to 2018 except for in 2007, indicating that the global autocorrelation values of the urban land use efficiency of the 65 prefecture-level cities in the Yellow River Basin all pass the significance test of 5% from 2000 to 2018, except for 2007. Therefore, it can be judged that during the study period, the urban land use efficiency of the 65 prefecture-level cities in the Yellow River Basin showed a significant positive correlation in spatial distribution in these years, except 2007, and the adjacent areas with high (low) efficiency unfolded a clustering pattern and a certain clustering characteristic was showed at the prefecture-level city scale as a whole, i.e., the urban land use efficiency in the Yellow River Basin was not randomly distributed, but showed a spatial clustering condition of high (low) areas. Areas with higher land use efficiency tend to be distributed adjacent to higher areas, while lower areas tend to be adjacent to lower ones.
It can be clearly seen that values of the global Moran’s I index from 2000 to 2018 all exceed 0, but the overall values are relatively small, indicating that the overall clustering extent is still low, and the ability of provinces to influence each other is weak although the urban land use efficiency of 65 prefecture-level cities in the Yellow River basin all showed a positive correlation in spatial distribution in these years except 2007, and the adjacent provinces of high (low) efficiency showed a clustering pattern.
As can be seen from Figure 4, the global Moran’s I index showed a wave pattern overall from 2000 to 2018, with the highest point at 0.238739 in 2010 and the lowest point at 0.06054 in 2007. Moreover, the global Moran’s I index ranges from 0.176364 in 2000 to 0.175516 in 2018, which is not a big difference overall, indicating that the global Moran’s I index of the urban land use efficiency of the 65 prefecture-level cities in the Yellow River basin showed an overall wavy forward trend during the study period, with a low degree of urban land use efficiency clustering and a low degree of correlation.

3.2.2. Global Spatial Autocorrelation Analysis

Based on the calculation method of local spatial autocorrelation analysis, the local Moran’s I index values of the urban land use efficiency of the 65 prefecture-level cities in the Yellow River basin were measured in 2000, 2005, 2010, 2015 and 2018 to form four major regions of high-high, high-low, low-high and low-low, and the spatial correlation map of the urban land use efficiency of the 65 prefecture-level cities in the Yellow River basin was generated as shown in Figure 5.
From Figure 5, it can be seen that in the year 2000, Qingdao, Weifang, Zibo, Dongying and Binzhou were among high-high clustering areas; Laiwu was in the low-high clustering area; Gannan Tibetan Autonomous Prefecture, Longnan, Baoji, Tianshui, Xianyang, Xi’an and Tongchuan were in the low-low clustering areas; and the rest of the provinces show insignificant clustering trends, with more low-low clustering areas than high-high clustering areas. In 2005, Qingdao, Weifang and Zibo were within high-high clustering areas; Dongying and Laiwu were in low-high clustering areas; Gannan Tibetan Autonomous Prefecture, Baoji and Tianshui were in low-low clustering areas; and the rest of the provinces present insignificant clustering trends, and the number of areas with insignificant trends increased. In 2010, Ulanqab, Baotou, Bayannur, Hohhot and Shuozhou were within high-high clustering areas; Gannan Tibetan Autonomous Prefecture, Dingxi, Lanzhou, Qingyang, Pingliang City, Baoji City, Tianshui City, Xianyang City, Tongchuan City, Weinan City, Yuncheng City, Sanmenxia City, Linfen City, Jiaozuo City, Zhengzhou City, Jincheng City, Xinxiang City, Kaifeng City, Shangqiu City and Hebi City are within in low-low clustering areas; and the remaining provinces indicate insignificant clustering trends, and the number of low-low clustering areas significantly increased. In 2015, Ulanqab City, Baotou City, Bayannur City, Hohhot City, Qingdao City and Weifang City were within high-high clustering areas; Lanzhou and Sanmenxia were included in high-low clustering areas; Dongying, Binzhou and Laiwu were rated as low-high clustering areas; Gannan Tibetan Autonomous Prefecture, Dingxi, Longnan, Qingyang, Pingliang, Baoji, Guyuan, Tianshui, Xianyang, Xi’an, Tongchuan, Weinan and Shangluo were within low-low clustering areas; and the remaining provinces had insignificant clustering trends, and the trend of concentrated distribution of the same type of areas began to appear. In 2018, Qingdao, Weifang, Zibo and Dezhou were within high-high clustering areas; Dongying, Binzhou, Laiwu and Tai’an were within low-high clustering areas; Wuzhong, Lanzhou and Sanmenxia were within high-low clustering areas; and the rest of the provinces showed insignificant clustering trends, and there was a more obvious trend of concentrated distribution of the same type of areas.
In general, the urban land use efficiency of the 65 prefecture-level cities in the Yellow River Basin from 2000 to 2018 had obvious spatial clustering distribution characteristics, showing obvious spatial dependence and spatial heterogeneity. Qingdao, Weifang, Zibo and other cities in estuary areas of the lower reaches of the Yellow River Basin had relatively high land use efficiency, forming a high-value clustering area. Meanwhile, Tianshui, Dingxi, Baoji, Longnan and other cities in the middle reaches of the Yellow River Basin had relatively low land use efficiency, forming a low-value clustering area. The transition trend from high-value clustering areas to low-value clustering areas was displayed from east to west, from coastal to inland and from downstream to upstream. The overall trend was high in the east and low in the west with the decrease from downstream to upstream.
In recent years, other scholars have also conducted relevant studies. Typical representatives include Ji Zhiheng [59], who analyzed the spatial differences and driving mechanisms of urban land use efficiency in China under environmental constraints and concluded that the overall urban land use efficiency in China under environmental constraints is low, with spatial imbalance characteristics and a fluctuating expanding trend. Liu Shichao [60] analyzed the spatial and temporal evolution law of land use efficiency of 138 prefecture-level cities in eight national urban agglomerations in China from 2006 to 2015, and concluded that the urban land use efficiency of urban agglomerations shows a distribution pattern of “high in the east, low in the middle and west”. Yan Zhiqing [61] analyzed the spatial and temporal evolution law of urban land use efficiency in Yunnan Province and concluded that urban land use efficiency in Yunnan Province is generally at the stage of increasing returns to scale, with a spatial distribution pattern of high in the middle and low in the surroundings.

4. Conclusions and Suggestions

In this study, the land use efficiency of the prefecture-level cities in the Yellow River Basin was analyzed. Data envelopment analysis, Spatial autocorrelation analysis and GIS technology were used to comprehensively measure the land use efficiency of the prefecture-level cities in the Yellow River Basin from two aspects of time and space. It makes up for the deficiency and defect of the existing research.

4.1. Conclusions

The average value of urban land use efficiency of 65 prefecture-level cities in the Yellow River Basin from 2000 to 2018 shows a decreasing trend, and the urban land use efficiency of 65 prefecture-level cities in the Yellow River Basin is featured by unbalanced distribution in general, with a large gap between the high-value and low-value areas. The land use efficiency of cities in the estuary areas of the lower reaches of the Yellow River Basin is high, while the land use efficiency of cities in the middle and upper reaches of the Yellow River Basin is low, showing an overall trend of high in the east and low in the west, high in the downstream and low in the middle and upper reaches.
The urban land use efficiency of the 65 prefecture-level cities in the Yellow River Basin presents a significant positive correlation in spatial distribution from 2000 to 2018, except 2007, with high (low) efficiency adjacent areas showing a clustering pattern. The overall degree of clustering remains low, the ability of provinces to influence each other is weak and the degree of correlation of urban land use efficiency is low. The urban land use efficiency in the Yellow River Basin is characterized by obvious spatial clustering in spatial distribution, transitioning from high-value clustering areas to low-value clustering areas from east to west, from coastal to inland and from downstream to upstream. It shows an overall trend of high in the east and low in the west and decreasing from downstream to upstream.
The research conclusions of this article are consistent with the existing research conclusions. Liang also found that the land use efficiency of Chinese cities is positively correlated [2]. Wang also found significant differences in land use efficiency among cities in China from 2003 to 2012 [18]. Han found that areas with the highest land use efficiency in the Yellow River Basin are concentrated in the Shandong Peninsula and the Central Plains, and the overall distribution is high in the east and low in the west [62]. It can be seen that the conclusion of this article is correct and meaningful.

4.2. Suggestions

It is suggested that cities in the Yellow River Basin should formulate differentiated urban development policies in line with different land use situations in the Yellow River Basin, increase the input of resources, activate the potential productivity of land, play the leading role of planning, determine the best input ratio of resources and reduce input redundancy; the cities should incentivize technological innovation on urban land use efficiency and spur the demand for the quality of land application in high-tech industries. Meanwhile, cities should also optimize the spatial connectivity of urban land use efficiency, give full play to the penetration of the spatial spillover effect of high-value clusters and drive the improvement of urban land use efficiency in the surrounding areas.

Author Contributions

H.L. and J.Q. designed the study and wrote the paper. D.W. and P.M. analyzed the data. C.L. and J.Z. contributed to data collection and processing. All authors have read and agreed to the published version of the manuscript.

Funding

This research was funded by National Natural Science Foundation of China, grant number 41671535, 42061054, 41561110; by Science and Technology program of Gansu Province, grant number 20CX4ZA039, 21JR1RA234.

Institutional Review Board Statement

Not applicable.

Informed Consent Statement

Not applicable.

Data Availability Statement

The data used to support the findings of this study are available from the corresponding author upon request.

Acknowledgments

Thanks for the anonymous reviewers and all the editors in the process of revision.

Conflicts of Interest

The authors declare no conflict of interest.

Appendix A

Table A1. Urban land use efficiency of 65 prefecture-level cities in the Yellow River Basin.
RegionUrban Land Use Efficiency
2000200220042006200820102012201420162018AVG
Aba0.0760.1590.1330.1140.0980.1460.1140.0830.0780.0990.115
Lanzhou0.4720.4290.3530.2970.1750.1860.2000.2050.1870.1730.264
Baiyin0.1990.2160.2160.2020.1670.1780.1480.1070.0940.0820.164
Tianshui0.1710.2220.1970.2230.2190.1900.1620.1280.1190.1080.173
Wuwei0.1780.1870.1680.2030.1760.1860.1570.1270.1030.0970.204
Pingliang0.1310.1830.2050.2110.1720.2130.1780.1140.1030.1010.164
Qingyang0.0870.2520.2030.2110.2020.2100.1810.1570.1250.1140.173
Dingxi0.1360.1480.1260.1800.1610.1640.1690.1280.1020.1050.145
LinXiaZhou0.0530.0700.0920.0800.0880.1080.0860.0880.0760.0870.085
Gannan0.0350.0280.0980.0960.0900.0950.0790.0650.0630.0800.074
Longnan0.0700.0840.0540.1460.0980.1650.1690.1080.0940.0900.107
Xi’an1.0001.0001.0000.6621.0001.0001.0000.5921.0001.0000.837
Tongchuan0.1990.1850.1880.1830.1850.2140.1780.1480.1260.0800.172
Baoji0.2290.2400.2220.2310.2350.2290.1840.1260.1130.0920.192
Xianyang0.2850.2670.2410.2310.2240.2340.1880.1660.1140.0880.205
Yan’an0.2120.2320.1960.1770.1940.2010.1540.1360.1020.0810.172
Yulin0.3180.2680.1980.2020.2000.2240.1770.1750.1150.0980.194
Shangluo0.1700.1820.1630.2010.1890.2030.1580.1090.0830.0780.155
Weinan0.2090.2040.1980.2020.1960.2030.1840.1660.1340.1200.184
Yinchuan0.3700.3290.2460.2470.1940.2400.1780.1650.1430.1050.221
Shizuishan0.2080.2020.2230.1970.1880.2110.1570.1300.1120.0890.176
Wuzhong0.1920.2100.2000.1790.1820.2030.1580.1140.0970.0850.165
Guyuan0.3070.2650.1980.2090.2000.2060.1700.1420.1050.0890.187
Zhongwei0.2890.3180.1920.2000.2590.1780.1780.1360.1080.0800.185
Hohhot0.3020.4060.3590.3150.5930.2930.2160.1900.1930.1620.323
Baotou0.7580.5790.5530.4830.6300.6900.4000.2980.2430.1610.518
Ulanqab0.2130.2070.2480.2360.3350.4120.2440.2330.1980.0830.250
Erdos0.4120.4010.3740.4510.4911.0000.4360.3350.2340.1310.463
Bayannur0.4010.3830.3590.4060.3910.4270.3710.1190.1000.0830.318
Wuhai0.2100.2030.2150.2050.3190.4050.2370.2110.1930.1720.243
Lashanau0.1980.1990.2040.2060.3180.4010.2290.2150.1960.1680.238
Taiyuan1.0001.0000.6240.3280.2500.2690.2220.2060.2000.1550.411
Datong0.2200.2230.3020.1830.1810.2290.2000.1590.1350.1180.197
Yangquan0.2370.1980.2420.2020.1870.2140.1680.1140.1000.0850.178
Changzhi0.2070.2110.2570.2880.2620.2690.2080.1390.1180.1070.214
Jincheng0.2890.2160.2320.2640.1920.2150.1760.1190.1130.0890.191
Shuozhou0.2000.1970.2150.2200.1790.2500.2140.1300.1040.0840.183
Jinzhong0.1860.1750.2990.1970.2140.2660.1720.1220.1320.1180.189
Yuncheng0.1960.2210.2370.2240.2230.2270.1830.1260.1100.0900.190
Xinzhou0.1250.1680.1630.2010.1900.2080.1680.1100.1040.0890.157
Linfen0.2290.2510.2630.2340.2590.2370.1720.1180.0990.0970.201
Luliang0.2040.1840.1660.1930.2190.2230.1770.1250.0980.0840.173
Jinan1.0001.0001.0001.0001.0001.0000.3010.3700.3030.3410.748
Qingdao1.0001.0001.0001.0001.0001.0001.0001.0001.0001.0001.000
Zibo1.0000.6840.8180.3950.3280.3460.2410.2250.2020.1550.466
Dongying1.0001.0001.0000.5310.5270.4560.4330.3310.2780.1980.585
Weifang0.4300.3630.3140.2920.3020.2890.2160.2310.1930.1950.281
Jining0.3810.3270.2670.2680.2730.2670.2230.2100.1690.1690.252
Tai’an0.4150.3760.3310.2580.2500.2630.2170.1930.1620.1440.263
Laiwu0.8550.8080.8120.2200.2100.2220.1770.1610.1380.1250.380
Dezhou0.3440.3180.3110.2640.2940.2850.1920.1820.1450.1380.249
Liaocheng0.3850.3230.2340.2320.2220.2370.1910.1810.1230.1060.222
Binzhou0.3330.2980.2470.2290.2280.2590.1990.1680.1300.1140.221
Heze0.3830.3180.2380.2410.2400.2490.2010.1820.1470.1360.230
Zhengzhou1.0001.0001.0001.0001.0001.0001.0001.0001.0001.0001.000
Kaifeng0.3780.3520.3110.3180.2330.2320.2000.1760.1470.1210.251
Luoyang0.3770.4010.4090.3110.2400.2500.2150.1800.1590.1440.275
Anyang0.2940.2750.3640.2590.2070.2150.1930.1430.1390.0980.230
Hebi0.2390.1960.2260.2240.1850.2020.1770.1430.1250.1120.185
Xinxiang0.3910.3740.3790.3480.2420.2420.2190.1880.1210.1030.274
Jiaozuo0.3190.3020.3290.2420.1820.2210.1670.1280.1190.1000.218
Puyang0.2700.2810.3020.2770.2330.2370.1940.1580.1340.1210.228
Sanmenxia0.2450.2290.2380.2050.2210.2310.1810.1280.1080.0910.191
Shangqiu0.3880.3680.4620.3580.2510.2460.2270.1820.1380.1240.284
Jiyuan0.2980.2930.2180.2210.2080.2030.1790.1360.1190.1170.198
AVG0.3520.3410.3300.2860.2860.3040.2380.1950.1230.1580.267

References

  1. Zhu, L.X. Research on Spatial and Temporal Evolution of Urban Land Use Efficiency and Its Influencing Factors in Gansu Province; Northwest Normal University: LanZhou, China, 2020. [Google Scholar]
  2. Liang, L.T.; Yong, Y.J.; Yuan, C.G. Measurement of urban land green use efficiency and its spatial differentiation characteristics: An empirical study based on 284 cities. China Land Sci. 2019, 33, 80–87. [Google Scholar]
  3. Wu, C.; Wei, Y.D.; Huang, X.; Chen, B. Economic transition, spatial development and urban land use efficiency in the Yangtze River Delta, China. Habitat Int. 2017, 63, 67–78. [Google Scholar] [CrossRef]
  4. Zhang, L.X. Research on the Urban Land Rational Based on the Resource Allocation Theory—Cases Study of the Yangtze River Economic Belt Cities; China Agricultural University: BeiJing, China, 2018. [Google Scholar]
  5. Guastella, G.; Pareglio, S.; Sckokai, P. A spatial econometric analysis of land use efficiency in large and small municipalities. Land Use Policy 2017, 63, 288–297. [Google Scholar] [CrossRef] [Green Version]
  6. Li, X.; Zhang, Q. AHP-based resources and environment efficiency evaluation index system construction about the west side of Taiwan Straits. Ann. Oper. Res. 2015, 228, 97–111. [Google Scholar] [CrossRef]
  7. Chen, Y.; Chen, Z.; Xu, G.; Tian, Z. Built-up land efficiency in urban China: Insights from the General Land Use Plan (2006–2020). Habitat Int. 2016, 51, 31–38. [Google Scholar] [CrossRef]
  8. Beames, A.; Broekx, S.; Heijungs, R.; Lookman, R.; Boonen, K.; Van Geert, Y.; Dendoncker, K.; Seuntjens, P. Accounting for land-use efficiency and temporal variations between brownfield remediation alternatives in life-cycle assessment. J. Clean. Prod. 2015, 101, 109–117. [Google Scholar] [CrossRef]
  9. Zhao, Z.; Bai, Y.; Wang, G.; Chen, J.; Yu, J.; Liu, W. Land eco-efficiency for new-type urbanization in the Beijing-Tianjin-Hebei region. Technol. Forecast. Soc. Chang. 2018, 137, 19–26. [Google Scholar] [CrossRef]
  10. Lajos, B.; Fert, I. Heterogeneous technology, scale of land use and technical efficiency: The case of Hungarian crop farms. Land Use Policy 2015, 42, 141–150. [Google Scholar]
  11. Herzig, A.; Nguyen, T.T.; Ausseil, A.G.; Maharjan, G.R.; Dymond, J.R.; Arnhold, S.; Koellner, T.; Rutledge, D.; Tenhunen, J. Assessing resource-use efficiency of land use. Environ. Model. Softw. 2018, 107, 34–49. [Google Scholar] [CrossRef]
  12. Masini, E.; Tomao, A.; Barbati, A.; Corona, P.; Serra, P.; Salvati, L. urban growth, land-use efficiency and local socioeconomic context: A comparative analysis of 417 metropolitan regions in Europe. Environ. Manag. 2019, 63, 322–337. [Google Scholar] [CrossRef]
  13. Du, J.; Thill, J.C.; Peiser, R.B. Land pricing and its impact on land use efficiency in post-land-reform China: A case study of Beijing. Cities 2016, 50, 68–74. [Google Scholar] [CrossRef]
  14. Wang, Z.; Chen, J.; Zheng, W.; Deng, X. Dynamics of land use efficiency with ecological intercorrelation in regional development. Landsc. Urban Plan. 2018, 177, 303–316. [Google Scholar] [CrossRef]
  15. Penazzi, S.; Accorsi, R.; Manzini, R. Planning low carbon urban-rural ecosystems: An integrated transport land-use model. J. Clean. Prod. 2019, 235, 96–111. [Google Scholar] [CrossRef]
  16. Onaindia, M.; Peña, L.; de Manuel, B.F.; Rodríguez-Loinaz, G.; Madariaga, I.; Palacios-Agúndez, I.; Ametzaga-Arregi, I. Land use efficiency through analysis of agrological capacity and ecosystem services in an industrialized region (Biscay, Spain). Land Use Policy 2018, 78, 650–661. [Google Scholar] [CrossRef]
  17. Conradie, B.; Piesse, J.; Stephens, J. The changing environment: Efficiency, vulnerability and changes in land use in the South African Karoo, 2012–2014. Environ. Dev. 2019, 32, 100453. [Google Scholar] [CrossRef]
  18. Wang, L.J.; Li, H.; Shi, C. Urban land-use efficiency, spatial spillover, and determinants in China. Acta Geogr. Sin. 2015, 70, 1788–1799. [Google Scholar]
  19. He, H.J.; Peng, C. The spatial-temporal evolution and the interactive effect between urban industrial structure transformation and land use efficiency. Geogr. Res. 2017, 36, 1271–1282. [Google Scholar]
  20. Zhou, Y.; Tan, G.G. Impact of local government competition on the efficiency of urban land use. Areal Res. Dev. 2017, 36, 118–122. [Google Scholar]
  21. Liang, L.T.; Zhai, B.; Fan, P. Impacts of economic agglomeration and industrial structure on urban land use efficiency. Areal Res. Dev. 2017, 36, 113–117. [Google Scholar]
  22. Zhao, P.J.; Zeng, L.G.; Lu, H.Y.; Hu, H.Y.; Liu, Y.P. Measurement and spatial econometrics analysis of provincial economic efficiency of urban construction land in China: 2008–2017. Urban Dev. Stud. 2019, 26, 37–49. [Google Scholar]
  23. Zhang, Y.H.; Chen, J.L.; Gao, J.L.; Jiang, W. The impact mechanism of urban land use efficiency in the Yangtze River Delta from the perspective of economic transition. J. Nat. Resour. 2019, 34, 1157–1170. [Google Scholar]
  24. Chen, Z.L.; Li, J.K.; LI, J. The influencing factors and spatial spillover effect of urban land use efficiency in China. Econ. Surv. 2017, 34, 25–30. [Google Scholar]
  25. Miao, J.J.; Xu, S. Impact of industrial collaborative agglomeration on urban land use efficiency from a spatial perspective: A case study of the Yangtze River Delta urban agglomeration. Urban Probl. 2020, 294, 14–21. [Google Scholar]
  26. Huang, J.M.; Hu, Y.C.; Duan, X.Y.; Liu, P.J. Research on land use efficiency and change of three urban agglomerations in my country. Jiangsu Agric. Sci. 2019, 47, 265–269. [Google Scholar]
  27. Li, N. The Evaluation of Land Use Structure Efficiency and Its Influencing Factors in Chongqing; Southwest University: Chongqing, China, 2018. [Google Scholar]
  28. Zhang, D.; Cai, Y. Efficiency difference of construction land use before and after the establishment of Wuhan metropolitan area. Shanghai Land Resour. 2019, 40, 14–20. [Google Scholar]
  29. Couto, E.V.D.; Oliveira, P.B.; Vieira, L.M.; Schmitz, M.H.; Ferreira, J.H.D. Integrating environmental, geographical and social data to assess sustainability in hydrographic basins: The ESI approach. Sustainability 2020, 12, 3057. [Google Scholar] [CrossRef] [Green Version]
  30. Zhang, F.F.; Liu, W.; Wu, L. Urban sustainable development evaluation based on ecological civilization construction: A case study of Beihai City, Guangxi province. J. Fujian Agric. For. Univ. Philos. Soc. Sci. Ed. 2020, 23, 65–72. [Google Scholar]
  31. Chen, R.S.; Zhao, Z.Q.; Xu, D.; Chen, Y. Progress of research on sustainable development index for cities and urban agglomerations. Prog. Geogr. Sci. 2021, 40, 61–72. [Google Scholar] [CrossRef]
  32. Shui, L.; Pan, H.Y.; Zhang, Q.Y.; Jiang, G.G.; Zhou, J.M. Spatio-temporal coupled coordination of urban and cultivated land use efficiency in Chengdu-Chongqing urban agglomeration. Bull. Soil Water Conserv. 2017, 37, 261–268. [Google Scholar]
  33. Shui, L. Spatial and Temporal Differences and Influencing Factors of Urban Land Use Efficiency in the Yangtze River Economic Belt; Sichuan Normal University: Chengdu, China, 2018. [Google Scholar]
  34. Chen, Z.X.; Wu, Z.B. Evaluation on land use structure and efficiency of urban agglomeration in Guangdong-Hong Kong-Macao Greater Bay Area. Urban Probl. 2019, 285, 29–35. [Google Scholar]
  35. Hu, B.X.; Li, J.; Kuang, B. Evolution characteristics and influencing factors of urban land use efficiency difference under the concept of green development. Econ. Geogr. 2018, 38, 185–191. [Google Scholar]
  36. Zhao, J.B. Study on Urban Land Use Efficiency of Henan Province Based on Three-Stage Super Efficiency DEA; Henan University: Kaifeng, China, 2018. [Google Scholar]
  37. Shao, Q.Q. Statistical Study on Urban Land Use Efficiency in Huaihe River Economic Zone; Anhui University of Finance: Anhui, China, 2019. [Google Scholar]
  38. Wang, H.L.; Zhou, X.; Su, Z.L.; Li, D.T. Evaluation of total factor land use efficiency and its temporal and spatial change pattern in Guangxi. Acta Agric. Jiangxi 2020, 32, 131–138. [Google Scholar]
  39. Belete, A.W.; Gezie, W.S. Assesment on urban density and land use efficiency in the Ethiopian cities. Civ. Environ. Res. 2017, 9, 7–15. [Google Scholar]
  40. Pouriyeh, A.; Khorasani, N.; Lotfi, F.H.; Farshchi, P. Efficiency evaluation of urban development in Yazd City, Central Iran using data envelopment analysis. Environ. Monit. Assess. 2016, 188, 618. [Google Scholar] [CrossRef]
  41. Wu, Y.T. Study on Land Use Efficiency in Agricultural Land Transfer Based on Three-Stage DEA Model—A Case Study of Jiangsu Province; East China University of Science and Technology: Shanghai, China, 2018. [Google Scholar]
  42. Sun, J. Study on Land Use Efficiency Evaluation of Urban Agglomeration in Central Yunnan from the Perspective of Construction Land; Yunnan University of Finance and Economics: Kunming, China, 2019. [Google Scholar]
  43. Qiu, Y.Y.; Sun, J.; Zhou, R.X.; Sheng, J. The strategy of reliability improvement and capacity reservation under supply disruption. J. Wuhan Univ. Technol. Inf. Manag. Eng. 2017, 39, 593–597. [Google Scholar]
  44. Feng, Y.; Wang, C. Land use efficiency is improved based on DEA method. J. Southwest China Norm. Univ. Nat. Sci. Ed. 2019, 44, 74–78. [Google Scholar]
  45. Li, C.M.; Hu, J.J. Analysis of spatial and temporal differences and influencing factors of urban land use efficiency based on DEA: A case study of 9 cities in Jilin province. Resour. Environ. Yangtze Basin 2020, 29, 146–154. [Google Scholar]
  46. Qiu, J.Y. Study on Urban Land Use Efficiency under Environmental Constraints in China; Yunnan University of Finance and Economics: Kunming, China, 2020. [Google Scholar]
  47. Li, W.B. Urban Land Use Efficiency and Its Influencing Factors under Environmental Constraints in China; Lanzhou University: Lanzhou, China, 2018. [Google Scholar]
  48. Zhu, L.X.; Luo, Z.F.; Wang, Q.W.; Zhang, J. Spatial-temporal differences of urban land use efficiency and its evolution constraints under environmental constraints in Gansu province. Res. Soil Water Conserv. 2020, 27, 368–375. [Google Scholar]
  49. Li, J.; Li, C.J.; He, J.K. Study on spatial-temporal difference of urban land use efficiency. China Real Estate 2017, 27, 45–51. [Google Scholar]
  50. Yu, L.; Xu, G.J. Study on temporal and spatial evolution characteristics of urban land use efficiency in Henan Province. J. Henan Agric. Univ. 2017, 51, 580–588. [Google Scholar]
  51. Hua, Y.Q.; Ye, C.S. Spatial and temporal differentiation of urban land use efficiency based on DEA in Guangdong Province. Res. Soil Water Conserv. 2018, 25, 287–292. [Google Scholar]
  52. Martinho, V.J. Efficiency, total factor productivity and returns to scale in a sustainable perspective: An analysis in the European Union at farm and regional level. Land Use Policy 2017, 68, 232–245. [Google Scholar] [CrossRef]
  53. Lu, C.; Meng, P.; Zhao, X.; Jiang, L.; Zhang, Z.; Xue, B. Assessing the economic-environmental efficiency of energy consumption and spatial patterns in China. Sustainability 2019, 11, 591. [Google Scholar] [CrossRef] [Green Version]
  54. Wan, J.J.; Chen, X. Spatial pattern and spillover effect of urban land intensive use efficiency in China from the perspective of land development rights. Econ. Geogr. 2018, 38, 160–167. [Google Scholar]
  55. Chen, D.L.; Li, J.; Hu, B.X. Spatial correlation characteristics of urban land use efficiency in urban agglomeration in the middle reaches of Yangtze River. Urban Probl. 2018, 9, 55–64. [Google Scholar]
  56. Zhou, X.Y.; Zhang, F.; Zhang, M.M. The influencing factors and spatial spillover effects of urban land use efficiency in the Yangtze River Economic Belt. Geomat. Spat. Inf. Technol. 2020, 43, 1–6. [Google Scholar]
  57. Jin, G.; Deng, X.Z.; Zhao, X.D.; Guo, B.S.; Yang, J. Spatiotemporal patterns in urbanization efficiency within the Yangtze River Economic Belt between 2005 and 2014. J. Geogr. Sci. 2018, 28, 1113–1126. [Google Scholar] [CrossRef] [Green Version]
  58. Caruso, G.; Hilal, M.; Thomas, I. Measuring urban forms from inter-building distances: Combining MST graphs with a local index of spatial association. Landsc. Urban Plan. 2017, 163, 80–89. [Google Scholar] [CrossRef] [Green Version]
  59. Ji, Z.H.; Zhang, P. Spatial difference and driving mechanism of urban land use efficiency under the environmental constraints: Based on 285 cities in China. China Land Sci. 2020, 34, 72–79. [Google Scholar]
  60. Liu, S.C. Spatiotemporal Evolution and Optimization Path of Land Use Efficiency in Urban Agglomeration; Huazhong Agricultural University: Wuhan, China, 2019. [Google Scholar]
  61. Yan, Z.Q. Spatial and Temporal Differences and Influencing Factors of Urban Land Use Efficiency in Mountainous Borderland Provinces of Southwest China: A Case Study of Yunnan Province; Yunnan University of Finance and Economics: Kunming, China, 2017. [Google Scholar]
  62. Han, L.; He, T.T.; Yang, Y. Coupling coordination evaluation of high quality development and land use efficiency of urban agglomeration. J. Henan Norm. Univ. Philos. Soc. Sci. Ed. 2021, 48, 95–101. [Google Scholar]
Figure 1. Scope map of targeted areas for the study.
Sustainability 13 08902 g001
Figure 2. Bar chart of the average urban land use efficiency of 65 prefecture-level cities in the Yellow River Basin.
Sustainability 13 08902 g002
Figure 3. Line graph of the average urban land use efficiency of 65 prefecture-level cities in the Yellow River Basin.
Sustainability 13 08902 g003
Figure 4. Trends in Global Moran’s I Index of urban land use efficiency in the Yellow River Basin.
Sustainability 13 08902 g004
Figure 5. Spatial correlation map of urban land use efficiency in the Yellow River Basin.
Sustainability 13 08902 g005
Table 1. Targeted areas for the study.
Serial NumberProvinceShorthandRegionShorthand
1GansuGSLanzhou LZ
2GansuGSBaiyinBZ
3GansuGSDingxi DX
4GansuGSWuweiWW
5GansuGSLinXiaZhouLX
6GansuGSLongnan LN
7GansuGSTianshuiTS
8GansuGSPingliang PL
9GansuGSQingyang QY
10GansuGSGannanGN
11NingxiaNXYinchuanYC
12NingxiaNXShizuishanSZS
13NingxiaNXWuzhong WZ
14NingxiaNXGuyuan GY
15NingxiaNXZhongweiZW
16Inner MongoliaIMHohhotHT
17Inner MongoliaIMBaotou BT
18Inner MongoliaIMUlanqabUB
19Inner MongoliaIMErdosES
20Inner MongoliaIMBayannur BY
21Inner MongoliaIMWuhai WH
22Inner MongoliaIMLa shan auLS
23Shanxi (1)SX (1)Taiyuan TY
24Shanxi (1)SX (1)DatongDT
25Shanxi (1)SX (1)Yangquan YQ
26Shanxi (1)SX (1)Changzhi CZ
27Shanxi (1)SX (1)JinchengJC
28Shanxi (1)SX (1)ShuozhouSZ
29Shanxi (1)SX (1)Jinzhong JZ
30Shanxi (1)SX (1)YunchengYC
31Shanxi (1)SX (1)Xinzhou XZ
32Shanxi (1)SX (1)LinfenLF
34SichuanSCAbaAB
35Shanxi (2)SX (2)Xi’anXA
36Shanxi (2)SX (2)Tongchuan TC
37Shanxi (2)SX (2)BaojiBJ
38Shanxi (2)SX (2)XianyangXY
39Shanxi (2)SX (2)WeinanWN
40Shanxi (2)SX (2)Yan’anYA
41Shanxi (2)SX (2)Yulin YL
42Shanxi (2)SX (2)ShangluoSL
43HenanHNZhengzhou ZZ
44HenanHNKaifengKF
45HenanHNLuoyangLY
46HenanHNAnyang AY
47HenanHNHebi HB
48HenanHNXinxiangXX
49HenanHNPuyang PY
50HenanHNSanmenxia SMX
51HenanHNShangqiuSQ
52HenanHNJiaozuoJZ
53HenanHNJiyuanJY
54ShandongSDJinanJN
55ShandongSDQingdaoQD
56ShandongSDZiboZB
57ShandongSDDongyingDY
58ShandongSDWeifangWF
59ShandongSDJiningJN
60ShandongSDTai’anTA
61ShandongSDLaiwuLW
62ShandongSDDezhouDZ
63ShandongSDLiaochengLC
64ShandongSDBinzhouBZ
65ShandongSDHezeHZ
Table 2. Indicator system for measuring urban land use efficiency in the Yellow River Basin.
Target LevelCriteria LevelIndicator Level
Indicator System for Measuring Urban Land Use Efficiency in Yellow River BasinLand InputBuilt-up Area Size
Financial InputFiscal Expenditure
Total Amount of Social Fixed Asset Investment,
Human InputNumber of Employees in Secondary and Tertiary Industries
Economic OutputGross Regional Production Value
Per Capita GDP
Added Value of Secondary and Tertiary Industries
Total Retail Sales of Social Consumer Goods
Social OutputFiscal Revenue
Per Capita Disposable Income of Urban Residents
Road Area
Per Capita Construction Land Area
Environmental OutputGreening Coverage Rate of Built-Up Areas
Comprehensive Utilization Rate of Industrial Solid Waste
Compliance Rate of Industrial Wastewater Discharge
Compliance Rate of Industrial Smoke Emission
Harmless Treatment Rate of Domestic Waste
Table 3. Statistical values of global Moran’s I Index of urban land use efficiency in the Yellow River Basin.
YearGlobal Moran’s I ValueZ Valuep Value
20000.1763643.7658390.000166
20010.1491043.2026000.001362
20020.1287522.6627200.007751
20030.1060142.2980170.021561
20040.1363652.9710530.002968
20050.1339652.9727250.002952
20060.0949871.9580090.050229
20070.0605401.3810710.167257
20080.1521952.9964740.002731
20090.2200784.1937910.000027
20100.2387394.5240220.000006
20110.2279584.3901200.000011
20120.1350712.9393780.003289
20130.1203682.4102780.015940
20140.1973303.7172540.000201
20150.1934043.6468270.000265
20160.1963783.7049080.000211
20170.2014753.8260190.000130
20180.1755163.3999740.000674
Publisher’s Note: MDPI stays neutral with regard to jurisdictional claims in published maps and institutional affiliations.

