Abstract
Groundwater is the main irrigation water source in the Upper Peacock River. As fast enlargement of irrigation areas continues in recent years, the groundwater level declines continuously and has posed a threat to the sustainability of local agriculture and ecology. A numerical model was established with the code MODFLOW–2000 in order to predict the declining trend of groundwater level and formulate measures to counter the overexploitation, in which the river–aquifer interaction was elaborated and characterized by field survey. The results show that under current intensity of groundwater withdrawal, the levels of both unconfined and confined waters would decline continuously in 7 years from 2015. To stop the groundwater level from declining on the regional scale, the withdrawal rate should be compressed by 45% with respect to that in 2015. Moreover, taking consideration of the constraint of maintaining the ecological water level in the vicinity of the Euphrates Poplar forest in the study area, the withdrawal rate should be compressed 70% for seven towns around the forest.
1. Introduction
Groundwater is the primary water resources for domestic, industrial, and agricultural use in many arid and semi-arid regions [1,2,3]. In recent years, groundwater shortage has drawn much concern in these regions under the stress of climate change and anthropogenic activities [4,5,6,7,8,9], such as the large aquifers in Eastern and Northern Africa, the California’s Central Valley, and Southern Plains in North America, south-eastern Spain, North China Plain, and Middle East [10,11,12,13,14,15,16,17]. Strategies such as introducing substitute water, artificial recharge, water saving and reuse, and groundwater management are applied in order to ensure the sustainable use of groundwater [18,19,20,21,22]. In some arid or semi-arid areas unavailable for additional surface water resources, applying groundwater management to control pumping and water level is a more realistic choice. The optimal management scheme should find a balance between socioeconomic development and groundwater sustainability. For this purpose, numerical simulation is usually used for estimation of the impact of various management schemes [23,24,25,26,27]. In arid or semi-arid areas, river water is often the only recharge for groundwater, thus it is critical to characterize the river–aquifer interaction in detail to ensure the accuracy of the model [28,29]. However, the key parameters for river–groundwater interaction are usually adjusted by the fluctuation of groundwater levels and river flow at the basin scale, while field survey is relatively few. Thus, it is necessary to combine field survey in determination of the parameters.
Northwestern China, located in Central Asia, which is furthest from oceans in the world, is characterized by an arid or semi–arid climate. However, as the region covers ca. 34.8% of the land area of China [30] and is abundant with land and sunshine resources, many large irrigation areas have been established since the 1950s. For example, the farmland had increased by 54.29% from 1972 to 2015 [31]. The fast enlargement of farmland results in increasing need for water resources. In some irrigation areas, such as in the Hexi Corridor and Tarim Basin, groundwater has been intensely exploited due to a shortage of surface water [32,33], leading to overexploitation. In northwestern China, the annual groundwater discharge has exceeded the recharge by 3.77 × 10⁹ m3 in 2001–2016 compared to 1.57 × 10⁹ m3 in 1956–1979 [34]. As a result, the groundwater level declines continuously and the local natural plants are substituted by artificial vegetation, making these areas become artificial oases. In view of the impact of irrigation on groundwater dynamics, further study is needed to quantitatively distinguish its contribution and predict groundwater flow patterns under the impact of irrigation, which is critical to achieve sustainable management of the groundwater resources and effective protection of the local ecosystems.
The Upper Peacock River is a typical irrigation region, supported by groundwater in arid northwestern China, facing the problem of groundwater overexploitation and natural vegetation degradation, needing to develop a reasonable groundwater management plan, based on consideration of both agricultural development and ecological protection, as is a common demand for the other irrigation regions. In the present study, a three-dimensional groundwater flow model was established for the Upper Peacock River, in which the river-aquifer interaction was characterized through field survey, to investigate the groundwater regime, affected by irrigation, and predict the evolution of the groundwater level under various water conservation schemes in order to formulate the optimal measures to control the groundwater overexploitation and protect the natural vegetation.
2. Materials and Methods
2.1. General Setting
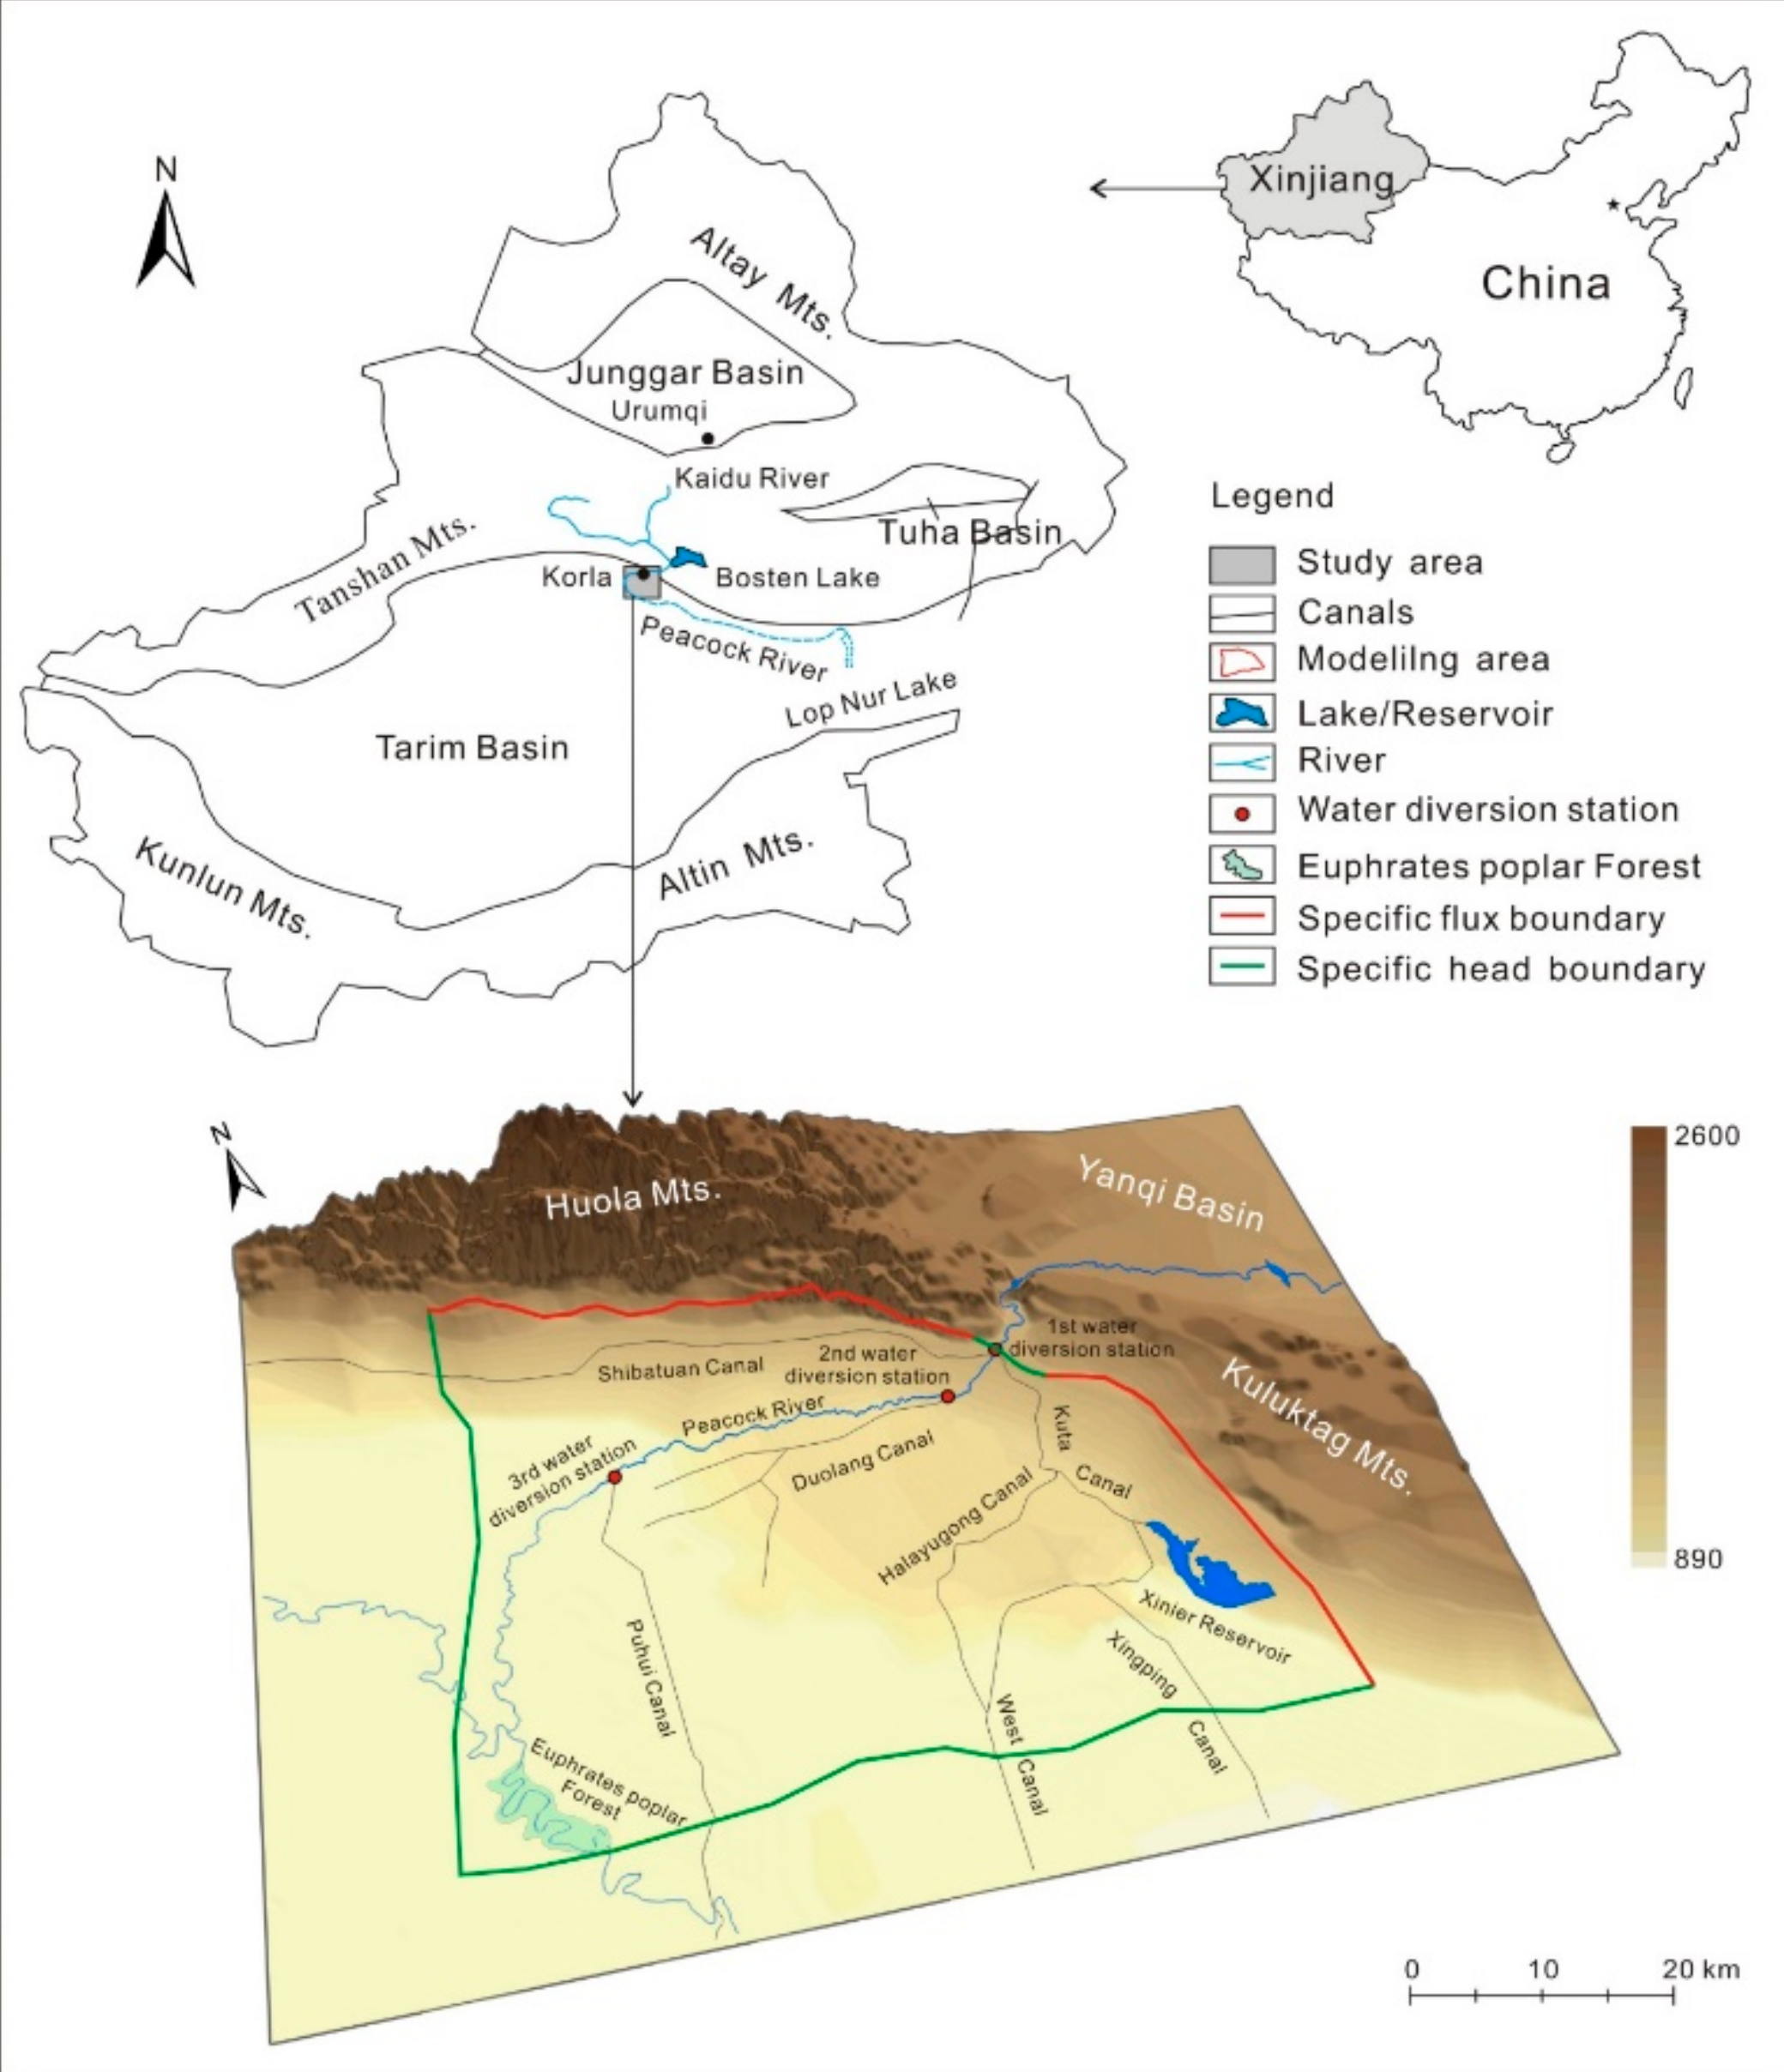
The Peacock River is well known as a river with no tributaries located in the northeast of the Tarim Basin, Northwest China. It originates from the Bosten Lake in the eastern Tianshan Mt., which is fed by the Kaidu River and finally drains into the Lop Nur Lake, in the Taklimakan Desert, with a total length of 785 km. As the Bosten Lake’s water level declines in recent years, the lake water is pumped into the Peacock River, thus the runoff is determined by the water volume delivered, with an average annual runoff of ca. 12.75 × 10⁸ m3/a. However, the river water is consumed and dries up completely after reaching the Third Water-diversion Station downstream (Figure 1).
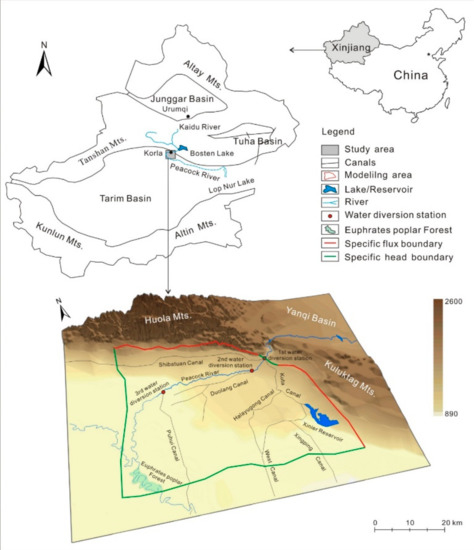
Figure 1.
Location of the study area.
The study area situates at the alluvial-pluvial of the Peacock River at the piedmont of the Tianshan Mt. The administrative division belongs to Korla city, Xinjiang Uygur Autonomous Region, with an area of 1500 km2. The climate is extremely dry, with an average annual precipitation of 55.4 mm/a, evaporation of 2772.8 mm and temperature of 11.3 °C for the last 50 years. The terrain in the area undulates gently decreases from northeast to southwest, with the elevation ranges from 890 to 960 m a.s.l. (above sea level). The Peacock River is the only surface water available in the area. A large number of water canals are constructed in the area, which delivers the river water and groundwater into farmlands with a flow rate of 0.5–30.0 m3/s. The Canals are all lined by cement, with a leakage coefficient of ca. 10% (Figure 1).
2.2. Geology and Hydrogeology
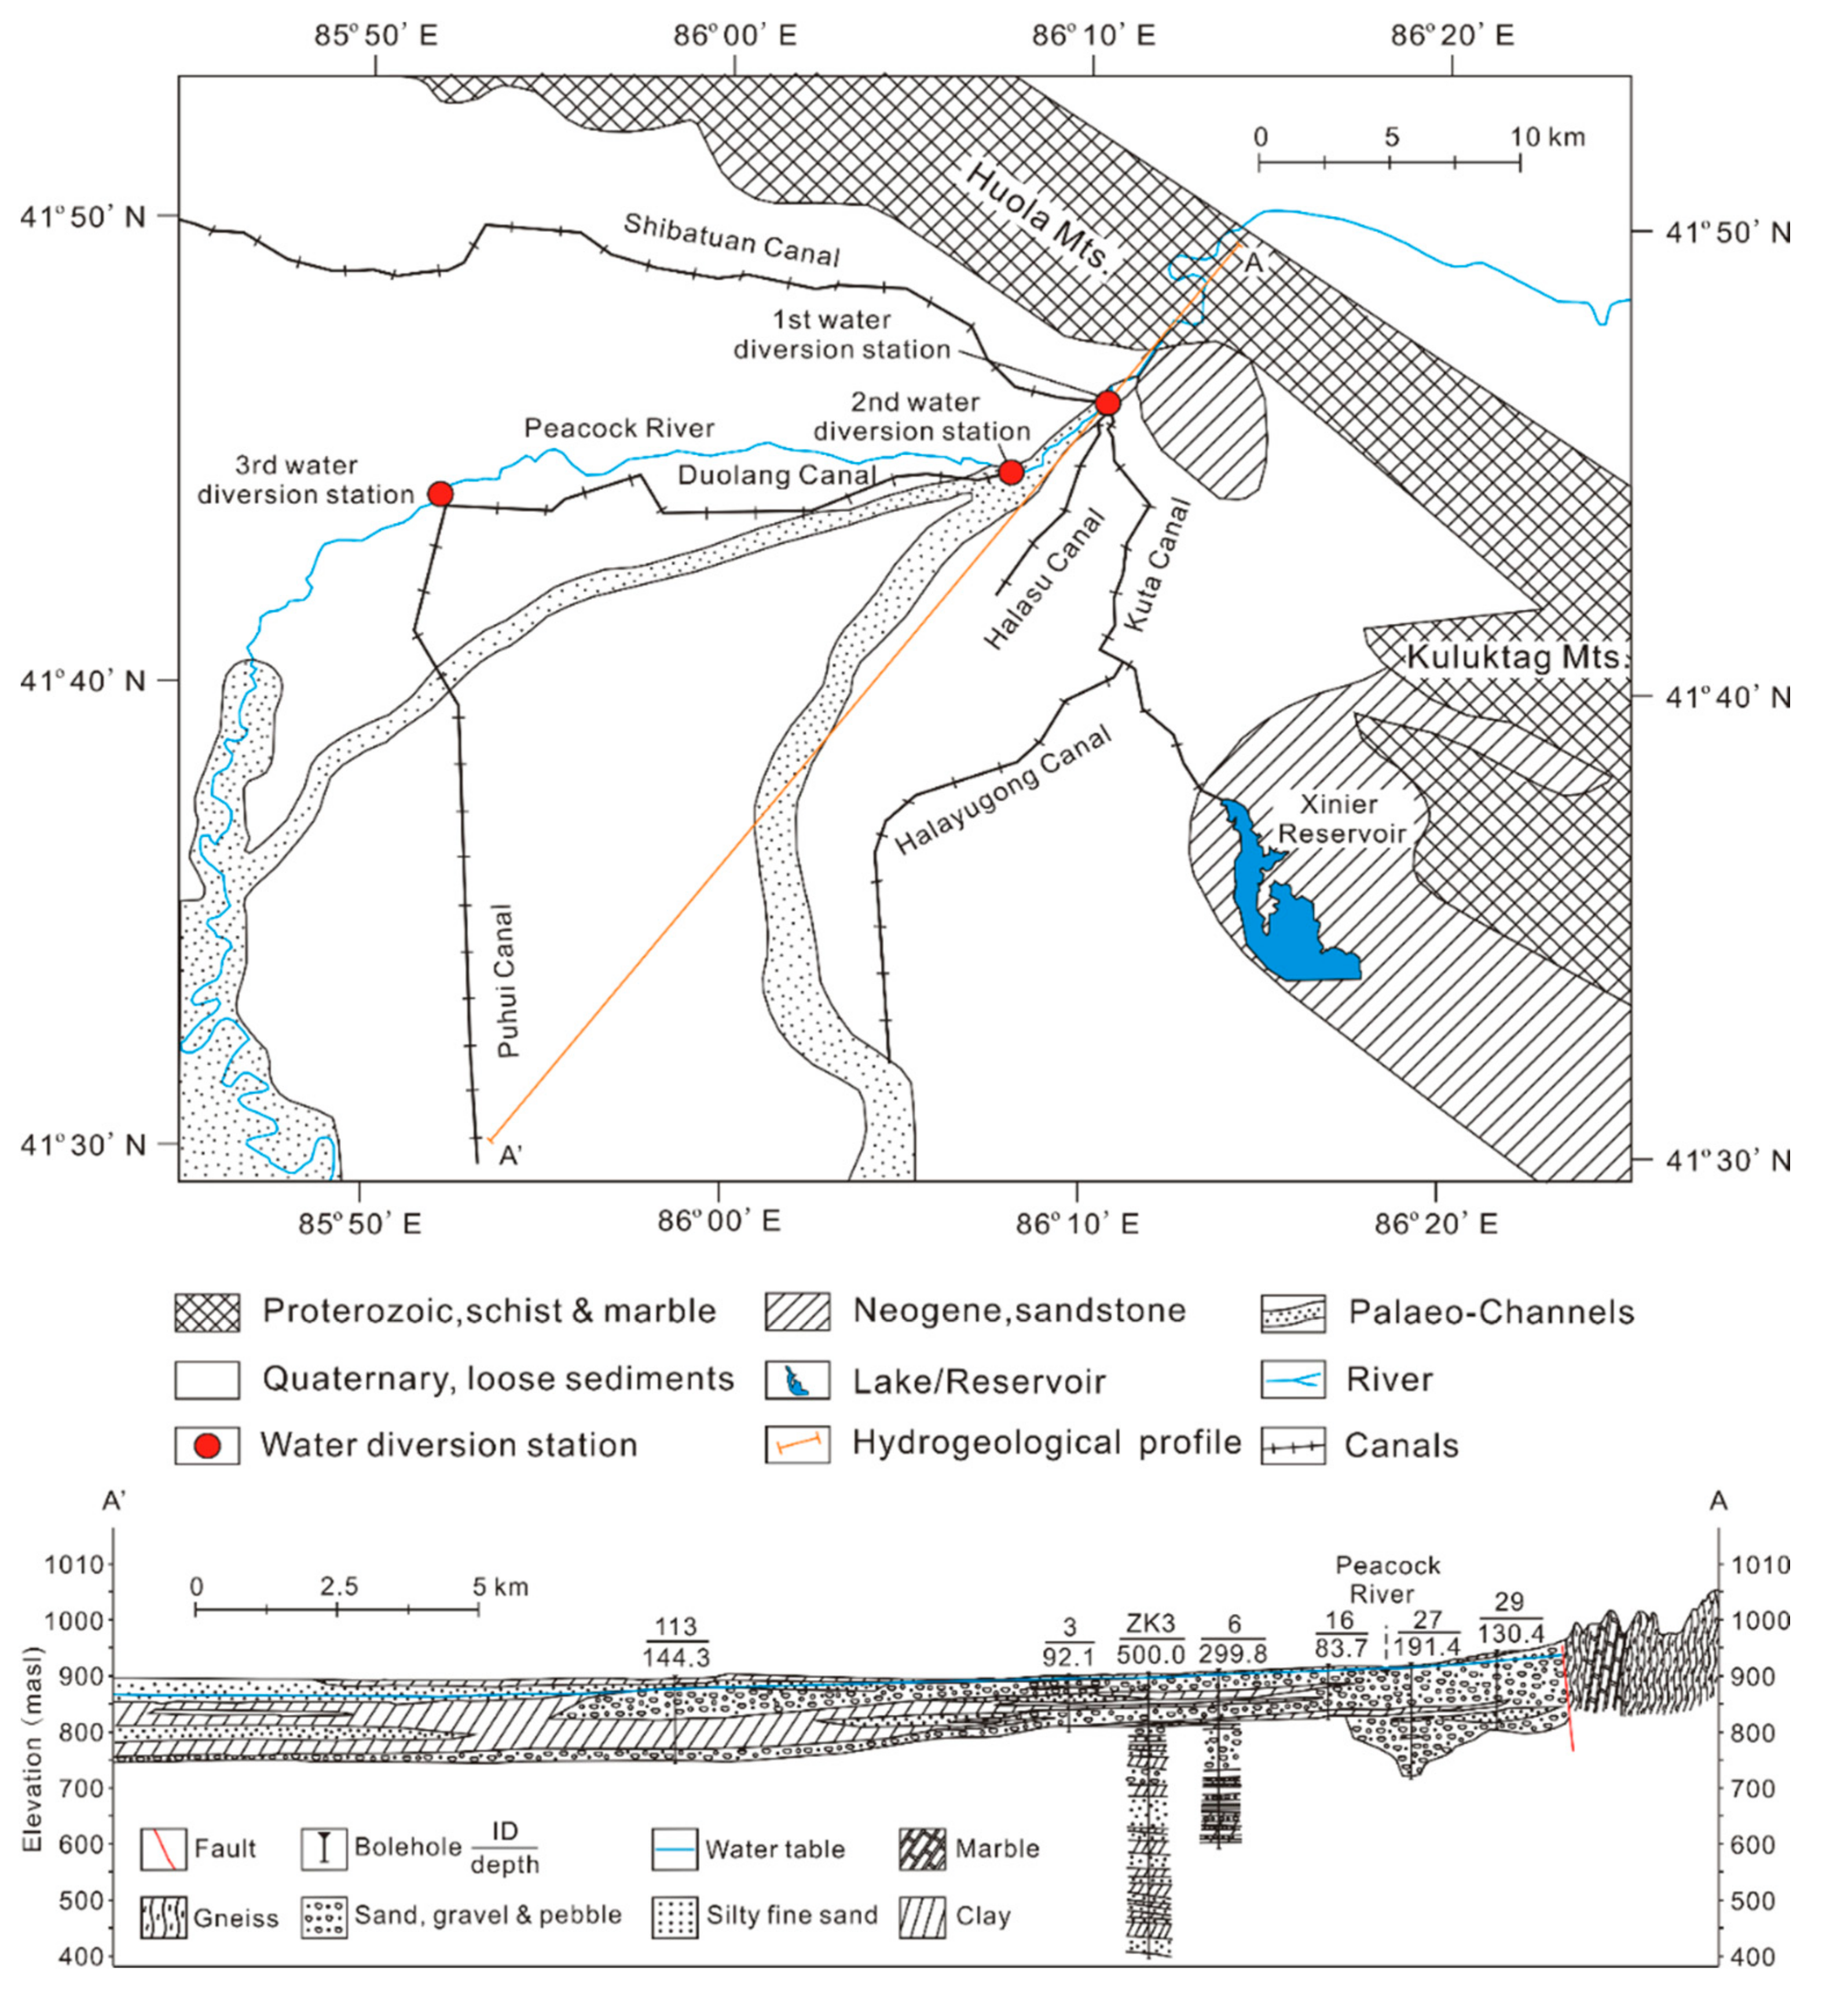
Due to multi-time strong tectonic movements, the Paleozoic and Eeogene in the study area are missing. Strata in the study area include the Archean, the Proterozoic, the Tertiary, and the Quaternary (Figure 2). The lithology of the Archean is mainly metamorphic shallow sea clastic rocks and marble, and it forms the regional basement. The Proterozoic mainly outcrops in the Kuruktag Mt. area in the northeast. Its lithology is quartz plagioclase schist, biotite quartz schist, thick bedded marble, etc., and it contacts with the underlying Archean by faults. The rock is in sheet structure, with developed joints and fissures. The Neogene is distributed in the piedmont of the Kuruktag Mt. and is in fault contact with the Proterozoic. The lithology is mainly mudstone, sandy mudstone, sandstone, and interbedded siltstone, with a thickness of 20–50 m. The Quaternary is widely distributed in the study area and almost covers the whole piedmont plain, with a thickness of 10–500 m, hosting a porous aquifer system. From the Piedmont to the plain, the lithology gradually transits from coarse-grained pebbly gravel to fine sediment composed of fine sand, silt, and clay, and the aquifer system changes from a single-layer unconfined aquifer to a multi-layer confined structure. At the center of the alluvial-pluvial fan, there are distributed two Paleo-channels, where the aquifer has a higher hydraulic conductivity of 55–95 m/d, while the other region of the study area is 8−50 m/d. The unconfined water level decrease from 3 to 25 m below the surface from the piedmont downstream. The confined water level is a little lower than that of the unconfined water and is recharged by the unconfined water. In natural state, the main recharge source for the groundwater is the Peacock River as the precipitation is negligible. However, as fast development of the agriculture continues, irrigation return flow accounts for a large proportion (ca. 50% in 2015) of the groundwater recharge [35], while pumping and evapotranspiration consist the main.
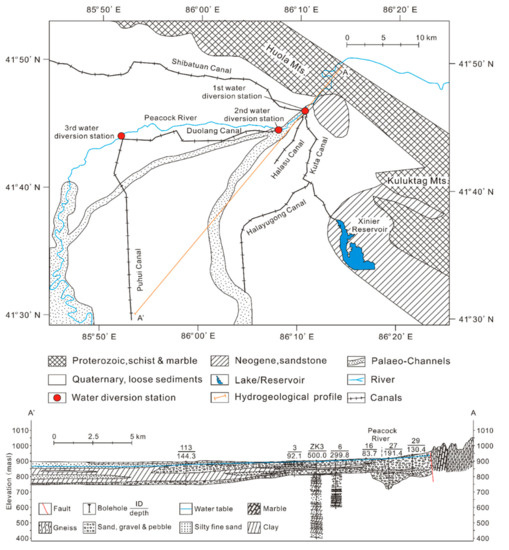
Figure 2.
Schematic hydrogeological map of the study area.
2.3. Irrigation and Groundwater Overexploitation
Korla city is one of the most important agricultural bases in China, and the irrigation area has seen a sharp increase since 1990s through land reclamation from grass land, forest land, sand land, and saline and alkaline land [36]. The water resources utilized for irrigation in the area include river water and groundwater. Irrigation areas along the Peacock River and around the Xinier Reservoir usually use surface water as the main water source. However, as the water allocated from the Peacock River for irrigation decreases continuously since 2011, surface water is now only used for spring irrigation in these areas, while in crop growth period groundwater is widely used to cover the shortage of irrigation water. In the other areas, groundwater is the only water source for irrigation. With the continuous enlargement of the irrigation area, the amount of groundwater withdrawal has leaped. The number of irrigation wells has increased from 1367 in 1998 to 5499 in 2014, the volume of groundwater exploited has increased from 255,394,000 to 620,570,500 m3 accordingly, and the groundwater has been severely overexploited. As a result, the water head of unconfined and confined water drops at a rate of 0–1.5 m/a and 0–4.0 m/a, respectively, and the water table has declined to 8–40 m below the surface [35], thus the vegetation in the study area are mostly supported by irrigation but not groundwater.
2.4. River-Aquifer Interaction
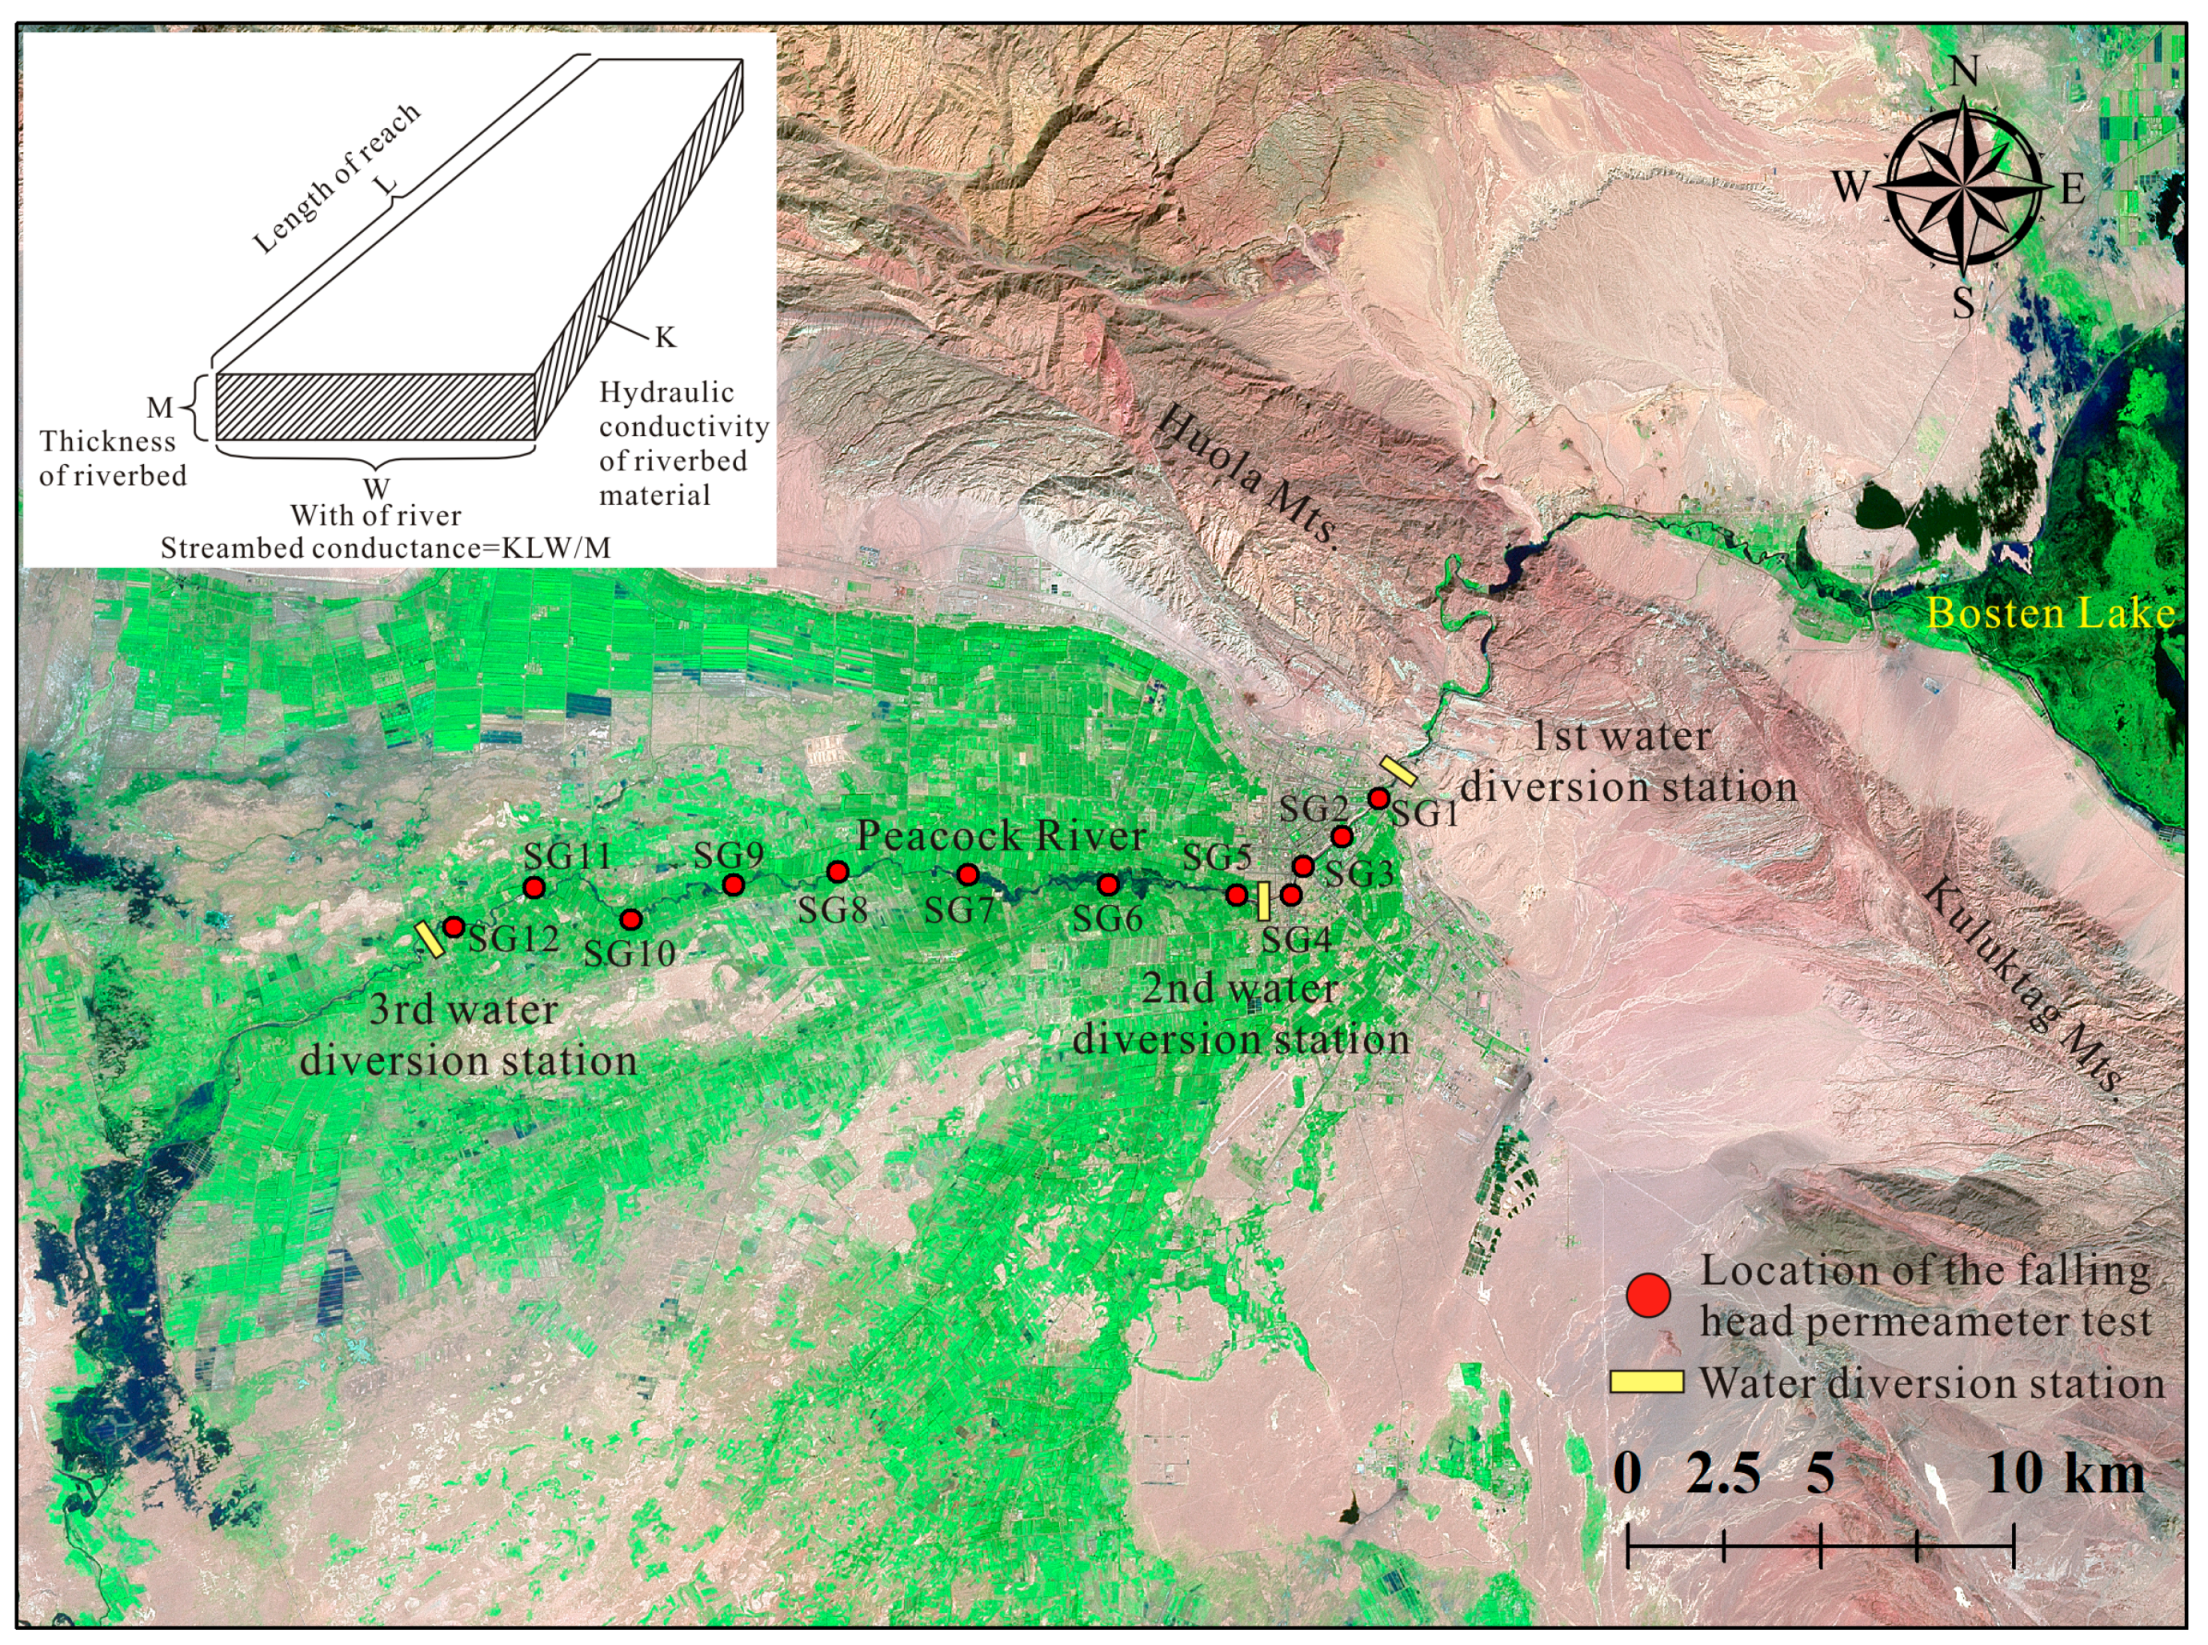
Rivers contribute water to the groundwater system or drain water from it depending on the head gradient between the river and the groundwater regime, and the flow between the river and aquifer can be described by Darcy’s law. In GMS, the interaction between river and aquifer is simulated by the River Package [37]. The model assumes that there is a layer of low permeability riverbed material, which separates the open water of a river from the groundwater system, and the riveraquifer interconnection is represented as a simple conductance through which one-dimensional flow occurs (Figure 3). Two situations are considered in the model depending on the relationship between groundwater table and river surface. If the aquifer is interconnected with the river, i.e., the groundwater table is above the bottom of the riverbed layer, the flow between the river and the aquifer is simulated according to the equation set
where QRiv is the flow between the river and the aquifer, CRiv is the hydraulic conductance of the stream-aquifer interconnection (KvLW/M), h is the head underlying the river reach, Kv is vertical hydraulic conductivity of the riverbed layer, L and W is length and width of the river, respectively, and M is thickness of the riverbed.
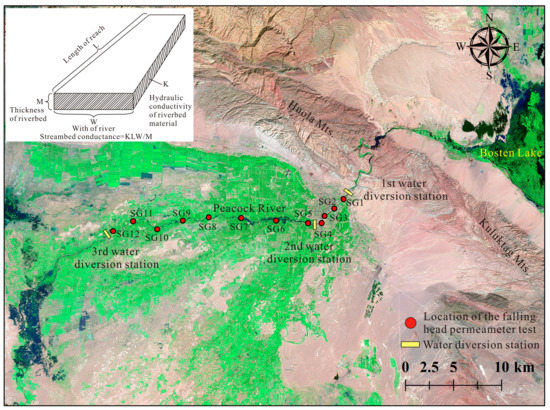
Figure 3.
Location of the falling head permeameter test. The incised figure represents idealization of riverbed conductance in an individual cell.
If the river is disconnected with the aquifer, i.e., the groundwater table is below the bottom of the riverbed layer, assuming that the streambed layer itself remains saturated, the flow of the leakage from the river into aquifer is simulated according to
where Rbot is the bottom of the riverbed layer.
In this study, HRiv is monthly measured from March 2013 to March 2015, L and W is determined based on 1:50,000—scale topographic map of the study area. K is investigated using the falling head permeameter test [35]. The permeameter test was carried out on the whole river, reaches from the mountain to the third water diversion station, and 12 profiles in total were chosen, according to the hydraulic conditions of the river (Figure 3).
At each permeameter test profile, the riverbed sediment, down to 1.5 m below the riverbed, is sampled by a soil sampler (Eijkelkamp Agrisearch Equipment, Netherlands), then particle analysis was conducted to determine M, below which the lithology of the sediment is similar as that of the aquifer. The investigated Kv and M of the Peacock River is listed in Table 1.

Table 1.
Investigated Kv and M of the Peacock River.
The results show that Kv of the Peacock River decreases from the upper reach downward, as the result of a decrease in the hydraulic gradient, whereas M of the riverbed grows thicker as the hydrodynamic condition becomes weaker.
2.5. Numerical Modeling of the Groundwater Flow System
As the hydraulic gradient of the groundwater is small, i.e., mostly within 1‰, the groundwater flow in the study area follows Darcy’s law. Taking the heterogeneous and anisotropic characteristics of the lithology of the aquifers and aquitard into consideration, the MODFLOW–2000 code [37] was used to characterize the 3D groundwater flow in the piedmont plain. The Block–Centered Flow (BCF) package was used to specify the groundwater flow system. Two layers were generalized in the model according to the hydrogeological and borehole data from a newly finished hydrogeological investigation [35]. The first layer was the unconfined aquifer with a thickness of 6–170 m, while the second layer was a confined aquifer with a thickness of 230–380 m. The aquitard is comprised of loam and sandy loam with a thickness of 3–24 m, which was represented by Leakance as one layer. The elevations of the ground surface and the bottom elevation of each layer are variable across the piedmont plain.
The northern and eastern boundaries were set along the boundaries between the mountains and the piedmont plain. As have undergone many tectonic movements, fissures have developed ubiquitously in the Archean and Proterozoic metamorphic rocks and granite in the northern and eastern mountains, favoring the occurrence of fissure water. The Tertiary clastic rocks in the eastern part of piedmont plain are mainly comprise of mudstone, breccia, sandstone and siltstone, and host some pore-water. Moreover, the piedmont plain and the mountains are bordered by some neotectonic faults, which are considered relatively permeable [35]. Therefore, the northern and eastern boundaries were regarded as specific flux boundaries in the model (Figure 1), while the southern and western boundaries were presented as changing head boundaries determined by connecting the most outlying piezometers in the downstream area of the groundwater flow field within the study area (Figure 1), and groundwater may flow out or flow in through them due to large groundwater level fluctuations near the boundaries in response to seasonal pumping and irrigation. As groundwater receives the recharge from the river underflow at the mountain mouth, the boundary is set as changing head boundary (Figure 1). The bottom of the model was regarded as a confining boundary considering the impermeability of the underlying bedrock. The river leakage, precipitation, evapotranspiration, irrigation, and canal infiltration define the top boundaries and were considered as flux boundaries in the model. As the groundwater levels show significant fluctuations within the year due to river leakage, groundwater pumping, and irrigation, a transient model was established for simulating the groundwater flow system in the study area. The mathematical model is
where H is groundwater level (m), H0 is initial groundwater level (m), H1 is groundwater level at changing head boundary (m), H2 is groundwater level at specified flux boundary (m), HR is river stage at specified flux boundary (m), ΔH is the difference of hydraulic head between the unconfined and confined aquifers (m), B is the height of aquifer bottom (m). K is hydraulic conductivity (m/d), μ is specific yield, Q1 is groundwater withdrawal (m/d), Q2 is irrigation return flow (m/d), Q3 is groundwater discharge by evaporation (m/d), K’ is hydraulic conductivity of aquitard (m/d), q1 is groundwater flux through specific flux boundary (m3/d), q2 is the flow of the leakage from the river into aquifer (m3/d), x designates horizontal distance (m), z designates vertical distance (m), Kv is vertical hydraulic conductivity of the riverbed layer (m/d) and T is transmissivity of confined aquifer (m2/d).
The model domain is 1597 km2, with a horizontal extension of ca. 50.5 km along the X direction and ca. 43.1 km along the Y direction, and a vertical thickness of ca. 500 m was discretized by 13,770 grids sized 150 × 150 m and three layers. The surface elevation was interpreted with Digital Elevation Model (DEM) data, and the bottom elevation of each layer was interpolated with the Kriging Method based on well logging and geophysical data from [35]. The river-aquifer interaction was simulated using the RIVER package. Precipitation, irrigation infiltration, and reservoir leakage were all treated as areal recharges, while canal infiltration as linear recharge. The spatial distribution of the coefficients of precipitation and irrigation infiltration was specified according to an investigation based on chloride mass balance method [38]. The zonation of evaporation was obtained with the Averianov formula, in which the depth of water table at which the evaporation approaches zero was set as 3 m, according to a field test near the study area [39]. Groundwater withdrawal was simulated by fully screened wells based on measured pumping rate with the WELL package. The pumping season with high irrigation rate occurred in March, June, July, and August. All data were given monthly in the model. The initial distribution of hydraulic parameters, including hydraulic conductivity (K), transmissivity (T), leakance (VCONT), specific yield (Sy), and specific storage (Ss) were assigned according to the previous investigations [35], and these values were subsequently calibrated.
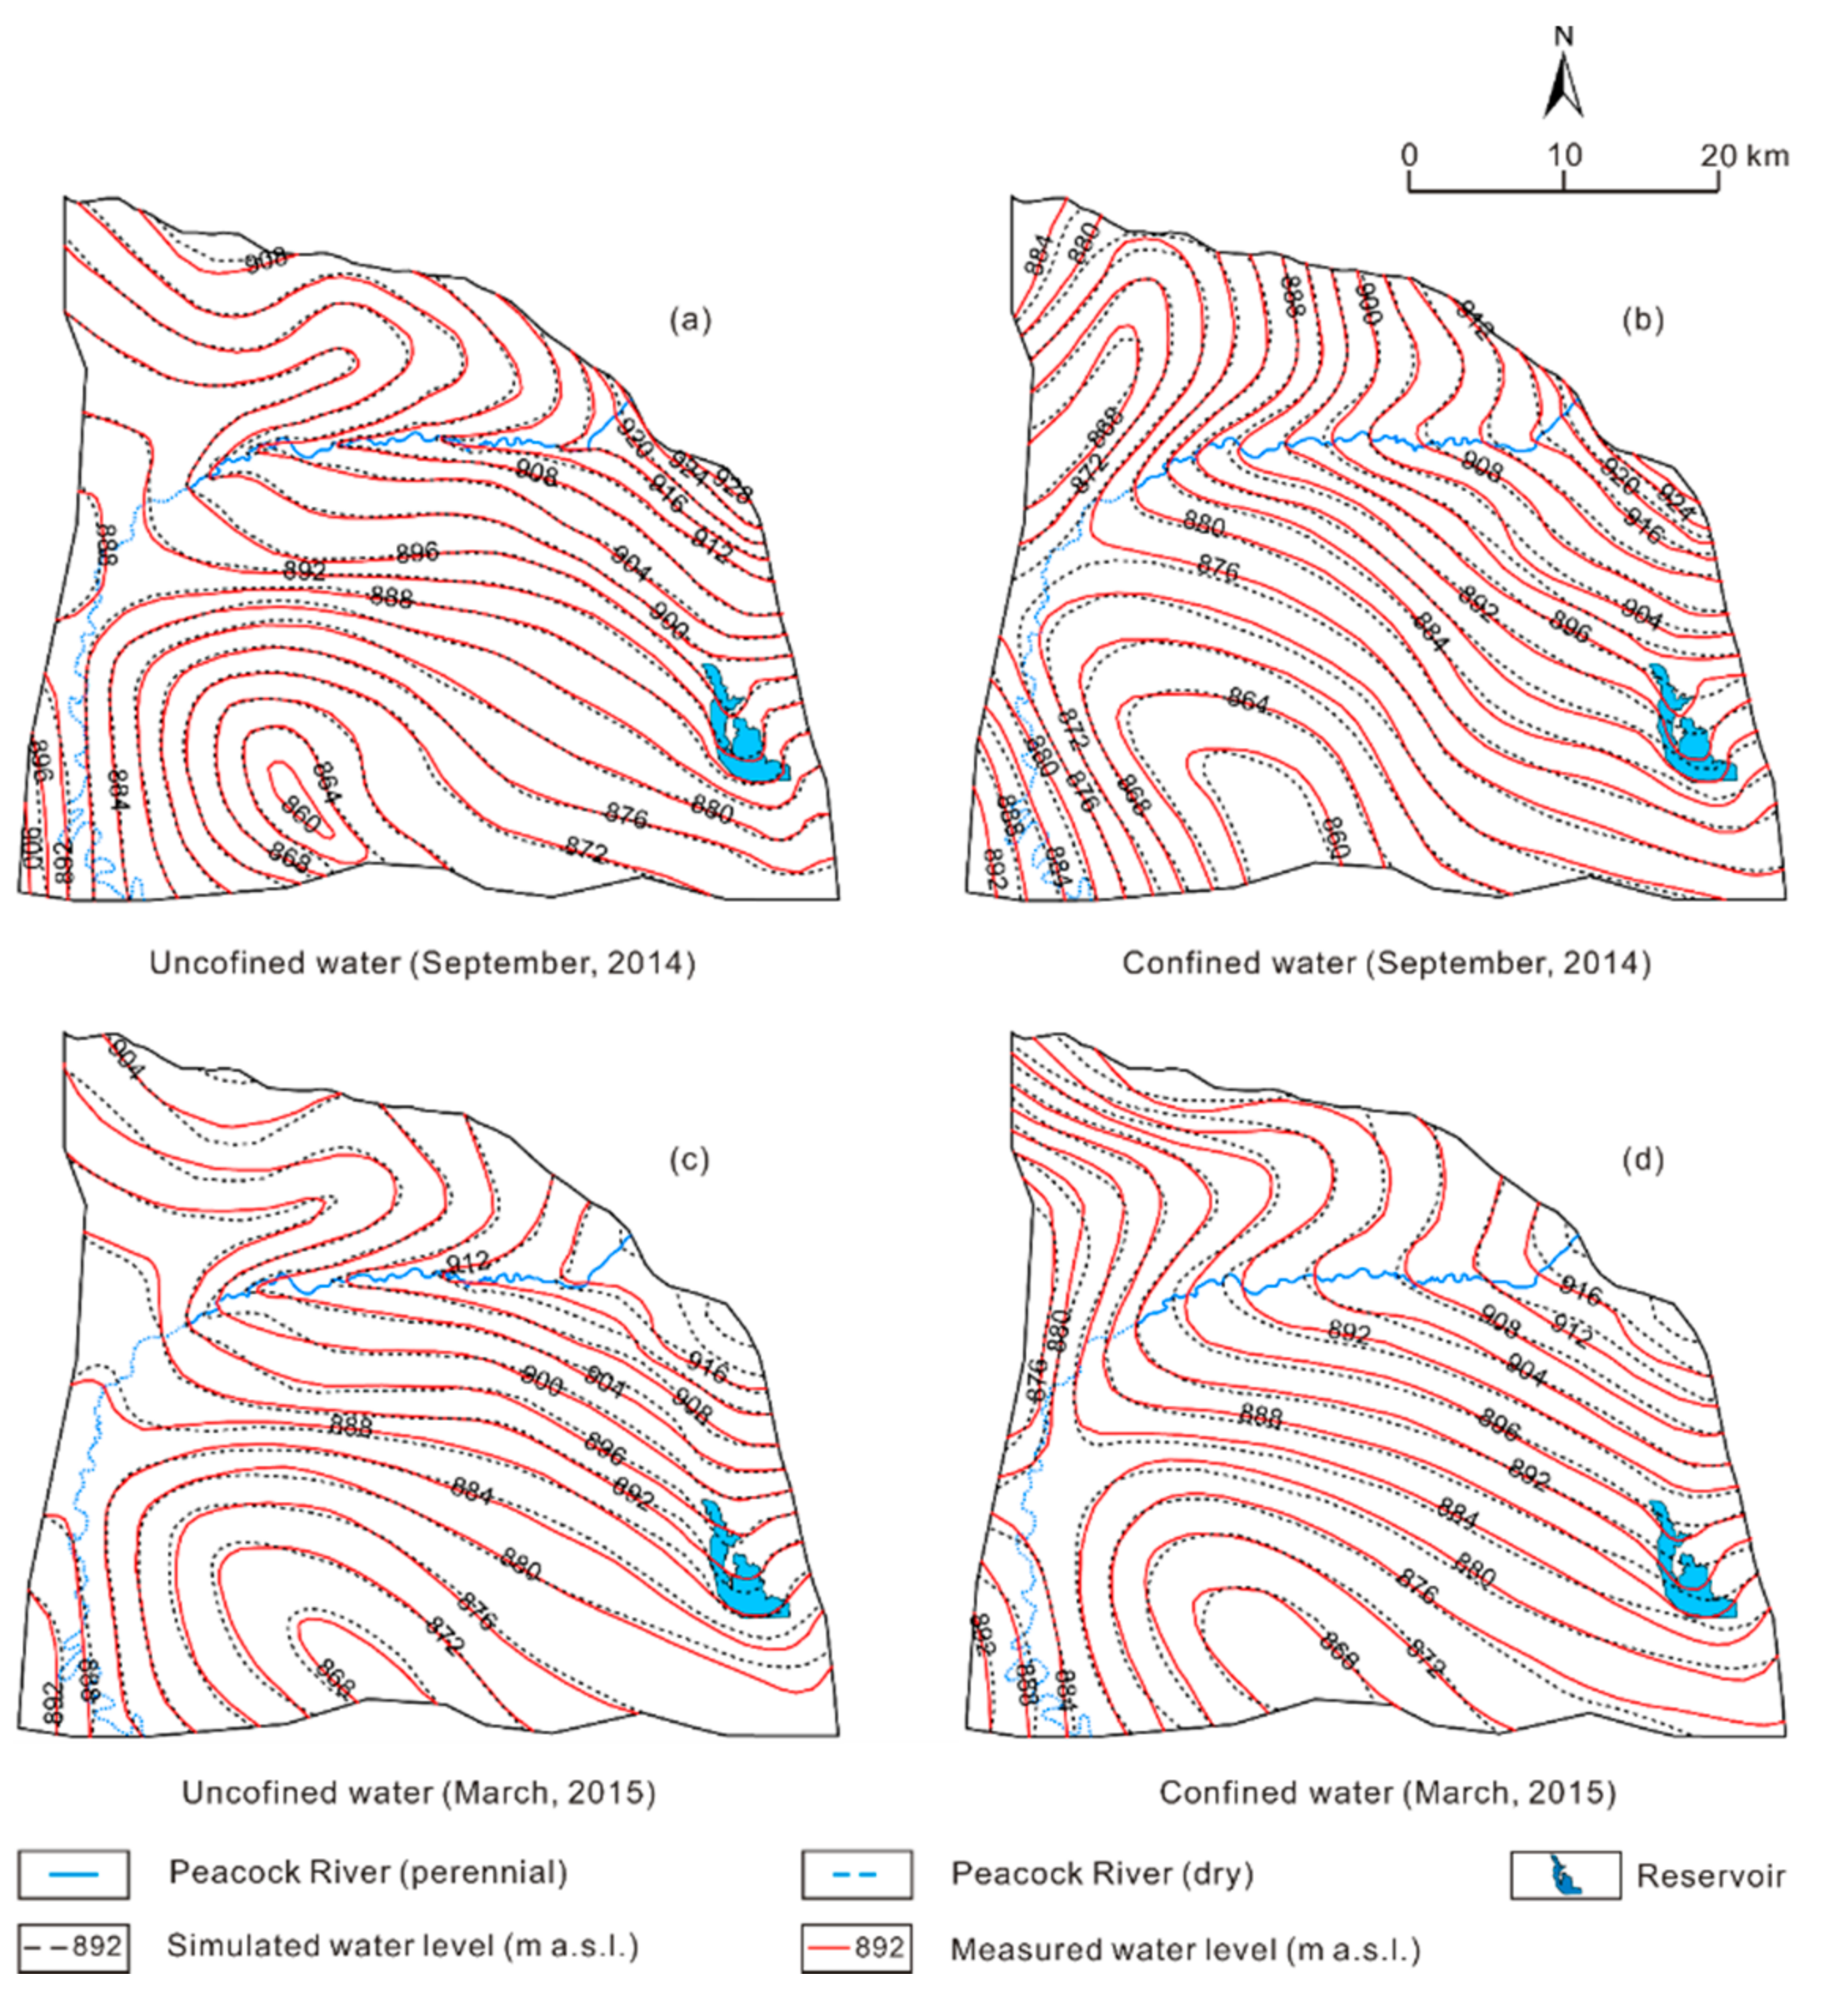
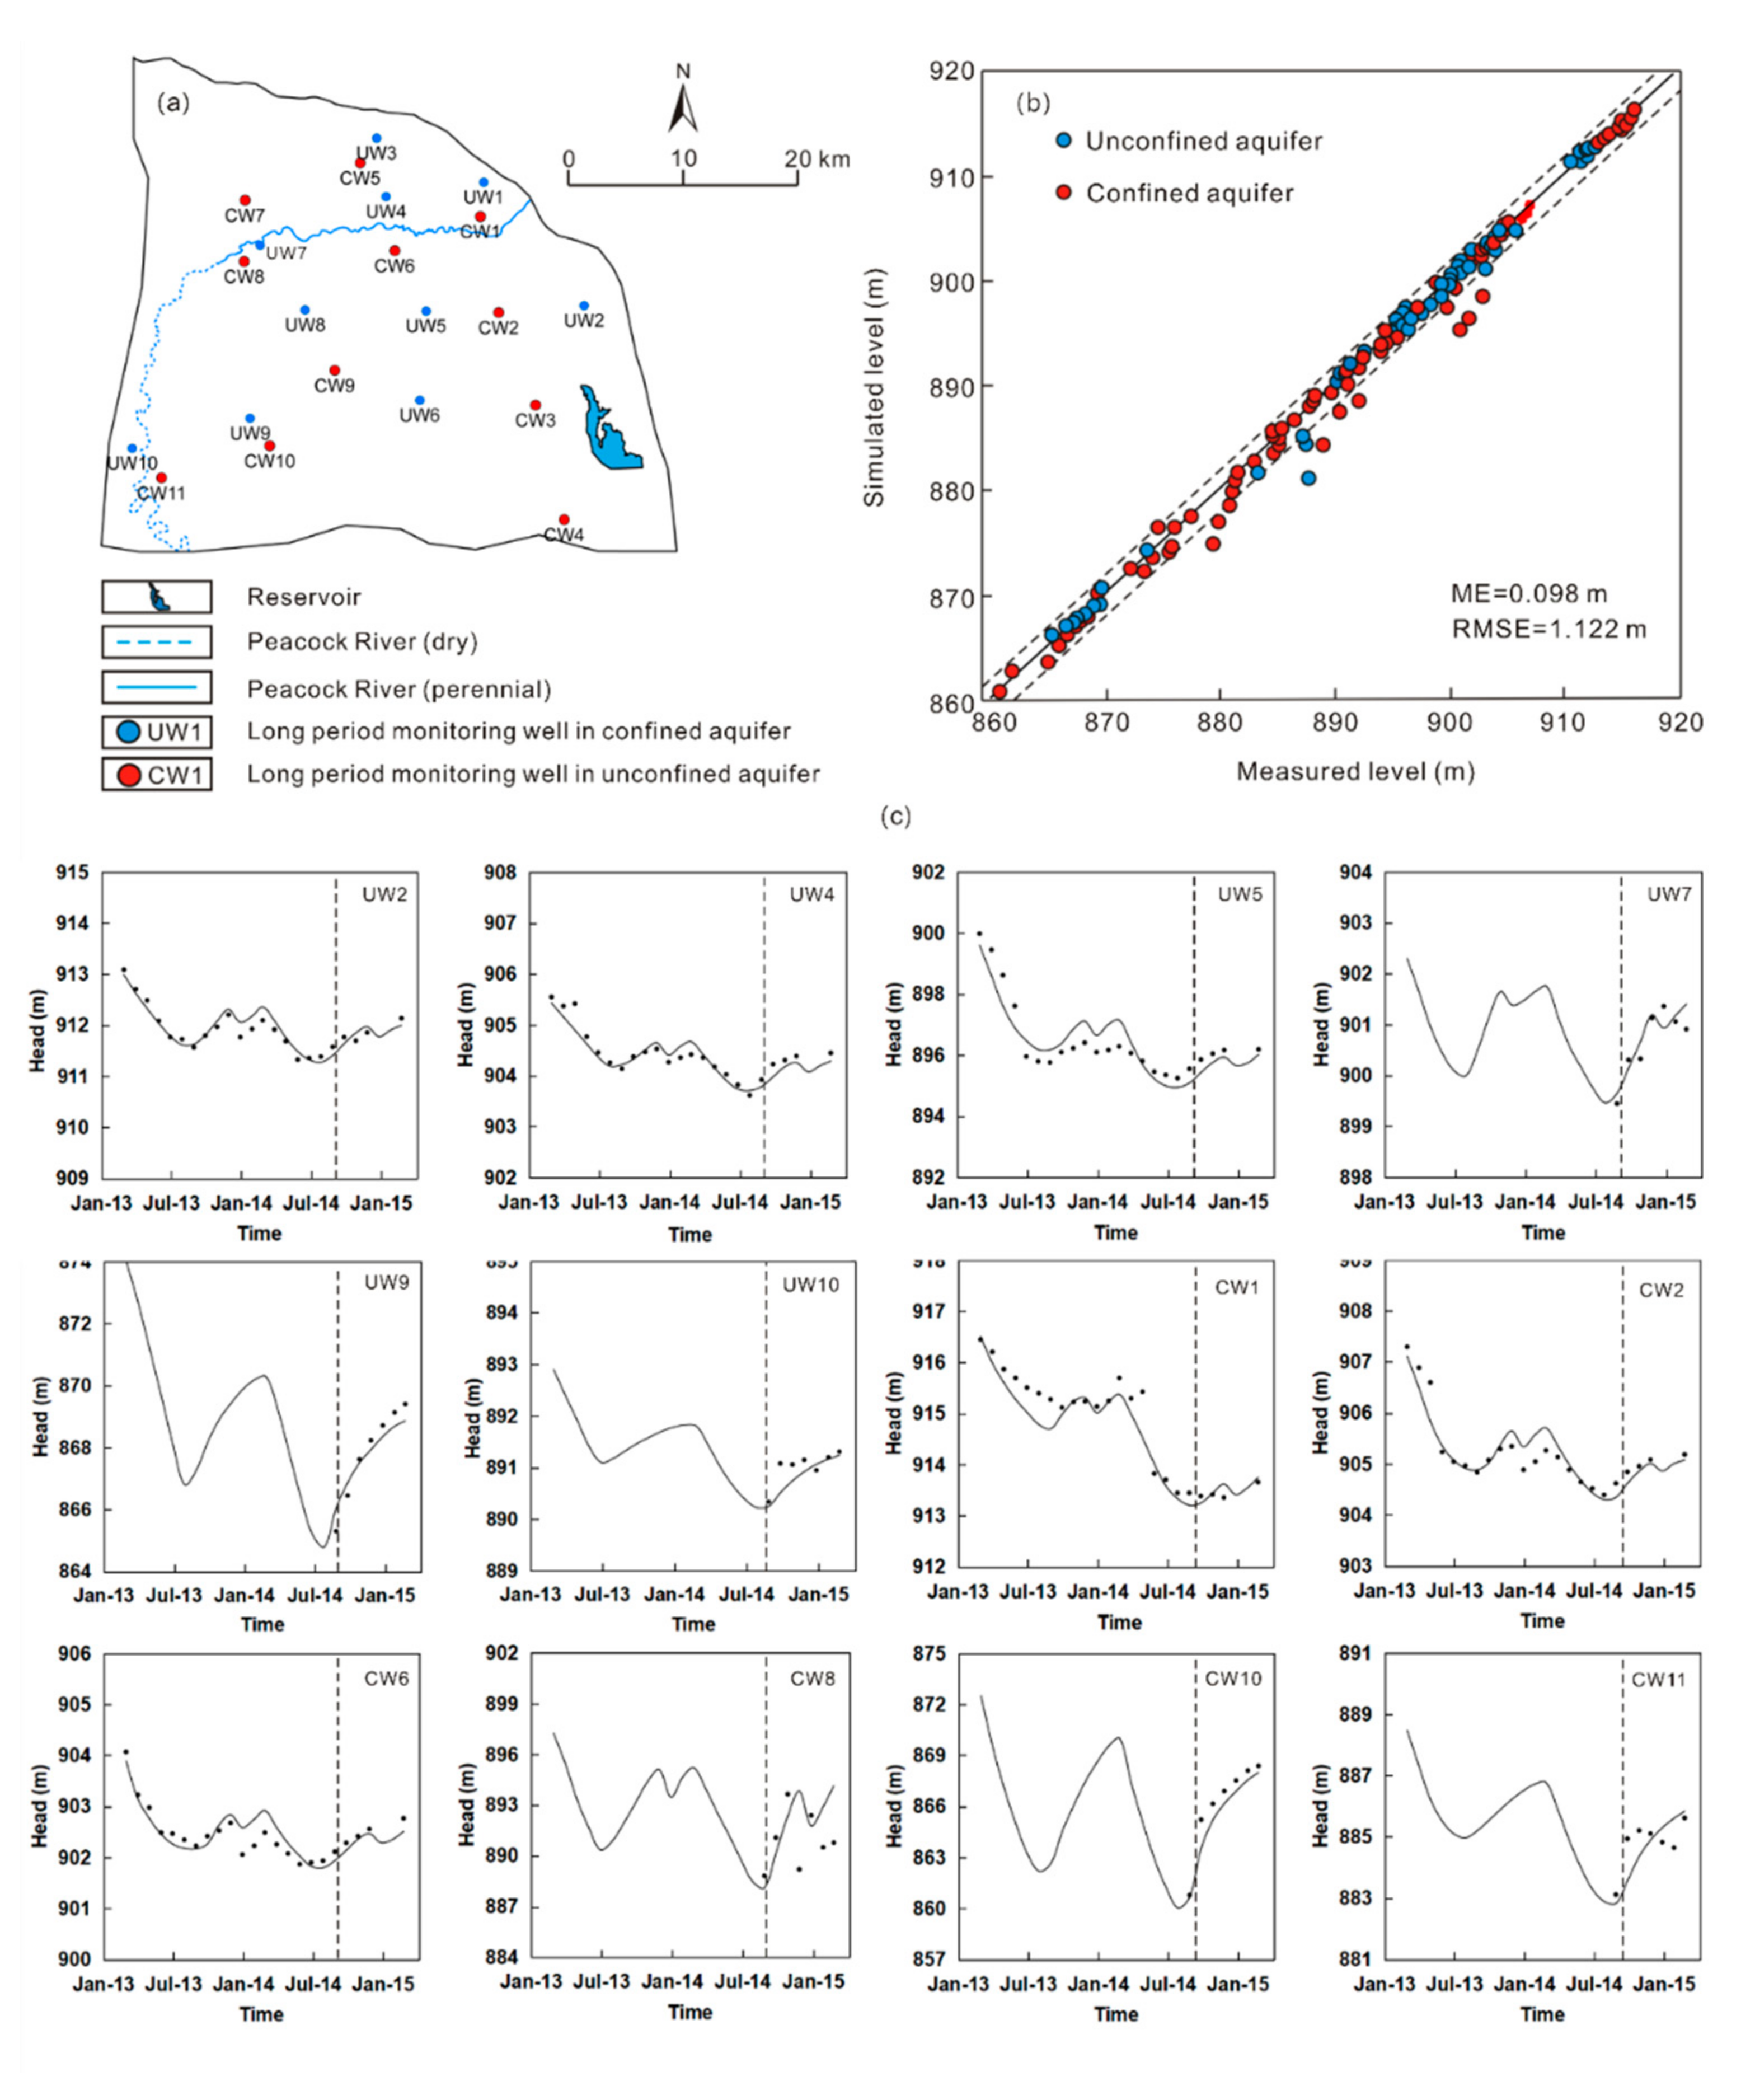
The transient model is calibrated through trial-and-error method, the time series of measured groundwater level from March 2013 to September 2014 (578 days) was used. The hydraulic conductivity, transmissivity, leakance, specific yield, and specific storage in each zone were calibrated to match the measured groundwater level contours in September 2014. During the calibration, the evapotranspiration extinction depth and the distributions of recharge rate and evaporation rate were calibrated to fit the seasonal variations in groundwater level in the monitoring wells. The simulated groundwater levels are generally consistent with the measured ones both on the regional scale at the end of the calibration period (Figure 4), and in 6 monitoring wells in the unconfined aquifer and 6 monitoring wells in the confined aquifer though the calibration period (Figure 4). The fluctuations of groundwater levels mainly controlled by pumping, irrigation, and river water leakage in the monitoring wells were also captured by simulation (Figure 4).
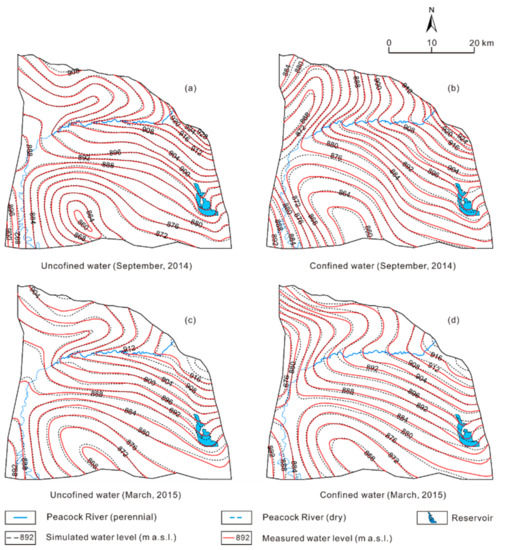
Figure 4.
Simulated and measured groundwater levels at the end of the calibration and validation period, respectively.
After the model was calibrated, the relationship of all measured and simulated groundwater levels are close to the 1:1 line (Figure 5b). The mean error (ME) between simulated and measured water levels is 0.098 m while the root mean square error (RMSE) is 1.122 m (Figure 5b). These errors are relatively small compared with the maximum groundwater level variations of ca. 30 m (Figure 5c). The 95% confidence interval is narrow and very close to the 1:1 line, which indicates a relatively small uncertainty of the model (Figure 5b).
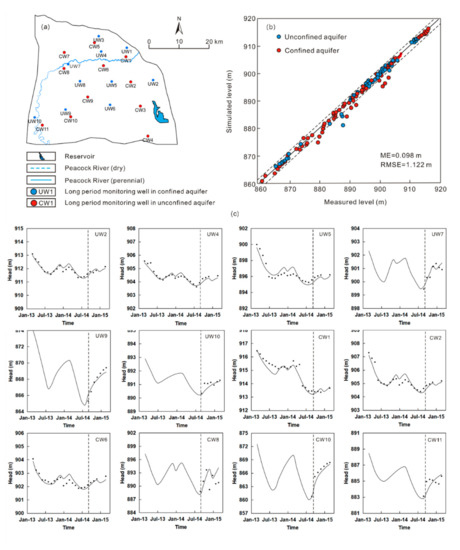
Figure 5.
Comparison of simulated and measured groundwater levels. (a) Distribution of monitoring wells, (b) comparison for 21 monitoring wells with 305 measures in total, (c) comparison for 12 monitoring wells.
The calibrated model was validated using monitoring data of groundwater levels from September 2014 to March 2015. During the validation period, the measured and predicted groundwater levels in all monitoring wells were compared (Figure 5c). The predicted groundwater levels were close to the measured ones for most of 181 the monitoring wells, especially for the wells which were located in the irrigation areas (e.g., UW9, UW5, CW6, and CW10). Although disparities between the predicted and the measured values were observed (e.g., UW7, UW10, CW7, and CW11), the errors are relatively small compared with the maximum groundwater level variations of ca. 13 and 33 m for the unconfined and confined aquifers, respectively. Therefore, this model was considered to be reasonable for predicting the groundwater flow filed and the effects of water management measures in the study area.
2.6. Sensitivity Analysis
Sensitivity reflects the impact of certain parameter uncertainty to other factors. Through sensitivity analysis, the key parameters of the groundwater flow model can be identified. During the sensitivity analysis, the value of one parameter is changed while the other parameters remained unchanged. Here, calibrated values for K and Kv are systematically changed within appropriate ranges of 25% [40].
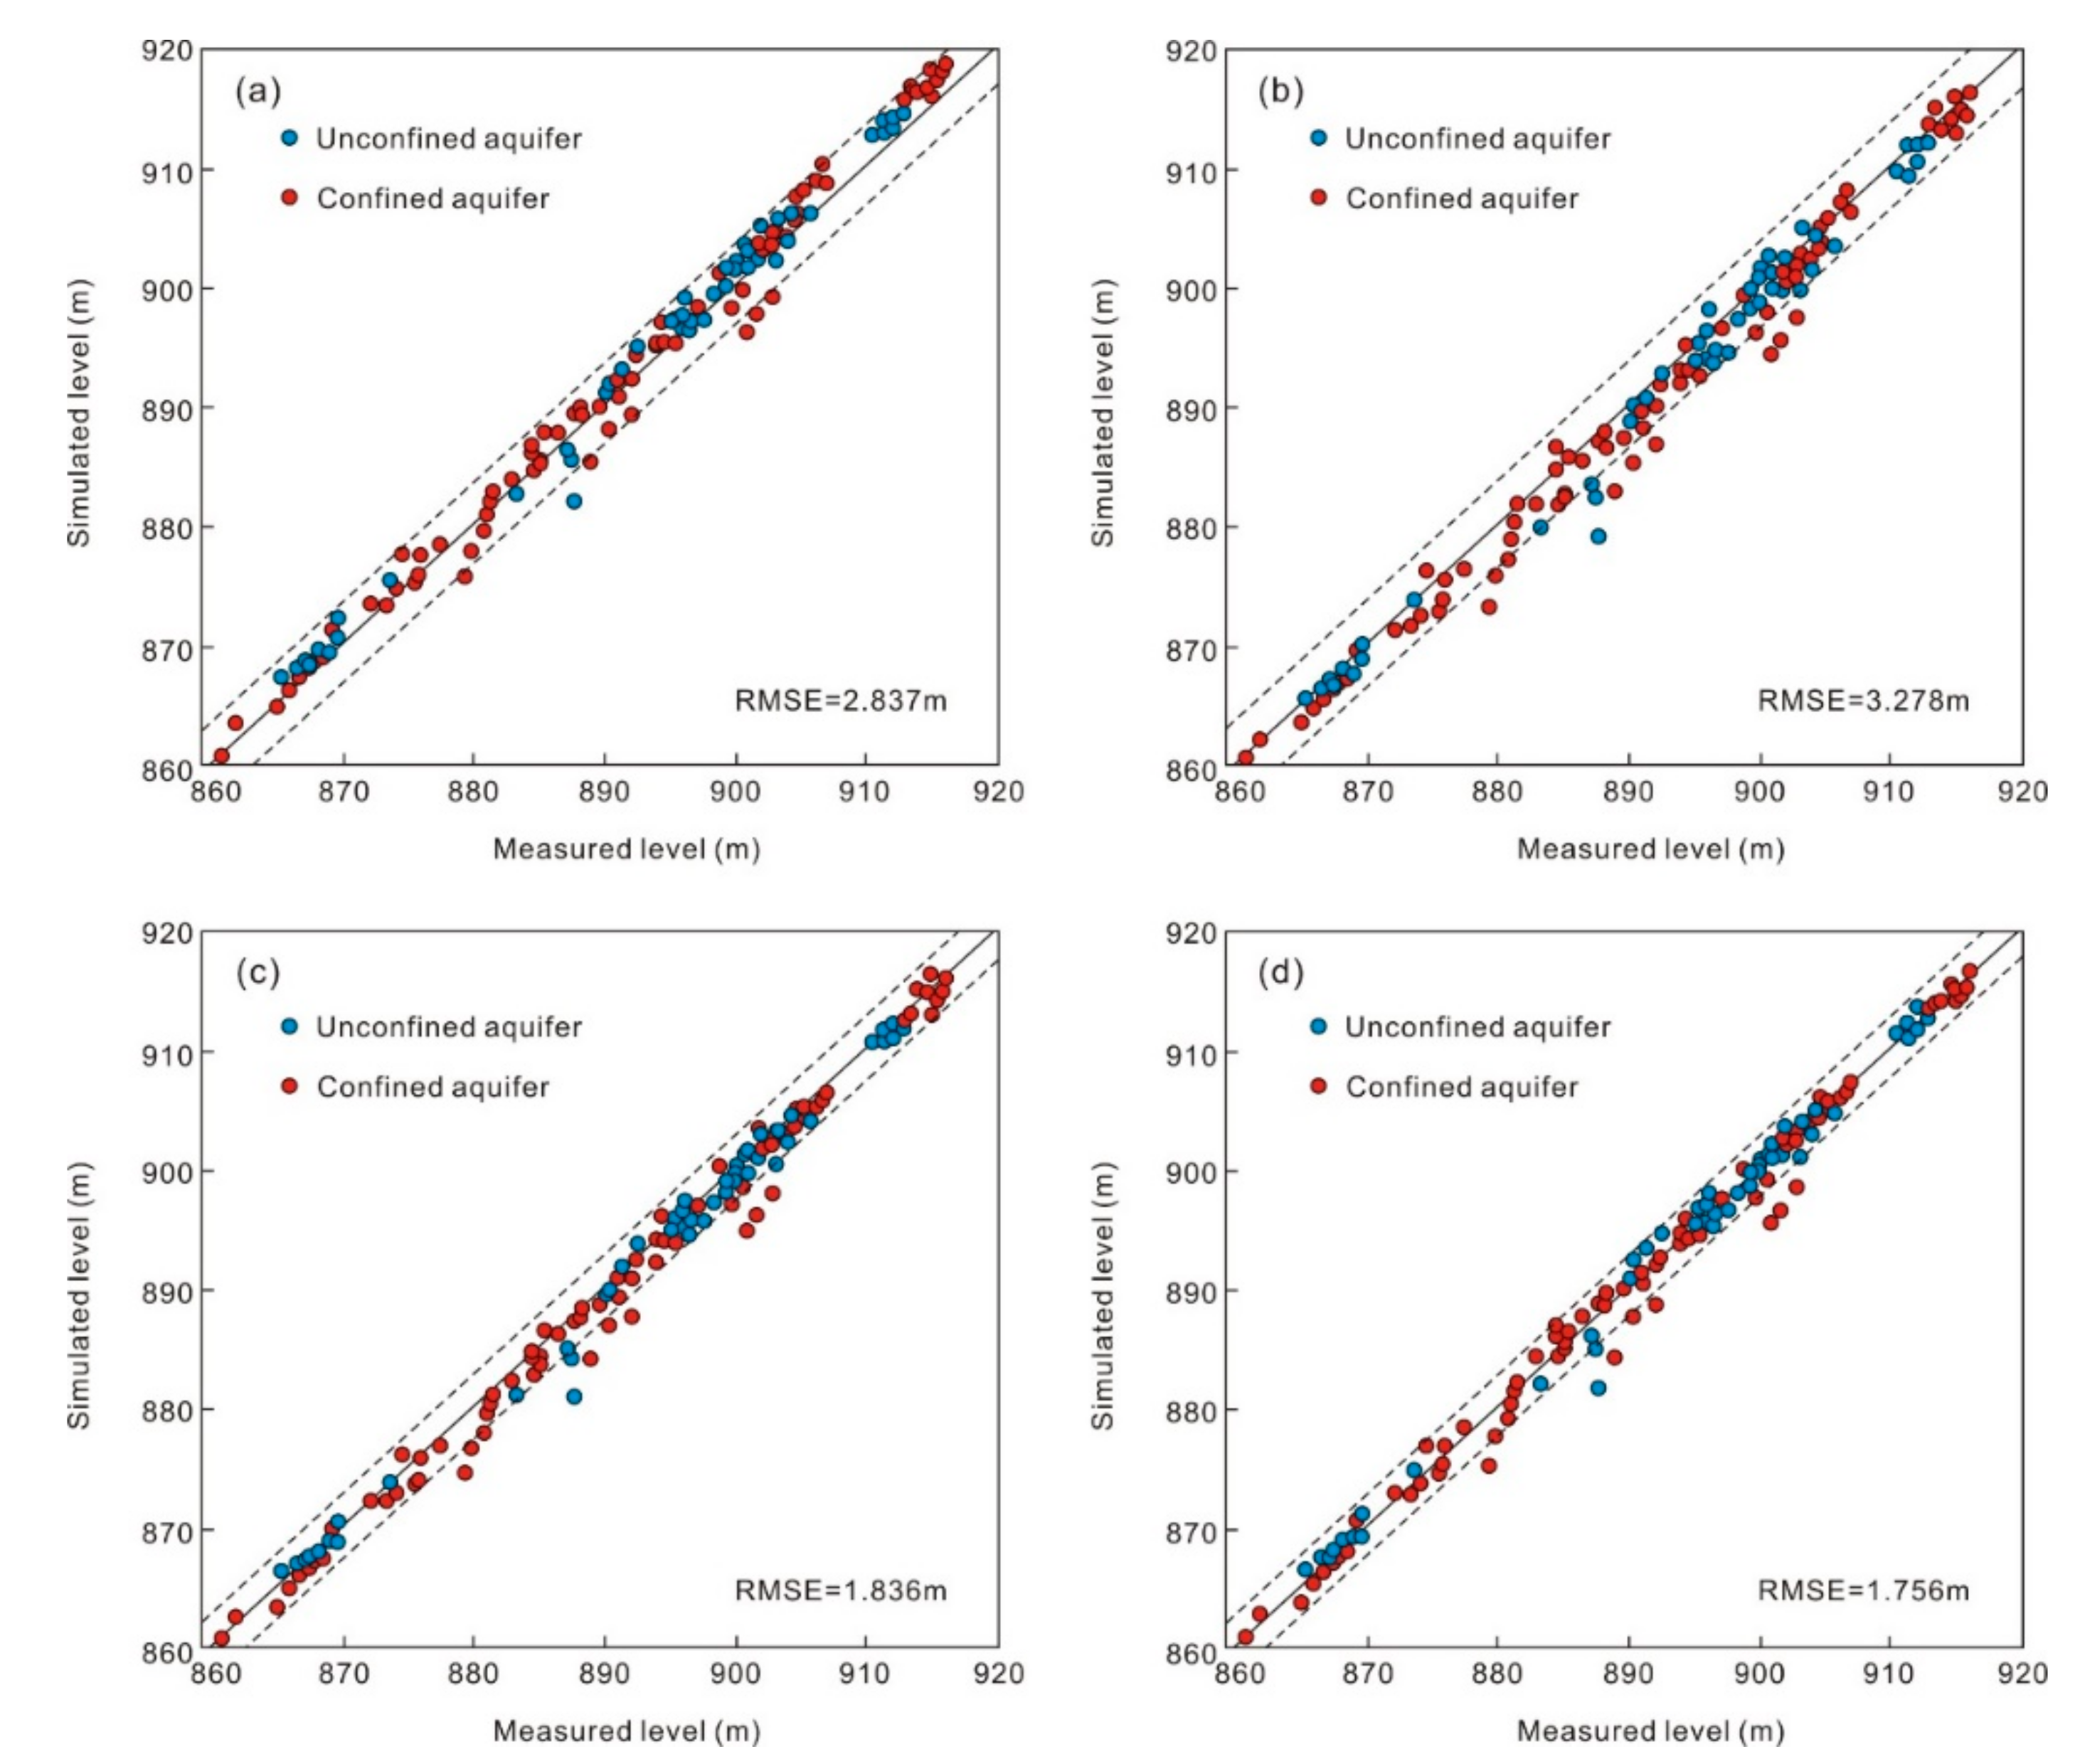
During the first step of sensitivity analysis, K were decreased and increased by 25%, which increased the RMSE to 2.837 m and 3.278 m, respectively (Figure 6a,b). In the steady-state calibration, the RMSE between simulated and observed groundwater levels is 1.122 m (Figure 5b). It can be observed that in many monitoring wells, the simulated levels with 25% uncertainty in K are not having good match with the original simulated levels. In the downstream area, where K is lower due to distribution of finer sediments, the RMSE is even bigger. During the second step of sensitivity analysis, Kv decreased and increased by 25%, which increased the RMSE to 1.836 m and 1.756 m, respectively (Figure 6c,d), which are again bigger than that of the original simulated levels. In the nearby area along the Peacock River, the groundwater recharge from river leakage changes significantly as a result of changes in Kv, and the groundwater level changes are more responsive, while in the upstream area and the depression cones of groundwater, the impact of changes in river leakage on groundwater level, is less responsive, thus the RMSE is bigger in the monitoring wells near the river. On the whole, the RMSE obtained during the sensitivity analysis of Kv are less than that of K. Hence, Kv is less sensitive than K in the study area.
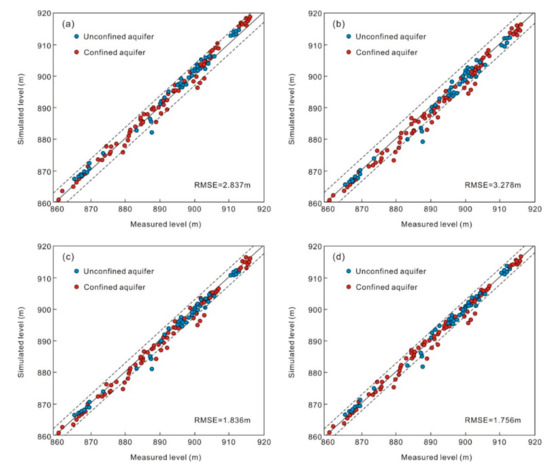
Figure 6.
Comparison between computed and observed hydraulic heads (in a.m.s.l.) during the validation for September 2014 to March 2015. (a) 25% decrease and (b) 25% increase in K for both unconfined and confined aquifers, respectively, (c) 25% decrease and (d) 25% increase in Kv, respectively.
2.7. Groundwater Management Schemes under Various Constraints
The water budget of the study area in 2015 was calculated by the groundwater flow model combined with water balance method (Table 2). The regional groundwater recharge includes eight components. The recharge from irrigation infiltration (ca. 35.5% of the total recharge), river leakage (ca. 35.6%), and canal infiltration (ca. 15.7%) are most important, while the other recharges are relatively small and negligible. The groundwater discharge was dominated by artificial exploitation (ca. 89.0% of the total discharge), while the contributions from evaporation and lateral outflow through the southern and western boundaries accounts for only 11.0% of the total discharge. Overall, the total groundwater discharge exceeds the recharge, leading to a net deficit of −212,603.5 × 103 m3/am, indicating the groundwater levels would decline continuously with no countermeasures taken.

Table 2.
Water budget in 2015 calculated by groundwater flow model and water balance method for the study area.
To predict the declining tendency of the groundwater levels in the future and evaluate management schemes under various constraints based on numerical simulation, three scenarios were considered, which are (A) assuming groundwater withdrawal remains unchanged as current conditions, (B) reducing groundwater exploitation to restore the groundwater levels on the regional scale, and (C) reducing groundwater exploitation to meet the ecological water level constraint of the Euphrates Poplar forest in the southwest part of the study area. All simulations were run for 7 years from 2015, i.e., from March 2015 to March 2022 (2557 days).
3. Results and Discussion
3.1. Scenario A: Current Conditions
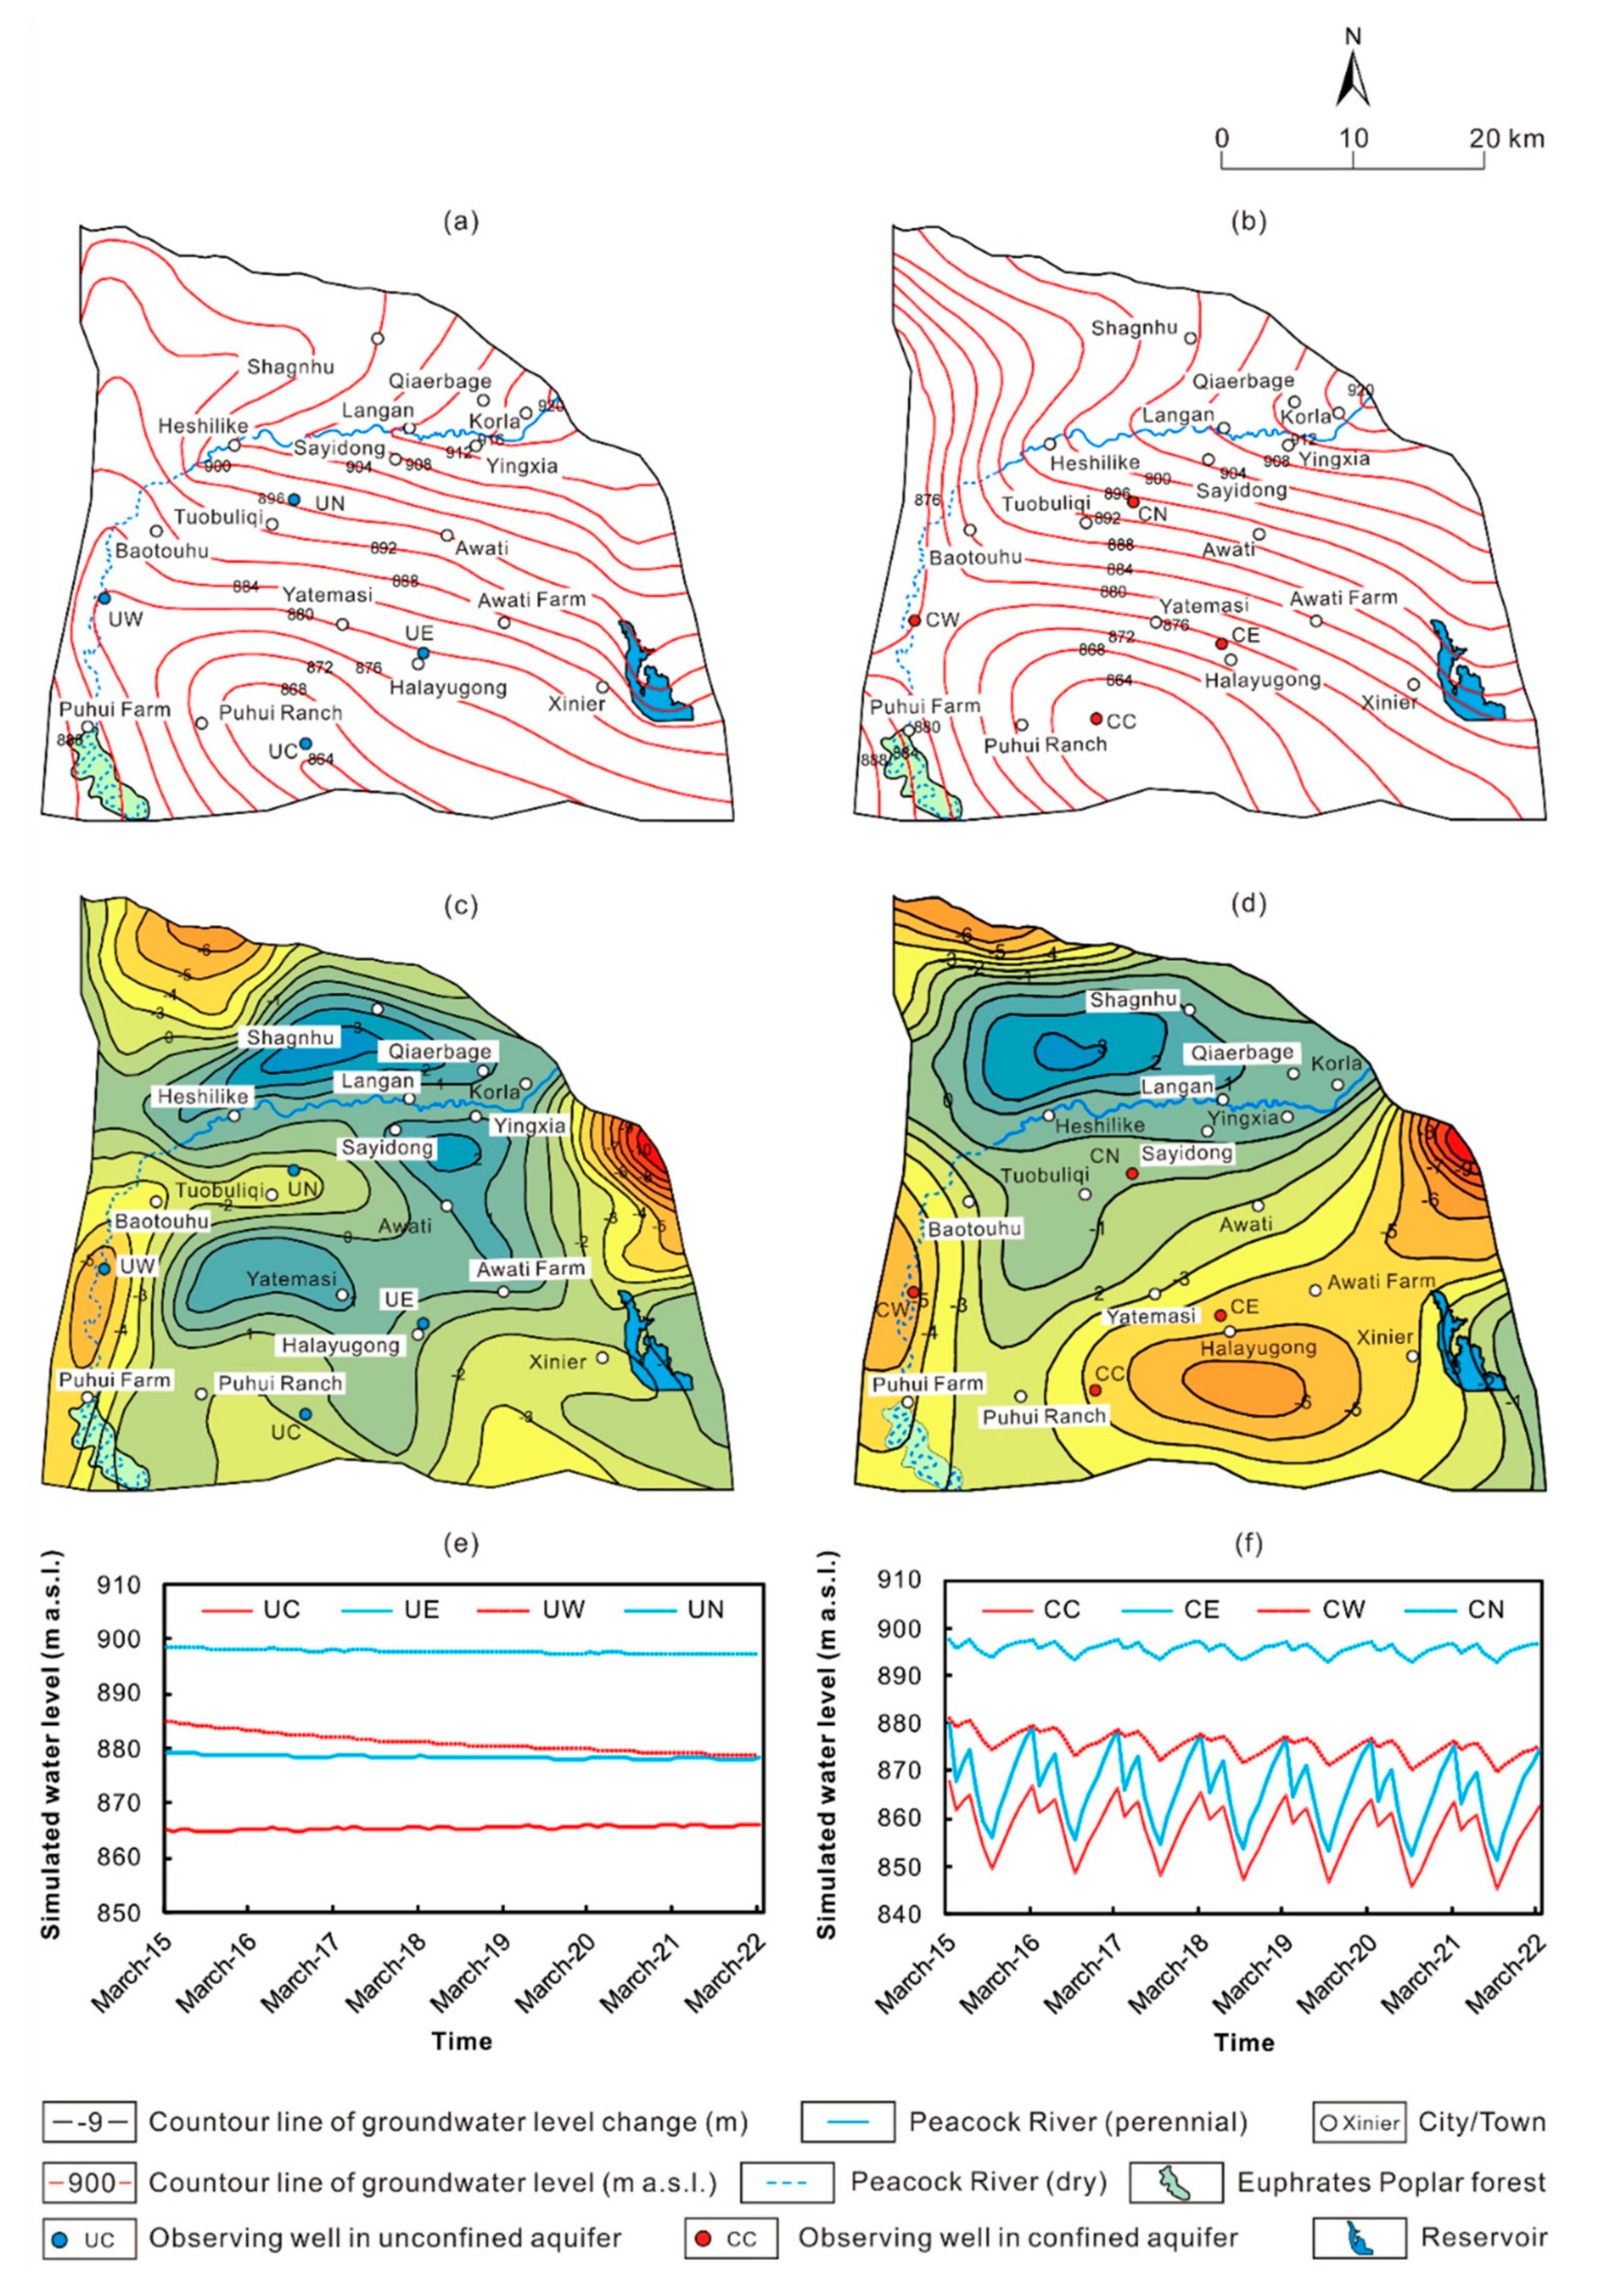
Since March is the first month of the pumping period, with the highest groundwater level of the year, the contour map of groundwater level measured at the end of March 2015 was employed to present the initial groundwater flow field and to be compared with the flow field at March 2022. The simulation results show that the groundwater flow filed can be divided into two parts, which are located to the north and to the south of the Peacock River, respectively (Figure 7a,b). The levels of both the unconfined and confined water would decline continuously, although the changing range varies in different parts of the study area, which are indicated by the observing wells set at the east (UE, CE for unconfined and confined water, respectively), west (UW, CW for unconfined and confined water, respectively), north (UN, CN for unconfined and confined water, respectively) edges and center (UC, CC for unconfined and confined water, respectively) of the depression cones of groundwater (Figure 7e,f). In the area where significant leakage of the Peacock River between the first to the third water diversion stations occurs, and where river water, rather than groundwater, is used for irrigation, the level of the unconfined water within 2–4 km from the Peacock River fluctuates slightly, i.e., ±0.5 m/a with a total decrease of 0–1 m in 7 years (Figure 7c). Between the Peacock River and the Houla Mts., the groundwater receives recharge of stormwater from the Houla Mts. and leakage from the Peacock River. However, as groundwater is intensively exploited for irrigation in the piedmont plain, groundwater flows from the Peacock River to the piedmont. As overexploitation of the groundwater continues, the unconfined water level would decline at a rate of ca. 1.2–1.6 m/a (Figure 7c). To the south of the Peacock River, depression cones of groundwater, both in the unconfined and confined aquifers, have formed as a result for yearly exploitation of the groundwater. In order to characterize the changing rate of the depression cones, the 876 m contour line of groundwater level was assumed to be the boundary of the depression cone of the unconfined and confined water. Thus, the center of the depression cone of the unconfined water is located in the area from Tuobuliqi to Puhui Ranch (Figure 7a). Results show that the unconfined water level there would decline at 0.6–0.8 m/a (Figure 7d,e). In Baotouhu and Puhui Farm, located on the west edge of the depression cone, the unconfined water level would decline faster, about 0.9–1.4 m/a (Figure 7d,e), because that the unconfined water there no longer receive recharge from the river as the Peacock River dries up downstream of the Third Water Diversion Station since 2014 and moreover, the unconfined water recharges the confined aquifer though leakage. In Awati, located on the east edge of the depression cone, as irrigation water is partly provided by the Kuta and Halayugong Canals, the unconfined water declines slower, about 0.7–1.0 m/a (Figure 7d,e). As a result, the area of the depression cone of the unconfined water would increase at 26.2 km2/a and reach up to 445.4 km2 (27.8% of the study area) from 261.9 km2 (16.4% of the study area) in 7 years. The center of the depression cone of the confined water is located in the area from Tuobuliqi to the west of Halayugong (Figure 7b), and the water level there drops at 1.9–2.8 m/a (Figure 7d–f). In Baotouhu and Puhui Farm, located on the west edge of the depression cone, the water level drops slower due to recharge from the unconfined water, at a rate ranging from 0.8–1.2 m/a (Figure 7d–f). In contrast, in Awati and Halayugong on the east edge of the depression cone, the water level drops faster, i.e., at 1.3–2.1 m/a, owing to intensively exploitation and a low permeability of the aquitard and thus less leakage from the unconfined water (Figure 7d–f). As a result, the water level of the unconfined and confined aquifer would decline by 0–9 and 0–20 m, respectively (Figure 7c,d). Meanwhile, the depression cone of the confined water would enlarge in a rate of 35.62 km2/a and achieve 554.1 km2 (34.6% of the study area) in March 2022 compared to 304.91 km2 (19.0% of the study area) in March 2015.
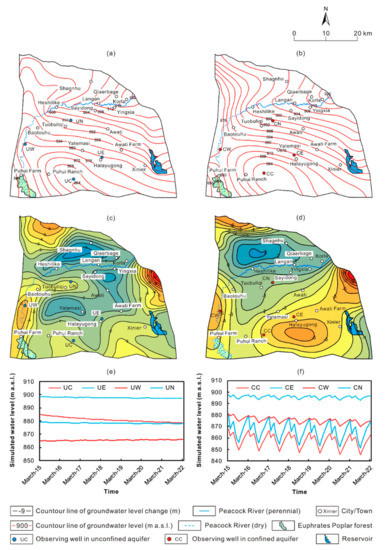
Figure 7.
Predicted (a) unconfined and (b) confined water levels in March 2022, changes of (c) unconfined and (d) confined water levels between March 2022 and March 2015, and changes in (e) unconfined and (f) confined water levels in 8 monitoring wells under scenario A.
3.2. Scenario B: Reducing Groundwater Exploitation
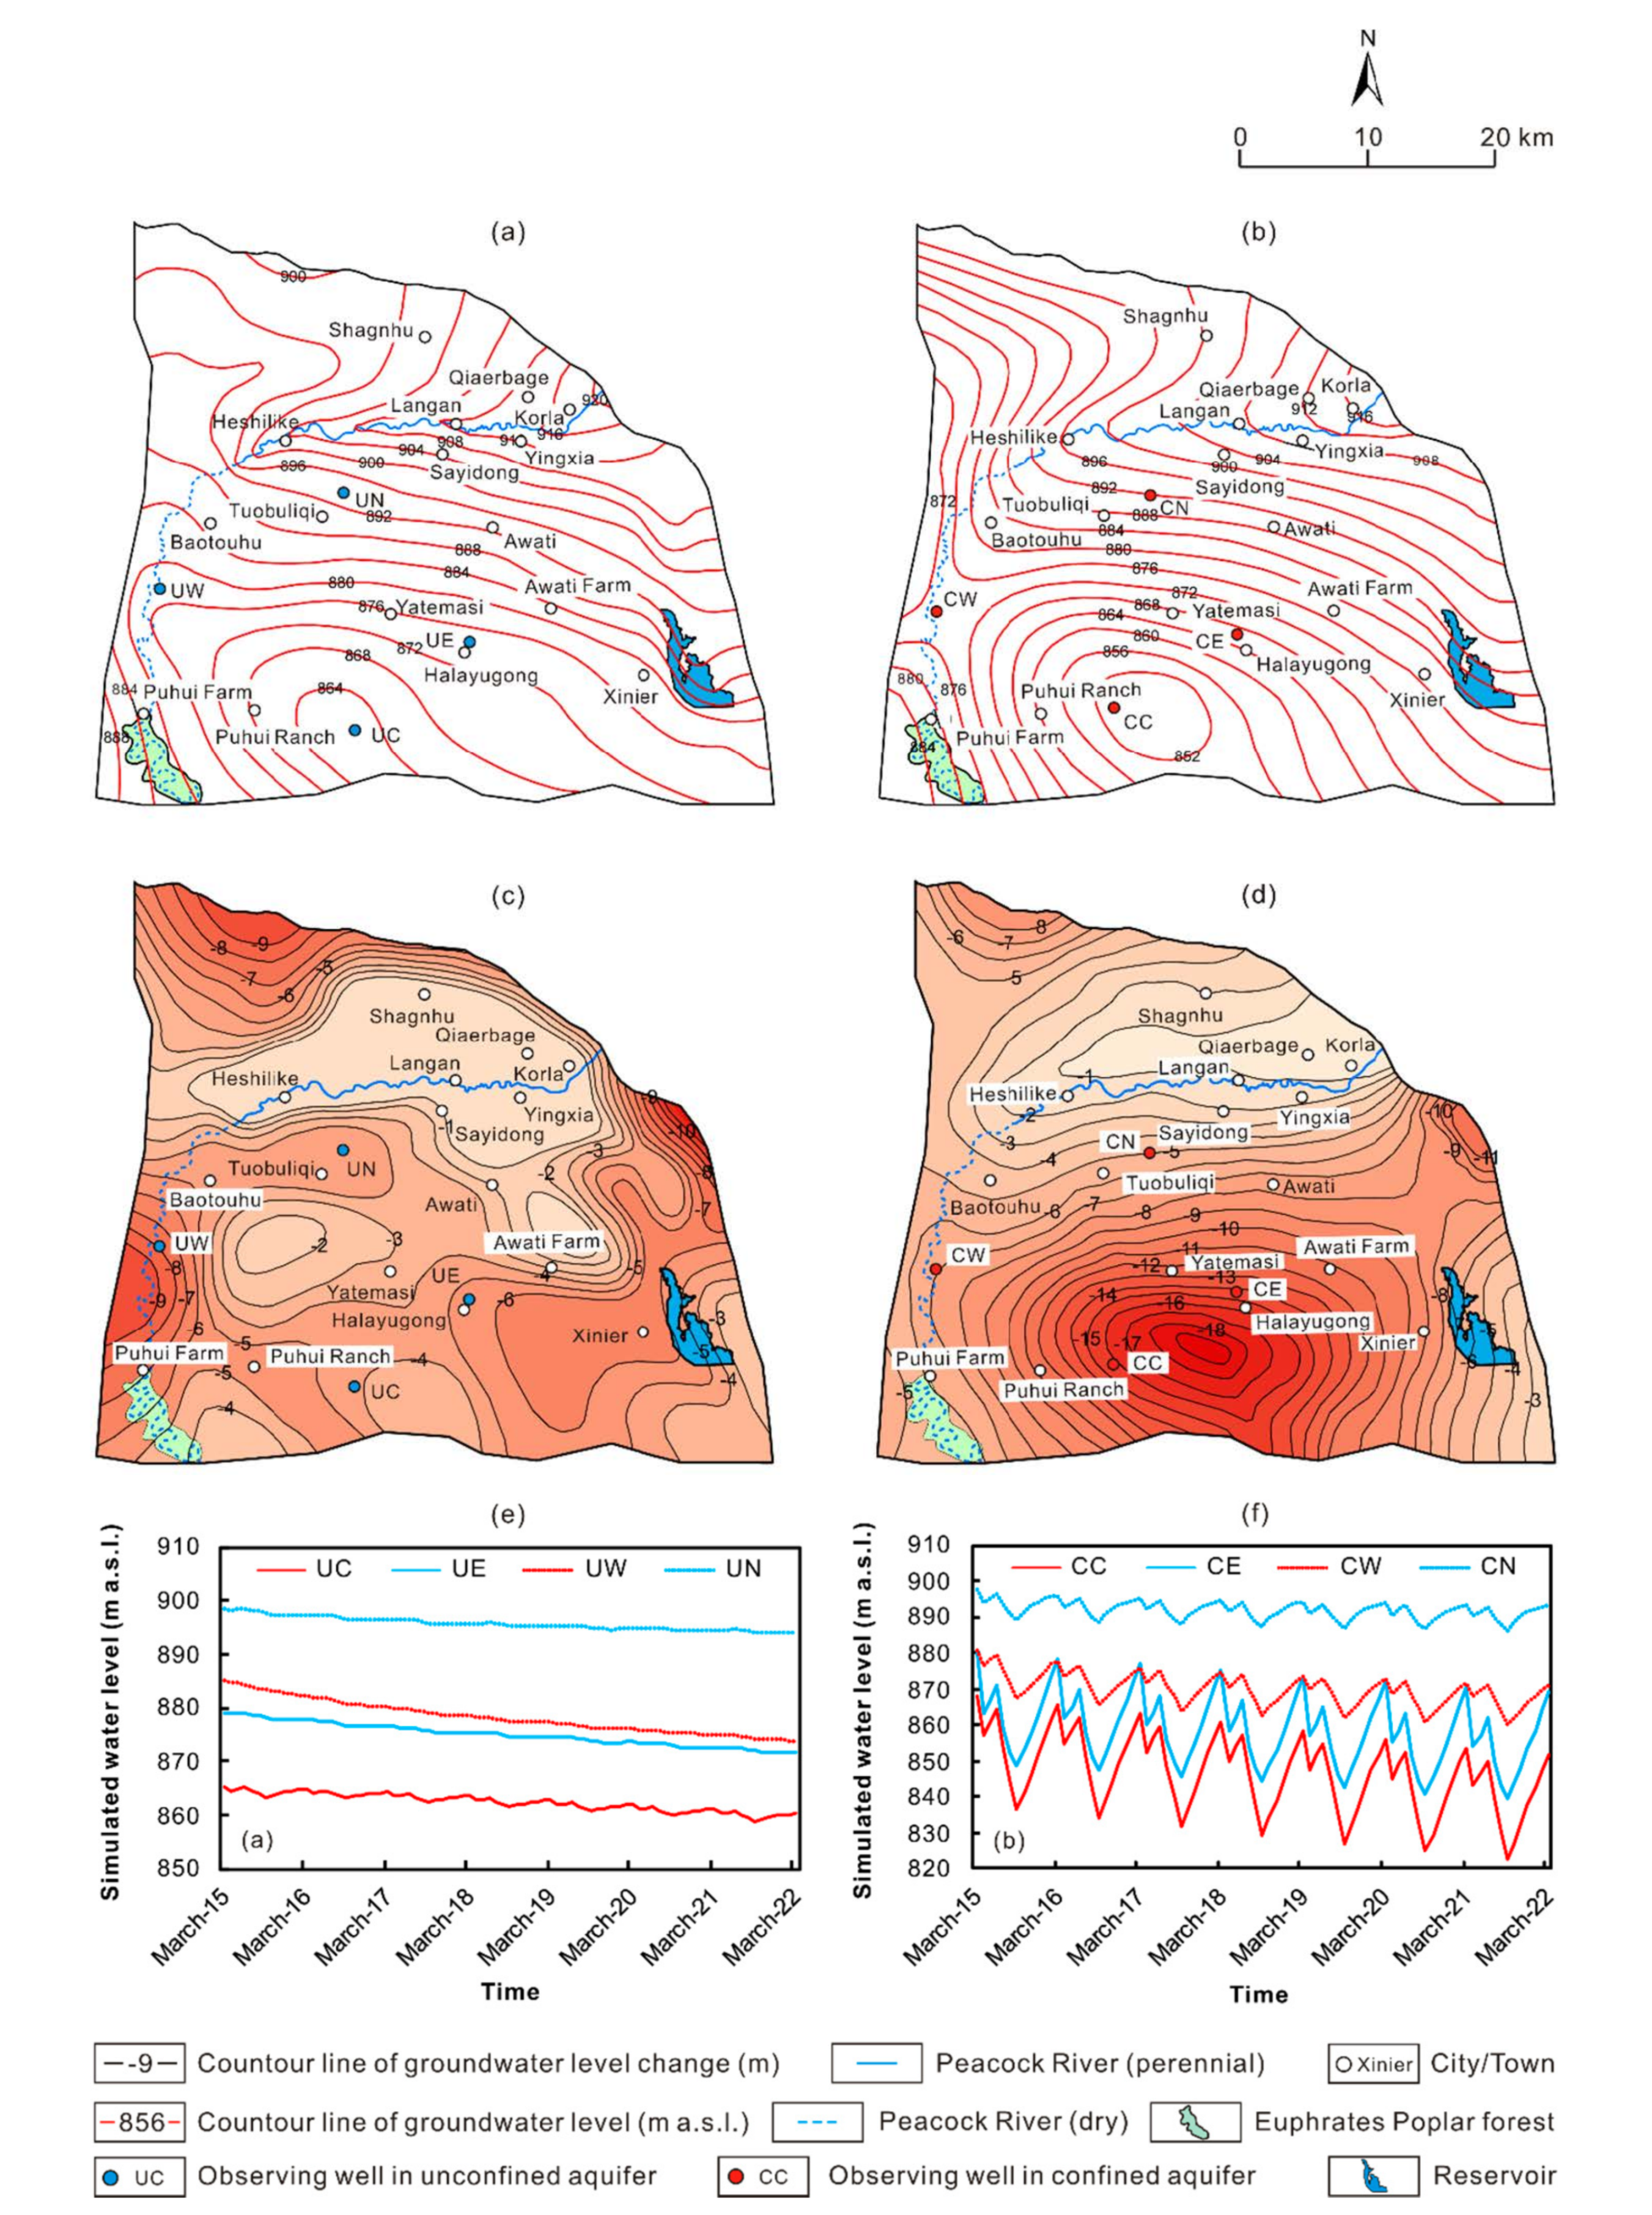
As the amount of surface water resources that can be used for irrigation will not increase in the near future, the only way to prevent the decline of the water level is to reduce the groundwater withdrawal. Therefore, the change of water levels from March 2015 to March 2022 were simulated for 7 scenarios, i.e., with groundwater withdrawal of 0, 15%, 25%, 35%, 45%, 55%, and 65% being cut down with respect to that in 2015 to determine the optimal withdrawal under the constraint that the water level would not decline in 7 years. Since the shape of the cone of depression of groundwater change constantly, it is regarded that the water level no longer declines if it does not decline anymore at the center of the cone in the simulation. The results show that the unconfined water level at the center of the cones almost approaches a steady state when groundwater withdrawal compressed by 45%, but it is lower than the initial level (Figure 8). The water level at the center of the cone stays steady with small annual fluctuation of ca. −0.3–0.7 m (Figure 8e). On the north and east edges of the cone, recharge and discharge of the unconfined water are nearly the same and thus the water level almost remains unchanged, with ]0an annual fluctuation of −0.2–0.2 m/a (Figure 8e). In contrast, on the west edge of the cone, the water level declines significantly, with a rate of 0.7–1.0 m/a (Figure 8e), owing to groundwater flowing to the center of the cone and leakage to the confined aquifer. As a result, the depression cone of the unconfined water would enlarge slightly at a rate of 5.3 km2/a and achieve 299.3 km2 in March 2022 compared to 261.9 km2 in March 2015. The water level of the confined water shows regional continuous decline. At the center of the cone, the water level declines with a rate of 0.2–0.6 m/a (Figure 8f), while on the north edge of the cone the decline rate is much lower, i.e., 0.03–0.28 m/a due to leakage of the Peacock River (Figure 8f). On the west edge of the cone, the decline rate is 0.4–0.8 m/a, as a result of recharge from the leakage of the unconfined water and discharge to the center of the cone. Since the low permeability of aquitard on the east edge of the cone, leakage from the unconfined water is limited, and the confined water level there declines most fast, with a decline rate of 0.5–1.0 m/a (Figure 8f). As a result, the depression cone of the confined water would enlarge slowly at a rate of 6.8 km2/a and achieve 352.41 km2 in March 2022 compared to 304.9 km2 in March 2015. Under the scenario of groundwater withdrawal compressed by 55%, both the unconfined and confined waters would recover to the initial water level, and the area of the cones of depression of groundwater would decrease gradually, i.e., the area of the cone in the unconfined water would reduce at a rate of 1.1 km2/a, while the rate is 3.4 km2/a for the confined water.
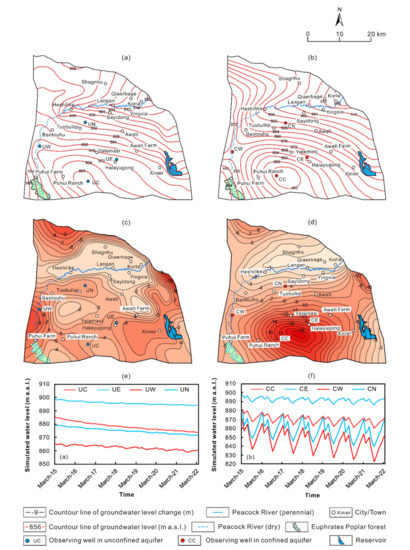
Figure 8.
Predicted (a) unconfined and (b) confined water levels in March 2022, changes of (c) unconfined and (d) confined water levels between March 2022 and 295 March 2015, and changes in (e) unconfined and (f) confined water levels in 8 monitoring wells under scenario B.
The local government has initialed a 15-year act on remediation of groundwater overexploitation in 2016, which named “Remediation scheme of groundwater overexploitation area in Korla City (2016–2030)”, it proposed 55% groundwater withdrawal compression till 2020 [41]. According to groundwater level monitoring, the decline rate of groundwater level in most monitoring wells has fallen within 1.0 m/a [42], which is consistent with the prediction of Scenario B.
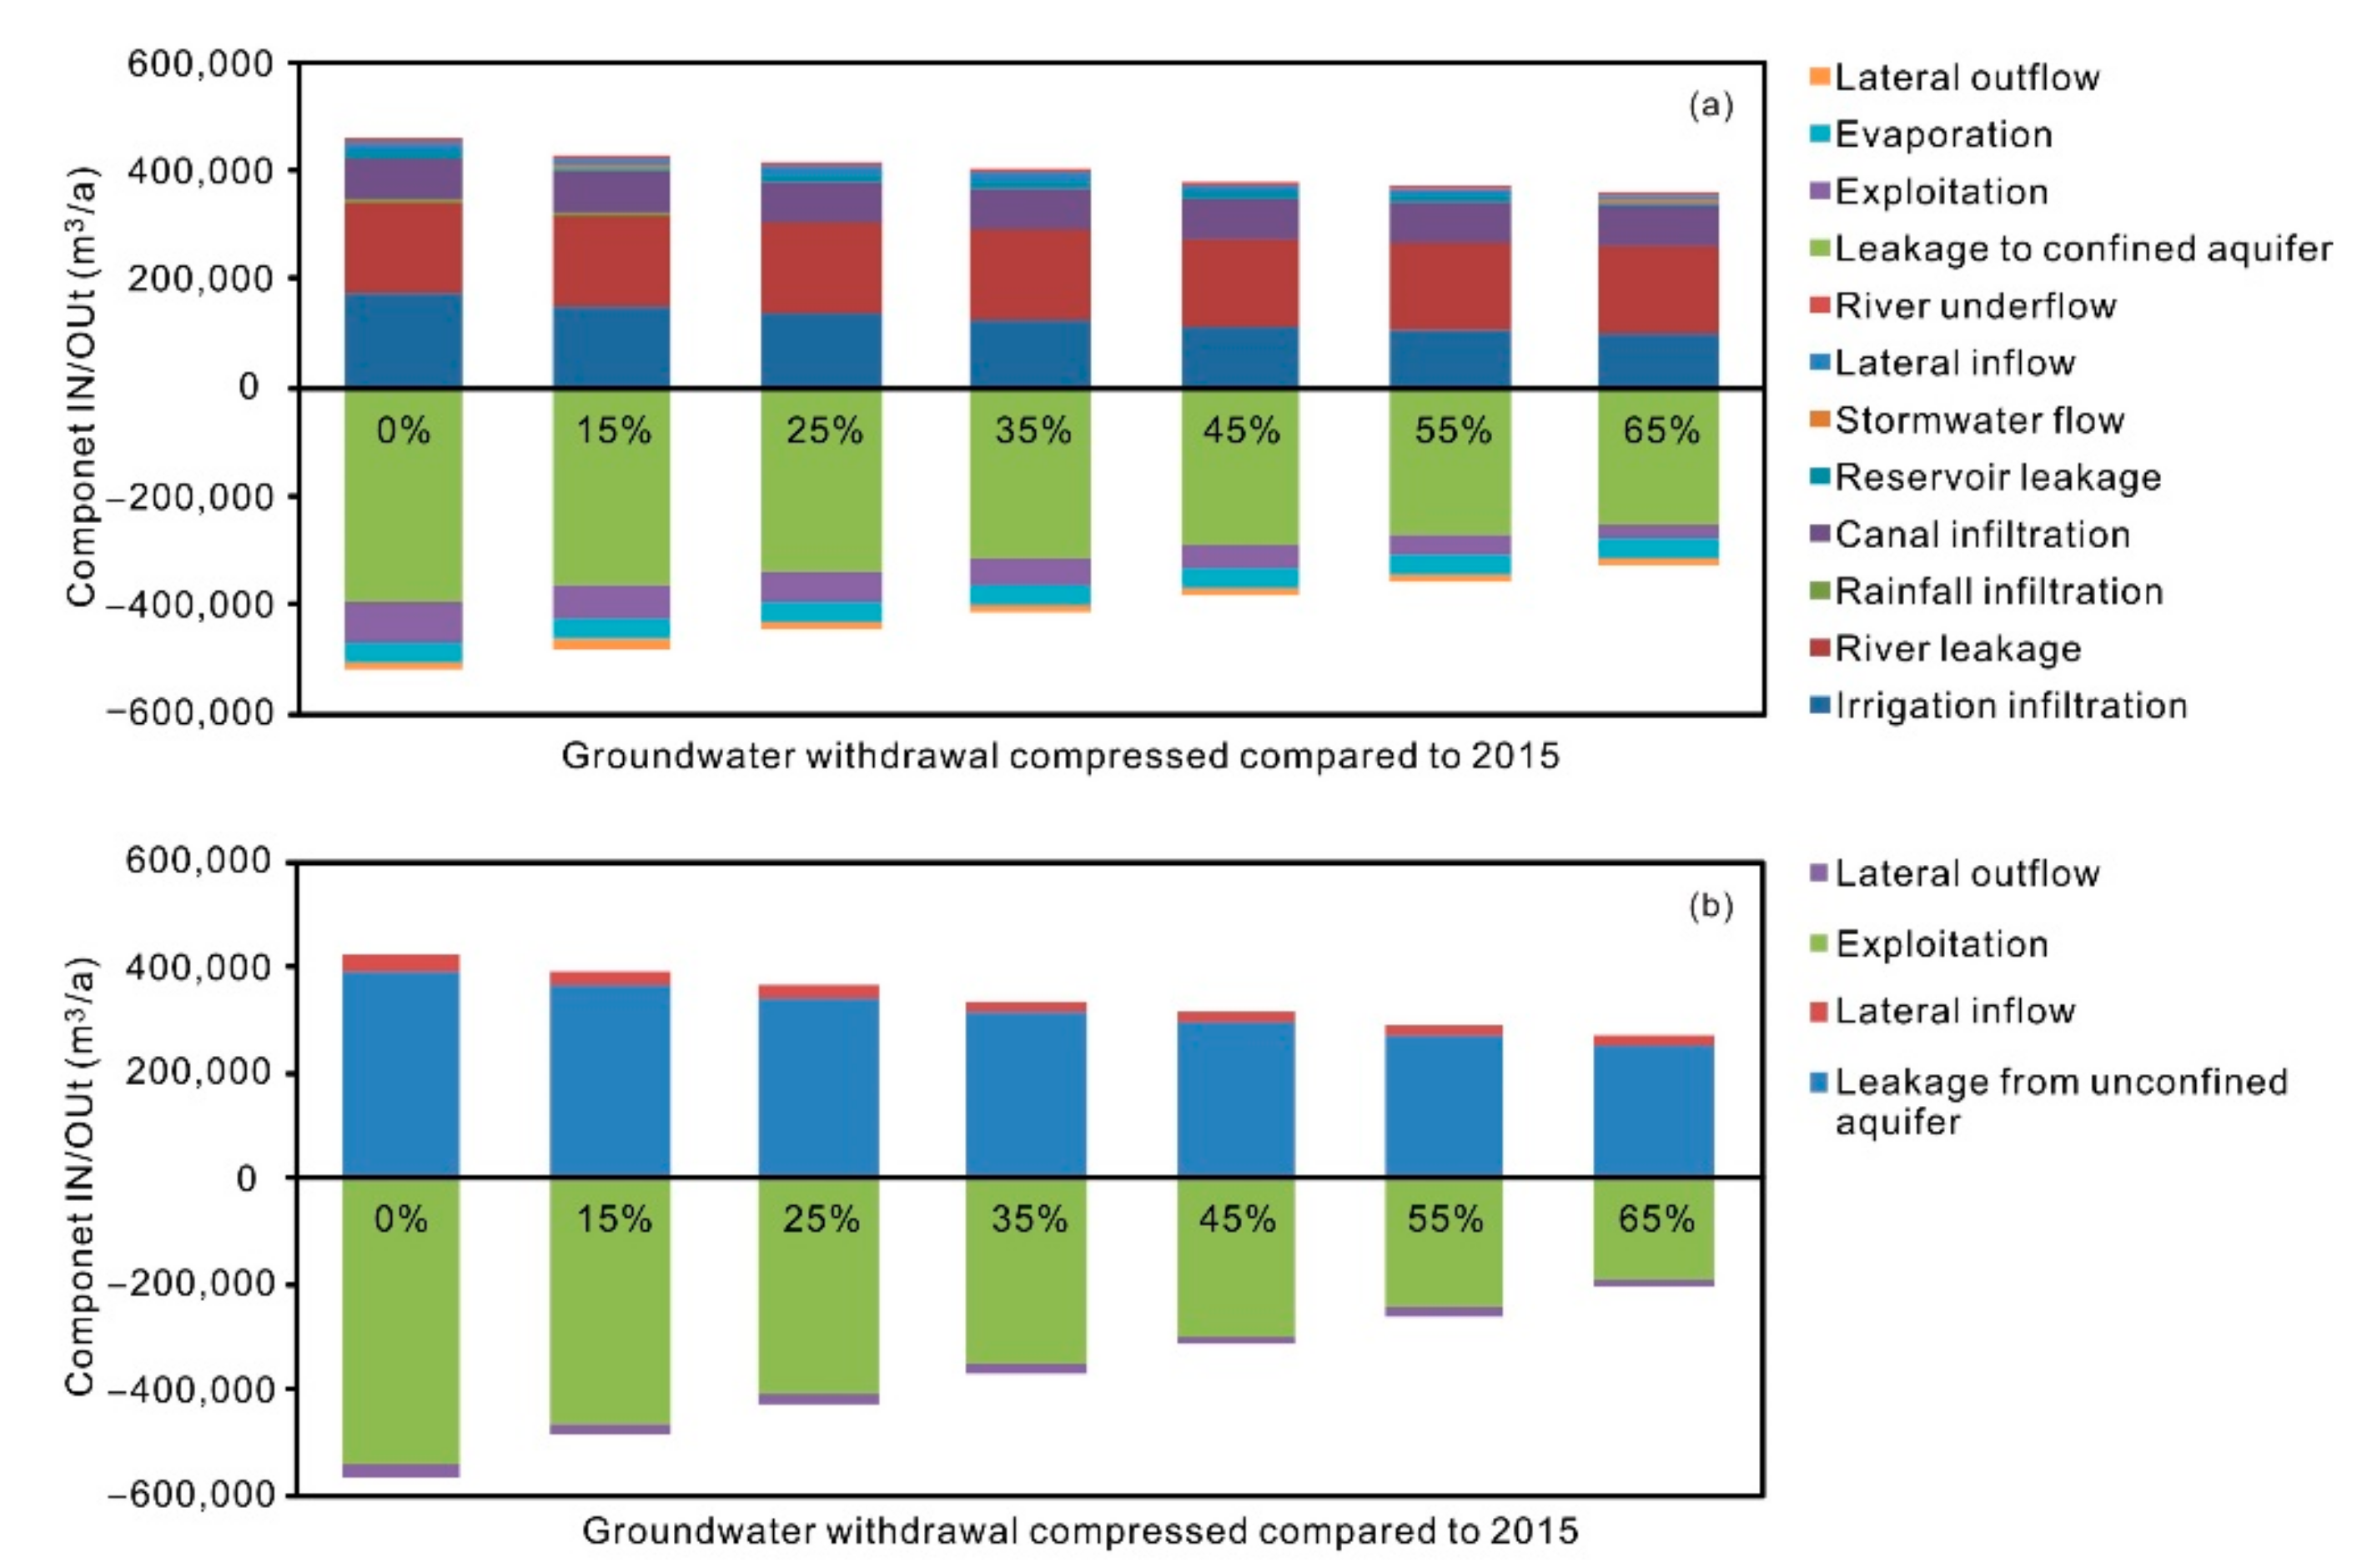
The changing trend of the water levels is also indicated by regional water balance (Figure 9). Under the scenario of 45% compression of the groundwater withdrawal, the net water balance is −8705.9 × 103 m3, accounting for 2.1% of the total groundwater recharge, while the net water balance is 45,281.3 × 103 m3, accounting for 11.6% of the total groundwater recharge. Thus, to stop groundwater levels from declining on the regional scale, the groundwater withdrawal rate should be compressed by 45%, with respect to that in 2015. Under this scenario, the allowable withdrawal should be 341,314.3 × 103 m3/a.
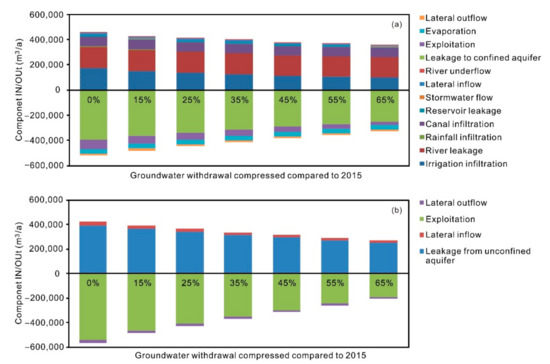
Figure 9.
Predicted groundwater budget in 2022 under Scenario B for (a) unconfined and (b) confined aquifer.
3.3. Scenario C: With Ecological Constraint
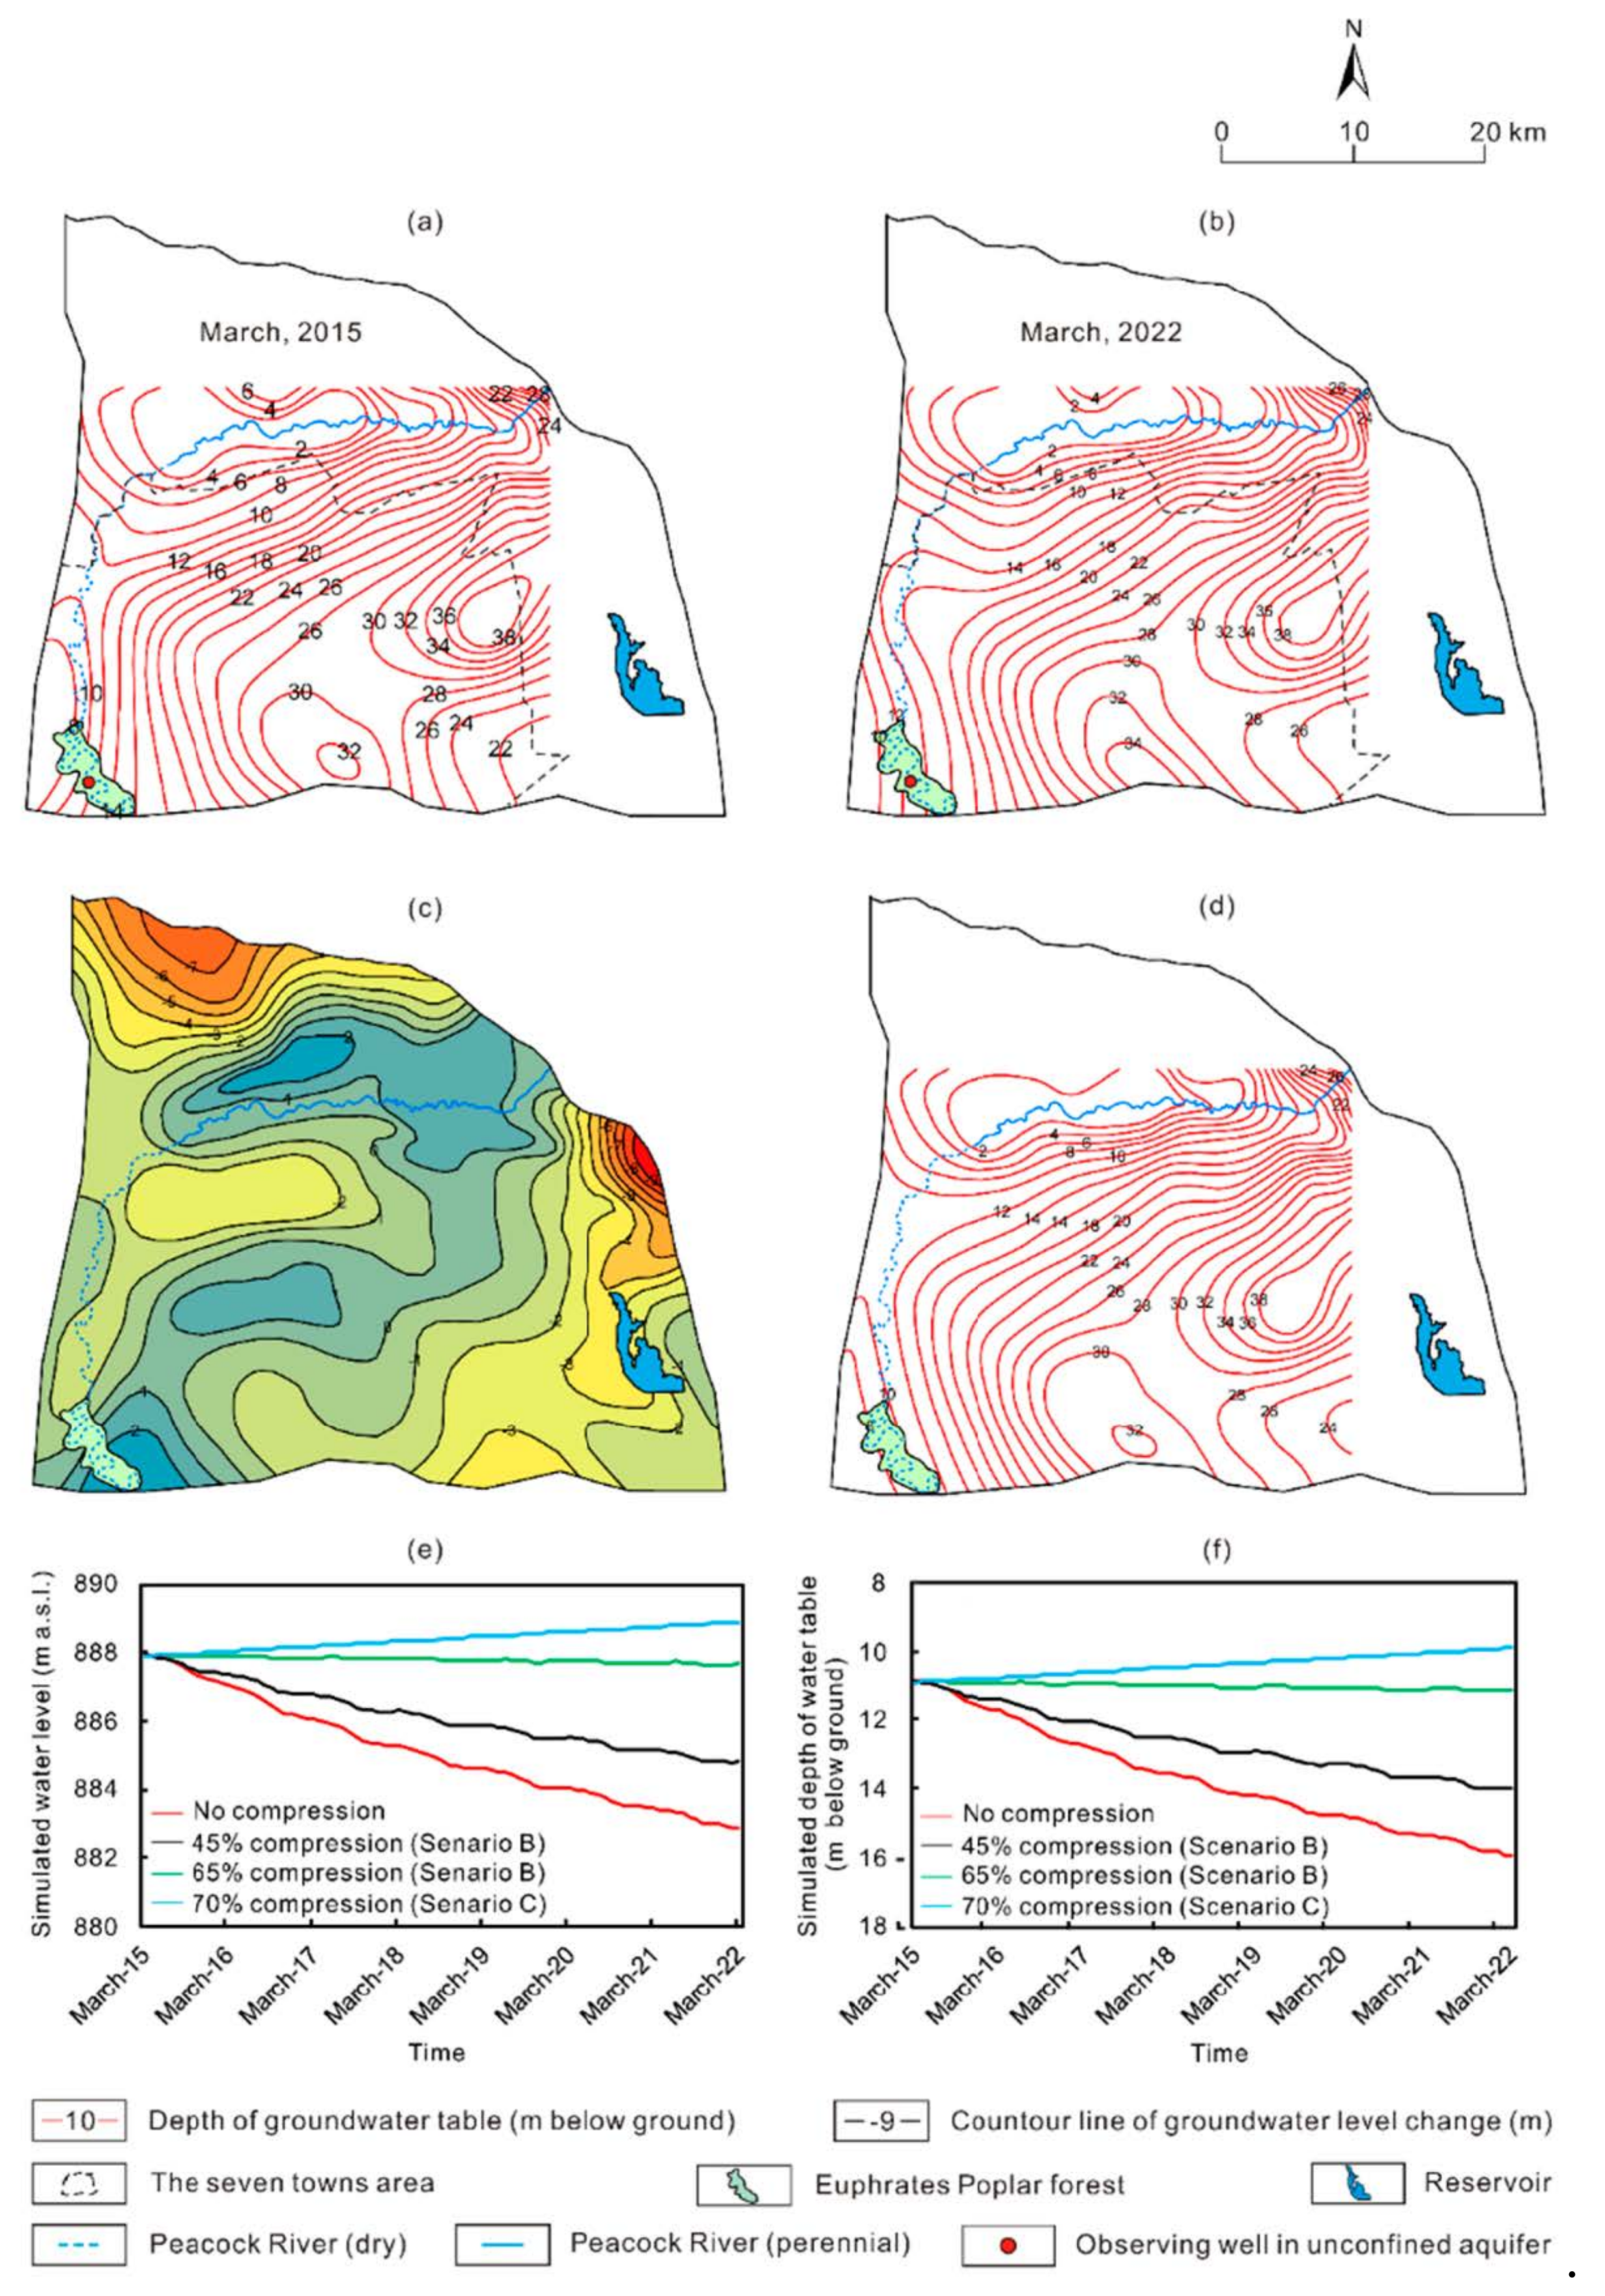
The Euphrates Poplar forest in the southwest part of the study area is located between the artificial oasis of the Upper Peacock River and the Taklimakan Desert (Figure 1), and it plays an important role in protection of the artificial oasis. Unfortunately, the Peacock River has dried up in the upper stream, thus groundwater in the area cannot receive recharge from river leakage. Moreover, groundwater is overexploited in the nearby areas. As a result, the level of unconfined water there has declined to 8–12 m below the ground surface in 2015 (Figure 10a). According to previous studies, the lowest groundwater level for Euphrates Poplar to survival is 10 m below the ground [43]. Thus, the groundwater level has partly fallen below the lowest ecological water level and some branches and leaves of the trees have already withered. It is noted that, although 45% compression of the groundwater withdrawal can maintain water level on the regional scale, water level in the vicinity of the forest cannot be restored to the ecological water level (Figure 10b) since concentrated groundwater withdrawal around the forest and leakage of the unconfined water to the confined aquifer. Thus, a more refined simulation was conducted with ecological constraint. The objective of the simulation was to optimize groundwater withdrawals ensuring that groundwater level would not decline on the regional scale and unconfined water around the forest be restored to the lowest ecological water level in 7 years from 2015. In order to restore the water level of the unconfined aquifer in the area of the forest, it is necessary to raise the water level in the recharge area to the north and the water levels of both the unconfined and confined aquifers to reduce the lateral and vertical hydraulic gradients. As unconfined water in the north piedmont plain receives recharge from leakage of the Peacock River and forms a relatively independent flow system, while in the east piedmont plains irrigation water is mainly provided by the Kuta and Halayugong Canals, further compression of groundwater withdrawal would have limited effect on the restoration of the water level around the forest. Thus, we choose the southwest seven towns (mainly including Puhui Farm, Puhui Ranch, Halayugong, Tuobuliqi, Baotouhu, Awati, and Awati Farm) which are located around the main cone of depression in the unconfined aquifer (Figure 10a and Figure 9b–d) as the area for further (i.e., 50%, 60%, and 70%) compression of groundwater withdrawal, while groundwater withdraw in the other regions in the study area were not compressed. The results show that under the scenario of 70% compression, the water level at the center of the cone would start to rise significantly, with a rate of −0.15–0.15 m/a (Figure 10). On the west edge of the cone the water level drops at 0.15–0.35 m/a due to the leakage of the unconfined water to the confined aquifer (Figure 10e,f), and on the east edge of the cone the decline rate is 0.20–0.30 m/a (Figure 10e). In contrast, on the north edge of the cone, the recharge rate significantly exceeds the discharge rate, resulting in a continuous rise of 0.05–0.15 m/a in the water level. At the center of the forest, the water level rises continuously at 0.10–0.25 m/a (Figure 10e). As a result, the water table in more than 85% of the forest area would reach up to 8–10 m below the ground in March 2022, while only in the southeastern part of the forest near the center of the cone the depth of water table would be of 10–12 m (Figure 10d). It is noted that under Scenario B with 65% compression of the groundwater withdrawal, the water table around the forest would also rise (Figure 10e). However, this is unrealistic since in the north and east parts of the study area, except for the southwest, seven towns host large areas of cash crops such as pears and cotton, so the planting area would not be reduced, moreover, industrial water use of Korla would increase continuously [44]. Therefore, to restore the water level around the Euphrates Poplar forest, the groundwater withdrawal in the southwest seven towns should be compressed by 70% with respect to that in 2015. Under this scenario, the optimized allowable withdrawal for the key area is 145,517.7 × 103 m3/a, while it is 281,030.2 × 103 m3/a for the whole modeled area, accounting to 55% compression of the current withdrawal of the whole study area.
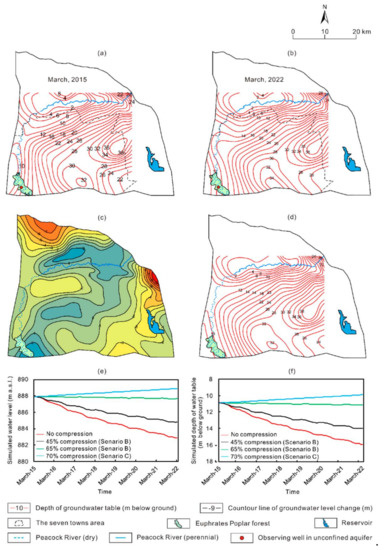
Figure 10.
Depth of water table in the southwest seven towns area in (a) March 2015 and (b) March 2022 with groundwater withdraw compressed by 45% under Scenario B, (c) change of water table between March 2022 and March 2015, (d) depth of water table in March 2022 under Scenario C, (e) water table and (f) depth of water table under Scenario B and C in 7 years from 2015.
4. Conclusions
Irrigation area has enlarged sharply since 1990s through land reclamation from grass land, forest land, sand land, and saline and alkaline land in the arid Upper Peacock River, NW China, accompanying the exploitation of a large amount of groundwater resources, and has led to continuous water level decline and degradation of the eco-environment. It is necessary to identify the degree of groundwater overexploitation and to determine the allowable withdrawal in order to the make sustainable use of the groundwater and protect the local eco-environment. Based on field investigation and data collection, a 3D transient groundwater flow model was established for the irrigation area to simulate the change of regional water level and water balance for three scenarios (1) under current intensity of groundwater withdrawal, (2) implementation of withdrawal compression measures on the regional scale and (3) with ecological constraint. The simulation results indicate a negative water budget of −212,603.5 m3/a in 2015. Assuming unchanged intensity of the groundwater withdrawal in 7 years, the levels of both the unconfined and confined water would decline continuously, with a total decrease of 0–9 m in unconfined water and 0–20 m in confined water level in 7 years. To stop groundwater levels from declining on the regional scale, the groundwater withdrawal rate should be compressed by 45%, with respect to that in 2015, with an allowable withdrawal of 341,314.3 × 103 m3/a. To restore the water level in the vicinity of the Euphrates Poplar forest to the ecological water level of within 10 m from ground surface, the withdrawal rate should be compressed by 55%, with respect to that in 2015, for the entire irrigation area with the allowable withdrawal rate of 281,030.2 × 103 m3/a, and 70% for the 7 towns around the forest with the allowable withdrawal rate of 145,517.7 × 103 m3/a.
Author Contributions
Conceptualization, Y.S.; methodology, Y.S. and F.Y.; software, Y.S., Y.C.; investigation, F.Y., Y.C., P.Z. and X.Z.; writing—original draft preparation, Y.S. and Y.C.; writing—review and editing, F.Y.; funding acquisition, F.Y. All authors have read and agreed to the published version of the manuscript.
Funding
This research was funded by 1:50,000 Hydrogeological Survey for Key Areas in Large Basins, NW China funded by China Geological Survey (No. 2221212011121279).
Institutional Review Board Statement
Not applicable.
Informed Consent Statement
Informed consent was obtained from all subjects involved in the study.
Data Availability Statement
Hydrogeologic and geologic data are proprietary or confidential in nature and may only be provided with restrictions.
Conflicts of Interest
The authors declare no conflict of interest.
References
- Cui, Y.L.; Shao, J.L. The Role of Ground Water in Arid/Semiarid Ecosystems, Northwest China. Groundwater 2005, 43, 471–477. [Google Scholar] [CrossRef]
- Siebert, S.; Burke, J.; Faures, J.M.; Frenken, K.; Hoogeveen, J.; Doll, P.; Portmann, F.T. Groundwater use for irrigation—A global inventory. Hydrol. Earth Syst. Sci. 2010, 14, 1863–1880. [Google Scholar] [CrossRef] [Green Version]
- Abd-Elaty, I.; Ghanayem, H.M.; Zeleňáková, M.; Mésároš, P.; Saleh, O.K. Numerical Investigation for Riverbank Filtration Sustainability Considering Climatic Changes in Arid and Semi-Arid Regions; Case Study of RBF Site at Embaba, Nile Delta, Egypt. Sustainability 2021, 13, 1897. [Google Scholar] [CrossRef]
- Jasechko, S.; Perrone, D. Global groundwater wells at risk of running dry. Science 2021, 372, 418–421. [Google Scholar] [CrossRef] [PubMed]
- Lasagna, M.; Bonetto, S.M.R.; Debernardi, L.; De Luca, D.A.; Semita, C.; Caselle, C. Groundwater Resources Assessment for Sustainable Development in South Sudan. Sustainability 2020, 12, 5580. [Google Scholar] [CrossRef]
- Elshall, A.S.; Arik, A.D.; El-Kadi, A.I.; Pierce, S.; Ye, M.; Burnett, K.M.; Wada, C.A.; Bremer, L.L.; Chun, G. Groundwater sustainability: A review of the interactions between science and policy. Environ. Res. Lett. 2020, 15, 093004. [Google Scholar] [CrossRef]
- Wu, W.Y.; Lo, M.H.; Wada, Y.; Famiglietti, J.S.; Reager, J.T.; Yeh, P.J.F.; Ducharne, A.; Yang, Z.L. Nature Divergent effects of climate change on future groundwater availability in key mid–latitude aquifers. Nat. Commun. 2020, 11, 3710. [Google Scholar] [CrossRef]
- Morgenstern, U.; Daughney, C.J. Groundwater age for identification of baseline groundwater quality and impacts of land-use intensification—The National Groundwater Monitoring Programme of New Zealand. J. Hydrol. 2012, 456, 79–93. [Google Scholar] [CrossRef]
- Benini, L.; Antonellini, M.; Laghi, M.; Mollema, P.N. Assessment of water resources availability and groundwater salinization in future climate and land use change scenarios: A case study from a coastal drainage basin in Italy. Water Resour. Manag. 2016, 30, 731–745. [Google Scholar] [CrossRef]
- Ayenew, T.; Gebre, E.M.; Kebede, S.; Mamo, S. Integrated assessment of hydrogeology and water quality for groundwater-based irrigation development in the Raya Valley, northern Ethiopia. Water Int. 2013, 38, 480–492. [Google Scholar] [CrossRef]
- Custodio, E.; Andreu-Rodes, J.M.; Aragón, R.; Estrela, T.; Ferrer, J.; García-Aróstegui, J.L.; Manzano, M.; Rodríguez-Hernández, L.; Sahuquillo, A.; Del Villar, A. Groundwater intensive use and mining in south-eastern peninsular Spain: Hydrogeological, economic and social aspects. Sci. Total. Environ. 2016, 559, 302–316. [Google Scholar] [CrossRef] [Green Version]
- Alley, W.M.; Clark, B.R.; Ely, D.M.; Faunt, C.C. Groundwater Development Stress: Global-Scale Indices Compared to Regional Modeling by Indices Compared to Regional Modeling. Groundwater 2018, 56, 266–275. [Google Scholar] [CrossRef]
- Aksever, F.; Davraz, A.; Karaguzel, R. Groundwater balance estimation and sustainability in the Sandikli Basin (Afyonkarahisar/Turkey). J. Earth Syst. Sci. 2015, 124, 783–798. [Google Scholar] [CrossRef] [Green Version]
- Yosri, A.; Abd-Elmegeed, M.A.; Hassan, A.E. Assessing groundwater storage changes in the Nubian aquifer using GRACE data. Arab. J. Geosci. 2016, 9, 567. [Google Scholar] [CrossRef]
- Rateb, A.; Scanlon, B.R.; Pool, D.R.; Sun, A.; Zhang, Z.Z.; Chen, J.L.; Clark, B.; Faunt, C.C.; Haugh, C.J.; Hill, M.; et al. Comparison of Groundwater Storage Changes From GRACE Satellites With Monitoring and Modeling of Major US Aquifers. Water Resour. Res. 2020, 56, e2020WR02755. [Google Scholar] [CrossRef]
- Zhang, C.; Duan, Q.Y.; Yeh, P.J.F.; Pan, Y.; Gong, H.L.; Gong, W.; Di, Z.H.; Lei, X.H.; Liao, W.H.; Huang, Z.Y.; et al. The Effectiveness of the South–to–North Water Diversion Middle Route Project on Water Delivery and Groundwater Recovery in North China Plain. Water Resour. Res. 2020, 56, e2019WR026759. [Google Scholar] [CrossRef]
- Lezzaik, K.; Milewski, A. A quantitative assessment of groundwater resources in the Middle East and North Africa region. Hydrogeol. J. 2017, 26, 251–266. [Google Scholar] [CrossRef]
- Alam, S.; Gebremichael, M.; Li, R.; Dozier, J.; Lettenmaier, D.P. Can managed aquifer recharge mitigate the groundwater overdraft in California’s Central Valley? Water Resour. Res. 2020, 56, e2020WR027244. [Google Scholar] [CrossRef]
- Antonio, P.B.; Angela, V.; Fernando, S. Groundwater Sustainability Strategies in the Sierra de Gador–Campo de Dalias System, Southeast Spain. Water 2020, 11, 3262. [Google Scholar]
- Al-Amin, S.; Berglund, E.Z.; Mahinthakumar, G.; Larson, K.L. Assessing the effects of water restrictions on socio-hydrologic resilience for shared groundwater systems. J. Hydrol. 2018, 566, 872–885. [Google Scholar] [CrossRef]
- Quinn, N.W.T.; Oster, J.D. Innovations in Sustainable Groundwater and Salinity Management in California’s San Joaquin Valley. Sustainability 2021, 13, 6658. [Google Scholar] [CrossRef]
- Wurl, J.; Gámez, A.E.; Ivanova, A.; Lamadrid, M.A.I.; Hernández–Morales, P. Socio–hydrological resilience of an arid aquifer system, subject to changing climate and inadequate agricultural management: A case study from the Valley of Santo Domingo, Mexico. J. Hydrol. 2018, 559, 486–498. [Google Scholar] [CrossRef]
- Bouaamlat, I.; Larabi, A.; Faouzi, M. Hydrogeological investigation of an oasis–system aquifer in arid southeastern Morocco by development of a groundwater flow model. Hydrogeol. J. 2016, 24, 1479–1496. [Google Scholar] [CrossRef]
- Almuhaylan, M.R.; Ghumman, A.R.; Al–Salamah, I.S.; Ahmad, A.; Ghazaw, Y.M.; Haider, H.; Shafiquzzaman, M. Evaluating the Impacts of Pumping on Aquifer Depletion in Arid Regions Using MODFLOW, ANFIS and ANN. Water 2020, 12, 2297. [Google Scholar] [CrossRef]
- Song, J.; Yang, Y.; Sun, X.M.; Jin, L.; Wu, M.; Wu, J.F.; Wu, J.C. Basin–scale multi–objective simulation–optimization modeling for conjunctive use of surface water and groundwater in northwest China. Hydrol. Earth Syst. Sci. 2020, 24, 2323–2341. [Google Scholar] [CrossRef]
- Sefelnasr, A.; Gossel, W.; Wycisk, P. Groundwater management options in an arid environment: The Nubian Sandstone Aquifer System, Eastern Sahara. J. Arid. Environ. 2015, 122, 46–58. [Google Scholar] [CrossRef]
- Brush, C.F.; Dogrul, E.C.; Kadir, T.N. Development and Calibration of the California Central Valley Groundwater Surface Water Simulation Model (C2VSim), Version 3.02–CG; California Department of Water Resources: Sacramento, CA, USA, 2013; p. 196. [Google Scholar]
- Li, R.; Pun, M.; Bradley, J.; Ou, G.; Schneider, J.; Flyr, B.; Winter, J.; Chinta, S. Evaluating hydrologically connected surface water and groundwater using a groundwater model. J. Am. Water Resour. Assoc. 2016, 52, 799–805. [Google Scholar] [CrossRef]
- Lin, J.J.; Ma, R.; Hu, Y.L.; Su, Z.Y.; Wang, Y.X.; McCarter, C.P.R. Groundwater sustainability and groundwater/surface–water interaction in arid Dunhuang Basin, northwest China. Hydrogeol. J. 2018, 26, 1559–1572. [Google Scholar] [CrossRef]
- Wang, H.; Qin, D.Y.; Wang, Y.; Wang, F. Ecological status and its evolution trend in arid region of northwest China. J. Hydraul. Eng. 2004, 8, 8–14. [Google Scholar]
- He, K.; Wu, S.X.; Yang, Y.; Wang, D.; Zhang, S.Y.; Yin, N. Dynamic changes of land use and oasis in Xinjiang in the last 40 years. Arid Land Geogr. 2018, 41, 1333–1340. [Google Scholar]
- Ma, L.; Wei, X.M.; Bao, A.M.; Wang, S.F. Simulation of groundwater table dynamics based on Feflow in the Minqin Basin, China. J. Arid. Land 2012, 4, 123–131. [Google Scholar] [CrossRef]
- Wang, W.R.; Chen, Y.N.; Wang, W.H.; Jiang, J.X.; Cai, M.; Xu, Y.J. Evolution characteristics of groundwater and its response to climate and land–cover changes in the oasis of dried–up river in Tarim Basin. J. Hydrol. 2021, 594, 125644. [Google Scholar] [CrossRef]
- Chen, F.; Xu, X.Y.; Yang, Y.; Ding, Y.Y.; Li, J.Q.; Li, Y.Y. Investigation on the evolution trends and influencing factors of groundwater resources in China. Adv. Water Sci. 2020, 31, 811–819. [Google Scholar]
- The First Institute of Hydrogeology and Engineering Geology, Xinjiang Uygur Autonomous Region, The Second Institute of Hydrogeology and Engineering Geology, Xinjiang Uygur Autonomous Region. 1: 50,000 Hydrogeological Investigation of the Upper Peacock River; The First Institute of Hydrogeology and Engineering Geology, Xinjiang Uygur Autonomous Region, The Second Institute of Hydrogeology and Engineering Geology, Xinjiang Uygur Autonomous Region: Urumqi, China; Changji, China, 2015; pp. 135–139. [Google Scholar]
- Wei, X.; Zhou, J.L.; Zeng, Y.Y.; Feng, S.T.; Wang, Y. Dynamics and Influence Factors of Groundwater Depth in Korla with Intensive Exploitation. J. Yangtze River Sci. Res. Inst. 2019, 36, 46–59, 63. [Google Scholar]
- Harbaugh, A.W.; Banta, E.R.; Hill, M.C.; McDonald, M.G. MODFLOW–2000, the U.S. Geological Survey Modular Ground–Water Model, User’s Guide to the Modularization Concepts and the Ground–Water Flow Process: U.S. Geological Survey Open–File Report 00–92. Available online: http://water.usgs.gov/nrp/gwsoftware/modflow2000/modflow2000.html (accessed on 4 September 2003).
- Yang, F.T.; Chen, Y.X.; Zhang, P.; Zhang, X. Report on Coefficients of Precipitation and Irrigation Infiltration in Korla City; Institute of Water Resources and Environment, Jilin University: Changchun, China, 2014; pp. 26–53. [Google Scholar]
- Zhao, Y.J. A Study on the Influence Factors and Calculation Method for Phreatic Water in Xinjiang Plain Area; Xinjiang Agricultural University: Urumqi, China, 2012; pp. 26–27. [Google Scholar]
- Prasad, Y.S.; Rao, B.V.; Surinaidu, L. Groundwater flow modeling and prognostics of Kandivalasa river sub-basin, Andhra Pradesh, India. Environ. Dev. Sustain. 2021, 23, 1823–1843. [Google Scholar] [CrossRef]
- Korla Municipal Bureau of Water Resources. Remediation Scheme of Groundwater Overexploitation Area in Korla City (2016–2030). Available online: http://www.xjkel.gov.cn/gk/gfxwj/fzbfw/190312.htm (accessed on 25 February 2018).
- Lei, M.; Zhou, J.L.; Wei, X.; Zhang, J.; Fan, W. Assessment of comprehensive control of groundwater over-exploitation areas of oasis city in arid region. Yellow River 2021, 43, 100–105. [Google Scholar]
- Liu, B. Groundwater Investigation of the Tarim Basin; Geology Press: Beijing, China, 2008; p. 234. ISBN 9787116059078-1-00580. [Google Scholar]
- Administration of City and Country Planning of Korla. Korla City Master Plan (2012–2030). Available online: http://www.xjkel.gov.cn/gk/kelfcflbgg/29189.htm (accessed on 27 February 2013).
Publisher’s Note: MDPI stays neutral with regard to jurisdictional claims in published maps and institutional affiliations. |
© 2021 by the authors. Licensee MDPI, Basel, Switzerland. This article is an open access article distributed under the terms and conditions of the Creative Commons Attribution (CC BY) license (https://creativecommons.org/licenses/by/4.0/).

