
Impact of Express Delivery Industry’s Development on Transportation Sector’s Carbon Emissions: An Empirical Analysis from China


Abstract
:1. Introduction
2. Literature Review
3. Variable Selection, Data Sources, and Model Construction
3.1. Variable Selection
3.1.1. Dependent Variable
3.1.2. Independent Variables
Per capita Express Delivery Amount
Number of Per Capita Postal Outlets
Number of Per Capita Postal Workers
Express Comprehensive Development Index (ECDI)
3.1.3. Control Variables
3.2. Data Sources
3.3. Model Construction
4. Empirical Analysis Results and Discussion
4.1. Three Major Indicators and Transportation Sector’s CO2 Emissions
4.1.1. Nationwide Regression Results
4.1.2. Sub-Regional Regression Results
4.2. ECDI and Transportation Sector’s CO2 Emissions
5. Conclusions and Policy Recommendations
Author Contributions
Funding
Institutional Review Board Statement
Informed Consent Statement
Data Availability Statement
Acknowledgments
Conflicts of Interest
Appendix A
References
- Fan, W.G.; Xu, M.; Dong, X.B.; Wei, H.J. Considerable Environmental Impact of the Rapid Development of China’s Express Delivery Industry. Resour. Conserv. Recycl. 2017, 126, 174–176. [Google Scholar] [CrossRef]
- Chen, H.; Long, R.Y.; Niu, W.J.; Feng, Q.; Yang, R.R. How Does Individual Low-Carbon Consumption Behavior Occur?—An Analysis Based on Attitude Process. Appl. Energy 2014, 116, 376–386. [Google Scholar] [CrossRef]
- Visser, J.; Nemoto, T.; Browne, M. Home Delivery and the Impacts on Urban Freight Transport: A Review. Procedia Soc. Behav. Sci. 2014, 125, 15–27. [Google Scholar] [CrossRef] [Green Version]
- State Post Bureau of the People’s Republic of China. 2020 China Express Development Index Report (January to August). Available online: www.spb.gov.cn/sj/zgkdfzzs/ (accessed on 28 March 2021).
- Wang, J.X.; Lim, M.K.; Tseng, M.L.; Yang, Y. Promoting Low Carbon Agenda in the Urban Logistics Network Distribution System. J. Clean. Prod. 2019, 211, 146–160. [Google Scholar] [CrossRef]
- Chen, T.; Lin, C.W. A Fuzzy Collaboration System for Ubiquitous Loading/Unloading Space Recommendation in the Logistics Industry. Robot. Comput. Integr. Manuf. 2017, 45, 86–98. [Google Scholar] [CrossRef]
- Yang, B.; Guo, Y.Y.; Shi, X.; Lu, Y.Y. Research on the Energy Consumption Evaluation Model of Container Terminal Logistics System. Appl. Mech. Mater. 2012, 157, 1224–1229. [Google Scholar] [CrossRef]
- Duan, H.B.; Song, G.H.; Qu, S.; Dong, X.B.; Xu, M. Post-Consumer Packaging Waste from Express Delivery in China. Resour. Conserv. Recycl. 2019, 144, 137–143. [Google Scholar] [CrossRef]
- GF Securities. Quantitative Comparison of Tongda System Based on Dynamic Programming Modeling. Available online: www.doc88.com/p-5671609677886.html (accessed on 25 March 2021).
- Kang, P.; Song, G.H.; Chen, D.J.; Duan, H.B.; Zhong, R.Y. Characterizing the Generation and Spatial Patterns of Carbon Emissions from Urban Express Delivery Service in China. Environ. Impact Assess. Rev. 2020, 80, 106336. [Google Scholar] [CrossRef]
- Baral, N.R.; Asher, Z.D.; Trinko, D.; Sproul, E.; Quiroz-Arita, C.; Quinn, J.C.; Bradley, T.H. Biomass Feedstock Transport Using Fuel Cell and Battery Electric Trucks Improves Lifecycle Metrics of Biofuel Sustainability and Economy. J. Clean. Prod. 2021, 279, 123593. [Google Scholar] [CrossRef]
- Harvey, L.D.D. Resource Implications of Alternative Strategies for Achieving Zero Greenhouse Gas Emissions from Light-Duty Vehicles By 2060. Appl. Energy 2018, 212, 663–679. [Google Scholar] [CrossRef]
- Lee, D.Y.; Elgowainy, A.; Kotz, A.; Vijayagopal, R.; Marcinkoski, J. Life-Cycle Implications of Hydrogen Fuel Cell Electric Vehicle Technology for Medium–And Heavy-Duty Trucks. J. Power Sources 2018, 393, 217–229. [Google Scholar] [CrossRef]
- Agence France-Presse. DHL Introduces ‘Green’ Service in Asia Pacific. Available online: www.thedailystar.net/news-detail-26869 (accessed on 7 May 2021).
- Rasool, Y.; Zaidi, S.A.H.; Zafar, M.W. Determinants of Carbon Emissions in Pakistan’s Transport Sector. Environ. Sci. Pollut. Res. 2019, 26, 1–15. [Google Scholar] [CrossRef]
- Trofimenko, Y.; Komkov, V.; Donchenko, V. Problems and Prospects of Sustainable Low Carbon Development of Transport in Russia. IOP Conf. Ser. Earth Environ. Sci. 2018, 177. [Google Scholar] [CrossRef] [Green Version]
- Zhang, X.M.; Zhou, G.G.; Cao, J.; Wu, A.Q. Evolving Strategies of E-Commerce and Express Delivery Enterprises with Public Supervision. Res. Transp. Econ. 2020, 80. [Google Scholar] [CrossRef]
- Shao, S.J.; Xu, G.Y.; Li, M.; Huang, G.Q. Synchronizing E-Commerce City Logistics with Sliding Time Windows. Transp. Res. Part E Logist. Transp. Rev. 2019, 123, 17–28. [Google Scholar] [CrossRef]
- Pitney Bowes. Pitney Bowes Parcel Shipping Index. Available online: www.sohu.com/a/333085996_343156?scm=1002.46005d.16b016f01a2.PC_ARTICLE_REC_OPT (accessed on 23 April 2021).
- Liu, B.; Deng, C.Y.; Lin, J.L.; Huang, P. Discussion on Development Countermeasures of Railway Express Freight Transport Equipments. Railw. Freight Transp. 2014, 32, 9–14. [Google Scholar]
- Barenji, A.V.; Wang, W.M.; Li, Z.; Guerra-Zubiaga, D.A. Intelligent E-Commerce Logistics Platform Using Hybrid Agent Based Approach. Transp. Res. Part E Logist. Transp. Rev. 2019, 126, 15–31. [Google Scholar] [CrossRef]
- Anderhofstadt, B.; Spinler, S. Factors Affecting the Purchasing Decision and Operation of Alternative Fuel-Powered Heavy-Duty Trucks in Germany-A Delphi Study. Transp. Res. Part D Transp. Environ. 2019, 73, 87–107. [Google Scholar] [CrossRef]
- Li, W.B.; Long, R.Y.; Chen, H.; Geng, J.C. A Review of Factors Influencing Consumer Intentions to Adopt Battery Electric Vehicles. Renew. Sustain. Energy Rev. 2017, 78, 318–328. [Google Scholar] [CrossRef]
- Zhou, M.; Kong, N.; Zhao, L.D.; Huang, F.H.; Wang, S.; Campy, K.S. Understanding Urban Delivery Drivers’ Intention to Adopt Electric Trucks in China. Transp. Res. Part D Transp. Environ. 2019, 74, 65–81. [Google Scholar] [CrossRef]
- Weideli, D. Environmental Analysis of US Online Shopping. Available online: ctl.mit.edu/sites/default/files/library/public/Dimitri-Weideli-Environmental-Analysis-of-US-Online-Shopping_0.pdf (accessed on 19 March 2021).
- Nguyen, N. The Hidden Environmental Cost of Amazon Prime’s Free, Fast Shipping. Available online: depts.washington.edu/sctlctr/news-events/in-the-news/hidden-environmental-cost-amazon-prime%E2%80%99s-free-fast-shipping (accessed on 21 April 2021).
- Stolaroff, J.K.; Samaras, C.; O’Neill, E.R.; Lubers, A.; Mitchell, A.S.; Ceperley, D. Energy Use and Life Cycle Greenhouse Gas Emissions of Drones for Commercial Package Delivery. Nat. Commun. 2018, 9, 1–13. [Google Scholar] [CrossRef]
- Steenhof, P.; Woudsma, C.; Sparling, E. Greenhouse Gas Emissions and the Surface Transport of Freight in Canada. Transp. Res. Part D Transp. Environ. 2006, 11, 369–376. [Google Scholar] [CrossRef]
- Jin, M.Z.; Granda-Marulanda, N.A.; Down, I. The Impact of Carbon Policies on Supply Chain Design and Logistics of a Major Retailer. J. Clean. Prod. 2014, 85, 453–461. [Google Scholar] [CrossRef]
- Behnke, M.; Kirschstein, T. The Impact of Path Selection on GHG Emissions in City Logistics. Transp. Res. Part E Logist. Transp. Rev. 2017, 106, 320–336. [Google Scholar] [CrossRef]
- Velázquez-Martínez, J.C.; Fransoo, J.C.; Blanco, E.E.; Valenzuela-Ocaña, K.B. A New Statistical Method of Assigning Vehicles to Delivery Areas for CO2 Emissions Reduction. Transp. Res. Part D Transp. Environ. 2016, 43, 133–144. [Google Scholar] [CrossRef]
- Bouchery, Y.; Fransoo, J. Cost, Carbon Emissions and Modal Shift in Intermodal Network Design Decisions. Int. J. Prod. Econ. 2015, 164, 388–399. [Google Scholar] [CrossRef]
- Liu, F.; Klimont, Z.; Zhang, Q.; Cofala, J.; Zhao, L.J.; Huo, H.; Nguyen, B.; Schöpp, W.; Sander, R.; Zheng, B.; et al. Integrating Mitigation of Air Pollutants and Greenhouse Gases in Chinese Cities: Development of GAINS-City Model for Beijing. J. Clean. Prod. 2013, 58, 25–33. [Google Scholar] [CrossRef]
- Wamsler, C.; Brink, E.; Rivera, C. Planning for Climate Change in Urban Areas: From Theory to Practice. J. Clean. Prod. 2013, 50, 68–81. [Google Scholar] [CrossRef] [Green Version]
- Zhang, Y.; Chen, J.; Li, X.F.; Zhong, M.E. Exploring Logistics Dispatcher’s Preference in Electric Tricycle Related Policies: The Case of China. J. Clean. Prod. 2019, 230, 835–843. [Google Scholar] [CrossRef]
- IPCC. 2006 IPCC Guidelines for National Greenhouse Gas Inventories; IPCC: Geneva, Switzerland, 2006. [Google Scholar]
- Chen, Y.L.; Zhao, J.C.; Lai, Z.Z.; Wang, Z.; Xia, H.B. Exploring the Effects of Economic Growth, and Renewable and Non-Renewable Energy Consumption on China’s CO2 Emissions: Evidence from a Regional Panel Analysis. Renew. Energy 2019, 140, 341–353. [Google Scholar] [CrossRef]
- Du, H.B.; Chen, Z.N.; Peng, B.B.; Southworth, F.; Ma, S.; Wang, Y. What Drives CO2 Emissions from the Transport Sector? A Linkage Analysis. Energy 2019, 175, 195–204. [Google Scholar] [CrossRef]
- Carbon Trading Network. Reference for CO2 Emission Coefficients of Energy Sources. Available online: http://www.tanjiaoyi.com/article-3075-1.html (accessed on 9 May 2021).
- China’s Guidelines for the Preparation of Provincial Greenhouse Gas Inventories; The National Development and Reform Commission (NDRC) of the People’s Republic of China: Beijing, China, 2011; Available online: https://wenku.baidu.com/view/7ae95325f111f18583d05a67.html (accessed on 11 May 2021).
- Weltevreden, J.W.J.; Rietbergen, T.V. E-Shopping Versus City Centre Shopping: The Role of Perceived City Centre Attractiveness. Tijdschr. Voor Econ. Soc. Geogr. 2007, 98, 68–85. [Google Scholar] [CrossRef]
- Rosqvist, L.S.; Hiselius, L.W. E-shOnline Shopping Habits and the Potential for Reductions in Carbon Dioxide Emissions from Passenger Transport. J. Clean. Prod. 2016, 131, 163–169. [Google Scholar] [CrossRef]
- Wei, J.; Chen, H.; Long, R.Y.; Zhao, F. Application of the Capability Maturity Model to Evaluating the Carbon Capability Maturity of Urban Residents in 10 Eastern Provinces of China. Resour. Conserv. Recycl. 2019, 148, 11–22. [Google Scholar] [CrossRef]
- Pata, U.K. Renewable Energy Consumption, Urbanization, Financial Development, Income and CO2 Emissions in Turkey: Testing EKC Hypothesis with Structural Breaks. J. Clean. Prod. 2018, 187, 770–779. [Google Scholar] [CrossRef]
- Salman, M.; Long, X.L.; Dauda, L.; Mensah, C.N.; Muhammad, S. Different Impacts of Export and Import on Carbon Emissions Across 7 ASEAN Countries: A Panel Quantile Regression Approach. Sci. Total Environ. 2019, 686, 1019–1029. [Google Scholar] [CrossRef]
- Gorus, M.S.; Aydin, M. The Relationship Between Energy Consumption, Economic Growth, and CO2 Emission in MENA Countries: Causality Analysis in the Frequency Domain. Energy 2019, 168, 815–822. [Google Scholar] [CrossRef]
- Riti, J.S.; Song, D.Y.; Shu, Y.; Kamah, M. Decoupling CO2 Emission and Economic Growth in China: Is There Consistency in Estimation Results in Analyzing Environmental Kuznets Curve? J. Clean. Prod. 2017, 166, 1448–1461. [Google Scholar] [CrossRef]
- Jiao, Z.L. Development of E-Commerce Logistics in China. In Contemporary Logistics in China; Liu, B.L., Lee, S.J., Wang, L., Li, X., Xiao, J.H., Eds.; Current Chinese Economic Report Series; Springer: Berlin/Heidelberg, Germany, 2014; pp. 127–141. [Google Scholar] [CrossRef]
- Zhang, C.G.; Nian, J. Panel Estimation for Transport Sector CO2 Emissions and Its Affecting Factors: A Regional Analysis in China. Energy Policy 2013, 63, 918–926. [Google Scholar] [CrossRef]
- Chen, B.K.; Zhang, C.C. Human Capital and Housing Prices in Chinese Cities. Soc. Sci. China 2016, 5, 43–64. [Google Scholar]
- Shen, N.; Zhao, Y.Q.; Wang, Q.W. Diversified Agglomeration, Specialized Agglomeration, and Emission Reduction Effect-A Nonlinear Test Based on Chinese City Data. Sustainability 2018, 10, 2002. [Google Scholar] [CrossRef] [Green Version]
- Dong, F.; Li, J.Y.; Wang, Y.; Zhang, X.Y.; Zhang, S.N.; Zhang, S.Q. Drivers of the Decoupling Indicator Between the Economic Growth and Energy-Related CO2 in China: A Revisit from the Per-Spectives of Decomposition and Spatiotemporal Heterogeneity. Sci. Total Environ. 2019, 685, 631–658. [Google Scholar] [CrossRef]
- Raza, M.Y.; Lin, B.Q. Decoupling and Mitigation Potential Analysis of CO2 Emissions from Pakistan’s Transport Sector. Sci. Total Environ. 2020, 730. [Google Scholar] [CrossRef]
- Wu, Y.; Tam, V.W.Y.; Shuai, C.Y.; Shen, L.Y.; Zhang, Y.; Liao, S.J. Decoupling China’s Economic Growth from Carbon Emissions: Empirical Studies From 30 Chinese Provinces (2001–2015). Sci. Total Environ. 2019, 656, 576–588. [Google Scholar] [CrossRef] [PubMed]
- Yang, J.; Cai, W.; Ma, M.D.; Li, L.; Liu, C.H.; Ma, X.; Li, L.L.; Chen, X.Z. Driving Forces of China’s CO2 Emissions from Energy Consumption Based on Kaya-LMDI Methods. Sci. Total Environ. 2020, 711. [Google Scholar] [CrossRef] [PubMed]
- Li, K.M.; Fang, L.T.; He, L.R. The Impact of Energy Price on CO2 Emissions in China: A Spatial Econometric Analysis. Sci. Total Environ. 2020, 706, 135942. [Google Scholar] [CrossRef]
- Doolin, B.; Dillon, S.; Thompson, F.; Corner, J.L. Perceived Risk, the Internet Shopping Experience and Online Purchasing Behavior: A New Zealand Perspective. J. Glob. Inf. Manag. 2005, 13, 66–88. [Google Scholar] [CrossRef] [Green Version]
- Zhang, G.X.; Deng, N.N.; Mou, H.Z.; Zhang, Z.G.; Chen, X.F. The Impact of the Policy and Behavior of Public Participation on Environmental Governance Performance: Empirical Analysis Based on Provincial Panel Data in China. Energy Policy 2019, 129, 1347–1354. [Google Scholar] [CrossRef]
- Yang, W.Y.; Li, T.; Cao, X.C. Examining the Impacts of Socio-Economic Factors, Urban Form and Transportation Development on CO2 Emissions from Trans-Portation in China: A Panel Data Analysis of China’s Provinces. Habitat Int. 2015, 49, 212–220. [Google Scholar] [CrossRef]
- Chen, Y.M.; Li, X.; Zheng, Y.; Guan, Y.Y.; Liu, X.P. Estimating the Relationship Between Urban Forms and Energy Consumption: A Case Study in the Pearl River Delta, 2005–2008. Landsc. Urban Plan. 2011, 102, 33–42. [Google Scholar] [CrossRef]
- Chen, D.K.; Chen, S.Y.; Jin, H. Industrial Agglomeration and CO2 Emissions: Evidence From 187 Chinese Prefecture-Level Cities Over 2005–2013. J. Clean. Prod. 2018, 172, 993–1003. [Google Scholar] [CrossRef]
- Liu, X.C.; Sweeney, J. Modelling the Impact of Urban Form on Household Energy Demand and Related CO2 Emissions in the Greater Dublin Region. Energy Policy 2012, 46, 359–369. [Google Scholar] [CrossRef]
- Miao, L. Examining the Impact Factors of Urban Residential Energy Consumption and CO2 Emissions in China-Evidence from City-Level Data. Ecol. Indic. 2017, 73, 29–37. [Google Scholar] [CrossRef]
- Lu, I.J.; Lin, S.J.; Lewis, C. Decomposition and Decoupling Effects of Carbon Dioxide Emission from Highway Transportation in Taiwan, Germany, Japan and South Korea. Energy Policy 2007, 35, 3226–3235. [Google Scholar] [CrossRef]
- The Third National People’s Congress Standing Committee (NPC Standing Committee). Resolution of the Fifteenth Session of the Third National People’s Congress Standing Committee of the People’s Republic of China. Available online: www.npc.gov.cn/wxzl/gongbao/2000-12/11/content_5000984.htm (accessed on 15 March 2021).
- The Eighth National People’s Congress (NPC). Decision of The Fifth Session of the Eighth National People’s Congress of the People’s Republic of China on Approving the Establishment of Chongqing Municipality Directly under the Central Government. Available online: www.npc.gov.cn/wxzl/gongbao/2001-02/06/content_5004679.htm (accessed on 15 March 2021).
- Circular of State Council on the Several Policies and Measures for the Implementation of the Western Region Development; The State Council of the People’s Republic of China: Beijing, China, 2000. Available online: http://www.gov.cn/gongbao/content/2001/content_60854.htm (accessed on 3 May 2021).
- Zhou, Z.B.; Liu, C.J.; Zeng, X.M.; Jiang, Y.; Liu, W.B. Carbon Emission Performance Evaluation and Allocation in Chinese Cities. J. Clean. Prod. 2018, 172, 1254–1272. [Google Scholar] [CrossRef]
- Lan, C. Analysis of Cross-Sectional Data and Panel Data with Application of STATA; Wuhan University Press: Wuhan, China, 2012. [Google Scholar]
- Pang, H. Econometrics; Science Press: Beijing, China, 2010. [Google Scholar]
- Li, Z.; Ye, A. Advanced Applied Econometrics; Tsinghua University Press: Beijing, China, 2012. [Google Scholar]
- Huge Engine-Automobile Data Strategy Institute, China Automobile Dealers Association. 2019 China Auto Consumption Trend Report. Available online: baijiahao.baidu.com/s?id=1651814311712997403&wfr=spider&for=pc (accessed on 25 March 2021).
- Liu, B.Q.; Su, X.L.; Shi, J.X.; Hou, R. Does Urbanization Drive Economic Growth Decoupled from Energy Consumption in China’s Logistics? J. Clean. Prod. 2020, 257, 120468. [Google Scholar] [CrossRef]
- Baltagi, B.H. Econometric Analysis of Panel Data; John Wiley & Sons: Hoboken, NJ, USA, 2005. [Google Scholar]


| Diesel (kg) | Gasoline (kg) | Kerosene (kg) | Fuel Oil (kg) | |
|---|---|---|---|---|
| Standard coal conversion coefficient (kg standard coal/kg, kg standard coal/kW·h) | 1.4571 | 1.4714 | 1.4714 | 1.4286 |
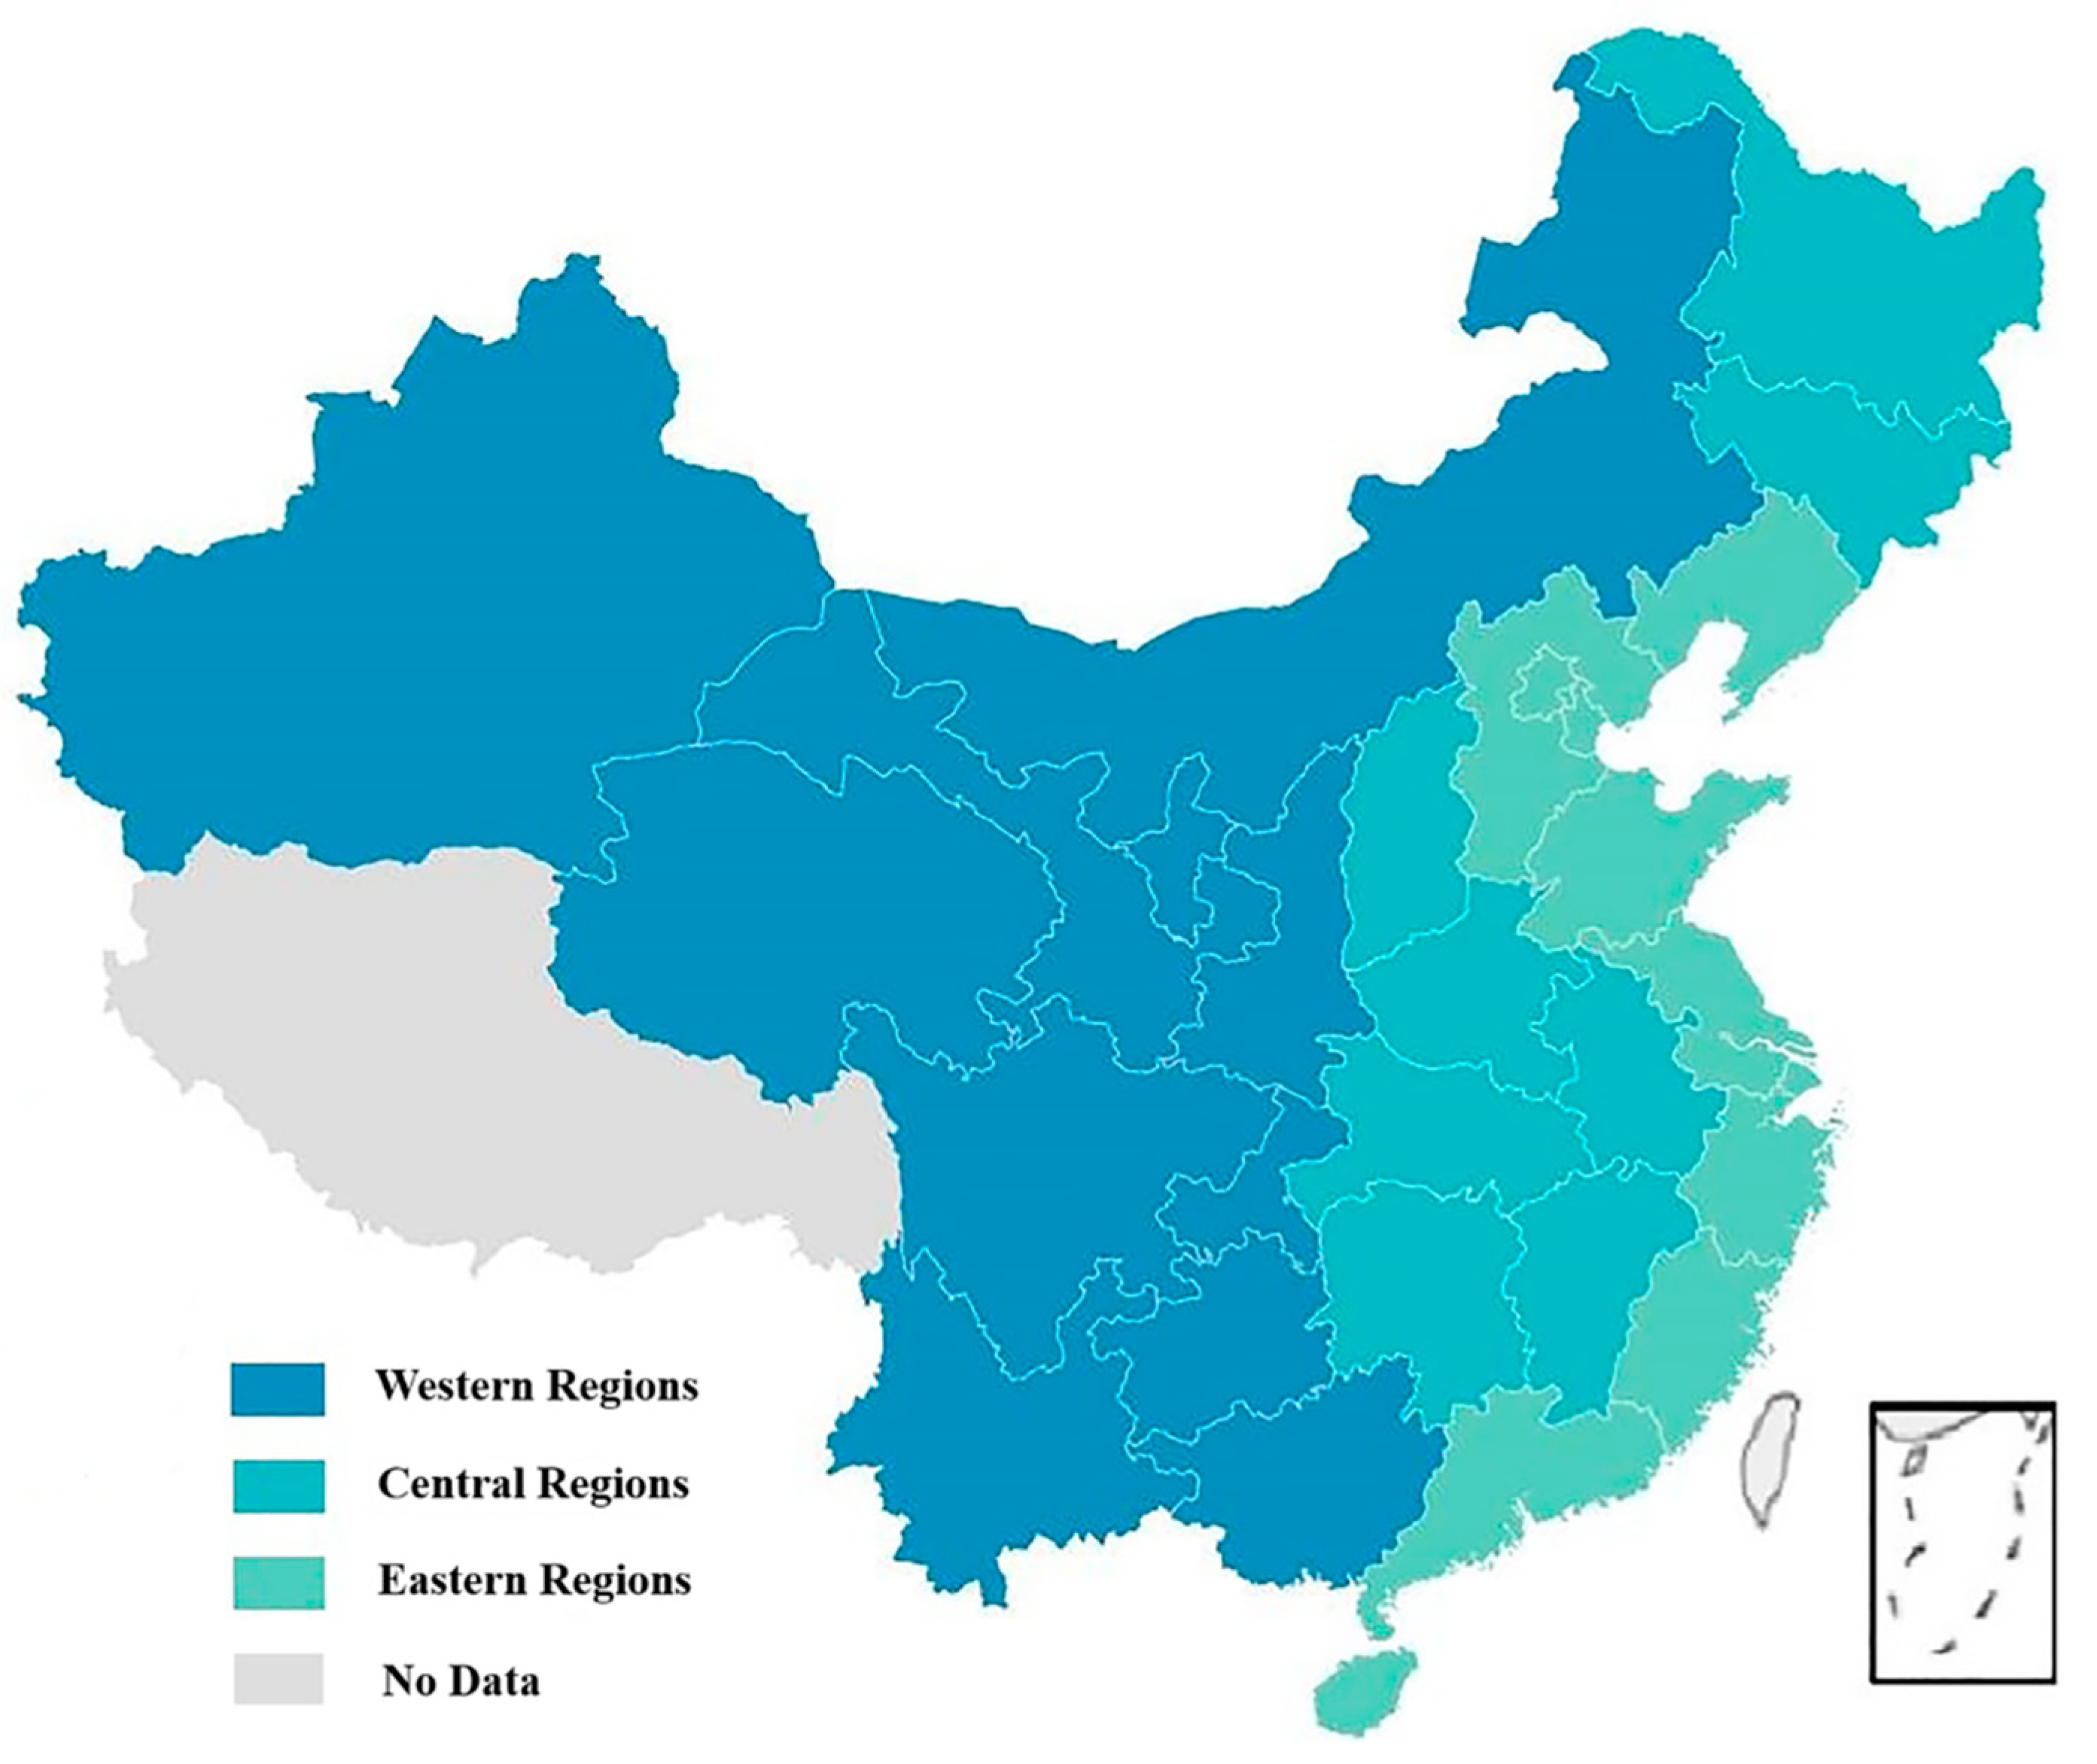
| Regions | Province |
|---|---|
| The Western Region | Inner Mongolia, Guangxi, Chongqing, Sichuan, Guizhou, Yunnan, Shaanxi, Gansu, Qinghai, Ningxia, Xinjiang |
| The Central Region | Shanxi, Jilin, Heilongjiang, Anhui, Jiangxi, Henan, Hubei, Hunan |
| The Eastern Region | Beijing, Tianjin, Hebei, Liaoning, Shanghai, Jiangsu, Zhejiang, Fujian, Shandong, Guangdong, Hainan |
| Predicted Relationship | Variable | Measurement | Symbol | Data Sources |
|---|---|---|---|---|
| Dependent variable | Transportation sector’s CO2 emissions | Per capita CO2 emissions of transportation sector | PERTRANSC | China Energy Statistical Yearbook (2009–2017) The Provincial Statistical Yearbooks of China (2018) |
| Independent variable | Express comprehensive development index | Entropy method | LEVEL | / |
| Per capita express delivery amount | Number of express deliveries per people | PEREXP | China Statistical Yearbook (2009–2018) China’s Express Market Supervision Report (2015) | |
| Number of per capita postal outlets | Number of postal outlets per 10,000 people | PEROUTLET | China Statistical Yearbook (2009–2018) | |
| Number of per capita postal workers | Number of postal workers per 10,000 people | PERWORKER | ||
| Control variable | Economic development level | GDP | GDP | China Statistical Yearbook (2009–2018) |
| Residential income level | Per capita disposable income of urban households | PERINC | ||
| Educational level | Average number of students in colleges and universities per 100,000 people | EDU | ||
| Transportation convenience level | Per capita urban road area | PERROAD | ||
| Urban population density | Urban population density | DENS |
| Variable | Observations | Mean | Std.Dev. | Min | Max |
|---|---|---|---|---|---|
| PERTRANSC | 300 | 0.677 | 0.433 | 0.183 | 3.040 |
| PEREXP | 300 | 9.383 | 14.063 | 0.453 | 100.646 |
| PEROUTLET | 300 | 1.035 | 0.701 | 0.279 | 6.772 |
| PERWORKER | 300 | 6.290 | 4.946 | 1.666 | 38.868 |
| GDP | 300 | 1.742 | 1.398 | 0.102 | 7.444 |
| PERINC | 300 | 2.163 | 0.719 | 1.097 | 5.137 |
| EDU | 300 | 0.246 | 0.091 | 0.097 | 0.675 |
| PERROAD | 300 | 14.275 | 4.461 | 4.040 | 25.820 |
| DENS | 300 | 0.280 | 0.120 | 0.065 | 0.597 |
| Variable | VIF | 1/VIF |
|---|---|---|
| PERINC | 7.19 | 0.138993 |
| PEREXP | 6.03 | 0.165840 |
| PEROUTLET | 4.39 | 0.227994 |
| PERWORKER | 2.61 | 0.383323 |
| EDU | 2.16 | 0.463452 |
| GDP | 1.92 | 0.521091 |
| PERROAD | 1.55 | 0.644326 |
| DENS | 1.23 | 0.814237 |
| Mean VIF | 3.38 |
| PERTRANSC | Model 1 | Model 2 | Model 3 | Model 4 |
|---|---|---|---|---|
| PEREXP | −0.004015 * (0.001572) | −0.004851 ** (0.001665) | ||
| PEREXP2 | 0.000068 *** (0.000014) | 0.000063 *** (0.000015) | ||
| PEROUTLET | 0.045133 ** (0.013905) | 0.030717 * (0.016833) | ||
| PERWORKER | −0.006587 * (0.002550) | −0.002469 (0.002628) | ||
| GDP | −0.029356 * (0.016414) | −0.036707 * (0.016104) | −0.034665 * (0.016396) | −0.019265 (0.017162) |
| PERINC | 0.145445 *** (0.029711) | 0.111292 *** (0.027699) | 0.180508 *** (0.021077) | 0.138671 *** (0.030976 |
| EDU | 1.113227 *** (0.246471) | 0.729109 ** (0.248665) | 0.773565 ** (0.249399) | 0.907678 ** (0.267241) |
| PERROAD | 0.006998 (0.004545) | 0.003500 (0.004382) | 0.001574 (0.004342) | 0.006143 (0.004550) |
| DENS | −0.138316 (0.118442) | −0.193122 (0.122563) | −0.136317 (0.124936) | −0.128855 (0.119241) |
| _cons | 0.096683 (0.064402) | 0.278338 *** (0.064655) | 0.213822 ** (0.062206) | 0.146975 * (0.069206) |
| N | 300 | 300 | 300 | 300 |
| R2 | 0.5486 | 0.5119 | 0.5049 | 0.5552 |
| PERTRANSC | Western | Central | Eastern |
|---|---|---|---|
| PEREXP | −0.010477 (0.009115) | −0.014347 * (0.005922) | −0.002435 (0.002373) |
| PEREXP2 | 0.000378 (0.000334) | 0.000589 ** (0.000188) | 0.000066 ** (0.000022) |
| PEROUTLET | −0.051005 (0.041871) | −0.026558 (0.039930) | 0.011096 (0.026262) |
| PERWORKER | −0.017188 ** (0.005400) | 0.012043 * (0.005345) | 0.002163 (0.003987) |
| GDP | −0.162355 ** (0.060689) | 0.047753 (0.042837) | 0.004277 (0.026462) |
| PERINC | 0.404660 *** (0.073318) | 0.188431 ** (0.067868) | 0.037854 (0.052499) |
| EDU | 1.531499 * (0.637143) | −0.990104 (0.638357) | 0.665881 (0.493087) |
| PERROAD | −0.004191 (0.005828) | 0.012429 * (0.007228) | 0.004626 (0.010422) |
| DENS | 0.021847 (0.138652) | −0.179013 (0.169463) | −0.563212 (0.487232) |
| _cons | −0.091699 (0.107081) | 0.142309 (0.112305) | 0.658457 ** (0.230239) |
| N | 110 | 80 | 110 |
| R2 | 0.7242 | 0.8003 | 0.4973 |
| PERTRANSC | Nationwide | Western | Central | Eastern |
|---|---|---|---|---|
| LEVEL | −0.682560 ** (0.214564) | −3.915887 *** (0.856920) | −1.102910 (0.709720) | −0.534226 (0.329974) |
| LEVEL2 | 1.297868 *** (0.227408) | 10.329440 *** (2.820370) | 4.216907 * (2.336949) | 1.377253 *** (0.322233) |
| GDP | −0.024993 (0.016096) | −0.227138 *** (0.053946) | 0.117520 ** (0.035542) | 0.011217 (0.024962) |
| PERINC | 0.140728 *** (0.030568) | 0.457119 *** (0.061834) | 0.088054 (0.062217) | 0.050063 (0.048996) |
| EDU | 1.396862 *** (0.251482) | 2.323015 *** (0.639382) | −1.221812 * (0.677057) | 1.062186 * (0.433681) |
| PERROAD | 0.007323 * (0.004416) | −0.006486 (0.005600) | 0.016458 * (0.007564) | 0.003764 (0.009540) |
| DENS | −0.108547 (0.118107) | −0.009297 (0.129779) | −0.031702 (0.164797) | −0.411667 (0.473889) |
| _cons | 0.041924 (0.068532) | −0.194287 * (0.092833) | 0.211694 * (0.121521) | 0.518389 * (0.220171) |
| N | 300 | 110 | 80 | 110 |
| R2 | 0.5584 | 0.7386 | 0.7720 | 0.5206 |
Publisher’s Note: MDPI stays neutral with regard to jurisdictional claims in published maps and institutional affiliations. |
© 2021 by the authors. Licensee MDPI, Basel, Switzerland. This article is an open access article distributed under the terms and conditions of the Creative Commons Attribution (CC BY) license (https://creativecommons.org/licenses/by/4.0/).
Share and Cite
Zhao, C.; Zhou, B. Impact of Express Delivery Industry’s Development on Transportation Sector’s Carbon Emissions: An Empirical Analysis from China. Sustainability 2021, 13, 8908. https://doi.org/10.3390/su13168908
Zhao C, Zhou B. Impact of Express Delivery Industry’s Development on Transportation Sector’s Carbon Emissions: An Empirical Analysis from China. Sustainability. 2021; 13(16):8908. https://doi.org/10.3390/su13168908
Chicago/Turabian StyleZhao, Chang, and Boya Zhou. 2021. "Impact of Express Delivery Industry’s Development on Transportation Sector’s Carbon Emissions: An Empirical Analysis from China" Sustainability 13, no. 16: 8908. https://doi.org/10.3390/su13168908
APA StyleZhao, C., & Zhou, B. (2021). Impact of Express Delivery Industry’s Development on Transportation Sector’s Carbon Emissions: An Empirical Analysis from China. Sustainability, 13(16), 8908. https://doi.org/10.3390/su13168908