Article

Environmental and Social Dynamics of Urban Rooftop Agriculture (URTA) and Their Impacts on Microclimate Change

by
Musammat Shahinara Begum
1,2,*,
Sujit Kumar Bala
1,*,
A.K.M. Saiful Islam
1 and
Debjit Roy
3
1
Institute of Water and Flood Management (IWFM), Bangladesh University of Engineering and Technology (BUET), Dhaka 1000, Bangladesh
2
Survey and Investigation Division, Irrigation Wing, Bangladesh Agricultural Development Corporation (BADC), Dhaka 1000, Bangladesh
3
Irrigation and Water Management Division, Bangladesh Rice Research Institute (BRRI), Gazipur 1701, Bangladesh
*
Authors to whom correspondence should be addressed.
Sustainability 2021, 13(16), 9053; https://doi.org/10.3390/su13169053
Submission received: 4 July 2021 / Revised: 29 July 2021 / Accepted: 6 August 2021 / Published: 12 August 2021

Abstract

:
Urban cities are facing the challenges of microclimatic changes with substantially warmer environments and much less access to fresh vegetables for a healthier food supply than in adjacent rural areas. In this respect, urban rooftop agriculture is considered as a green technology for city dwellers and the community to attain environmental and socioeconomic benefits in a city. For this purpose, a roof top of 216 square meters was selected as an experimental plot where 70% of the area was covered with the selected crops (Tomato, Brinjal, Chili, Bottle Gourd and Leafy vegetables such as Spinach, Red Spinach and Water Spinach; they were cultivated under fencing panels of Bottle Gourd). The microclimatic parameters such as air temperature, near roof surface temperature, indoor temperature and relative humidity and carbon dioxide concentration from different locations of the agricultural roof and from nearby bare roofs were observed during the whole experimental period (November 2018–May 2019). Five existing rooftop gardens with green area coverages of 40, 50, 60, 80, and 85% were selected, and 5 bare nearby roofs were also selected through field visits and questionnaire surveys of 200 existing rooftop gardens. The air and ambient temperature, cooling degree day and energy saving trends were assessed for the selected roofs. The economic assessment was carried out through the net present value and internal rate of return approach of urban rooftop agriculutre. The results showed that the temperature was reduced from 1.2 to 5.5% in different area coverages of agricultural roofs with plants compared to the nearest bare roofs. For the time being, the cooling load was decreased from 3.62 to 23.73%, and energy saving was increased significantly from 5.87 to 55.63% for agricultural roofs compared to bare roofs. The study suggested that the value of urban rooftop agriculture was high environmentally and economically compared to the traditional bare roof, which would be an added amenity by the city dweller’s individual motivations and state interests, and it could be aligned to achieve a more sustainable city.

1. Introduction

In a phase of global warming, the urban warming effect is likely to be amplified, especially increasing human discomfort during summer. The local warming, caused by the urban heat island (UHI), significantly increases temperatures as well as economic losses in addition to global warming [1]. The rapid urbanization process plays a key role in the formation of UHI as well as global warming, which impacts the urban quality of life [2,3]. Due to high economic growth and improved living standards, energy demand in urban cities is rising for increasing electricity consumption, mostly for using air conditioning systems in urban buildings [4,5,6,7]. Therefore, finding a way to reduce energy consumption with respect to the cooling load can significantly reduce the heat burden directly and greenhouse emissions indirectly. For colder days (25 °C or 77 °F), a 1 °C increase in daily temperature leads to a 14.5% increase in electricity consumption [8,9,10]. Urban warming could lead to double the economic losses expected from human-caused climate change, and it would be probably comparable to about half of the warming caused by climate change by the year 2050 [11,12,13,14]. Daily minimum temperature readings at related urban and rural sites frequently show that the urban sites are 6 °C to 11 °C (10 °F to 20 °F) warmer than the agricultural sites [15,16]. However, the overheating of both urban building roofs as well as wall surfaces negatively affect the indoor air temperature, which is a crucial factor impacting urban warming, building energy consumption and occupant welfare [17,18,19,20]. In summer, urban masonry and asphalt capture, store and reradiate more solar energy per unit area than the vegetation and soils of rural areas [21]. Furthermore, less of this energy can be used for evaporation in urban areas, which characteristically exhibit greater precipitation runoff from streets and buildings [22,23]. At night, radiative losses from urban buildings and street materials keep the city air warmer than that of rural areas. In addition, human cultural and economic activities have distinctive effects on urban climate warming [24].
Based on the observations of different studies, the air temperatures under green roofs are cooler than normal roofs at least by 3 °C to 4 °C. A study in the city of Toronto also found that an entire typical residential building with a green roof experienced a 25% cooling effect, while the floor below the green roof had a 60% cooling effect [25]. Hence, roof gardens have the potential to act as insulation for the roof because of the heat exchange with the outside environment [26]. Green roofs reduce a huge amount of heat absorption in summer. Thus, less energy is required to keep the indoor air cool [27,28].
Greenery vegetation activities such as urban rooftop agriculture (URTA) are turning out to be a very effective adaptation tool to cool down UHI [19,29]. URTA is a complex interaction between natural systems and human activities [30]. URTA helps to improve the environmental quality and the economic conditions of city dwellers and has the potential to provide fresh vegetables to people for a healthier food supply [31,32]. URTA not only produces and distributes food, but also reduces carbon footprints for urban activities through the energy-saving, efficient management of building resources [33]. Conversely, most of the existing research is based on green version approaches such as parks, gardens, green roofs, green façades/walls, porous the diversion pavements and green and blue belts in the context of urban development and of the potential impacts of global climate change from the city center [34].
Dhaka is a mega city that is about to become the sixth largest city in the world with a estimated population of about 27 million by 2030 [35]. Global warming will increase the severe UHI conditions in Dhaka by creating heat stress, and that will affect Dhaka’s quality of life [36]. As a result, Dhaka is anticipating the challenges of having fresh food, water security, healthy lives and a cleaner city to achieve Sustainable Development Goals (SDGs) 2, 6 and 11 [37,38]. On the contrary, rooftop gardens/agriculture have very high social recognition (85%) and is commonly practiced in Dhaka, and it has good economic prospects [39]. However, there is a research gap about the cooling effect of different crop types in URTA, the crop area coverage percentage of URTA and the fresh food production potential of URTA. No previous study has testified based on either roof area coverages by plants or microclimatic parameters dynamics of cooling load.
Addressing the above research background, the objectives of this study were set to: (1) assess the dynamics of microclimatic parameters of ARs and BRs during the cooling period in Dhaka to mitigate the UHI effect; (2) quantify the role of URTA on energy saving through different area coverages of roofs; and (3) summarize the benefits and social impacts of URTA. This study aims to provide a widespread prospect assessment of URTA in the Dhaka Metropolitan Area (DMA).

2. Materials and Methods

2.1. Study Area and Research Design

Dhaka is a mega city and the capital of Bangladesh, having an area of 1463.60 sq km, boundaried by the Gazipur, Tangail, Munshiganj, Narayanganj, Manikganj and Faridpur districts (Figure 1a,b). The foregoing areal expansion of Dhaka with its dense population has triggered the processes of land transformation because of the growth of urbanization. It is also responsible for the physical and environmental instability of that area. Due to fast urbanization, it is facing the loss of natural vegetation, loss of open spaces and a general decline within the spatial extent and connectivity of wetlands and wildlife habitat. The city of Dhaka is rapidly growing in terms of both population and extent. It is becoming the center of the country’s industrial, commercial, cultural, educational and political activities. That is why Dhaka is becoming a warmer city compared to the rural areas. In this regard, the present study was conducted through URTA within the DMA from November 2018 to May 2019. The experimental plot of AR was designed on the roof of the Department of Agriculture, Sher-e-Bangla Agricultural University (SAU), Dhaka, Bangladesh, to cultivate the selected crops (Tomato, Brinjal, Chili, and Bottle Gourd and leafy vegetables) (Figure 1c). The height of the institutional building roof was about 50 ft (about 15 m). The area of the experimental plot was 216 m2, 18-m long and 12-m wide, which is physically significant for such experiments (Figure 2). Thus, a completely randomized design (CRD) was used for designing experimental plots of AR in such a way that at least 70% of the roof area was covered with the selected crops (Tomatoes—16%, Brinjall—15% Chilli—13%, Bottle Gourd—25% and Recreational room—2.3%) (Figure 3). Similarly, 216 m2 BR was also selected near the experimental AR. However, two rooms were covered with the experimental AR below it and two rooms below the BR, which were also considered in this study. On the other hand, 5 existing rooftop gardens or ARs with an area coverage of 40, 50, 60, 80 and 85% by agriculture and 5 nearby BRs were selected through a survey of 200 existing private rooftop gardens within the DMA. However, the experimental AR was divided into 10 rows to organize URTA with those crops in 150 plastic drums. The drip irrigation method was used for cultivation, and Bottle Gourd was cultivated around the experimental plot using fencing panels. Below the fencing panel, leafy vegetables such as Spinach, Red Spinach and Water Spinach were cultivated in 8 wooden frames where the area of each wooden frame was 2.23 m2. Soil was specially prepared with cocoa dust and vermicompost (2:1:1) and plant center to center spacing of those crops was maintained as per the Bangladesh Agricultural Research Institute’s (BARI) recommended guidelines.
This research was divided into the following two sections: Section 1 and Section 2. Section 1 was devoted to the assessment of the thermal environment changing due to URTA according to the different area coverage of the roofs (temperature, relative humidity and carbon dioxide) and effects on energy saving using cooling degree days (CDD) technique. Section 2 was intended to carry out an assessment of the socioeconomic impacts of URTA with experimental study and also from open-end questionnaire surveys of 200 existing rooftop gardens. The survey was conducted within the DMA, and rooftop gardens were selected randomly in the specific area. It was done by survey through oral interviews of the building/rooftop garden owner to gather more in-depth information, opinions and preferences. The role of food production, priorities of involvement of women, choices of multiple crops, promotion or popularization, growth and trends and economic strengths or values of URTA, etc., were considered in the study to clarify the social dynamics of URTA.
On the other hand, a suitable and easy handling drip irrigation system was set in the entire plot area to deliver the right amount of water from the source of portable water storage with free pumping energy at the root zone of each plant at a regular interval [Figure 2]. The drip irrigation system prevented the plants from suffering stress or strain of under and overwatering. The research study was implemented in four main phases: (i) plot and soil preparation, (ii) fieldwork, (iii) data collection and (iv) analysis. The study roof was selected as it was most suitable for carrying out the daily research and for collecting the regular data. Then, the growing medium, i.e., soil, was prepared according to the suggested ingredients and then put in the container. The selected existing five greenery roofs showed many similarities in plant types and materials used except for some characteristics as orientation and disguise phase. All the height of building roofs were also similar (50 ft from the ground) and were made of concrete bricks with a plaster coating and a waterproofing system. The microclimatic environmental variations in terms of temperature and relative humidity were measured for the selected greenery roofs. In addition, three main actors involved in this study as a means to understand the in-depth socio-spatial characteristics and specific social practices of URTA. Moreover, the social practices were also studied through continuous, direct observation by visiting the five selected existing gardens two times per week for three months.

2.2. Methodology

2.2.1. Temperature, Relative Humidity (RH) and Carbon Dioxide (CO2) Concentration Measurements

The primary data such as air temperature (AT), near roof surface temperature (RST), relative humidity (RH) and carbon dioxide (CO2) data were collected from the middle part of the experimental AR plot and from four middle locations of the east, west, south and north edges of the experimental AR plot. Temperature-RH-CO2 measuring data loggers (HUATO, S653) were used to measure temperature, RH and CO2 concentration. It was done 5 days per week from November 2018 to May 2019 from the experimental AR and nearby BR at 9:00 a.m., 1:30 p.m. and 5:30 p.m. A digital compact infrared thermometer with a 4-h interval was also used for the measurement of roof surface temperature. The temperature was measured near the roof surface 1 m, 1.5 m and 2 m above from roof surface for both AR and BR for the same height. However, all data (except at 2 m) were collected from below the shaded of the canopy layer of plants so that direct solar radiation could be avoided. The temperature was also measured from the selected five existing ARs and top floor room at 1.5-m height above the roof surface. At the same time, temperatures were measured from the middle of the top floor room of the selected 6 BRs near the experimental AR. RH and CO2 data were collected only at 1.5-m height above the roof surface for the URTA roof and comparatively to the adjacent BRs in this study. All data were collected at 1.5 m above the roof surface because the average minimum height and branch density of those selected crops varied from 0.9 m to 1.5 m due to human comfort breathing at this height in Bangladesh context [40]. The ambient temperature data from the top floor room under the experimental AR and the BR were also collected for comparing the thermal variation among them.

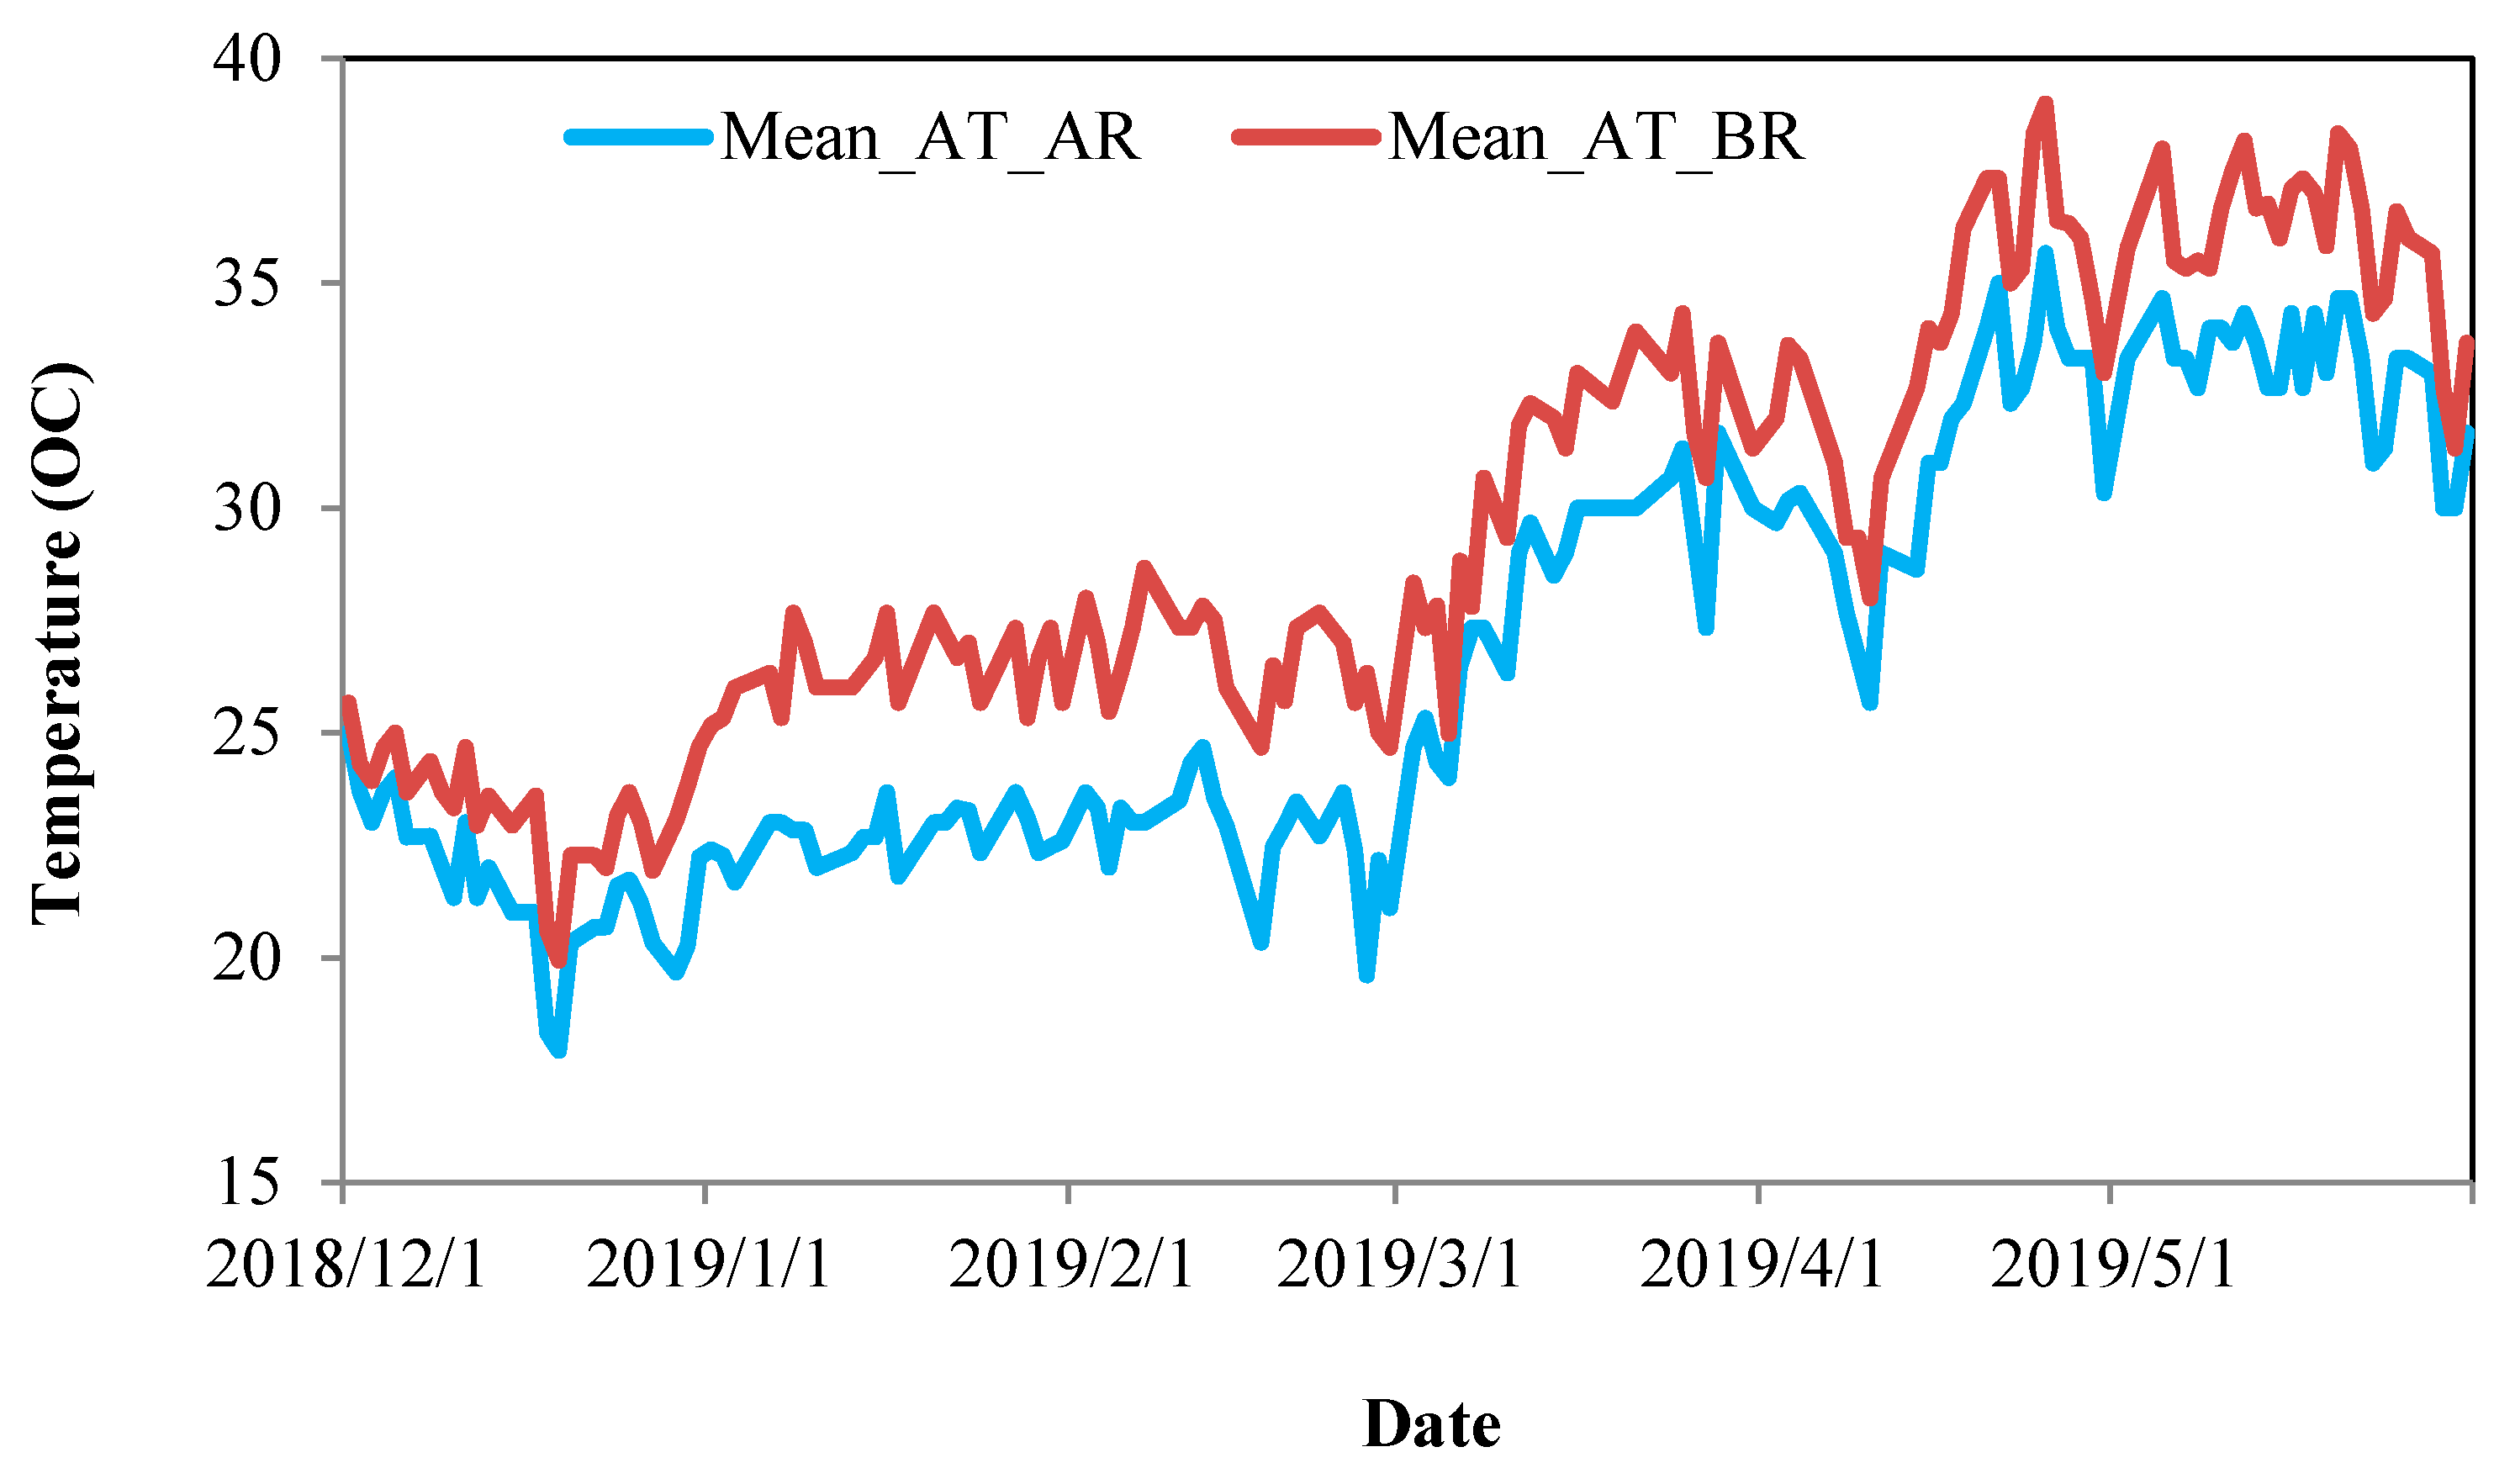
2.2.2. Temperature Trend Measurement of Soil in the Container and Air under URTA

The temperature trend in the container was measured in the URTA at the lower, middle and upper portion of the container. At the same time, the temperature in the land was measured for the same height of the lower middle, and upper portion of the container for comparing the trend of temperature and find out the cause of roof cooling by URTA. Temperatures were measured at 0.8 m, 1 m, 1.5 m and 2 m from the roof surface to find out the temperature trend in URTA during the whole experiment period for 9:30 a.m., 1:30 p.m. and 5:30 p.m. daily.

2.2.3. Cooling Degree Day (CDD) Calculation

The degree-day approach was directly proportional to a difference between the mean daily temperature of ambient air and indoor temperature. The higher the CDD, the higher was the energy requirement for cooling. Considering the average outside temperature of Dhaka during the summer season, the base temperature for cooling comfort (Tbase) was 20 °C [41]. In this study, the principles of CDD were used to study the energy consumption of URTA-containing buildings in Dhaka. About 40–85% area coverage scenarios were explained and calculated for the trend of energy consumption. We determined the corresponding energy and cost savings in those selected URTA locations across Dhaka. The CDDs were calculated for six URTA roofs based on roof area coverage by plants. However, the optimal area coverage and plant density worked as an insulation thickness. A function of CDD and the pay back period of the URTA, as well as insulation costs and other costs, were analyzed, which addressed the comparison between URTA roofs and roofs without URTA. The following equation was used for the calculation of the CDD. If Tmax < Tbase, CDD = 0; If the average value of the minimum and maximum temperature below the base temperature, then the corresponding values of the daily and monthly CDD was calculated by the following formulas (Equations (1) and (2)):
If, (Tmax + Tmin)/2 < Tbase, then CDD = (Tmax + Tbase)/4
If, Tmin > Tbase, then CDD = (Tmax + Tmin)/2 − Tbase
where Tmax, Tmin, Tbase and CDD are the maximum temperature, minimum temperature, base temperature and cooling degree day, respectively.

2.2.4. Overall Heat Transfer Coefficient Calculation

The overall heat transfer coefficient, U, may change because of variations in inflow conditions and fluid properties. For steady-state conditions, the rate of heat flow per unit area through a compound element, such as in the AR, was estimated by the following Equation (3) and heat flow through the BR was calculated by the following Equation (4):
U = 1 R = 1 R cp + R sl + R soil + R p
U = 1 R 0 = 1 R cp + R sl
where ∑R (m2K/W) is the total resistance (the sum of individual resistances), R0 is the thermal resistance of BR, Rs is the thermal resistance of soil with 40% moisture content, Rcp is the thermal resistance of cement plaster, Rsl is the thermal resistance of slab and Rp is the thermal resistance of small plants. R-value of different layers of an AR is given in Table 1.

2.2.5. Cooling Load and Energy Saving Calculation

The total cooling load on a room or building consists of internal loads. The external loads contain heat transfer by conduction through the building walls, roofs, floors, doors, etc., heat transfer by radiation through fenestration such as windows and skylights. The load due to heat transfer through the envelope is named as the external load, while all other loads are called indoor loads. In the case of an internal load of a building, the cooling load is required, especially for internal heat-generating sources such as occupants, lights or appliances. The proportion of external versus internal load varies with building type, site climate and building design. Since the surrounding conditions are highly variable on any given day, the cooling load of an outside-loaded building varies extensively. Apparently, from the energy production and economics points of view, the system design approach for an externally loaded building is a very important issue. Peak load calculations evaluate the utmost load to size and choose the refrigeration equipment. The energy analysis program compares the entire energy use during a certain period with various alternatives so as to work out the optimum one. In this study, Cooling Load Temperature Differential (CLTD) through the roof (URTA roof and BR) was derived and used tabulated data to simplify the calculation process. The basic conduction equation for warmth gain is:
Q = U A ∆T
where Q (W/m2) is the rate of heat flow per unit area through a compound element and ∆T (K) is the temperature difference. For steady-state conditions, the rate of heat per unit area between each surface is the same. The heat gain is converted to cooling load using the space transfer functions (sol-air temperature) for the rooms with light, medium and heavy thermal characteristics. The equation is modified as [46]:
Q = U ∗ A ∗ (CDD)
where Q = cooling load (W/m2) is the rate of heat flow per unit area through a compound element; U = Coefficient of heat transfer of roof or wall or glass, W/m2K; A = area of the roof in m2 (% of the area covered by plants, soil, plants with soil and bare are shown in Table 2); and CDD = cooling degree day temperature difference (k). In this study, in the case of overall heat transfer coefficient (U) calculation, the area covered by plants and soil was considered from the survey of existing roofs and experimental roofs.
Here, the area covered by soil with plants represent the total area of roof covered by soil with the container or growing medium of plants, and only plants represent the area covered by a leaf of plants that were free from the container or growing medium. Surface temperatures were also measured on the AR under the plants (t2) and over the plant (t1) cover and room below the roof’s temperature (t3). On the other hand, at the BR surface, temperatures measured on the roof surface (t1) and the room below the roof’s temperature (t2) were used in the calculation of U. Total amount of energy consumption for air conditioning is calculated by the following equation:
Ew = Q w C op
where Q (W/m2) is the cooling load or heat transmission through the roof (W/m2), and Cop is the co-efficient of performance of air conditioning system and is the ratio of useful heating or cooling provided to work required. In this study, Cop is calculated by the following Equations [47,48]:
C op = T base T base T mean
where T base is the preferred human comfort temperature as 20 °C, and Tmean is the daily average value of room temperature.

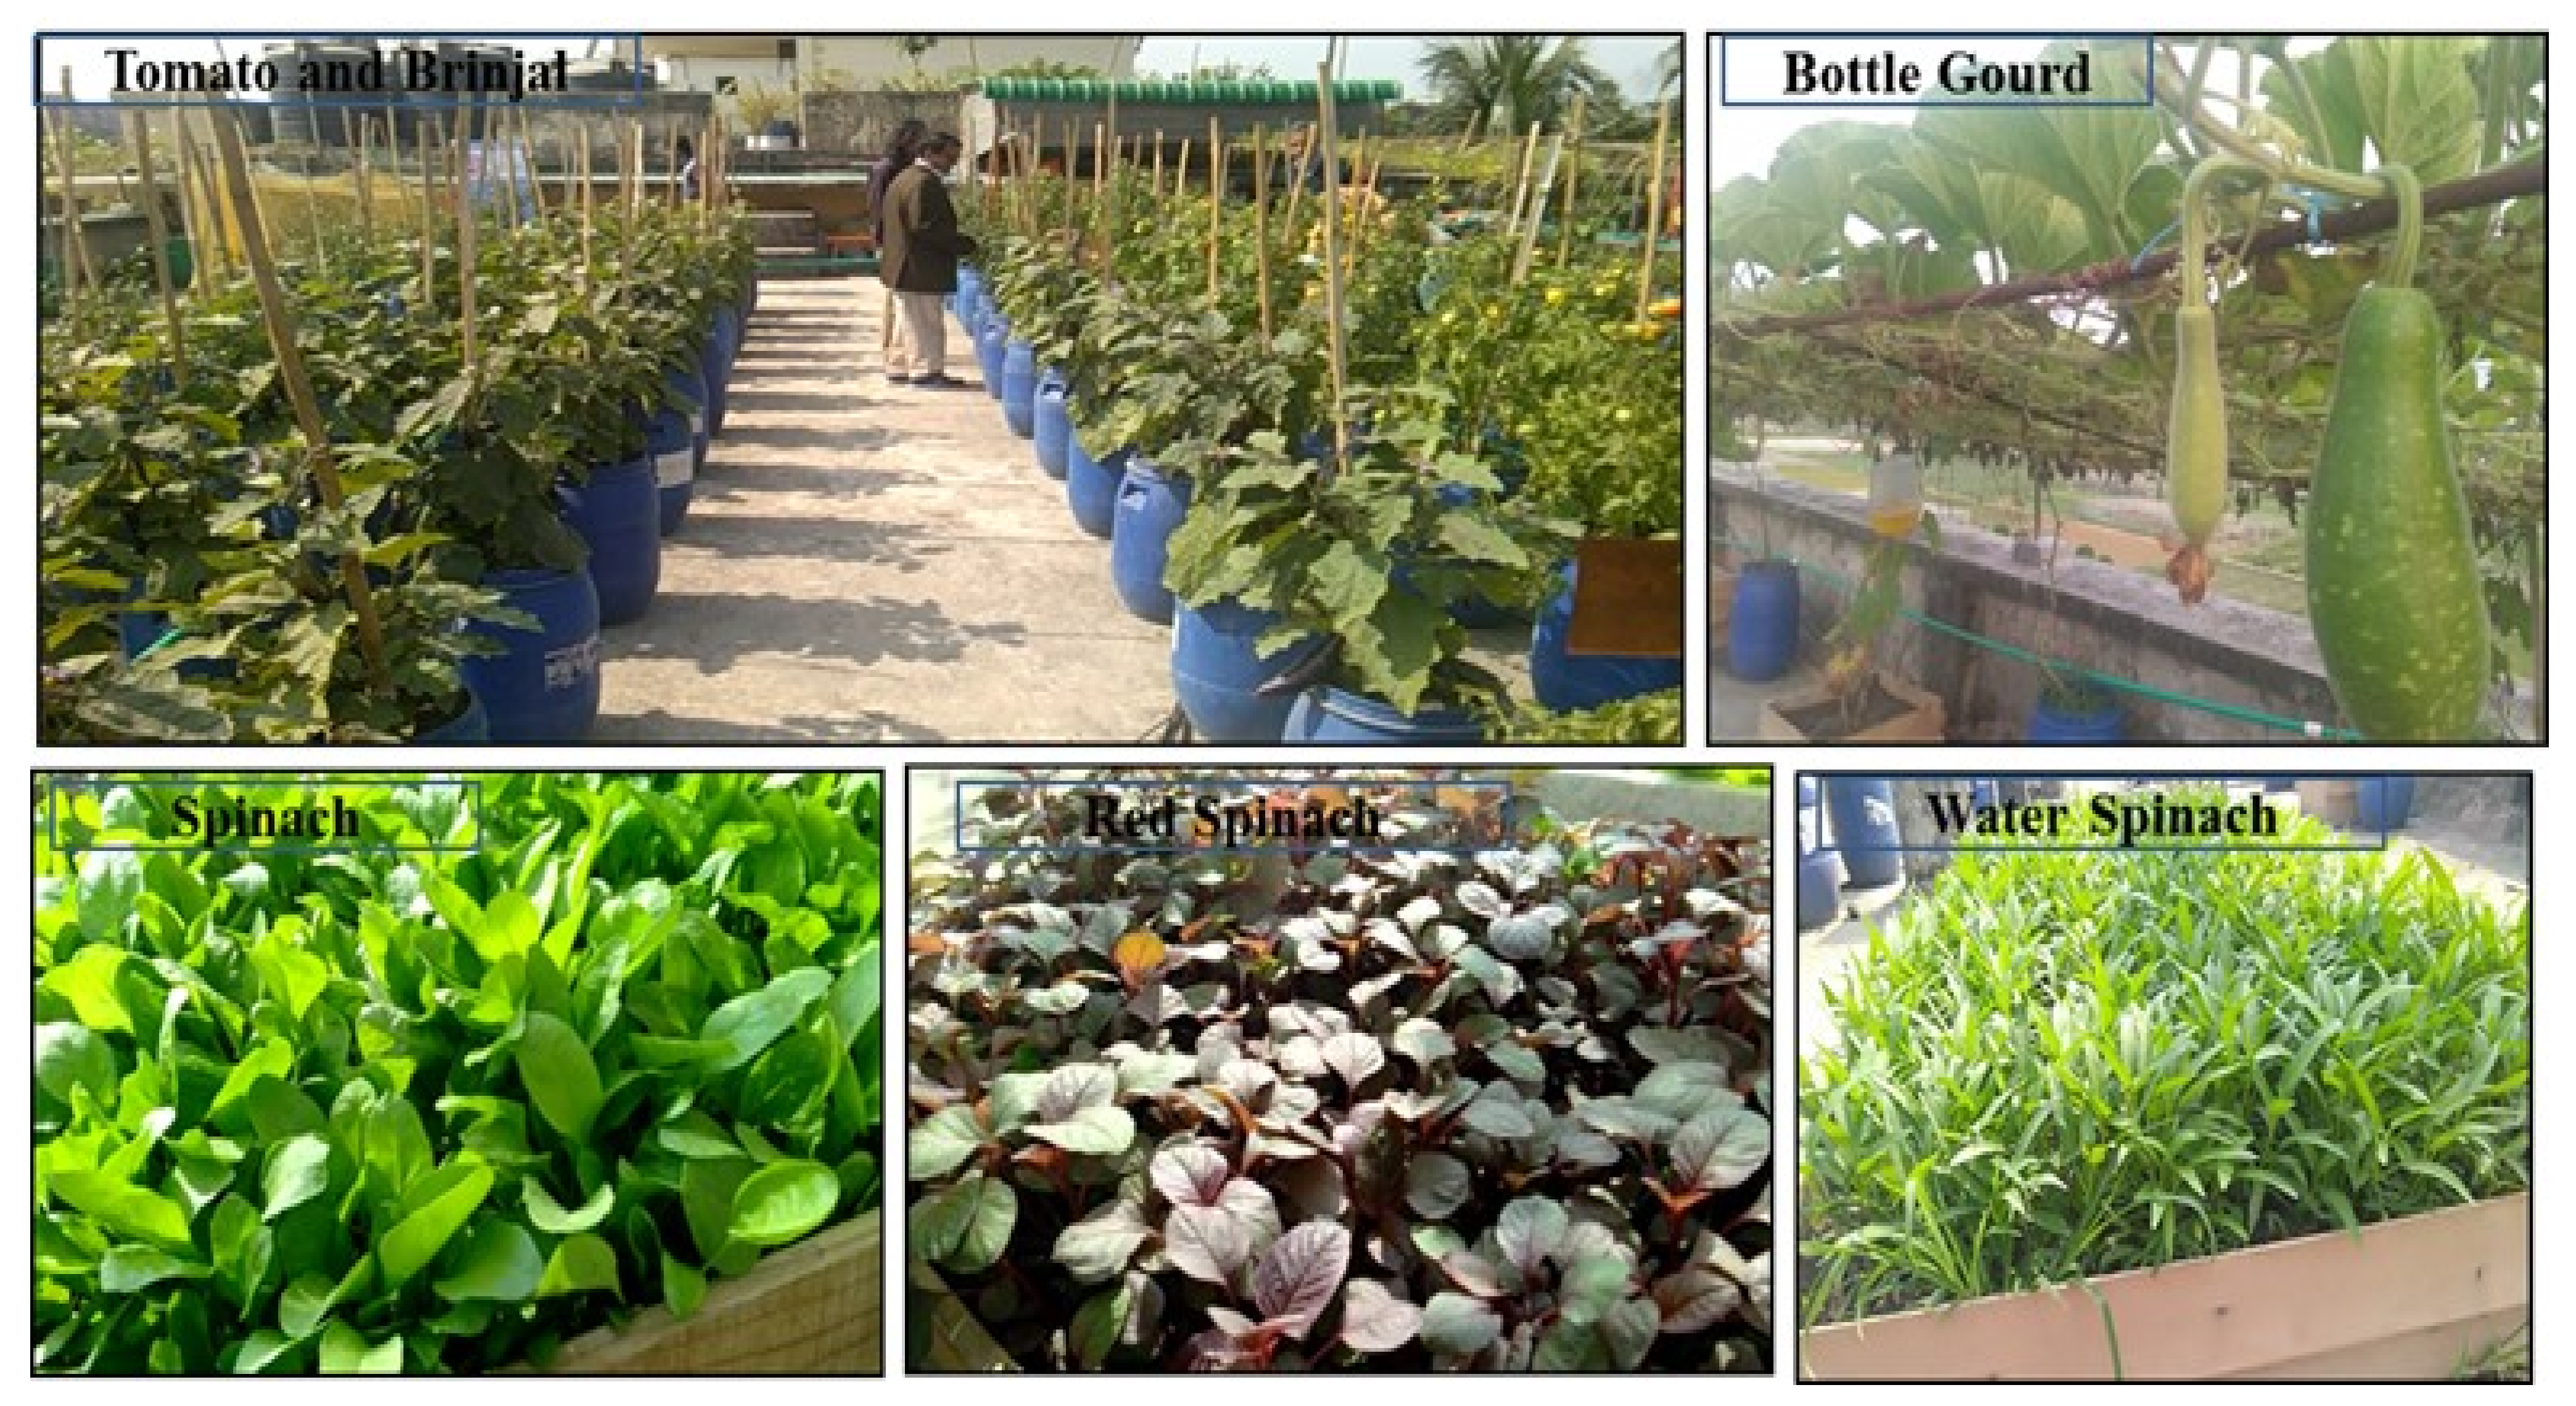
2.2.6. Analysis of Yield and Commercial Value of Selected Crops in the URTA

The Yield cash flow quantifies the economic value of the outputs of rooftops’ productive use, i.e., of food harvested or energy generated. In the food production scenarios for the selected crops, two seasons (summer and winter) were considered in this analysis. The values of food supply chains (long and short) in the URTA system, where crops were distributed from gardeners to vendors or consumers, were also calculated at the average local market selling price. Planting pots or growing mediums of existing URTA (typically consisting of shallow, free-standing blue plastic drums, wooden boxes, bottles, tins, drums, jutes and plastic bags) were also categorized. Bottle gourd, Tomato and Brinjal were cultivated in two seasons (winter and summer, from November 2018 to May 2019). After completing the winter season, the maximum root zone depth and area were measured, and the container size was selected in the next summer season and winter season based on the first year winter season findings. Similarly, the vegetative area and yield of those crops were also calculated and compared between these two setups.
The weight of each Tomato, Brinjal, Chili and Bottle gourd was measured by a digital weighing machine, and then the total weight of those selected crops was calculated later. For the second year experiment, the Bean was grown in those experiments using the same size of the plastic drum that was used during the first year experiment of Bottle gourd. Several leafy vegetables were considered for this study, including the Spinach, Red Spinach, Water Spinach and Green Spinach, for vertical cultivation as well as for bed cultivation of those vegetables since they were under the fencing panel of Bottle gourd and Bean. The potential crop yields of selected crops in the experimental AR were calculated, and an average sell price in BDT/m2 from the yearly production was estimated for two seasons to assess the economic benefit and recognize the commercial value of URTA.

2.2.7. Economic Analysis of URTA

Environmental and social benefits of ARs require quantitative appraisals to estimate the financial benefits. However, information on such benefits is not yet commercialized and are mostly individually based on regular conventions. The assessment presented here took into account several accessible sources that justify the economic rewards of URTA. In this study, URTA was implemented with 70% area coverage (on experimental Ars) with the selected crops, as mentioned above. The cost and benefit included two levels: (a) direct effects incurred by the operators of the systems, i.e., investment costs, operation costs and profits generated from yields; and (b) societal effects on the local community, such as market impacts (household savings in food expenses, local jobs creation) and environmental impacts (AR-enhanced air quality, AR habitat creation and mitigation of UHI effect and energy savings) were considered for economic analysis (Table 3). The potential costs and benefits of a proposed strategy or initiative and, ultimately, its feasibility was the output of an economic evaluation. A systematic process for decision making and trade-offs was also the alternative comparison of economic analysis of URTA. The tests of net present value (NPV), Profitability Index (PI) or Cost-Benefit Ratio (BCR), Internal Rate of Return (IRR) and the payback period, i.e., the period of time required before total revenues equal or surpass total costs for the first time, are the standard methods for economic analysis of any kind of project/firm/scheme. In this study, NPV and IRR were considered for evaluating the feasibility of URTA. NPV defined as the change between the present value (PV) of cash outflows and the PV of cash inflows over a period of time. IRR is a calculation used to estimate the profitability of potential investments or the discount rate at which NPV is zero. The preferred profitable and viable condition of a project is sustained when NPV > 0. In this study, the roof option with the highest NPV and highest IRR indicated the preferred option of URTA. However, Life Cycle Cost (LCC) was considered during the analysis, which was the cost that was associated with the rooftop agricultural firm from the beginning of the project/firm to the end of its useful life, which was considered as 30 years. In this study, NPV is calculated by the following formula [49]:
NPV = C i + t = 1 n F t 1 + r t
where,
  • Ft = net cash inflow-outflows during a single period;
  • r = discount rate or return that be earned in alternative investments;
  • Ci = initial investment cost of all setups of URTA;
  • t = number of years within the time periods of first instalment of URTA, generally computed yearly for which the economic evaluation is desired (15 years for this study).
However, if the present value of future cash flows from a likely project using the internal rate as the discount rate, which is subtracted out from the original investment, the net present value would be zero. IRR will be bigger than the discount rate of return (r) for the accepted project. In this research, the discount rate was considered as 12% for calculating NPV based on the Bangladesh government project plan implementation guideline. The payback period means the period of time that a project requires for recovering the money invested in it as well as the life span of the URTA system including all installed material. The payback period is calculated by the following formula:
Payback   Period = Investement Net   annual   cash   Inflow
Table 3. Sources for net present value (NPV) computation parameters.
VariableValueSource
The installation cost of URTA system including (i) installation of irrigation system and fencing panels, (ii) containers and other concrete structures, (iii) electrical equipment (light, fan, Wi-Fi connection) soil, conduct, varmicompost and equipment needed) BDT 1460 per square meterLocal practitioners
Annual operations and maintenance cost BDT 120 per square meter for 150 mLocal practitioners of Bangladesh
Annual irrigation cost (source: Groundwater) BDT 8.7/m2 and BDT 15.7/m2 for vertical agricultureDhaka Water Supply and Sewerage Authority (DWASA), Bangladesh
Annual irrigation cost (source: Rainwater and grey water)------
Total cost for the starting year ------
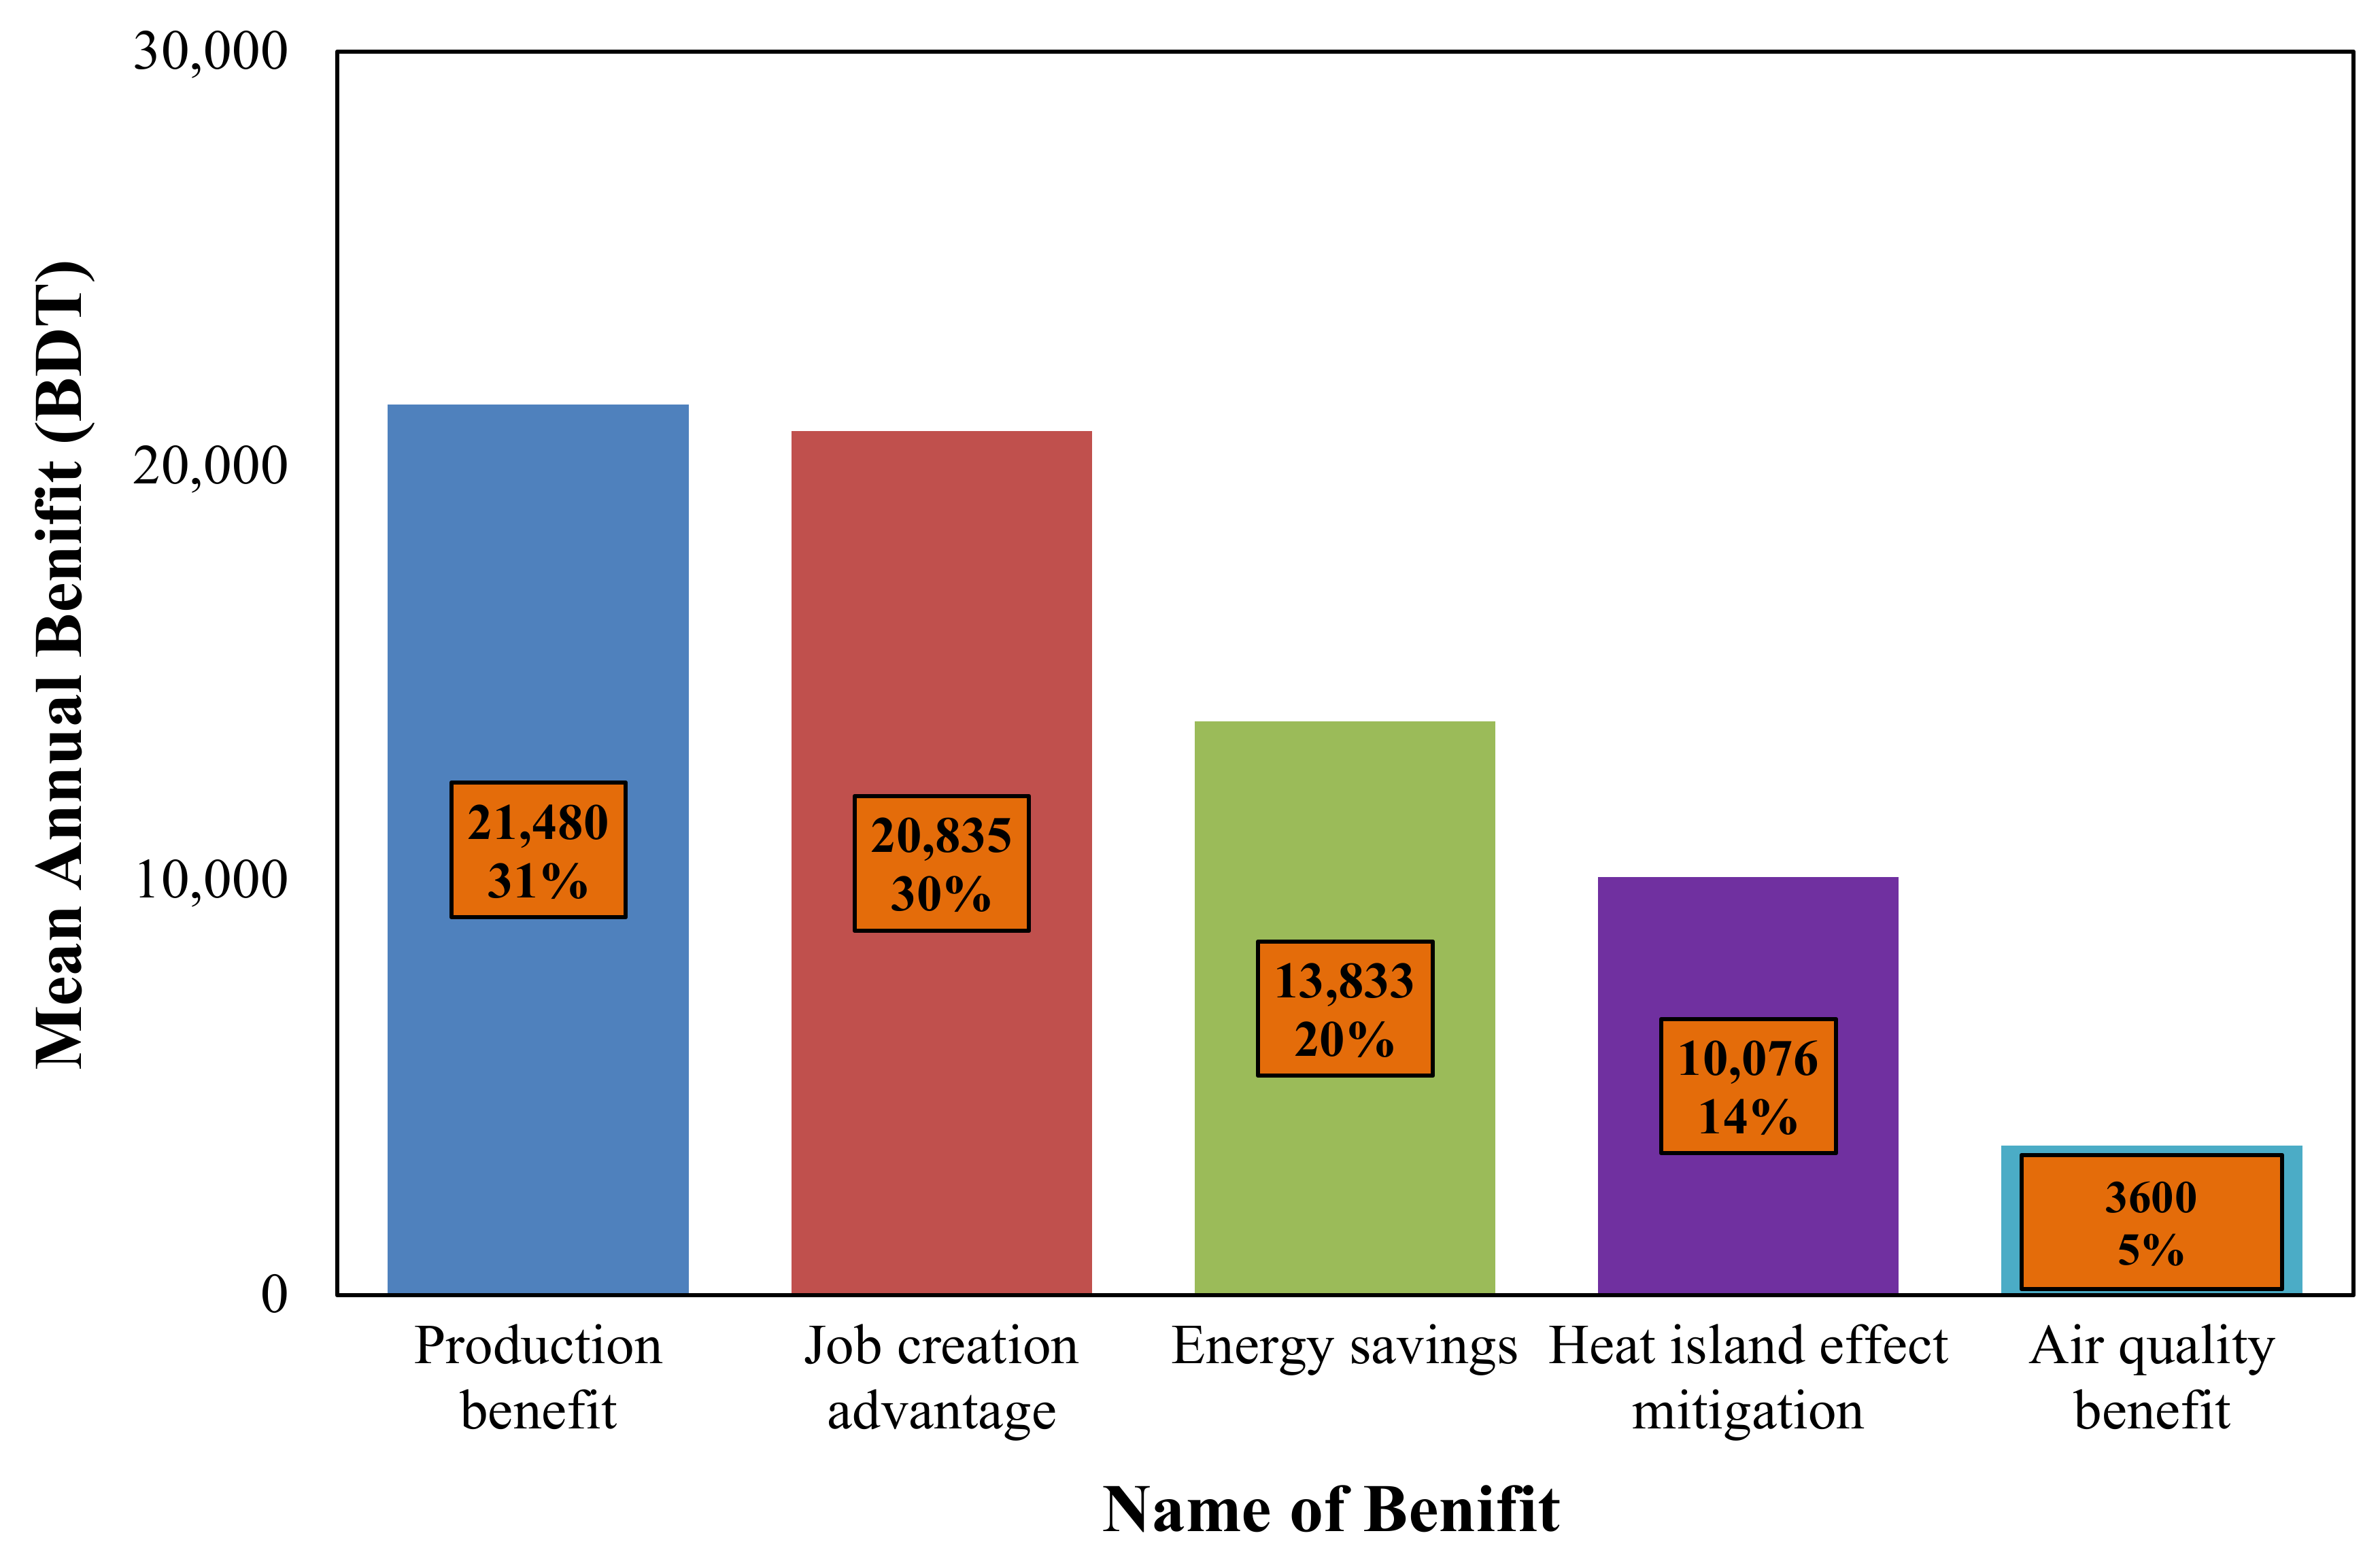
Annual fresh food production benefit (summer and winter season, shown in table)BDT 138.90/m2Local practitioners of Bangladesh
Annual Energy consumption benefit BDT 184.45/m2Local practitioners of Dhaka Power Distribution Company Ltd. (DPDC) in Bangladesh energy consumption tariff
AR-enhanced air quality advantage BDT 2/m2[41,50]
Job creation advantage BDT 138.90/m2Local practitioners of Bangladesh
Mitigation of heat island effect BDT 67.17/m2[51,52]
The total irrigation cost has been calculated from the total water requirement (mm) of the selected vegetables and figured the amount of cost based on the tariff of Dhaka Water Supply and Sewerage Authority (DWASA), Bangladesh, from the total amount of water. The cost of yearly energy savings was computed through the multiplication of the simulated energy savings in kWh/m2, the total area of the roof, and the energy consumption tariff in Bangladesh. The net cash flows were computed yearly and were assumed to be constant over the investment lifetime. Labour requirements were also considered in the study on the economic evaluation of URTA.

3. Result and Discussion

3.1. Environmental Dynamics of Urban Rooftop Agriculture (URTA)

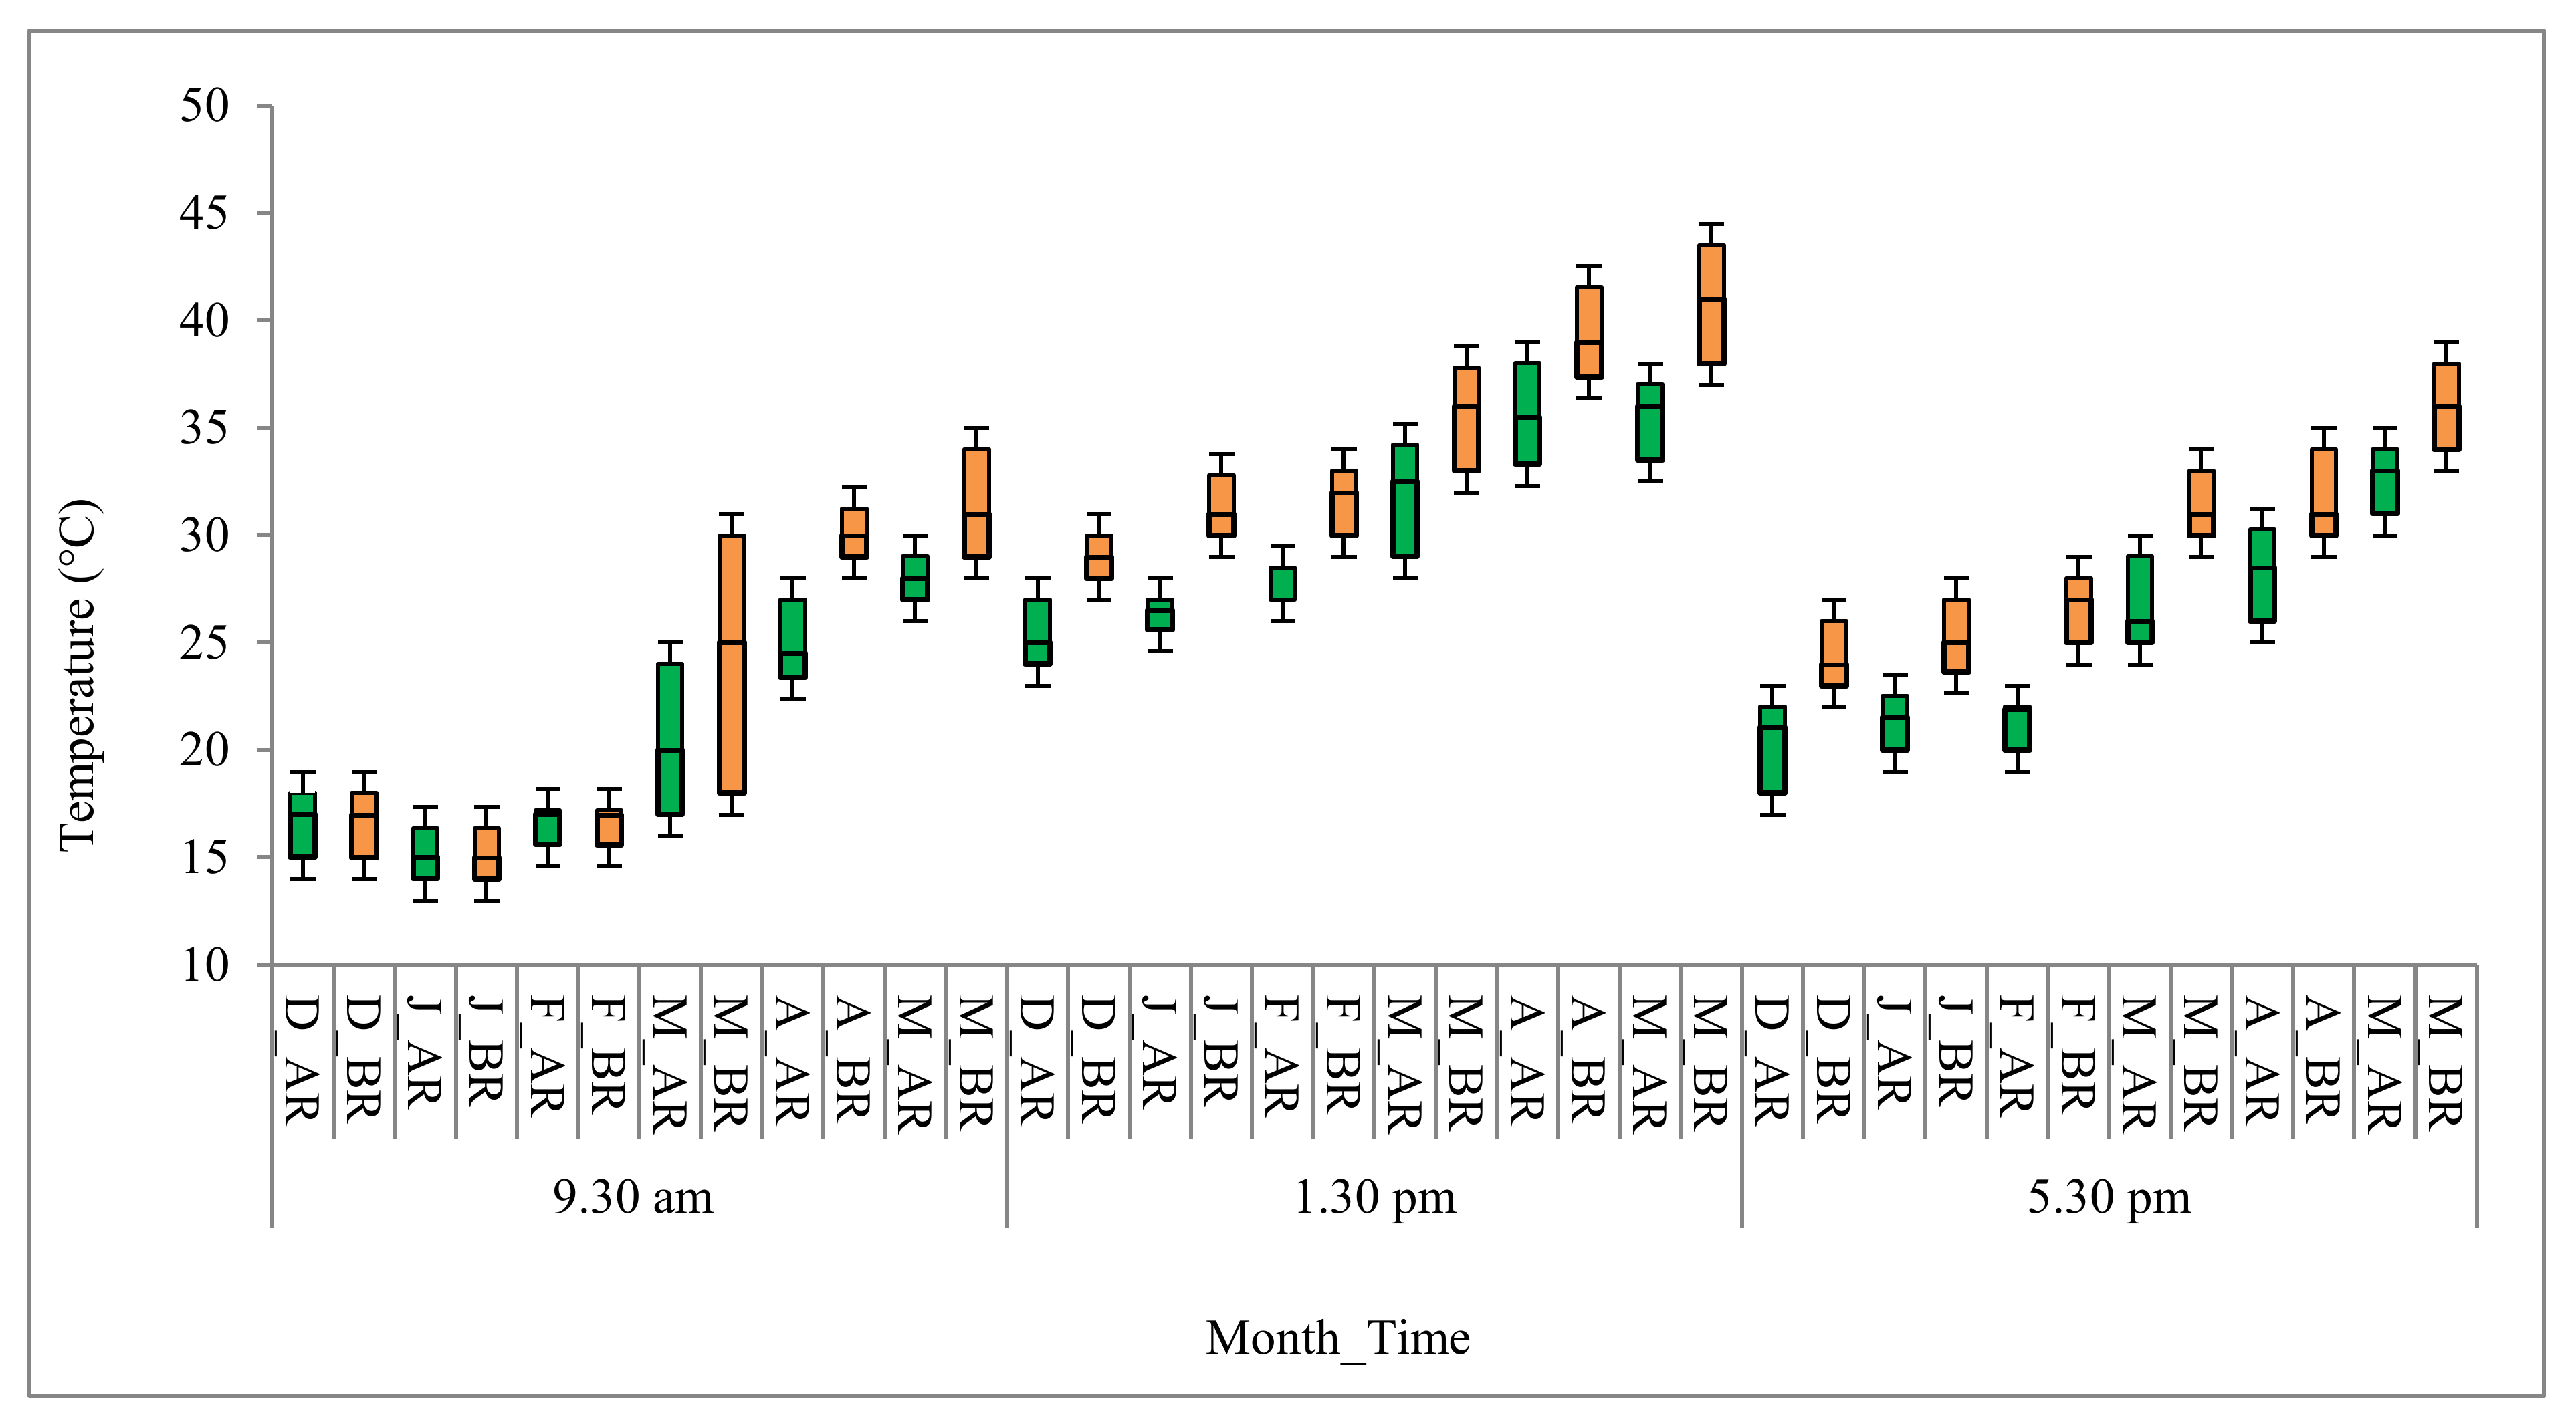
3.1.1. Thermal Dynamics of URTA

Changing air temperature aspects were observed from different locations of the experimental AR (70% of roof area covered by agriculture with cultivation of Tomato, Chili, Brinjal, Bottle groud, Spinach, Red Spinach, Green Spinach) and from the nearby BR during the whole experimental period. The average temperatures of different times of a single day are shown in Figure 4. However, it has been detected that the temperature reached its maximum range during the month of May at 1.30 p.m., for both AR and BR (Table 4) plots, in comparison to 9.30 p.m. and 5.30 p.m. According to the descriptive statistics, the trend of the air temperature of the BR was always higher than the AR throughout the day.
According to Table 4, the maximum temperatures of the BRs were 2 °C (9:30 a.m.), 5 °C (1:30 p.m.) and 4 °C (5:30 p.m.) higher compared to the AR (experimental roof). Consequently, the minimum temperatures of the BRs were 1 °C (9:30 a.m.), 2 °C (1:30 a.m.) and 2 °C (5:30 p.m.) higher compared to the ARs. The comparison of the mean temperature between the AR and the BR showed that the AR, with 70% of its area covered by plants, was 2.61 °C, 3.41 °C and 2.66 °C cooler than the BR at 9:30 a.m., 1:30 p.m. and 5:30 p.m., respectively. In the case of rainy days, the temperature differences of both roofs became very minimal. So, rain periods were avoided for temperature data analysis.
In this study, percentiles are used to understand the values of thermal dynamics in ARs and BRs, as well as to clearly recognize the advantage of URTA due to reduction in temperatures. From Table 5, it is clearly seen that the different percentile ranges of ARs were always higher than that of BRs. This means that of the 5, 10, 25, 50, 75, 90 and 95 percent temperature values, ARs had a range that was always less than BRs at the same temperature range. Similarly, the air temperature difference histogram, recorded from the five selected roofs (85, 80, 60, 50 and 40% roof area covered by agriculture) and the nearby BRs at 1:30 p.m. and 1.52 m above the roof surface, is shown in Figure 5. The histogram represents the mean value, standard deviation and normal distribution of the temperature difference frequencies of the different area covered roofs during the month of March. From the temperature differences analysis, it was exposed that during the month of March, the maximum frequencies of temperature differences were 5.5 °C, 4.5 °C, 3.5 °C, 2.3 °C, 1.2 °C and 0.45 °C in 85, 80, 60, 50 and 40% roof area covered by agriculture, respectively (Figure 5).
The mean temperature differences in April and May of those selected ARs and BRs were found to be 4.76 °C, 4.29 °C, 3.37 °C, 2.19 °C, 1.18 °C and 0.41 °C, and 4.41 °C, 3.51 °C, 3.42 °C, 1.85 °C, 1.00 °C and 0 °C in 85, 80, 60, 50 and 40% covered roof area by agriculture, respectively. The minimum and maximum temperature differences in March were recoded as 3 °C and 6 °C, 2.10 °C and 7.20 °C, 2 °C and 6.5 °C, 1 °C and 3 °C, 0.1 °C and 1.8 °C and −1 °C and 1 °C of ARs and BRs, respectively. A 95% confidence interval for the mean was also calculated from the observed temperature differences between ARs and BRs through SPSS. It was revealed that the lower and upper bound of the 95% confidence interval for a mean temperature difference of those ARs and BRs were 4.55 °C and 5.08 °C, 3.90 °C and 5.32 °C, 2.83 °C and 3.91 °C, 1.79 °C and 2.26 °C, 0.85 °C and 1.18 °C and −0.36 °C and 0.27 °C, respectively. So, it is experiential that 50 and 40% covered roof area by URTA obtained a lower temperature reduction, recording a maximum of 1.8 °C and 1 °C and a minimum of 0.1 °C and −0.1 °C at 1:30 p.m. during the month of March to May, respectively. On the contrary, the 85, 80, 70 and 60% URTA were equally and highly effective on air temperature reduction compared to 50 and 40% roof area covered URTA roofs and BRs at the hottest time over the day during the summer season. However, the most noticeable difference is shown by the 85% roof area covered AR, which maintained its temperature variances and standard deviation as 0.34 °C and 0.58 °C compared to the other selected roofs. Thus, the temperature difference should vary on the percentage of area covered by rooftop agriculture persists during the day at 1:30 p.m.

3.1.2. Near Roof Surface Thermal Dynamics in AR and BR

The potential ranges of exterior roof surface temperature reduction were calculated for the experimental AR and BR. The winter and summer season variation of the near roof surface for the AR and the BR is presented as a Box-and-Whisker plot in Figure 6. This box-and-whisker plot shows the lowest value, highest value, median of surface temperature and performance on the roofs.
From Figure 6, it is shown that the variability of the roof surface temperature was higher in the BRs for the month of December 2018 to May 2019 (both winter and summer seasons) than ARs. It should be noted that roof surface temperature in both roofs significantly varied at 1:30 p.m. and 5:30 p.m. comparatively with 9:30 a.m. due to the shadow-shading effect or the higher leaf density of plants on the building roof surface. The maximum difference was 12 °C during the month of May, and the average difference was found to be 6 °C on a specific day. It was also observed from one sample t-test that there was no significant temperature difference during the months from December to February at 9:30 a.m. However, from March to May, the temperature significantly differed by 3–12 °C at 9.30 a.m. Similarly, at 1.30 p.m. and 5.30 p.m., the temperature reduction was 4 to 12 °C. It was also reviewed that on semi-intensive green roofs, the roof surface temperature reduction was found to be 7 to 14 °C [53]. The results showed that the URTA roof was very effective in peripheral surface temperature reduction and thereby provided thermal shading to the building. The degree of surface temperature reduction by the URTA increased with the increased solar intensity, as a higher reduction was observed during the daytime at 1:30 p.m.

3.1.3. Air Temper Inclines in AR Relative to Distance from Roof Surface

Table 6 represents the temperature gradient at the north–south, middle and east–west side of the AR at 1.25 m above the roof surface from January to April 2019 daily at 9:30 a.m. and 1:30 p.m. The mean temperature incline, measured below the canopy shading at near roof surface 1 m, 2 m, 1.25 m and 2 m above the roof surface, varied within a confined average range of 0.74 °C to 2.32 °C and 1.15 °C to 3.37 °C on the AR during March at 9.30 a.m. and 1.30 p.m., respectively. On the BR, the air temperature incline at different heights varied within the range of 0.50 °C to 1.1 °C and 1 °C to 1.7 °C at 9:30 a.m. and 1:30 p.m., respectively, in March. It was also clearly observed that the temperature gradient was lower below the fencing panel at the north and south sides of the experimental roof compared to other locations, such as the middle, east and west side of the experimental AR where the fencing panel was 1.5 m above the roof surface. Leafy vegetables cultivated under the fencing panel worked as an additional input for lowering the heating effect. The canopy density and height of plants resulted in the temperature change at different heights during the day. It was an upward trend both at 9:30 a.m. and at 1:30 p.m. in the case of the BR. However, for the experimental AR, the temperature variance trend was upward at 9:30 a.m., whereas, at 1:30 p.m., the temperature variance moved downward. Irrigation was given in the experimental AR each morning and in the afternoon by drip irrigation system according to crops’ water requirements. So, this impact was limited to affect the temperature changes at a different height. On the other hand, solar intensity was low in the morning compared to noon (1:30 p.m.), and air warming in the morning differred at different heights with little effect. It is notable that the maximum variances occurred on the near-surface at 1.2 m height compared to at 2 m height from the roof surface. Thus, the thermal variation at different heights was more effective in the AR than BRs during the peak solar intensity. It was shown that the highest reduction in the temperature gradient was relative to the density of the canopy and plant distance. This was caused by the difference between the dense greenery and the increased evapotranspiration on the roof. However, the temperature gradient at different sides and heights through URTA created a much cooler microclimate than that of the adjacent BR surface. This could be due to the heat absorbance by plants. Solar radiation and evapotranspiration caused an average temperature gradient of 7.12 °C on the roof surface of 4.58 °C, 2.79 °C and 2.01 °C at 1 m, 1.25 m and 2 m from the roof surface, respectively, compared to the BR. It could be described that there was a relatively cooler air layer on the AR up to 1 m and warmer air above 2 m from the surface around noon. However, at the BR, the temperature suppression was more pronounced at near roof surface and gradually decreased up to 1.25 m, which was also higher than the agricultural roof.

3.1.4. Relative Humidity Dynamics of AR and BRs

In order to assess the effect of rooftop agriculture upon microclimate changes, the average mean, minimum, maximum, standard deviation and variance of the relative humidity (RH) were analyzed from December 2018 to May 2020, collected daily at 9:30 a.m., 1:30 p.m. and 5:30 p.m. The trends of RH in the AR and BR are shown in Figure 7a–c. The maximum, minimum, mean and standard deviation (SD) of RH were observed as 88.83, 30.67, 56.92 and 11.44 for AR and 25.33, 78.67, 49.29 and 10.64% for BR, respectively. Minimum 5% and maximum 10% variations were found between the AR and BR, which indicates that rooftop agriculture is proficient in increasing the RH in the air layer compared to the BR, and it influenced the microclimate of the surrounding air by its evapotranspiration. So, Figure 7a–c demonstrates that the relative humidity changes in the AR were always higher then the BR, which played a significant role in the thermal behaviour of the roof in the daytime at 1:30 p.m. As humidity itself was a climatic variable, it also influenced other climatic variables. Thus, URTA would have positive impacts on the thermal comfort of the people living in urban cities through the reduction of air temperature. So, it is highly recommended to include URTA in the building code of Bangladesh to mitigate the UHI effect. It is applicable for all regions of the globe to reduce global microclimatic change during warmer seasons.

3.1.5. CO2 Dynamics for the AR and BR

An average 1.63% reduction of CO2 concentration was observed at 1 m above the roof surface in the experimental AR compared to the adjacent BR within the period from December 2018 to May 2019. The significances of the concentration were analyzed through regression analysis and shown in Figure 8. However, it was observed that the mean concentration of CO2 (ppm) was 400 ppm and 406 ppm in AR near the plants and in BR, respectively. The maximum concentrations were found to be 431.00 ppm and 440 ppm in AR near the plant and in BR, respectively. Different percentiles of CO2 concentration were also analyzed. It has been found that the 75, 90 and 95 percentiles of CO2 concentrations were 404 ppm and 408 ppm, 413 ppm and 410 ppm and 414 ppm and 419 ppm in AR and in BR, respectively. So, the study found that the AR had a higher respiration rate from plants that cause the differences in CO2 concentration compared to the nearby BRs same as green roof [54]. Hence, AR is able to mitigate the microclimatic changes in urban cities and the UHI effect by reducing heat-trapping gas concentration leading to thermal comfort at a local scale. The regression model was fitted to CO2 concentration values of both roofs from December to May. A total of 141 days, which were represented by the sequence in the Figure 8, and the deviations from the fitted line to the observed values were noted. The linear line denotes the validity of all values with the dates, which had a negative linear correlation with CO2 concentration. It indicated that there was no positive relation with date or month, but in the AR, CO2 concentration was comparatively lower than BR. From February to April, the maximum values were close to the regression line, i.e., the maximum values were found to be close to 401 ppm and 410 ppm for the AR and BR, respectively. So, the URTA plays a very crucial role in the microclimatic changes and controls the temperature and CO2 rises (1 to 10 ppm) with and around the roofs.

3.1.6. CDD and Cooling Load Potential Dynamics of Different Type of URTA

This study showed that, for the lower percentage of area coverage by ARs, CDD was nearly same to the adjacent bare roofs and differs by only 0.18 °C. However, for the higher percentage of area coverage by ARs, the CDD difference was found to be 4.25 °C. AR was more suitable for decreasing ambient temperatures and for reducing the cooling load between 32% and 100% [55,56]. From Figure 9, it is found that the possible mean CDD difference was subordinate between the lower percentage of green area coverage and higher percentage of green area coverage of roofs. At least 60% of green area coverage of roofs could be chosen where CDD difference is increasing compare to BR.
A paired sample t-test with a 95% confidence interval was used to compare the means of cooling load potential (KW/m2) of selected ARs and nearby BRs with six pairs (Table 7). There was a significant difference in cooling load requirement for the different area coverage of ARs (M = 0.788 to 1.30, SD = 0.0062 to 0.01332) and nearby BRs (M = 1.369 to 1.387, SD = 0.0108 to 0.0280). These results suggested that AR had a substantial cooling effect and depended on the roof area coverage by agriculture. Our research results suggested that when the agricultural roof was covered more than seventy percent, cooling load requirement decreased. The maximum cooling load prerequisite was 1337.74 W/m2 for the 40% area coverage AR, and the minimum cooling load prerequisite was 772.31 W/m2 at the 85% area coverage AR compared to other ARs. However, it was detected that among these roofs, indispensable cooling load varied from 12.15 to 20.34%. Therefore, due to the increases in area coverage of URTA, the daily peak cooling load value would be decreased and cooling load saving increased significantly.

3.1.7. Energy Savings Dynamics of Different Type of URTA

The buildings with intensive, semi-intensive and extensive green roofs could save about 20–60, 10–45 and 20% energy consumption, respectively [57]. On the other hand, ARs could save 1 to 34% of the amount of total annual energy consumption, 10 to 33.33% of the space cooling load and 20 to 50% of the peak space load [3,58]. According to Table 8 and Table 9, it was observed that energy consumption decreased in the high area covered ARs, and different percentile levels of energy savings were observed in all roofs with the increase of green areas. It was clearly observed that 85, 80, 70, 60, 50 and 40% of roof area covered ARs saved energy on top floor of a building by 59.45, 55.63, 39.81, 25.94, 18.88 and 5.87%, respectively.
Sixty percent or below 60% area covered ARs saved energy up to 30%. In the case of 60, 50 and 40% of the roof area covered ARs, the 95th percentile of energy saving was as much as one-fourth to one-fifth compared to the 70–85% roof area covered ARs. The results showed that energy consumption differed in all roof options, which was closely related to the area covered by ARs, soil and density of leaves and plants. On the other hand, in the summer season, the energy consumption reduction was barely significant, which is shown in the quantile-quantile (Q-Q) plot normal distribution in Figure 10a–c. The Q-Q plots represent the probability distributions of all values of energy savings by plotting their quantiles against each other and creating a perfectly straight line for the 40, 70 and 85% roof area covered ARs. From Figure 10a–c, it was confirmed that there was a significant potential application of ARs as an energy conservation approach in buildings in hot and moist climatic conditions. However, it can be seen that the energy saving fluctuations of ARs were always less than the thermal fluctuations of BRs, especially in the warm months of the year. However, the equipment operation efficiency was not considered in this study to calculate the energy saving.

3.2. Socio-Economic Analysis

3.2.1. Gender-Sensitive Socialization of URTA

Out of the total of 200 rooftop agriculture owners, it could be observed that 51.94% of owners of ARs were female and 48.06% were male, and the ages of the male and female owners were different. However, it was noticed that the URTA was mostly female and elderly male sensitive, where women clearly had an important role to play in increasing the productivity of rooftop agriculture. Therefore, the sensitivity of gender-oriented social dynamics of URTA was multifarious, with individuals expressing degrees of perception towards the four different age factors (Figure 11). However, personal socialization activities of URTA were identified most strongly among these four groups of age. So, age and sex were the most imperative social factors to put URTA into practice. Figure 11 represents the different year groups (1 = less than 40 years, 2 = 40–50 years, 3 = 50–60 years and 4 = more than 60 years) of males and females and their contribution to the implementation of URTA. Figure 11 characterizes that the 40–50-year-old group of females and the over 60-year-old male group were most perceived by the respondents group of URTA. On the other hand, from the questionnaire survey, it was observed that the maximum everyday jobs of URTA were done mostly by women, including soil preparation, fertilizer application and water management. Some responsibilities were shared with labour such as loading the soil and heavy material transferring such as bamboo, rod sit, containers, soil and organic fertilizer, caring of the roof garden, etc. From the data analysis, the overall skillfulness of women had been increased by 68.78% through rooftop agriculture. So, gender contribution was highly related with URTA and their understanding of agriculture was enhanced through regular involvement in the cultivation of different fruits, flowers, vegetables and other plants in rooftop agriculture. It was found that personal capabilities about the commercialization of URTA products came out as strong factor among the three dynamic parameters. Mandatory in the building code and proper monitoring (36.92%) and subsidies, incentives and bank loans from the government (50%) and training on the agricultural system (13.08%) were the most perceived by respondents. It has also been shown from the previous studies that health (53%) and education (62%), planning social welfare (40%), social group integration (40%), community recreation (35%) and social empowerment (25%) were professed by respondents [59].

3.2.2. Economic Dynamics of URTA

Figure 12 represents the results of an economic assessment employing the NPV approach of URTA. NPV was close to zero at the end of the fifth year at a 12% discounted rate. However, NPV became positive, which led to a greater cash inflow compared to cash outflow at a 12% discounted rate at the end of the fifth year within the life period of 15 years of URTA, and at the end of 14th year, NPV was close to zero when the internal rate of return (IRR) is 21.59%. In this study, the 12% discount rate was considered according to Bangaldesh government development project proposal (DPP) appraisal. Due to the very highly sensitive productivity of URTA, the experiment led to a positive NPV after 5 years with proper carrying, including efficient water management techniques both in crops and leafy vegetables. Thus, it can also be concluded that the benefits depends on crop type, production and area covered of the roof by crops and would only be achieved towards the end of the life cycle of the first investment materials of URTA [60]. NPV results of the food production from the URTA scenarios revealed that first-year production was comparatively less than second-year production due to lack of technical knowledge and experience of organic food production on the roof.
However, organic and soil-less cultivation on the roof top led to a positive NPV for its growing capability for around the year and provided a fresh supply of agricultural products to the consumer in a sustainable way. It may contribute to the whole year short duration of food supply chains by as much as 30.07%. The results conluded that 98 ha vegetable gardens and 2539 ha arable land could satisfy the demand of about 63,700 and 321,000 consumers through vegetables and cereal products, respectively [61]. Table 10 represents the yearly benefit of URTA. This study observed that annual job creation advantage @BDT 138.90/m2 (29.84%) of the total benefits of URTA [Table 10]. Figure 13 represents the other benefits of the experimental URTA. Yearly energy savings were: BDT 6.04/KWH and BDT 184.44/m2/year, considering the fourth step of DPDC tariff, Bangladesh from 301 to 400 units, 6.04/KWh (19.81%). Annual AR-enhanced air quality advantage and annual mitigation of UHI effect are @BDT 2/m2 (5.16%) and @BDT 67.17/m2 (14.43%), respectively.

4. Conclusions

This study aimed at observing the impacts of URTA on microclimate change and socioeconomic dimensions in the urban areas. The output of this study represents the stage for the holistic assessment of alternative solutions, integrating environmental and socioeconomic dimensions and putting URTA into perspective by comparing it to alternative uses of roofs as vacant urban space. The findings of this work reveal that the maximum temperature differences between the ARs and the nearest BRs were 0.45 °C to 5.5 °C during the summer season. It was found that 60–85% roof area covered by URTA were equally and highly effective for air temperature reduction compared to 50% or below roof area covered by URTA (maximum 1 °C to 1.8 °C). The relative humidity was increased by a minimum of 5% and a maximum of 10% in the ARs compared to the BRs. The 70% covered ARs could decrease the Temperature Humidity Index (THI) by minimum of 8%, while the THI for the AR is 26.60 (comfortable), and for the BR, 29 (uncomfortable) in the dry season.
The results of this study also revealed that ARs were effective in reducing heat flow through the roof. Thus, the energy demand for cooling load in the top floor of the building was lowered. The URTA could achieve a saving of 3.62 to 32.28% the peak cooling load. It resulted in 5.87 to 59.45% energy saving with financial benefits compare to the adjacent BR. The increases in area coverage of URTA led to the decrease of the daily peak cooling load. It enhanced energy-saving significantly. The energy-saving fluctuated with ARs with the vegetated area, soil layer coverage and leaf area indices of plants.
However, it has also been found that URTA is mostly female friendly with the age group of 40–50 year. URTA becomes elderly male sensitive with the age group of over 60 years. It indicates that retired males are mostly involved with URTA. Economic sustainability of URTA depends on yields and prices. In this study, at a 12% discount rate, NPV becomes positive at the end of the fifth year, resulting in more cash inflow. URTA is an economically accountable process with financial benefits of yearly energy savings of 19.81%. Annual job creation is 29.84%, enhanced air quality advantage is 5.16% and the annual mitigation of heat island effect is 14.43%. So, the commercial dynamics of URTA refer to achieving financial success according to the demand of the local population. Investments and proper carrying of URTA can raise incomes and produce overall economic growths for longer-term food security and improved well-being. URTA also can provide sustainable, interactive community spaces for flat members or relatives and can enjoy health benefits through recreation and relaxation. URTA brings the unusable space into productive spaces and increases the property value of the building. It plays an important role in addressing a different range of micro-environmental challenges through adaptations.
URTA can play significant roles in producing fresh and affordable vegetables, enhancing cooling load and saving energy, improving urban micro-climatology through reduction of roof temperature and increasing the relative humidity and creating empowerment. The findings of this study may inspire urban planners and decision makers to recognize that URTA can provide measurable benefits both to the city dwellers and to the community to attain environmental and socioeconomic benefits in comparison to traditional urban roof uses.

Author Contributions

Conceptualization, M.S.B. and S.K.B.; methodology, M.S.B.; software, M.S.B.; validation, M.S.B., S.K.B. and A.K.M.S.I.; formal analysis, M.S.B.; investigation, resources, M.S.B.; S.K.B. and A.K.M.S.I.; data creation, M.S.B.; writing original draft preparation, M.S.B.; writing review and editing, S.K.B., A.K.M.S.I. and D.R.; visualization, M.S.B.; supervision, S.K.B.; project administration, M.S.B.; funding acquisition, M.S.B. All authors have read and agreed to the published version of the manuscript.

Funding

This research was funded by the Ministry of Science and Technology (MoST), Government of the People’s Republic of Bangladesh, through the National Science and Technology (NST) fellowship for doctoral degree grant and the research grant from Bangladesh University of Engineering and Technology (BUET).

Institutional Review Board Statement

Not applicable.

Informed Consent Statement

Not applicable.

Data Availability Statement

The data presented in this study are available on request from the corresponding author. The data are not publicly available due to privacy or ethical restrictions.

Acknowledgments

The authors thankfully acknowledge the support from the National Science and Technology (NST) fellowship from the Ministry of Science and Technology (MoST) of the Government of the People’s Republic of Bangladesh. The authors would also like to express special thanks to the authority of the Bangladesh Agricultural Development Corporation (BADC) and Institute of Water and Flood Management (IWFM), Bangladesh University of Engineering and Technology (BUET). The authors would also like to thank the anonymous reviewers for their constructive comments on improving this paper.

Conflicts of Interest

The authors declare no conflict of interest.

References

  1. Fonseka, H.P.U.; Zhang, H.; Sun, Y.; Su, H.; Lin, H.; Lin, Y. Urbanization and Its Impacts on Land Surface Temperature in Colombo Metropolitan Area, Sri Lanka, from 1988 to 2016. Remote Sens. 2019, 11, 957. [Google Scholar] [CrossRef] [Green Version]
  2. Saini, V.; Tiwari, R.K. Effect of Urbanization on Land Surface Temperature and NDVI: A case study of Dehradun, India. In Proceedings of the 38th Asian Conference on Remote Sensing, New Delhi, India, 23–27 October 2017. [Google Scholar]
  3. Wong, N.H.; Cheong, D.K.W.; Yan, H.; Soh, J.; Ong, C.L.; Sia, A. The effects of rooftop garden on energy consumption of a commercial building in Singapore. Energy Build. 2003, 35, 353–364. [Google Scholar] [CrossRef]
  4. Nadal, A.; Llorach-Massana, P.; Cuerva, E.; López-Capel, E.; Montero, J.I.; Josa, A.; Rieradevall, J.; Royapoor, M. Building-Integrated Rooftop Greenhouses: An Energy and Environmental Assessment in the Mediterranean Context. Appl. Energy 2017, 187, 338–351. [Google Scholar] [CrossRef] [Green Version]
  5. Elmes, A.; Rogan, J.; Williams, C.; Ratick, S.; Nowak, D.; Martin, D. Effects of Urban Tree Canopy Loss on Land Surface Temperature Magnitude and Timing. ISPRS J. Photogramm. Remote Sens. 2017, 128, 338–353. [Google Scholar] [CrossRef]
  6. Barreca, F. Rooftop Gardening. A Solution for Energy Saving and Landscape Enhancement in Mediterranean Urban Areas. Procedia Soc. Behav. Sci. 2016, 223, 720–725. [Google Scholar] [CrossRef] [Green Version]
  7. Kasera, S.; Nayyar, A.; Sharma, D. The Energy Consumption Performance of Roof Garden. Int. J. Sci. Eng. Res. 2012, 3, 470–473. [Google Scholar]
  8. Ascione, F.; Bianco, N.; de’ Rossi, F.; Turni, G.; Vanoli, G.P. Green Roofs in European Climates. Are Effective Solutions for the Energy Savings in Air-Conditioning? Appl. Energy 2013, 104, 845–859. [Google Scholar] [CrossRef]
  9. Zinzi, M.; Agnoli, S. Cool and Green Roofs. An Energy and Comfort Comparison between Passive Cooling and Mitigation Urban Heat Island Techniques for Residential Buildings in the Mediterranean Region. Energy Build. 2012, 55, 66–76. [Google Scholar] [CrossRef]
  10. Sookchaiya, T.; Monyakul, V.; Thepa, S. Assessment of the Thermal Environment Effects on Human Comfort and Health for the Development of Novel Air Conditioning System in Tropical Regions. Energy Build. 2010, 42, 1692–1702. [Google Scholar] [CrossRef]
  11. Li, Y.; Pizer, W.A.; Wu, L. Climate Change and Residential Electricity Consumption in the Yangtze River Delta, China. Proc. Natl. Acad. Sci. USA 2019, 116, 472–477. [Google Scholar] [CrossRef] [Green Version]
  12. Bryan, E.; Ringler, C.; Okoba, B.; Koo, J.; Herrero, M.; Silvestri, S. Agricultural Management for Climate Change Adaptation, Greenhouse Gas Mitigation, and Agricultural Productivity; Discuss. Pap.: No. 01098; IFPRI: Washington, DC, USA, 2011. [Google Scholar]
  13. Yasumoto, S.; Jones, A.P.; Oyoshi, K.; Kanasugi, H.; Sekimoto, Y.; Shibasaki, R.; Comber, A.; Watanabe, C. Heat Exposure Assessment Based on Individual Daily Mobility Patterns in Dhaka, Bangladesh. Comput. Environ. Urban Syst. 2019, 77, 101367. [Google Scholar] [CrossRef]
  14. Barozzi, B.; Bellazzi, A.; Maffè, C.; Pollastro, M.C. Measurement of Thermal Properties of Growing Media for Green Roofs: Assessment of a Laboratory Procedure and Experimental Results. Buildings 2017, 7, 99. [Google Scholar] [CrossRef] [Green Version]
  15. Muthamilselvan, A.; Srimadhi, K.; Ramalingam, N.; Pavithra, P. Urbanization and Its Related Environmental Problem in Srirangam Island, Tiruchirappalli District of Tamil Nadu, India-Thermal Remote Sensing and GIS Approach. Environ. Earth Sci. 2016, 75, 765. [Google Scholar] [CrossRef]
  16. Alavipanah, S.; Wegmann, M.; Qureshi, S.; Weng, Q.; Koellner, T. The Role of Vegetation in Mitigating Urban Land Surface Temperatures: A Case Study of Munich, Germany during the Warm Season. Sustainability 2015, 7, 4689–4706. [Google Scholar] [CrossRef] [Green Version]
  17. Benis, K.; Reinhart, C.; Ferrão, P. Development of a Simulation-Based Decision Support Workflow for the Implementation of Building-Integrated Agriculture (BIA) in Urban Contexts. J. Clean. Prod. 2017, 147, 589–602. [Google Scholar] [CrossRef]
  18. Xu, M.; Hong, B.; Jiang, R.; An, L.; Zhang, T. Outdoor Thermal Comfort of Shaded Spaces in an Urban Park in the Cold Region of China. Build. Environ. 2019, 155, 408–420. [Google Scholar] [CrossRef]
  19. Cascone, S.; Catania, F.; Gagliano, A.; Sciuto, G. A Comprehensive Study on Green Roof Performance for Retrofitting Existing Buildings. Build. Environ. 2018, 136, 227–239. [Google Scholar] [CrossRef]
  20. Zinia, N.J.; McShane, P. Ecosystem Services Management: An Evaluation of Green Adaptations for Urban Development in Dhaka, Bangladesh. Landsc. Urban Plan. 2018, 173, 23–32. [Google Scholar] [CrossRef]
  21. Castleton, H.F.; Stovin, V.; Beck, S.B.M.; Davison, J.B. Green Roofs; Building Energy Savings and the Potential for Retrofit. Energy Build. 2010, 42, 1582–1591. [Google Scholar] [CrossRef]
  22. Moulai, M.; Kharvari, F.; Shahhosseini, G.; Zanjani, N.E. A Study of the Urban Heat Island Mitigation Strategies: The Case of Two Cities. Int. J. Urban Manag. Energy Sustain. 2017, 1, 1–7. [Google Scholar]
  23. Mainuddin, M.; Kirby, M. National food security in Bangladesh to 2050. Food Secur. 2015, 7, 633–646. [Google Scholar] [CrossRef]
  24. Corburn, J. Cities, Climate Change, and Urban Heat Island Mitigation: Localizing Global Environmental Science. Urban Stud. 2009, 46, 413–427. [Google Scholar] [CrossRef]
  25. Specht, K.; Siebert, R.; Thomaier, S. Perception, and Acceptance of Agricultural Production in and on Urban Buildings (ZFarming): A Qualitative Study from Berlin, Germany. Agric. Hum. Values 2016, 33, 753–769. [Google Scholar] [CrossRef]
  26. Berardi, U.; Ghaffarian, H.A. State of the art analysis of the environmental benefits of green roofs. Int. J. Appl. Energy 2014, 115, 411–428. [Google Scholar] [CrossRef]
  27. Alhashimi, L.; Aljawi, L.; Asghar, R.; Alamoudi, A. The effect of rooftop garden on reducing the internal temperature of the rooms in buildings. In Proceedings of the 4th World Congress on Mechanical, Chemical, and Material Engineering, Madrid, Spain, 16–18 August 2018. Paper No. ICMIE114. [Google Scholar]
  28. Martin, G.; Clift, R.; Christie, I. Urban cultivation and its contributions to sustainability: Nibbles of food but oodles of social capital. Int. J. Sustain. 2016, 8, 409. [Google Scholar] [CrossRef] [Green Version]
  29. Vijayaraghavan, K. Green Roofs: A Critical Review on the Role of Components, Benefits, Limitations and Trends. Renew. Sustain. Energy Rev. 2016, 57, 740–752. [Google Scholar] [CrossRef]
  30. Badami, M.G.; Ramankutty, N. Urban agriculture and food security: A critique based on an assessment of urban land constraints. Glob. Food Secur. 2015, 4, 8–15. [Google Scholar] [CrossRef]
  31. Safayet, M.; Arefin, M.F.; Hasan, M.M.U. Present practice and future prospect of rooftop farming in Dhaka city: A step towards urban sustainability. Int. J. Urban Manag. 2017, 6, 56–65. [Google Scholar] [CrossRef]
  32. Jones, H.; Domingos, T.; Moura, F.; Sussman, J. Transport Infrastructure Evaluation Using Cost-Benefit Analysis: Improvements to Valuing the Asset through Residual Value—A Case Study. In Proceedings of the Transportation Research Board (TRB) 93rd Annual Meeting, Washington, DC, USA, 12–16 January 2014; pp. 1–17. [Google Scholar]
  33. Nadal, A.; Rodríguez-Cadena, D.; Pons, O.; Cuerva, E.; Josa, A.; Rieradevall, J. Feasibility Assessment of Rooftop Greenhouses in Latin America. The Case Study of a Social Neighborhood in Quito, Ecuador. Urban For. Urban Green. 2019, 44, 126389. [Google Scholar] [CrossRef]
  34. Cohen, P.; Shashua-Bar, L.; Keller, R.; Gil-Ad, R.; Yaakov, Y.; Lukyanov, V.; Bar, P.; Tanny, J.; Cohen, S.; Potchter, O. Urban Outdoor Thermal Perception in Hot Arid Beer Sheva, Israel: Methodological and Gender Aspects. Build. Environ. 2019, 160, 106169. [Google Scholar] [CrossRef]
  35. Department of Economic and Social Affairs, Population Division. World Urbanization Prospects: The 2014 Revisions; United Nations: New York, NY, USA, 2015; p. 27. [Google Scholar]
  36. Kaloustian, N.; Bitar, H.; Diab, Y. Urban heat island and urban planning in Beirut. In Proceedings of the 4th International Conference on Countermeasures to Urban Heat Island, Singapore, 30 May–1 June 2016. [Google Scholar]
  37. Ishtiaque, A.T.; Tasin, T.Z.; Akter, K.S. Urban Heat Island Intensity Assessment through comparative study on land surface temperature and normalized difference vegetation index: A Case Study of Chittagong. Int. J. Urban Civ. Eng. 2017, 11, 37–42. [Google Scholar]
  38. Raji, B.; Tenpierik, M.J.; Dobbelsteen, A. The impact of greening systems on building energy performance: A literature review. Renew. Sustain. Energy Rev. 2015, 45, 610–623. [Google Scholar] [CrossRef] [Green Version]
  39. Islam, M.; Al Nayeem, A.; Majumder, A.K.; Tanjim Elahi, K. Study on the Status of Roof Top Gardening in Selected Residential Areas of Dhaka City, Bangladesh. Malays. J. Sustain. Agric. 2019, 3, 31–34. [Google Scholar] [CrossRef]
  40. Heady, H.F. The Measurement and Value of Plant Height in the Study of Herbaceous Vegetation. Ecol. Soc. Am. 1957, 38, 313–320. [Google Scholar] [CrossRef] [Green Version]
  41. Kim, E.; Jung, J.; Hapsari, G.; Kang, S.; Kim, K.; Yoon, S.; Lee, M.; Han, M.; Choi, Y.; Choe, J.K. Economic and Environmental Sustainability and Public Perceptions of Rooftop Farm versus Extensive Garden. Build. Environ. 2018, 146, 206–215. [Google Scholar] [CrossRef]
  42. Jafari, N.; MohdYunos, M.Y.; Mydin, M.A.O.; Mohd Tahir, O. Assessing the Residents’ Preference of Awareness Regarding Urban Agriculture at Rooftop Garden. Appl. Mech. Mater. 2015, 747, 180–183. [Google Scholar] [CrossRef]
  43. Sabeh, N. Rooftop Plant Production Systems in Urban Areas. Plant Factory: An Indoor Vertical Farming System for Efficient Quality Food Production; Academic Press: Cambridge, MA, USA, 2015. [Google Scholar]
  44. Pandey, S.; Hindoliya, D.A.; Mod, R. Experimental investigation on green roofs over buildings. Int. J. Low Carb. Technol. 2013, 8, 37–42. [Google Scholar] [CrossRef] [Green Version]
  45. Schroeder, C. Thermal Conductivity of Building Materials. Sci. Am. 1921, 3, 243–244. [Google Scholar] [CrossRef]
  46. Krese, G.; Prek, M.; Butala, V. Analysis of Building Electric Energy Consumption Data Using an Improved Cooling Degree Day Method. Stroj. Vestn. J. Mech. Eng. 2012, 58, 107–114. [Google Scholar] [CrossRef]
  47. La Roche, P.; Berardi, U. Comfort and Energy Savings with Active Green Roofs. Energy Build. 2014, 82, 492–504. [Google Scholar] [CrossRef]
  48. Liu, K. Energy Efficiency and Environmental Benefits of Rooftop Gardens. Constr. Canada 2002, 44, 20–23. [Google Scholar]
  49. Au, T.; Au, T.P. Engineering Economics for Capital Investment Analysis; Allyn and Bacon: Newton, MA, USA, 1983. [Google Scholar]
  50. Jafari, N.; Utaberta, N.; Yunos, M.Y.M.; Ismail, N.A.; Ismail, S.; Ariffin, N.F.M.; Jafari, N.; Valikhani, M. Benefits of Roof Garden in Order to Usage of Urban Agriculture at Roof Garden in High-Rise Building in Malaysia. Adv. Environ. Biol. 2015, 9, 86–92. [Google Scholar]
  51. Francis, L.F.M.; Jensen, M.B. Benefits of Green Roofs: A Systematic Review of the Evidence for Three Ecosystem Services. Urban For. Urban Green. 2017, 28, 167–176. [Google Scholar] [CrossRef]
  52. Berardi, U. The Outdoor Microclimate Benefits and Energy Saving Resulting from Green Roofs Retrofits. Energy Build. 2016, 121, 217–229. [Google Scholar] [CrossRef]
  53. Morakinyo, T.E.; Kalani, K.W.D.; Dahanayake, C.; Ng, E.; Chow, C.L. Temperature and cooling demand reduction by green-roof types in different climates and urban densities: A co-simulation parametric study. Energy Build. 2017, 145, 226–237. [Google Scholar] [CrossRef]
  54. Cai, L.; Feng, X.P.; Yu, J.Y.; Xiang, Q.C.; Chen, R. Reduction in carbon dioxide emission and energy savings obtained by using a green roof. Aerosol Air Qual. Res. 2019, 19, 2432–2445. [Google Scholar] [CrossRef]
  55. Alexandri, E.; Jones, P. Temperature decreases in an urban canyon due to green walls and green roofs in diverse climates. Build. Environ. 2008, 43, 480–493. [Google Scholar] [CrossRef]
  56. Mahmoodzadeh, M.; Mukhopadhyaya, P.; Valeo, C. Effects of Extensive Green Roofs on Energy Performance of School Buildings in Four North American Climates. Water 2020, 12, 6. [Google Scholar] [CrossRef] [Green Version]
  57. Silva, C.M.; Gomes, M.G.; Silva, M. Green roofs energy performance in Mediterranean climate. Energy Build. 2016, 116, 318–325. [Google Scholar] [CrossRef]
  58. Mahmoud, A.S.; Asif, M.; Hassanain, M.A.; Babsail, M.O.; Sanni-Anibire, M.O. Energy and economic evaluation of green roofs for residential buildings in hot-humid climates. Buildings 2017, 7, 30. [Google Scholar] [CrossRef]
  59. Wang, T.; Pryor, M. Social Value of Urban Rooftop Farming: A Hong Kong Case Study. Agric. Econ. Curr. Issues 2019. [Google Scholar] [CrossRef] [Green Version]
  60. Anand, C.; Apul, D.S. Economic and environmental analysis of standard, high efficiency, rainwater flushed, and composting toilets. J. Environ. Manag. 2011, 92, 419–428. [Google Scholar] [CrossRef] [PubMed]
  61. Pulighe, G.; Lupia, F. Multitemporal geospatial evaluation of urban agriculture and (non)-sustainable food self-provisioning in Milan, Italy. Sustainability 2019, 11, 1846. [Google Scholar] [CrossRef] [Green Version]
Figure 1. (a) Dhaka district, (b) study area, and (c) geographic location of the experimental plot.
Sustainability 13 09053 g001
Figure 2. Design layout of the experimental plot.
Sustainability 13 09053 g002
Figure 3. Selected vegetables cultivated scenario under the experimental roof.
Sustainability 13 09053 g003
Figure 4. Daily mean air temperature trend in the experimental agricultural roof (AR) and bare roof (BR) from December 2018 to May 2019.
Sustainability 13 09053 g004
Figure 5. Temperature differences histogram between (a) 85%, (b) 80%, (c) 70%, (d) 60%, (e) 50%, and (f) 40% area covered ARs and nearby BRs in the month of March 2019.
Sustainability 13 09053 g005
Figure 6. Box and whisker plots for spatiotemporal variation of roof surface temperature in the experimental agricultural roof (AR) and bare roof (BR) at 9:30 a.m. 1:30 p.m. and 5:30 p.m. from December 2018 to May 2020.
Sustainability 13 09053 g006
Figure 7. Relative humidity trend in the experimental agricultural roof and bare roof; (a) at 9:30 a.m., (b) 1:30 p.m. and (c) 5:30 p.m., respectively, during December 2018 to May 2019.
Sustainability 13 09053 g007
Figure 8. Linear regression analysis of average CO2 concentration in AR and BR from December 2018 to May 2019.
Sustainability 13 09053 g008
Figure 9. High and Low pair (a) 85 and 60%, (b) 85 and 40% green area coverage of roof; bar graph of CDD difference from March 2019 to May 2019.
Sustainability 13 09053 g009
Figure 10. Normal Q-Q plot of energy saving with the (a) 40%, (b) 70% and (c) 85% area covered ARs, respectively, during the months from March 2019 to May 2019 compared to adjacent BRs.
Sustainability 13 09053 g010
Figure 11. Male–female sex pyramid owner graph of URTA.
Sustainability 13 09053 g011
Figure 12. Annual net present value (NPV) for the experimental AR in Dhaka at a 12% discount rate.
Sustainability 13 09053 g012
Figure 13. Annual benefit of URTA according to the benefits from the experimantal URTA.
Sustainability 13 09053 g013
Table 1. R-values of different layers of the agriculturalroof (AR).
ParticularsThickness∑R (m2K/W)Source
Vegetation (small plants) 0.35[42]
Soil with 40% moisture400 mm0.25[43]
Soil with 40% moisture100 mm0.05[44]
Cement plaster50 mm0.10[45]
RCC slab152 mm0.108[45]
Table 2. The area considered for calculation of cooling load of the selected agricultural roofs (AR) 1.
Details of Roof% of the Area Covered by
Soil with Plants
% of the Area Covered by Plants% of the Bared Area
40% coverage 40%40%20%
50% coverage 30%60%20%
60% coverage 30%30%40%
70% coverage 20%40%30%
80% coverage 30%40%30%
85% coverage 30%40%30%
1 The % of the area covered by soil with plants, % of the area covered by plants and % of the bare area were considered within the details of roof; e.g., 40% coverage roof represented that 60% of the area of the total roof was bare and 40% of the area was covered by URTA. Within the URTA-covered area, again, 40% of the area was covered with soil with plants, 40% of the area was covered with plants and 20% of the area was bare (all values in the table are measured values).
Table 4. Descriptive statistics of air temperature (AT) of the experimental agricultural roof (AR) and BR from December 2018 to May 2019 (Total number of days = 142).
Roof Type_TimeDescriptive Statistics of Air Temperature in °C
Range Min Max Mean Std. DeviationVariance
AR_9.30 a.m.20.0014.0034.0023.535.9435.33
BR_9.30 a.m.20.2015.8036.0026.145.7032.52
AR_1.30 p.m.20.0018.0038.0029.714.9824.79
BR_1.30 p.m.23.0020.0043.0033.135.2127.16
AR_5.30 p.m.17.0018.0035.0027.014.5520.71
BR_5.30 p.m.20.2018.8039.0029.674.9824.80
Table 5. Weighted average percentiles of air temperature (AT) in the experimental AR and BR at 9.30 a.m., 1.30 p.m. and 5.30 p.m. from December 2018 to May 2019.
Air TemperaturePercentiles
5102550759095
AT_AR_9.30 a.m.1517182229.253232
AT_BR_9.30 a.m.1819.862124.75323435
AT_AR_1.30 p.m.22.4623.432628.25353637
AT_BR_1.30 p.m.25.2426.932932.5384041
AT_AR_5.30 p.m.21222326313434
AT_BR_5.30 p.m.22232630343637.24
Table 6. Descriptive statistics of air temperature at different sides of the AR and BR.
Place_TimeMinimumMaximumMeanStd. Deviation
AT_°C_North_AR_9:30 a.m.13.0033.5022.546.98
AT_°C_South_AR_9:30 a.m.13.0033.0022.476.38
AT_°C_Middle_AR_9:30 a.m.12.0034.0022.957.32
AT_°C_East_AR_9:30 a.m.13.3034.5023.907.20
AT_°C_West_AR_9:30 a.m.13.0034.3023.557.04
AT_°C_BR_9:30 a.m.15.0036.0025.357.20
AT_°C_North_AR_1:30 p.m.23.0037.0029.884.30
AT_°C_South_AR_1:30 p.m.23.0036.5029.843.88
AT_°C_Middle_AR_1:30 p.m.23.0038.0030.284.52
AT_°C_East_AR_1:30 p.m.23.0039.0030.614.39
AT_°C_West_AR_1:30 p.m.24.0039.0031.244.35
AT_°C_BR_1:30 p.m.29.0043.0034.603.99
Table 7. Paired Samples t-test statistics of cooling load (KW/m2) potential in the agricultural roof and bare roof.
Pair StatusMeanNStd. DeviationCorrelationtdfSig. (2-Tailed)
Pair 1BR1.383720.01490.917528.493710.000
AR0.788720.00620.000
Pair 2BR1.369720.00910.499467.390710.000
AR0.936720.00460.000
Pair 3BR1.382720.01440.959549.203710.000
AR1.052720.01080.000
Pair 4BR1.380720.01080.952497.653710.000
AR1.172720.00900.000
Pair 5BR1.434720.02800.997383.413710.000
AR1.221720.02380.000
Pair 6BR1.387720.01380.962150.617710.000
AR1.320720.01330.000
Table 8. Daily average energy saving (%) with the different area coverage roofs by AR during the month of March 2019 to May 2019 compare to adjacent BRs.
Types of RoofMinimumMaximumMeanStd. Deviation
40% coverage −2.9317.685.875.08
50% coverage 14.9325.4018.882.07
60% coverage 17.3643.6325.944.45
70% coverage 28.4762.1639.816.08
80% coverage 39.2571.0955.637.49
85% coverage 38.2271.5359.454.71
Table 9. Daily average energy saving (%) with respect to different percentile in the different area coverage AR during the month of March 2019 to May 2019 compare to adjacent BRs.
Types of Roof Based on Area Coverage Energy Saving in % at Different Percentiles
2550759095
40% coverage2.334.7610.0111.8714.70
50% coverage17.7018.3519.7421.6823.77
60% coverage23.1225.1927.6431.3035.58
70% coverage36.2539.6441.6448.5052.44
80% coverage50.2954.2362.1966.0369.21
85% coverage57.1559.8562.2264.4565.65
Table 10. Annual fresh food production benefit of experimental URTA (summer and winter season).
Name of CropsWinter Season
(December–February)
Summer Season
(March–May)
Total Yield
(kg)
Total Value in BDT@Local Market Price
Yield/Plant (kg)Total Yield (kg)Yield/Plant (kg)Total Yield (kg)
Tomatoo2.188.2142130.23906
Bringal1.4460.480.9138.2298.72961
Chilli0.4820.160.4820.1640.323225.6
Bottle gourd5.571.58.4109.2180.75421
Water spinach18361836721440
Green spinach1020102040800
Red spinach1224122448960
Spinach15301530601200
Total 21,113.6
Benefit(BDT)/m2/year138.90
Publisher’s Note: MDPI stays neutral with regard to jurisdictional claims in published maps and institutional affiliations.

