3.1.1. Thermal Dynamics of URTA
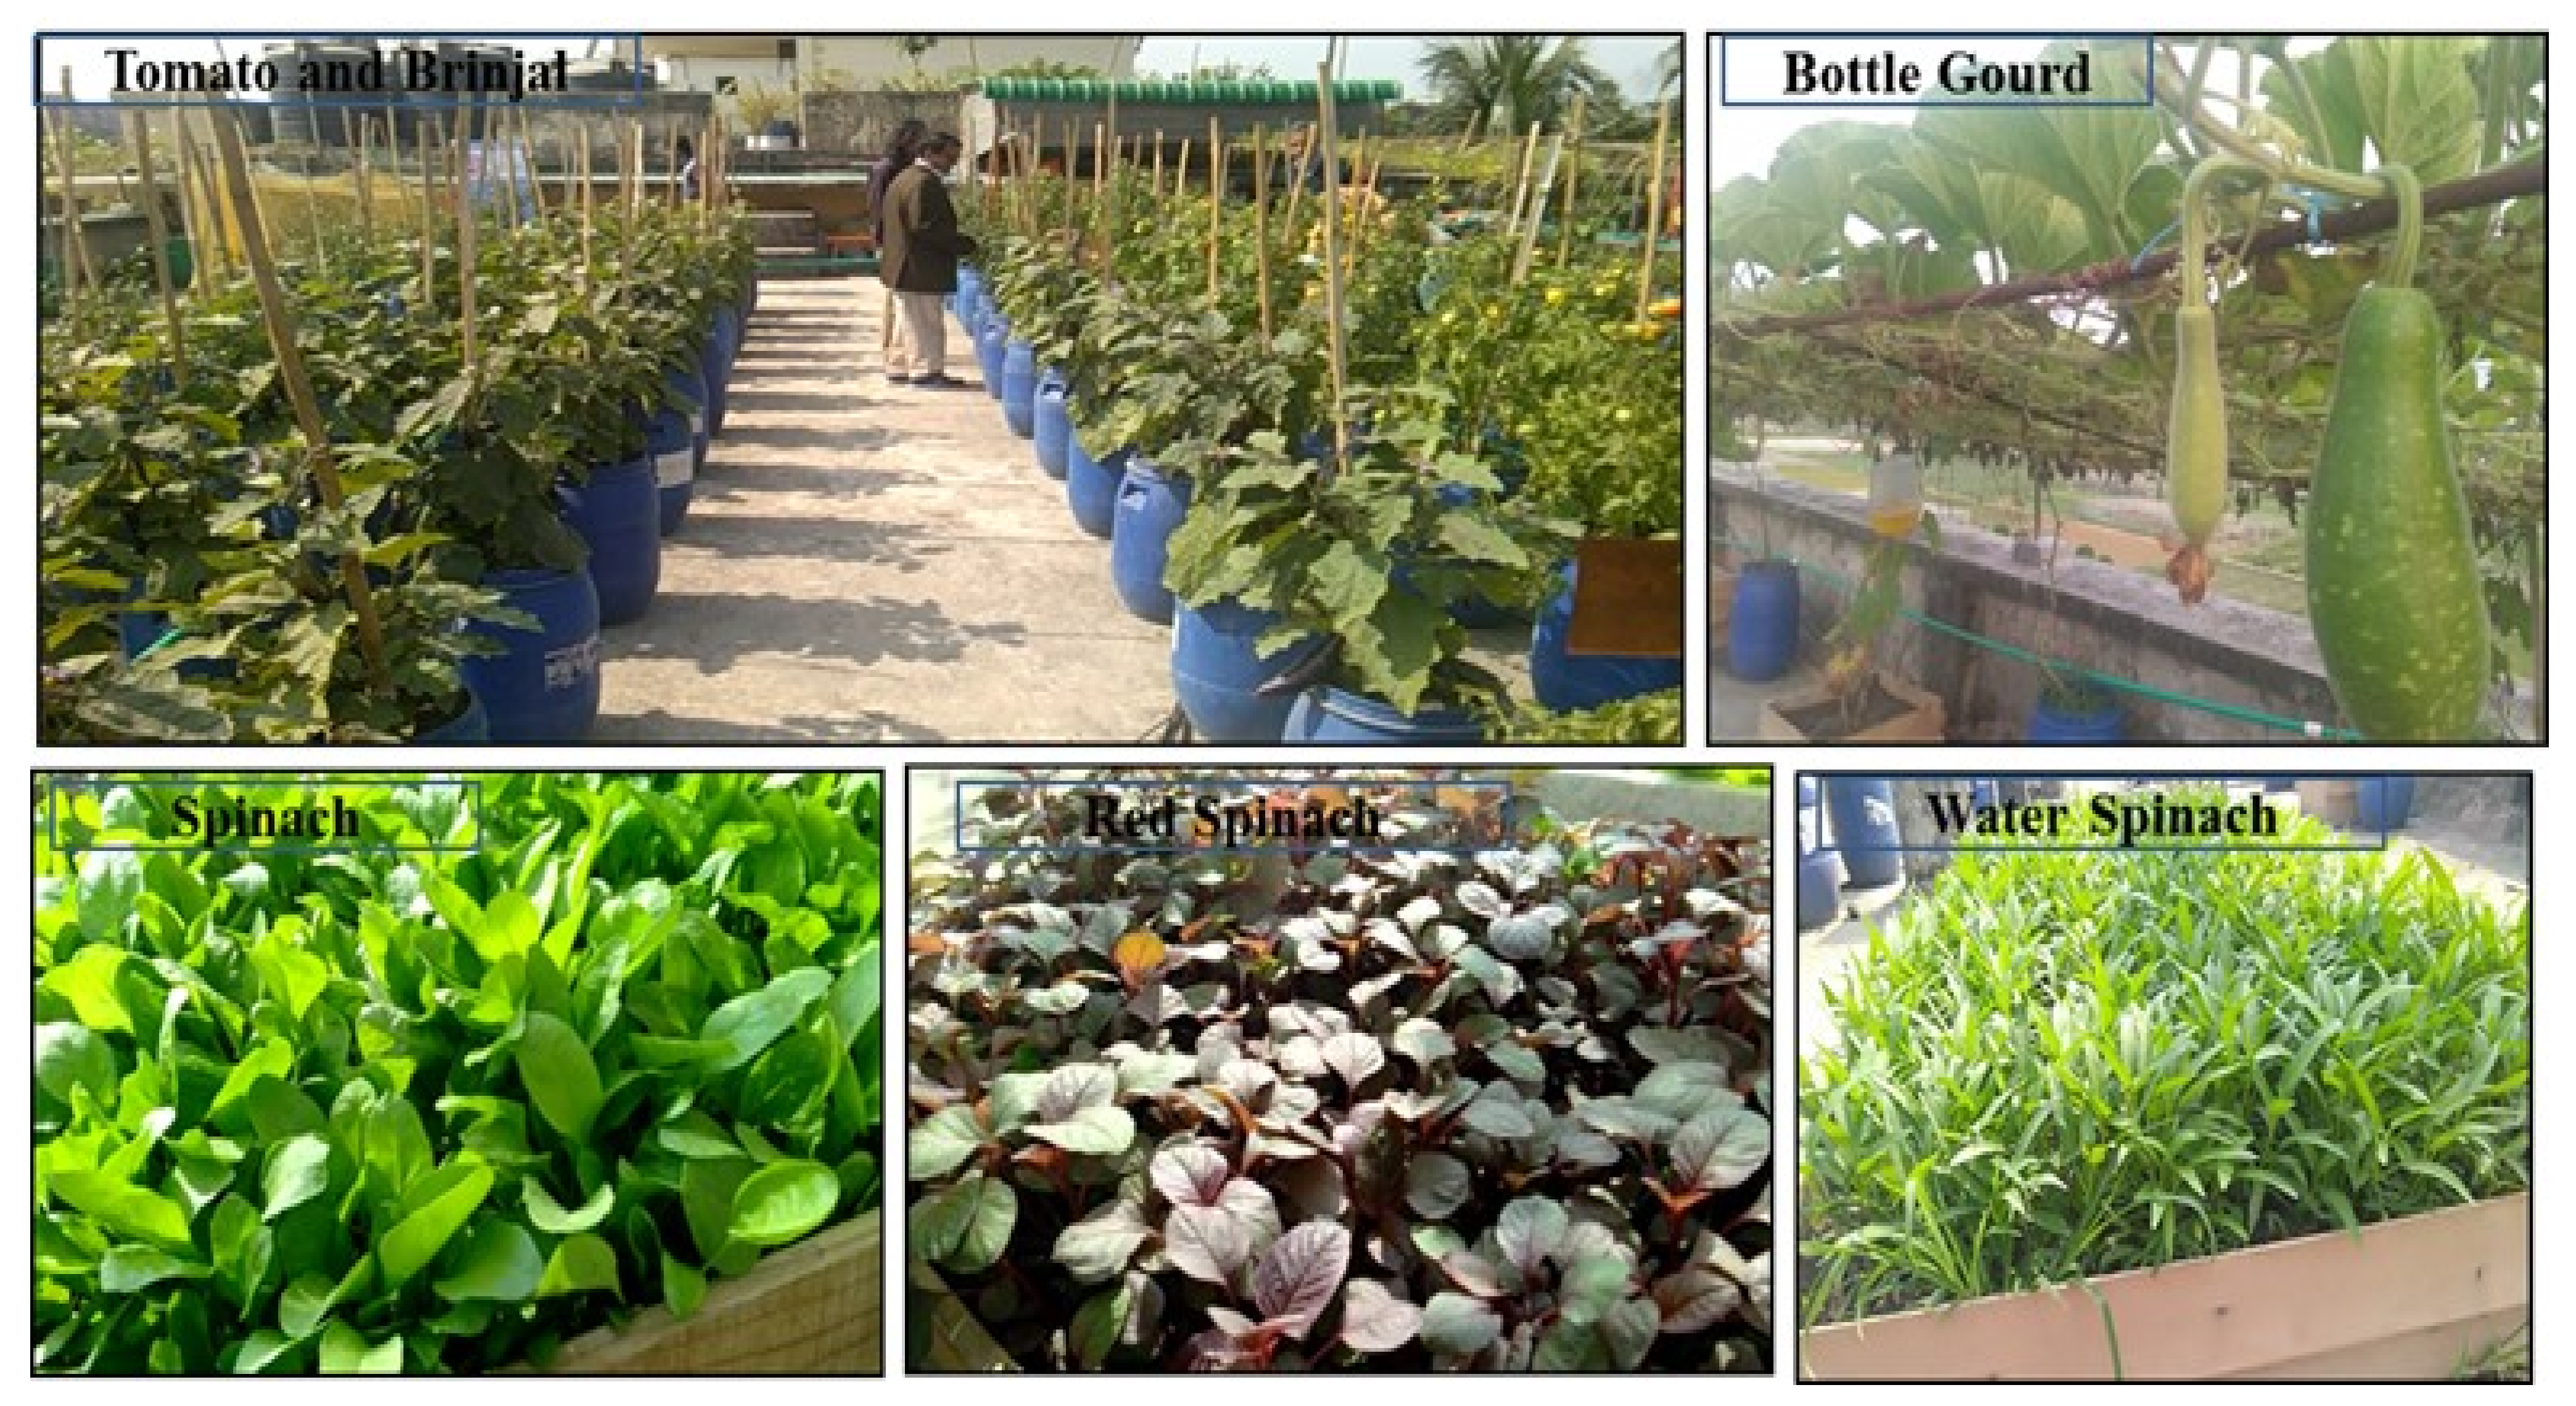
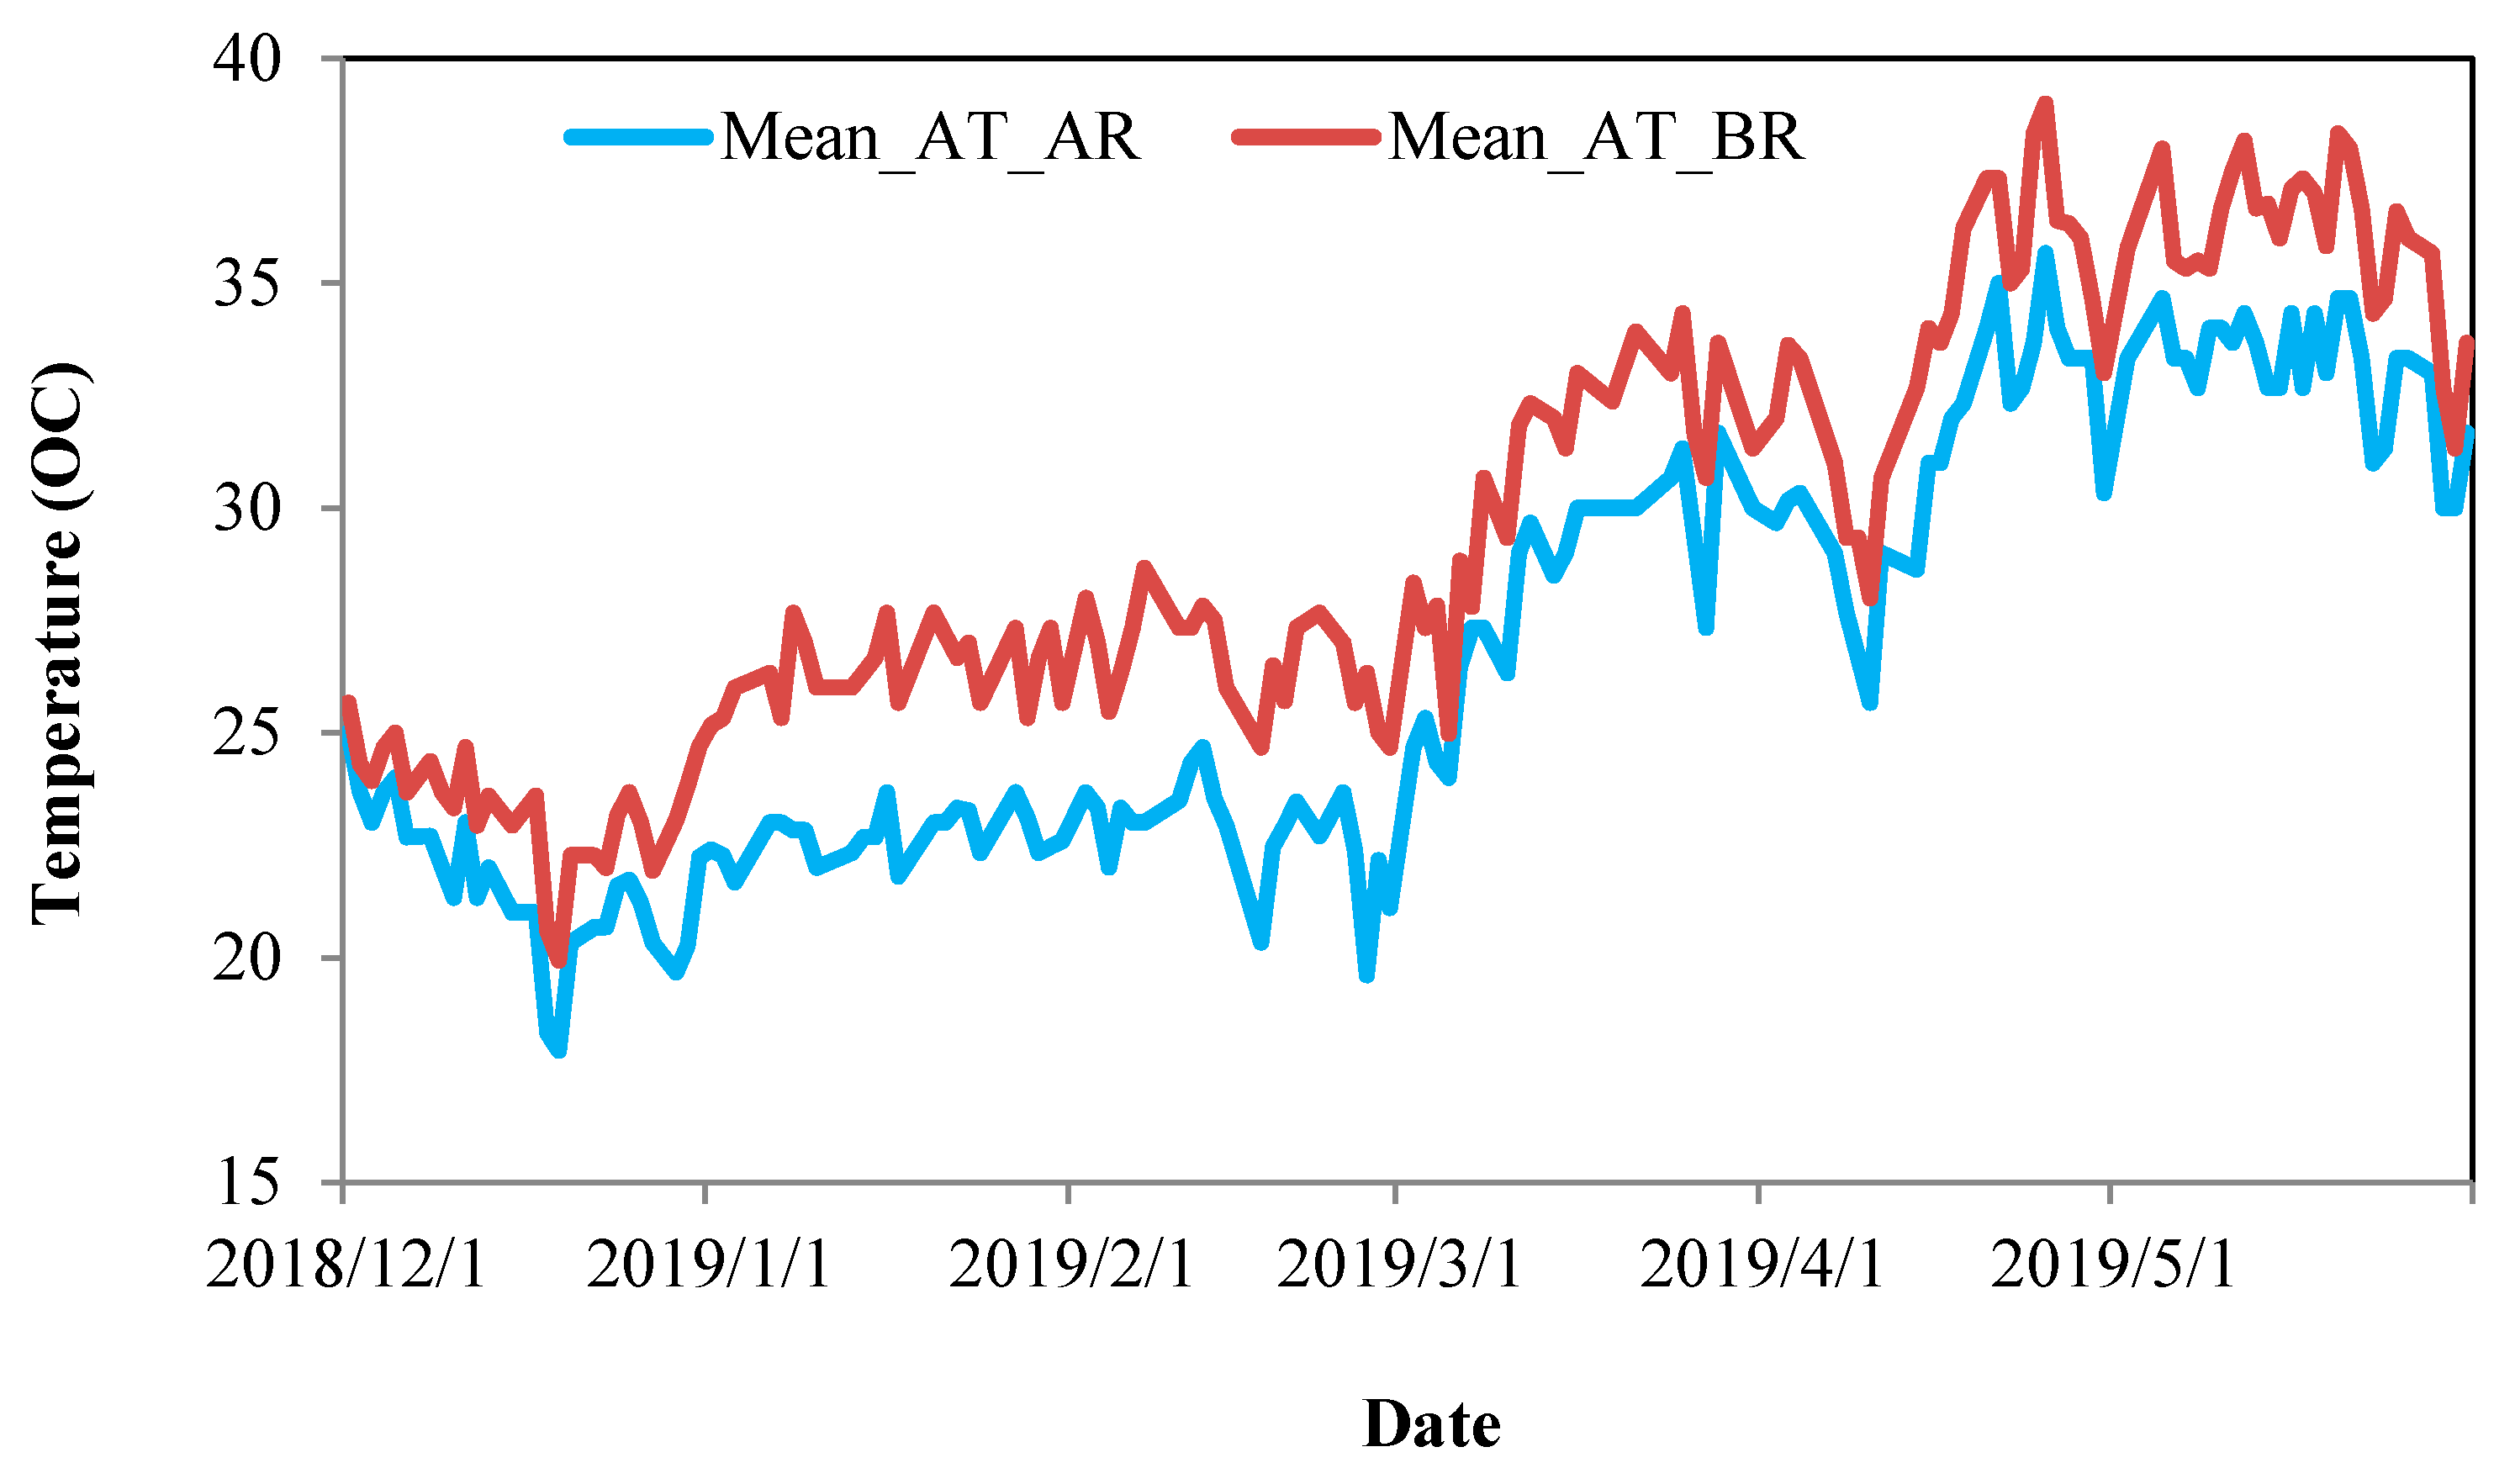
Changing air temperature aspects were observed from different locations of the experimental AR (70% of roof area covered by agriculture with cultivation of Tomato, Chili, Brinjal, Bottle groud, Spinach, Red Spinach, Green Spinach) and from the nearby BR during the whole experimental period. The average temperatures of different times of a single day are shown in
Figure 4. However, it has been detected that the temperature reached its maximum range during the month of May at 1.30 p.m., for both AR and BR (
Table 4) plots, in comparison to 9.30 p.m. and 5.30 p.m. According to the descriptive statistics, the trend of the air temperature of the BR was always higher than the AR throughout the day.
According to
Table 4, the maximum temperatures of the BRs were 2 °C (9:30 a.m.), 5 °C (1:30 p.m.) and 4 °C (5:30 p.m.) higher compared to the AR (experimental roof). Consequently, the minimum temperatures of the BRs were 1 °C (9:30 a.m.), 2 °C (1:30 a.m.) and 2 °C (5:30 p.m.) higher compared to the ARs. The comparison of the mean temperature between the AR and the BR showed that the AR, with 70% of its area covered by plants, was 2.61 °C, 3.41 °C and 2.66 °C cooler than the BR at 9:30 a.m., 1:30 p.m. and 5:30 p.m., respectively. In the case of rainy days, the temperature differences of both roofs became very minimal. So, rain periods were avoided for temperature data analysis.
In this study, percentiles are used to understand the values of thermal dynamics in ARs and BRs, as well as to clearly recognize the advantage of URTA due to reduction in temperatures. From
Table 5, it is clearly seen that the different percentile ranges of ARs were always higher than that of BRs. This means that of the 5, 10, 25, 50, 75, 90 and 95 percent temperature values, ARs had a range that was always less than BRs at the same temperature range. Similarly, the air temperature difference histogram, recorded from the five selected roofs (85, 80, 60, 50 and 40% roof area covered by agriculture) and the nearby BRs at 1:30 p.m. and 1.52 m above the roof surface, is shown in
Figure 5. The histogram represents the mean value, standard deviation and normal distribution of the temperature difference frequencies of the different area covered roofs during the month of March. From the temperature differences analysis, it was exposed that during the month of March, the maximum frequencies of temperature differences were 5.5 °C, 4.5 °C, 3.5 °C, 2.3 °C, 1.2 °C and 0.45 °C in 85, 80, 60, 50 and 40% roof area covered by agriculture, respectively (
Figure 5).
The mean temperature differences in April and May of those selected ARs and BRs were found to be 4.76 °C, 4.29 °C, 3.37 °C, 2.19 °C, 1.18 °C and 0.41 °C, and 4.41 °C, 3.51 °C, 3.42 °C, 1.85 °C, 1.00 °C and 0 °C in 85, 80, 60, 50 and 40% covered roof area by agriculture, respectively. The minimum and maximum temperature differences in March were recoded as 3 °C and 6 °C, 2.10 °C and 7.20 °C, 2 °C and 6.5 °C, 1 °C and 3 °C, 0.1 °C and 1.8 °C and −1 °C and 1 °C of ARs and BRs, respectively. A 95% confidence interval for the mean was also calculated from the observed temperature differences between ARs and BRs through SPSS. It was revealed that the lower and upper bound of the 95% confidence interval for a mean temperature difference of those ARs and BRs were 4.55 °C and 5.08 °C, 3.90 °C and 5.32 °C, 2.83 °C and 3.91 °C, 1.79 °C and 2.26 °C, 0.85 °C and 1.18 °C and −0.36 °C and 0.27 °C, respectively. So, it is experiential that 50 and 40% covered roof area by URTA obtained a lower temperature reduction, recording a maximum of 1.8 °C and 1 °C and a minimum of 0.1 °C and −0.1 °C at 1:30 p.m. during the month of March to May, respectively. On the contrary, the 85, 80, 70 and 60% URTA were equally and highly effective on air temperature reduction compared to 50 and 40% roof area covered URTA roofs and BRs at the hottest time over the day during the summer season. However, the most noticeable difference is shown by the 85% roof area covered AR, which maintained its temperature variances and standard deviation as 0.34 °C and 0.58 °C compared to the other selected roofs. Thus, the temperature difference should vary on the percentage of area covered by rooftop agriculture persists during the day at 1:30 p.m.
3.1.2. Near Roof Surface Thermal Dynamics in AR and BR
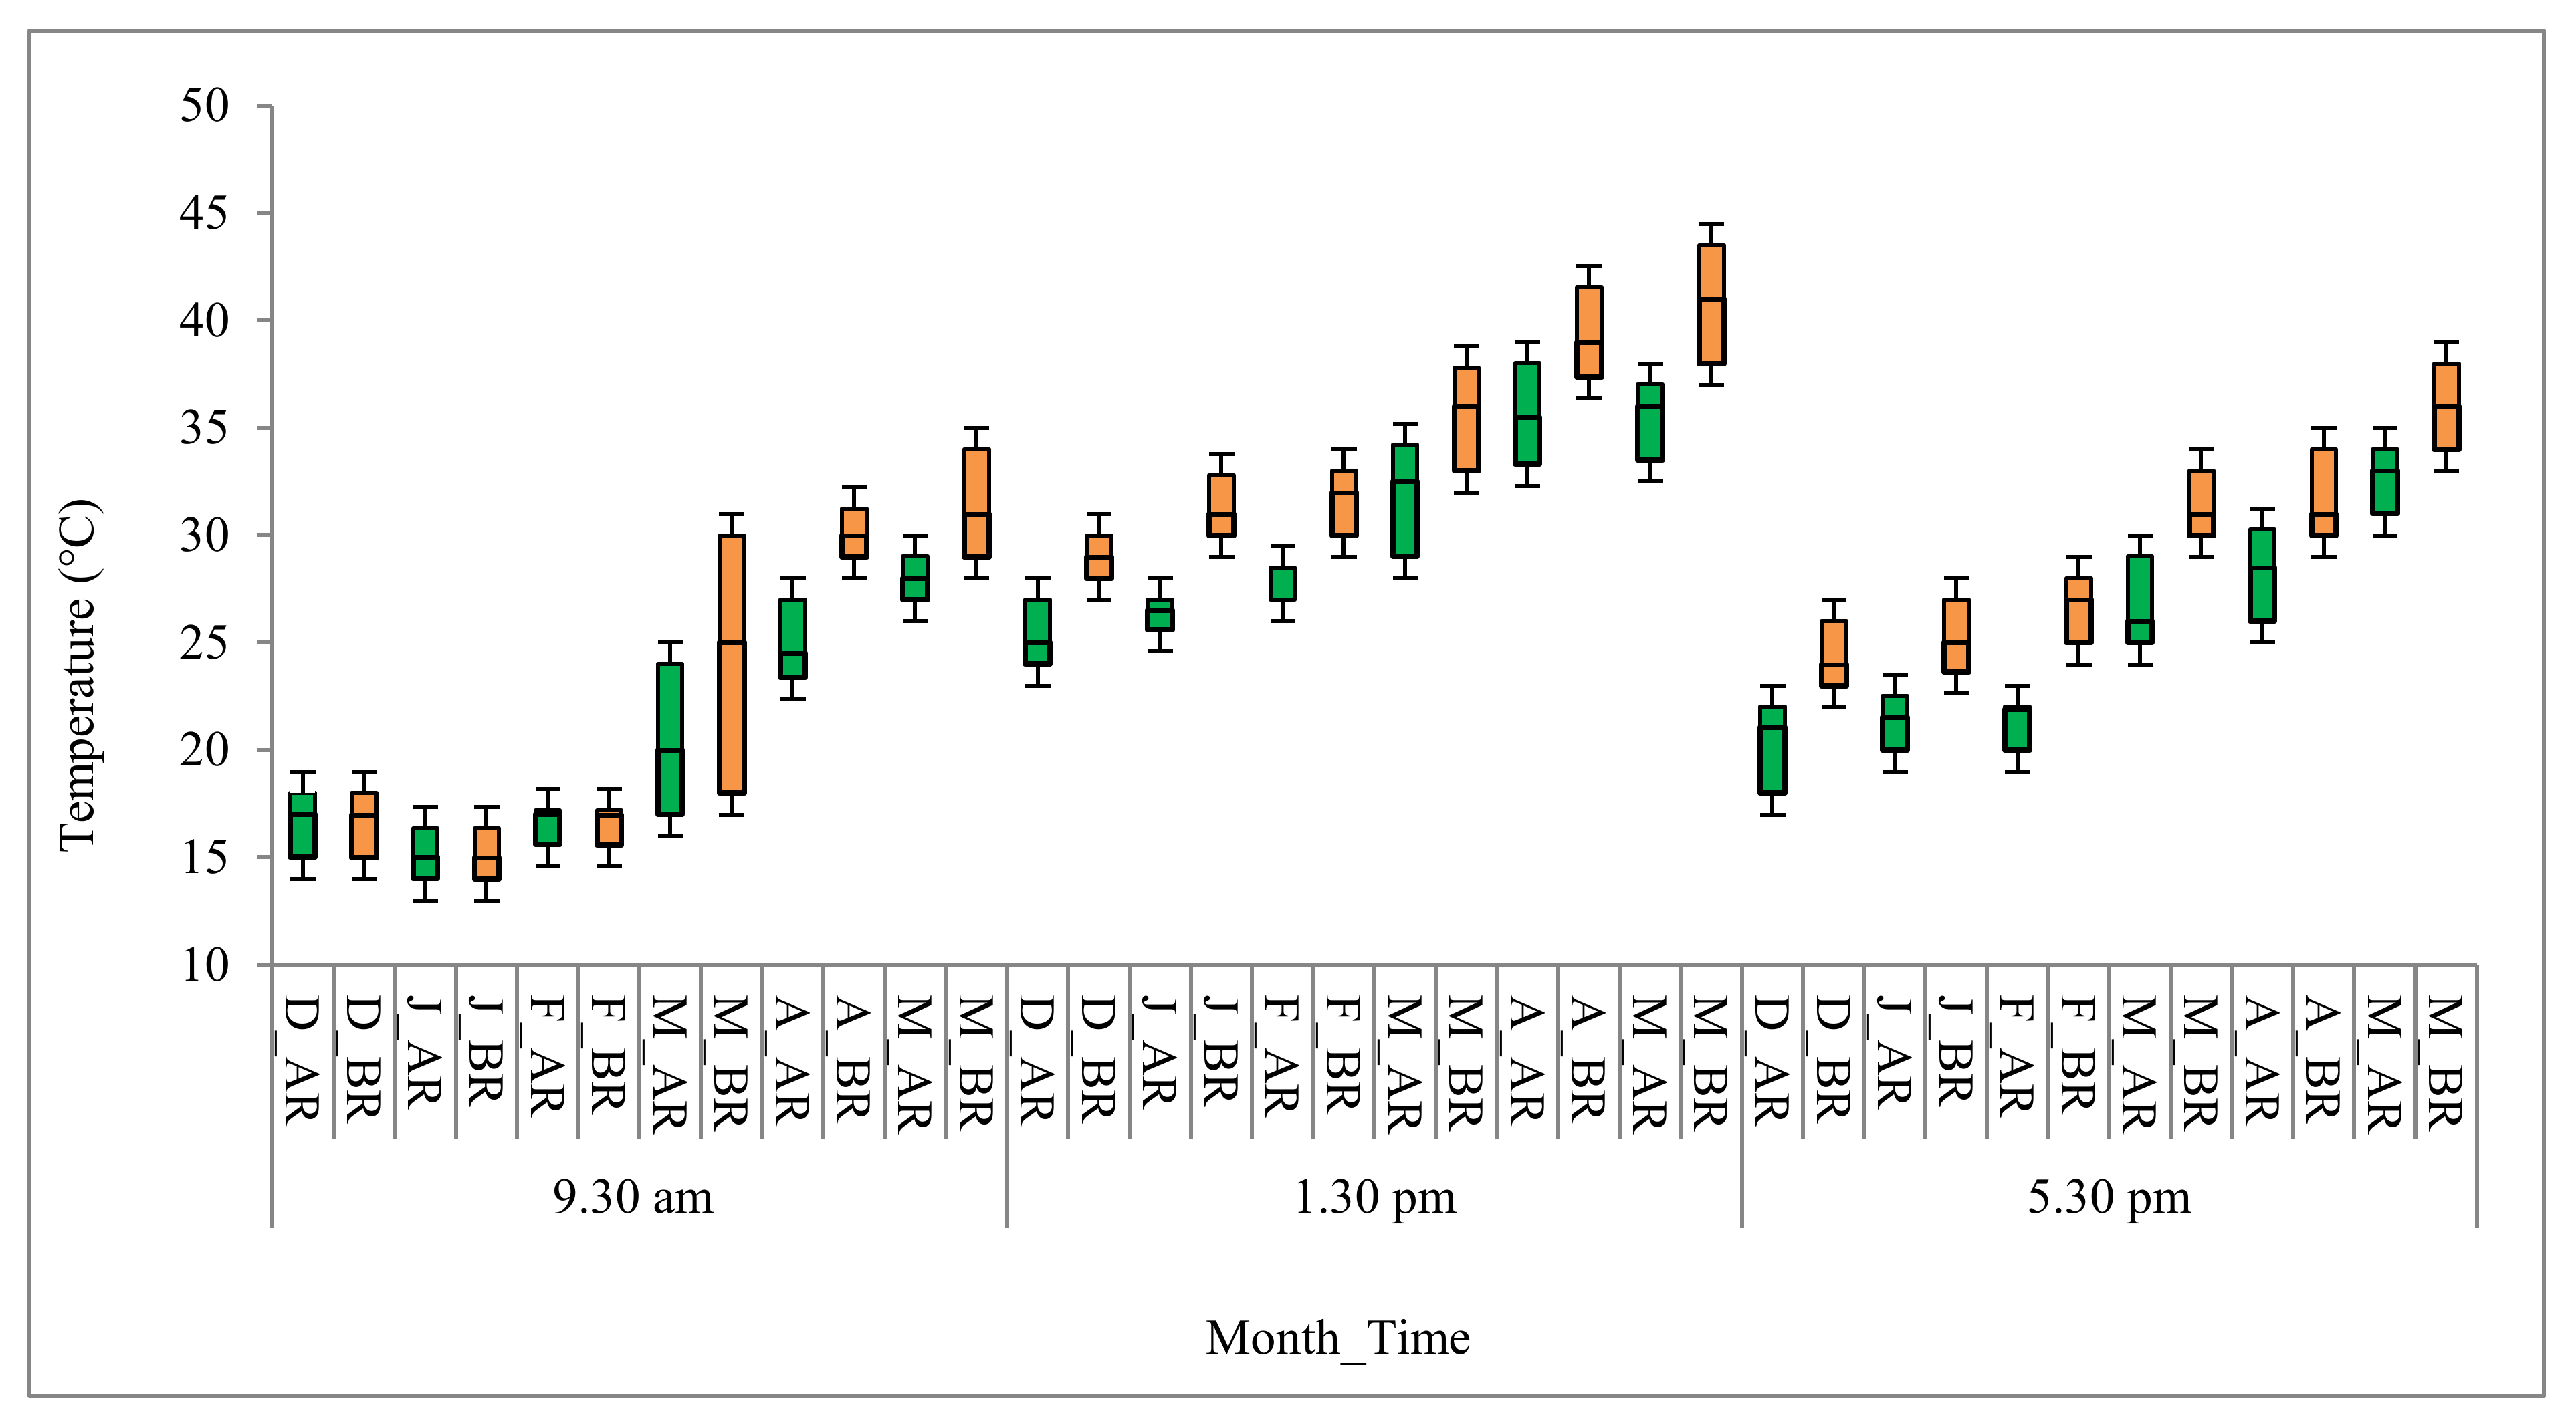
The potential ranges of exterior roof surface temperature reduction were calculated for the experimental AR and BR. The winter and summer season variation of the near roof surface for the AR and the BR is presented as a Box-and-Whisker plot in
Figure 6. This box-and-whisker plot shows the lowest value, highest value, median of surface temperature and performance on the roofs.
From
Figure 6, it is shown that the variability of the roof surface temperature was higher in the BRs for the month of December 2018 to May 2019 (both winter and summer seasons) than ARs. It should be noted that roof surface temperature in both roofs significantly varied at 1:30 p.m. and 5:30 p.m. comparatively with 9:30 a.m. due to the shadow-shading effect or the higher leaf density of plants on the building roof surface. The maximum difference was 12 °C during the month of May, and the average difference was found to be 6 °C on a specific day. It was also observed from one sample
t-test that there was no significant temperature difference during the months from December to February at 9:30 a.m. However, from March to May, the temperature significantly differed by 3–12 °C at 9.30 a.m. Similarly, at 1.30 p.m. and 5.30 p.m., the temperature reduction was 4 to 12 °C. It was also reviewed that on semi-intensive green roofs, the roof surface temperature reduction was found to be 7 to 14 °C [
53]. The results showed that the URTA roof was very effective in peripheral surface temperature reduction and thereby provided thermal shading to the building. The degree of surface temperature reduction by the URTA increased with the increased solar intensity, as a higher reduction was observed during the daytime at 1:30 p.m.
3.1.3. Air Temper Inclines in AR Relative to Distance from Roof Surface
Table 6 represents the temperature gradient at the north–south, middle and east–west side of the AR at 1.25 m above the roof surface from January to April 2019 daily at 9:30 a.m. and 1:30 p.m. The mean temperature incline, measured below the canopy shading at near roof surface 1 m, 2 m, 1.25 m and 2 m above the roof surface, varied within a confined average range of 0.74 °C to 2.32 °C and 1.15 °C to 3.37 °C on the AR during March at 9.30 a.m. and 1.30 p.m., respectively. On the BR, the air temperature incline at different heights varied within the range of 0.50 °C to 1.1 °C and 1 °C to 1.7 °C at 9:30 a.m. and 1:30 p.m., respectively, in March. It was also clearly observed that the temperature gradient was lower below the fencing panel at the north and south sides of the experimental roof compared to other locations, such as the middle, east and west side of the experimental AR where the fencing panel was 1.5 m above the roof surface. Leafy vegetables cultivated under the fencing panel worked as an additional input for lowering the heating effect. The canopy density and height of plants resulted in the temperature change at different heights during the day. It was an upward trend both at 9:30 a.m. and at 1:30 p.m. in the case of the BR. However, for the experimental AR, the temperature variance trend was upward at 9:30 a.m., whereas, at 1:30 p.m., the temperature variance moved downward. Irrigation was given in the experimental AR each morning and in the afternoon by drip irrigation system according to crops’ water requirements. So, this impact was limited to affect the temperature changes at a different height. On the other hand, solar intensity was low in the morning compared to noon (1:30 p.m.), and air warming in the morning differred at different heights with little effect. It is notable that the maximum variances occurred on the near-surface at 1.2 m height compared to at 2 m height from the roof surface. Thus, the thermal variation at different heights was more effective in the AR than BRs during the peak solar intensity. It was shown that the highest reduction in the temperature gradient was relative to the density of the canopy and plant distance. This was caused by the difference between the dense greenery and the increased evapotranspiration on the roof. However, the temperature gradient at different sides and heights through URTA created a much cooler microclimate than that of the adjacent BR surface. This could be due to the heat absorbance by plants. Solar radiation and evapotranspiration caused an average temperature gradient of 7.12 °C on the roof surface of 4.58 °C, 2.79 °C and 2.01 °C at 1 m, 1.25 m and 2 m from the roof surface, respectively, compared to the BR. It could be described that there was a relatively cooler air layer on the AR up to 1 m and warmer air above 2 m from the surface around noon. However, at the BR, the temperature suppression was more pronounced at near roof surface and gradually decreased up to 1.25 m, which was also higher than the agricultural roof.
3.1.4. Relative Humidity Dynamics of AR and BRs
In order to assess the effect of rooftop agriculture upon microclimate changes, the average mean, minimum, maximum, standard deviation and variance of the relative humidity (RH) were analyzed from December 2018 to May 2020, collected daily at 9:30 a.m., 1:30 p.m. and 5:30 p.m. The trends of RH in the AR and BR are shown in
Figure 7a–c. The maximum, minimum, mean and standard deviation (SD) of RH were observed as 88.83, 30.67, 56.92 and 11.44 for AR and 25.33, 78.67, 49.29 and 10.64% for BR, respectively. Minimum 5% and maximum 10% variations were found between the AR and BR, which indicates that rooftop agriculture is proficient in increasing the RH in the air layer compared to the BR, and it influenced the microclimate of the surrounding air by its evapotranspiration. So,
Figure 7a–c demonstrates that the relative humidity changes in the AR were always higher then the BR, which played a significant role in the thermal behaviour of the roof in the daytime at 1:30 p.m. As humidity itself was a climatic variable, it also influenced other climatic variables. Thus, URTA would have positive impacts on the thermal comfort of the people living in urban cities through the reduction of air temperature. So, it is highly recommended to include URTA in the building code of Bangladesh to mitigate the UHI effect. It is applicable for all regions of the globe to reduce global microclimatic change during warmer seasons.
3.1.5. CO2 Dynamics for the AR and BR
An average 1.63% reduction of CO
2 concentration was observed at 1 m above the roof surface in the experimental AR compared to the adjacent BR within the period from December 2018 to May 2019. The significances of the concentration were analyzed through regression analysis and shown in
Figure 8. However, it was observed that the mean concentration of CO
2 (ppm) was 400 ppm and 406 ppm in AR near the plants and in BR, respectively. The maximum concentrations were found to be 431.00 ppm and 440 ppm in AR near the plant and in BR, respectively. Different percentiles of CO
2 concentration were also analyzed. It has been found that the 75, 90 and 95 percentiles of CO
2 concentrations were 404 ppm and 408 ppm, 413 ppm and 410 ppm and 414 ppm and 419 ppm in AR and in BR, respectively. So, the study found that the AR had a higher respiration rate from plants that cause the differences in CO
2 concentration compared to the nearby BRs same as green roof [
54]. Hence, AR is able to mitigate the microclimatic changes in urban cities and the UHI effect by reducing heat-trapping gas concentration leading to thermal comfort at a local scale. The regression model was fitted to CO
2 concentration values of both roofs from December to May. A total of 141 days, which were represented by the sequence in the
Figure 8, and the deviations from the fitted line to the observed values were noted. The linear line denotes the validity of all values with the dates, which had a negative linear correlation with CO
2 concentration. It indicated that there was no positive relation with date or month, but in the AR, CO
2 concentration was comparatively lower than BR. From February to April, the maximum values were close to the regression line, i.e., the maximum values were found to be close to 401 ppm and 410 ppm for the AR and BR, respectively. So, the URTA plays a very crucial role in the microclimatic changes and controls the temperature and CO
2 rises (1 to 10 ppm) with and around the roofs.
3.1.6. CDD and Cooling Load Potential Dynamics of Different Type of URTA
This study showed that, for the lower percentage of area coverage by ARs, CDD was nearly same to the adjacent bare roofs and differs by only 0.18 °C. However, for the higher percentage of area coverage by ARs, the CDD difference was found to be 4.25 °C. AR was more suitable for decreasing ambient temperatures and for reducing the cooling load between 32% and 100% [
55,
56]. From
Figure 9, it is found that the possible mean CDD difference was subordinate between the lower percentage of green area coverage and higher percentage of green area coverage of roofs. At least 60% of green area coverage of roofs could be chosen where CDD difference is increasing compare to BR.
A paired sample
t-test with a 95% confidence interval was used to compare the means of cooling load potential (KW/m
2) of selected ARs and nearby BRs with six pairs (
Table 7). There was a significant difference in cooling load requirement for the different area coverage of ARs (M = 0.788 to 1.30, SD = 0.0062 to 0.01332) and nearby BRs (M = 1.369 to 1.387, SD = 0.0108 to 0.0280). These results suggested that AR had a substantial cooling effect and depended on the roof area coverage by agriculture. Our research results suggested that when the agricultural roof was covered more than seventy percent, cooling load requirement decreased. The maximum cooling load prerequisite was 1337.74 W/m
2 for the 40% area coverage AR, and the minimum cooling load prerequisite was 772.31 W/m
2 at the 85% area coverage AR compared to other ARs. However, it was detected that among these roofs, indispensable cooling load varied from 12.15 to 20.34%. Therefore, due to the increases in area coverage of URTA, the daily peak cooling load value would be decreased and cooling load saving increased significantly.
3.1.7. Energy Savings Dynamics of Different Type of URTA
The buildings with intensive, semi-intensive and extensive green roofs could save about 20–60, 10–45 and 20% energy consumption, respectively [
57]. On the other hand, ARs could save 1 to 34% of the amount of total annual energy consumption, 10 to 33.33% of the space cooling load and 20 to 50% of the peak space load [
3,
58]. According to
Table 8 and
Table 9, it was observed that energy consumption decreased in the high area covered ARs, and different percentile levels of energy savings were observed in all roofs with the increase of green areas. It was clearly observed that 85, 80, 70, 60, 50 and 40% of roof area covered ARs saved energy on top floor of a building by 59.45, 55.63, 39.81, 25.94, 18.88 and 5.87%, respectively.
Sixty percent or below 60% area covered ARs saved energy up to 30%. In the case of 60, 50 and 40% of the roof area covered ARs, the 95th percentile of energy saving was as much as one-fourth to one-fifth compared to the 70–85% roof area covered ARs. The results showed that energy consumption differed in all roof options, which was closely related to the area covered by ARs, soil and density of leaves and plants. On the other hand, in the summer season, the energy consumption reduction was barely significant, which is shown in the quantile-quantile (Q-Q) plot normal distribution in
Figure 10a–c. The Q-Q plots represent the probability distributions of all values of energy savings by plotting their quantiles against each other and creating a perfectly straight line for the 40, 70 and 85% roof area covered ARs. From
Figure 10a–c, it was confirmed that there was a significant potential application of ARs as an energy conservation approach in buildings in hot and moist climatic conditions. However, it can be seen that the energy saving fluctuations of ARs were always less than the thermal fluctuations of BRs, especially in the warm months of the year. However, the equipment operation efficiency was not considered in this study to calculate the energy saving.


