Abstract
Cities are leading in the implementation of circular economy (CE) principles and sustainable development due to the concentration of knowledge, resources and technology while remaining the highest consumers and producers of resources. CE, urban metabolism (UM) and industrial symbiosis (IS) offer a new more holistic approach based on material and energy flow analysis and materials recovery from waste by creating IS networks to support a new circular urban system (CUM) which contrast to the traditional linear extract-produce-use-dispose model of economic systems. In this paper, we present the concepts of CE, IS and CUM and how the new framework could improve cities transition to sustainability and CE, with detailed CE and IS indicators analysis. We introduce the relations between IS, CE and UM concepts, how they can be used and monitored in the CUM framework. CUM can help unite urban planners, the city’s governance and the business sector to promote collaboration across the city to improve future sustainability and circularity by closing loops.
1. Introduction
The circular cities concept is more relevant than ever in the context of growing problems caused by climate change, rapid urbanization, and growing demand for resources and services to maintain the same level of life quality. The recent publication of Bradshaw et al. [1] presents a ruthless analysis of the current environment by questioning governments’ capacity to mitigate the erosion of ecosystem services, their ability to grasp the scale of threats to entire biosphere, humanity, and our well-being, and our efforts’ effectiveness in improving future environmental conditions. Today’s society focuses on meeting the rising average standard of living and short-term improvement by eliminating the need to restore biodiversity loss which now is recognized as one of the top global economic threats along with climate action failure, extreme weather, and natural disasters [1,2].
Today only 8.6% of the world economy is circular and this is 0.5% lower compared to 9.1% in 2018. This should arise politicians, society and business sector awareness, and concern about the success of reaching the 2030 Agenda for Sustainable Development Goals. The main reasons for this negative trend are: (1) high rates of extraction—over the past 50 years the global use of materials is more than 3.5 higher from 26.7 billion tonnes in 1970 to 92.0 billion tonnes in 2017; (2) growing urbanization and population concentration in the cities increase the demand for housing, which driving stock build-up dynamic to build-up utility infrastructure for energy, water, sanitation, communication and mobility services, short-lived material flows (e.g., clothes, electronics), and long-term stocks (building infrastructure and capital equipment); (3) processing and recycling are not sufficient to meet world economy demand [3].
While cities occupy only 3% of the world’s surface, the concentration of the population in urban areas is about 55% and is expected to increase to 68% by 2050 [4]. Today urban areas consume about 75% of the world’s resources and are responsible for 60–80% of the total greenhouse gas emissions [5]. Domestic materials consumption in the cities is predicted to grow faster than the urban population and it is projected to reach approximately 90 billion tonnes by 2050 [6]. The growing population in the cities will reshape the global economy and demand for resources. The importance to improve and optimize resources extraction, develop the use of renewable resource and optimize materials and energy recovery from the waste along with economic growth and reduced impact to environment are highlighted in the 2030 Agenda for Sustainable Development, and in the recent published Circular Economy Action Plan the European Green Deal. Sustainable Development Goal (SDG) 11 “Make cities and human settlements inclusive, safe, resilient and sustainable” materializes cities role to pursuit of sustainable development.
Cities and regions have a key role to play as promoters and enablers of the circular economy, because of their high concentration of knowledge, resources, and technology [7]. Cities are open systems depending on their hinterland for energy, water, food, goods, and other resource flows [8]. Cities see the circular economy as a tool to address many challenges: becoming more sustainable, ensure materials, and energy efficiency, resolving climate change and public health problems [9,10]. The implementation of the CE relies on the city, region, or even country political context, cultural norms, society participation, level of technology, and industrial development [7,8].
The CE refers to a new systematic approach that focuses on changes throughout value chains and wastes elimination by using new ways of turning waste into a resource and new models of consumer behavior [11,12] where different models such as UM and IS could be incorporated to close loops in the city perspective. In the context of cities’ unsustainability patterns, rapid depletion of global resources, and cities’ impact on global warming, UM model allows identification and spatialization of flows within cities’ for resource consumption analysis, projection of future cities urbanization plans with the support of new technologies, and innovations [13]. UM material and energy flow analysis stimulate the transition from a linear perspective to a networked and cyclical perspective, turning waste into resources and energy, and reducing the city’s dependence on the hinterland for resources [14]. In addition, IS as a business model relies on shared infrastructure and by-products to increase resource efficiency by creating value from waste [15].
The aim of this paper is to conceptualize the implementation of industrial symbiosis in the context of CUM by analyzing the concept of IS and CUM and how they can work together for sustainable implementation. Finally, we present the improved model of CUM with IS networks.
2. Materials and Methods
CE strategy or plan implementation cannot be successful without adequate indicators and integrated management models. It will allow efficiency changes in cities’ urban planning towards the new sustainable and circular paradigm.
The European Commission [16] highlights the necessity to have a developed monitoring framework that aims to measure the performance of different areas directly or not directly contribute to the CE implementation.
The literature review helps to establish the research problem and identify the gaps in the theoretical framework. The research was conducted using literature review and the official documents and reports of circular cities to indicate CE indicators within the city and how IS with UM could be integrated with CUM framework (Figure 1).

Figure 1.
Methodology.
The review of existing literature and publications was used to present the concepts of circular city, industrial symbiosis and circular urban metabolism, to map and assess how CE, IS and UM concepts correlate with each other. Scientific literature was collected from “Elsevier’s Scopus”, “Elsevier’s ScienceDirect” databases, and Google Scholar using keywords “circular economy”, “industrial symbiosis”, “urban metabolism”, and “circular urban metabolism” to investigate the relationship between those concepts and find common points. This was used to develop the theoretical framework of CUM in the context of industrial symbiosis.
The criteria for selecting circular cities for CE indicators is presented in Table 1. The highest concentration of circular cities is in Europe. It can be explained by pro-circular EU policy and financial support transitioning to CE. In this study two criteria were applied selecting circular cities: published city’s CE document (strategy, roadmap or plan) and officially identified CE indicators. The results of the inquiry on the presence of circular cities CE documents and indicators is presented in Table 1.

Table 1.
Circular cities selection for CE indicator analysis (prepared by authors).
Cities which are moving towards implementing CE but not have produced CE documents are not included in CE indicators case study. The purpose is to capture a wide and varied set of metrics of circular economy cities through selected samples CE metrics review comparing with CE scopes identified in CE strategic documents. A total of 10 cities (see Table 1) have been selected according defined criteria.
The improved CUM framework with identified monitoring indicators was proposed based on the CE, IS, and UM literature review and circular cities indicators analysis results.
3. Results
3.1. Understanding Circular Economy Concept
CE is gaining momentum among politics, academia, industry, and society putting forward a number of environmental, economic, and climate-related benefits The CE concept as a political strategy was introduced by the EU in 2015 in the document called “Closing the loop—An EU action plan for the circular economy” and marks the beginning of EU’s new international policy and efforts to encourage economy’s transition from linear to circular. The presented CE concept focuses on solving socio-economic and environmental problems [29] proposing long term solution based on a closing-loops framework. CE implementation involves systematic change, technological innovations, and consumers’ behavioral changes, so the concept itself is broader and covers not only resource extraction, production, and product use, but all business activities, consumption, and cultural changes reducing the use of primary resources [30].
The European Green Deal presented in 2019 presents an overarching aim to transfer Europe’s economy into a modern, resource-efficient, and competitive economy, with a fair and prosperous society and make Europe a first climate-neutral continent by 2050. It is also set the direction of the EU’s international policy where the EU takes the leading role building alliances with the like-minded. The Green Deal focuses on peoples, regions, industries and workers by encouraging closer collaboration with EU institutions and consultative bodies [31].
CE implementation highly depends on how the concept is understood and which line of implementation is selected. While EU’s CE package defines CE as a transition “where the value of products, materials and resources is maintained in the economy for as long as possible, and the generation of waste minimized”, there are a number of studies focusing on the CE concept definition. However, to get a broader understanding of CE and how it is implemented within cities, it is important to analyze countries’ national documents and strategies and their understanding of the CE concepts. The definition of CE allows to understand the political direction and priorities in the circular transition process. Countries’ CE definitions are presented in Table 2.
Table 2.
Countries and CE definitions (prepared by authors).
Authors were able to identify 17 Europe countries with national level documents where the approach of the CE was identified. By critically considering CE from sustainable development perspective and its three dimensions, economic, environmental, and social, the paper presents the key aspects of countries’ CE concepts (Figure 2).
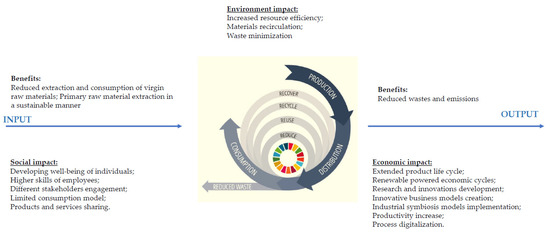
Figure 2.
CE and its impact to sustainable development (prepared by authors using CE definitions presented in Table 1).
CE utilizes nature’s cycle for preserving materials extraction and improving economic use. All countries do pay attention to resource-efficiency narratives relating to material and resource extraction and recovery optimization, waste management and environmental impact minimization along with changes in production and consumption. Estonia and Portugal highlight the importance of digitalization, innovations and support for sustainable business models towards economic growth in their CE concept. Only Greece in their national CE strategy identifies IS as one of the key elements on the circularity path. It is important to note that most of CE definitions neglect social aspects as a part of sustainable development and only five countries (Belgium, Estonia, Ireland, Italy, and Luxembourg) included socio-political considerations of circularity with terms related to human and society well-being, stakeholders’ cooperation, and higher skills. On the other hand, the link between environmental and economic aspects is dominant in most of countries’ CE definitions. Some countries such as Austria, Germany, Lithuania, Poland, Romania, and Bulgaria do not have national documents or strategies, where the CE concept could be clearly defined.
3.2. Circular Economy Implementation in Cities
In the context of existing various definitions of CE, the concept itself can be understood as an “umbrella” [49,50] that is used to develop policies and strategies at different scales, from global production and international policies to cities and municipalities. Rapid growth of population in the cities causes environmental problems, increases resource consumption, energy use, and GHG emissions [51]. The rapidly urbanizing cities are the major engines of economic growth and can drive CE implementation gaining economic, environmental and social benefits. Ellen MacArthur Foundation [52] sees circular cities as systems that are constantly evolving, accessible and plentiful through waste elimination, high-value retention, and digitalization empowerment. Innovation and digitalization allow cities to use the most advanced technologies promoting economic growth, improving the quality and performance of city services [53] with reinforcement of sustainability.
Kirchherr et al. [54] in their analysis of 114 CE definitions suggest the application of CE where cities are introduced at the macro level as key players for the development of the CE framework. Prendeville et al. [55] define the circular city as “a city that practices CE principles to close resource loops, in partnership with the city’s stakeholders (citizens, community, business and knowledge stakeholders), to realize its vision of a future-proof city”. Their study focuses on geographically and administratively-bound cities’ units, while the city has several other dimensions and characteristics. Paiho et al. [56] extend the concept of a circular city focusing on resource flows and how it could be closed, slowed and narrowed down. In their definition the circular city “is based on closing, slowing and narrowing the resource loops as far as possible after the potential for conservation, efficiency improvements, resource sharing, servitization and virtualization has been exhausted, with remaining needs for fresh material and energy being covered as far as possible based on local production using renewable natural resources”.
A CE city seeks to create and ensure the well-being and resilience of itself and its citizens at the same time, separating value creation from the consumption of limited resources. Cities have well-developed infrastructure in different sectors with ongoing resource management efficiency projects that reduce the impact on the environment [57]. Cities’ urban systems which include buildings, mobility, products, services and food systems are interconnected into networks and play an important role in a city’s development [58]. Cities focus on smart products and production, more efficient use of materials and products with an extension of their life cycle [59].
Many cities today are strongly involved in CE activities. London, Paris, Amsterdam, Rotterdam, Prague, Helsinki have prepared city-level CE implementation strategies and plans [60]. Bernhardt et al. [61] presents 40 cases with city-level CE initiatives across the globe covering topics such as CE strategic documents, IS, public procurement, utilities, and municipal waste. Countries and cities, based on their government model choose different CE implementation approaches. CE can be implemented in two ways: bottom-up, when the business or interested parties play a key role encouraging CE development, or top-down where the government develops and design national or regional CE strategy [50,55]. Scientists analyzing CE implementation [50,55,62], noticed, that democratic countries in Europe or U.S. with strong business sectors and non-government organizations (NGOs), and social activists choose to implement CE from the bottom-up perspective. However, Amsterdam or Paris cities’ CE case analysis shows, that CE could be implemented using both-way communication between the municipality and business sectors, NGOs [62,63]. Cities with a high density of population, knowledge, innovations, and resources cause major environmental problems and have a high level of resource demand. Additionally, they have the necessary resources, innovations, and knowledge for CE implementation.
3.3. Concept of Industrial Symbiosis
IS can be understood as one of the approaches to realizing CE and one of the key strategies. Through symbiotic activities between different business sectors, IS improves CE by promoting sustainable resource use at the inter-firm level, minimizing input of virgin materials, and reducing waste [64,65]. The European Green Deal provides the action plan to transform the EU economy to resource-efficient and competitive moving to the CE [66] and IS is critical to Europe’s CE transition and resource efficiency [67].
IS concept was first introduced in the late 1980s approaching industrial system from an integrated point of view—an industrial ecosystem for the necessity of increasing the recycling, reuse of materials and by-products [68] to new products. IS is more focused on the industrial processes in production stages allowing companies that traditionally execute individual activities, cooperate in the networks for resource sharing [64] ensuring a competitive advantage for each member of the network [65].
IS is based on the basic principle of CE—to move from linear extract-produce-use-dispose model to strategic partnership-based business cooperation transforming waste into resources and materials [69], exchanging one industry waste to resource for other industry [70] for economic, social, and environmental purposes [71,72]. IS can reduce the amount of wastes from producer perspective, primary inputs as raw materials, energy and water used in the production process, and GHG emissions [73]. IS can potentially have positive social impact by creating new jobs for highly qualified employees [74].
IS only focuses on the manufacturing sector, while the CE is a broader concept and covers the entire cycle from resource extraction, production, consumption to re-use, remanufacturing, refurbishing, and recycling into new products [75], making IS an integral part of the CE [30,76]. Recent publications focus on IS as the business model for CE [15,77,78]. Baldassare et al. [79] presented the visualization of the IS framework on the three pillars of circular business: technical innovations, collaboration, and sustainable business model innovation, where innovations promote partnership between the sectors’ industries, capture the economic growth turning waste into value [15,80]. Sharing of knowledge and resources between network members boosts innovations, which leads to a competitive advantage over other businesses that are not a part of IS [81,82]. Over time, the concept of IS has expanded including services and infrastructure [83], social and knowledge-based inter-firm exchanges [84]. From an organizational perspective, IS can occur in a variety of ways through large-scale manufacturing firms (among production processes at the company), ecological or industrial clusters of companies located in the same or different areas (e.g., government plants, and business incubators) [65,85,86]. It means that geographical distance between companies might not be the main factor that determines the IS relationship, as long as synergy is convenient from an economic perspective [87]. Large-scale industries provide a critical mass of resources and by-products to develop IS in an eco-industrial cluster [65]. IS is understood as a network of business entities that may appear for different reasons, determined by existing infrastructure or come into being spontaneously [65], the form and participants of such network could change over time [65,82,88]. However, the concept of IS as an eco-industrial park is too narrow [89], in a broader context it may include a city or separate industrial sector [90] without limiting IS within a specific infrastructure or territory.
3.4. Concept of Circular Urban Metabolism
In the concept of UM, the city is defined as a complex system with robust and adaptive nature, maintaining their long-term integrity. Today’s cities are no longer appear to be static, isolated and disconnected. Now they interconnected in the network of exchange of goods, economies, work force and ideas with the surrounding environment that overcome regional, national and international boundaries [91,92]. Therefore, each investigation or research of the city must consider the network connecting all parts within the city and their links to the surrounding environment.
As a result of the growing concentration of population, production consumption, and amount of waste generated in the cities, urban systems are becoming more complex. Urban planning requires a more inclusive and sustainable approach in the cities for policymakers and urban planners to create a beautiful, healthy, and ecological environment to comply with the residents’ needs [93]. Some scientists analyze CUM through urban-industrial symbiosis [94,95] (also called industrial and urban symbiosis in some literature). Sun et al.’s [95] case analysis on urban-industrial symbiosis proves that it able to reduce the resource exploration in upstream, resource processing and waste disposal in downstream from an environmental perspective. Other researchers focus on energy saving and resource conservation from municipal solid waste treatment and IS system perspective to improve the overall energy recovery efficiency of the city as a whole [96,97,98]. However, focusing on material, energy flows from UM perspective and waste treatment is too narrow and the concept of urban-industrial symbiosis is more complex. A more holistic approach in the context of CE and sustainable development is necessary.
Cities are an integrated part of the surrounding environment, where different units operate. Rapid urbanization and growth of cities outside the city’s administrative boundaries links cities closely to surrounding regions, meaning city’s UM analysis should be expanded outside geographic territorial of the city itself. Especially when city streams (material and energy flows, transport) cross the city’s borders [56]. Scientist mostly focus on traditional and most visible physical (material and energy) flows that could be easily monitored and evaluated using local data [56,99,100]. However, other non-material flows, coexist and circulate inside and outside city. Bai [101] in his research expands the concept of material and energy flows by including capital and information as inputs supporting societal activities and urban functions, while knowledge and service as outputs.
CE and UM emphasize the importance of circularity in the context of sustainability implementation but neither of them applied separately effectively enough. UM is fundamental in developing sustainable cities and communities [99] based on material and energy flow analysis within the city and its hinterlands [100]. UM understands the city as an ecosystem in which the circularity of natural ecosystems should be restored [101]. Latest publications focus on cities as complex ecosystems analysis [102,103] and effectiveness [104], where urban material flows are defined in terms of exchange of material and energy between the urban system and surrounding ecosystems [105] and provide information on energy consumption, material cycles, waste management and social processes that determine the movement of these flows [99]. While the CE can improve the supply chain more efficiently with reduced amounts of generated waste.
The concept of CUM is briefly scientifically analyzed [105,106,107,108,109] focusing on local material and energy cycles. Aguledo-Vera et al. [110] briefly discussed the CUM concept, but they conceptualized the main framework of the CUM in the context of the city—low consumption rate, recycling and reuse of the different urban flows, with less impact on hinterlands and other cities. A recent publication of Lucertini and Musco [111] presents a framework of CUM by integrating CE and UM principles to simplify the complexity of the city to facilitate the assessment of urban complexity and the implementation of a sustainable urban vision [111]. In other words, CUM could be explained as a recognition of the city’s material and energy outputs as recycled inputs [105,112], while city’s relationship with his hinterlands and other cities was excluded. The CUM is based on the idea of closed loops of inputs of resources and outputs of waste when urban areas can be developed with less impact on the environment and more balanced with the natural ecosystem on which the city depends [105], along with the reduced need for natural resources and reduced wastes [110].
Lucertini and Musco [111] proposed CUM framework builds on the combination of the 3R framework developed by CE and UM as an urban ecosystem. CUM framework helps to understand, how urban flows interact with the environment and ecosystems within and outside the city. The principles of CE can be seen as a starting point for a more sustainable UM by analyzing a city’s input-output relationships and the relationship between a city’s and its hinterlands, helping assess the consequences and relations between dependence and causes for future urban planning and the ability to adapt to environmental change. CUM has the potential to maximize co-benefits, evaluate the effectiveness of land use, re-project infrastructure use, and improve cities’ ability to respond to climate change. CUM implies CE principles in the city level with the connection of flows, rethinking urban activities, redesign social and urban infrastructure, reduction and recovery of resources [111]. However, Lucertini and Musco [111] proposed CUM framework, which does not include hidden flows impact analysis to urban ecosystems. Hidden flows can be understood as flows included in goods and services city consume or produce [101,113] and are not visible in economic records, trade and production statistics. It reflects that modern cities can significantly reduce the direct material and energy flows, but can remain intensively dependent on material and energy intensive processes and services elsewhere [111,113]. Generally, hidden flows consist of secondary energy consumption in processing products or services. A modified CUM framework with hidden flows is presented in Figure 3.
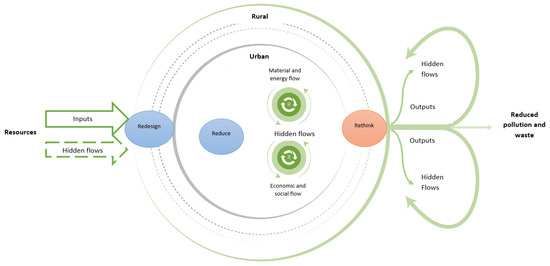
Figure 3.
Circular Urban Metabolism Framework (Lucertini and Musco, 2020; Bai, 2016) (modified by authors).
Lucertini and Musco [111] in their research don’t go into details about inputs and outputs within the urban-rural spaces and only identifies material and energy flows, economic and social flows as such within urban areas. The framework does not provide detailed flows and specific indicators to monitor CUM as well as inputs and outputs of the framework. It is important to develop an indicator system to assess, monitor and compare different circular initiatives across rural-urban spaces.
The formation and development of CUM in the city is a complicated process that depends on the local cultural and political environment, social and economic relations. CUM requires an extended collaborative design, decision-making, and synergies between stakeholders from urban and rural systems for successful sustainable development. Flows analysis in, within and out the city can help to understand relations between different stakeholders in rural and urban areas and how social-economic relations can re-shape transition to circularity. Today’s cities’ UM analysis is based on the historical material and energy flows data. Cities are constantly changing due to rapid urbanization, technologies, innovations, and digitalization processes. UM analysis results can be misleading in today’s situation and create uncertainty when urban planners have to make city’s strategic decisions. EU in “A New Industrial Strategy for Europe” [114] aims to promote digital transition in economy enhancing digital infrastructure can be useful for cities’ urban planning measuring UM.
4. Measuring Circular Economy Implementation
4.1. European Union Circular Economy Indicators Framework
To track the circularity transition, the European Commission has established the set of indicators in COM(2018)29 “a monitoring framework for the circular economy” [115]. The monitoring framework is structured in four broad areas which consist of 10 indicators and sub-indicators (see Table 3).
Table 3.
EU CE indicators framework.
The CE indicators framework can guide cities to develop their own CE indicators. However, there are some considerations:
- It might be difficult for countries, regions or cities to understand or use indicators in practice.
- Green public procurement indicator is still under development and specific data are not provided.
- EU’s CE indicators framework shows one-dimensional view of CE and indicates the progress of waste policy, while water use, energy, emission indicators are out of scope.
- From the framework of indicators chosen by the EU to measure circularity transition, only one of them related to social dimension of sustainable development (number of persons employed).
- Not all developed indicators can be relevant at the city level or there might be no data at city level (e.g., EU self-sufficiency on raw materials, trade in recyclable raw materials) or high cost to undertake collection.
- Another issue that can be targeted here that Circular material use rate is too general to measure EU’s economy transition from linear to circular and does not include specific targets for the re-use of secondary raw materials and upcycling.
- The CE monitoring framework also lack indicators on emissions, circular business models, life cycle indicators, and IS.
A number of publications have a critical approach on the EU’s CE indicators. On the latest publication Friant et al. [57], it is concluded that CE indicators are lacking the holistic view of circularity not including mandatory socio-economic targets such as job generation, investments in the social and solidarity economy, number of cooperatives and social enterprises working on circularity, wealth and income Gini indexes, and percentage of consumption of products. Indicators should provide overall progress. The relationship between different metrics to avoid unintended side effects should also be taken into consideration.
4.2. Measuring Circular Economy Implementation in Cities
The question how to measure circular cities transition is rapidly evolving in the literature [116,117,118,119]. CE operates on three systematic levels (micro, meso, macro) tools and indicators differ depending on the level of CE application [120]. Several cities in EU have CE strategies (Amsterdam, Prague, Maribor), roadmaps or city plans but lacking when it comes toa management system to evaluate the progress. Some EU’s identified CE indicators are bottlenecked for cities implementing and measuring CE strategy.
The highest concentration of CE cities is in Europe because of EU’s CE oriented policy implementation. The CE is not a new phenomenon and some of its elements (e.g., waste recycling) have been included in cities’ strategies and plans. However, the EU notes that in many CE project cases implemented in cities there is a lack of an integrated and comprehensive approach to urban development and decision-making processes [61]. Review of scientific articles and selected cities’ circularity reports [116,121] confirm that some indicators are not fully clear and it might be difficult to monitor their implementation without agreed units of measurement. Recent publication of Girard and Nocca [116] present analysis of 14 circular cities (13 European cities and one from Japan) deducted 180 CE indicators from official documents and reports. Identified indicators was grouped into environmental dimension with 98 indicators, economic and financial dimension with 35 indicators, social and cultural dimensions with 47 indicators. Authors agree that cities mostly focus on technical flows and material cycles related to production chains because it easier to understand and measure. The units of measure or how to estimate the data is not fully clear for some of indicators. However, the authors’ proposed indicators in the circular city framework also lacks identified units of measure and raise reasonable doubts about adequacy of some proposed indicators to measure community well-being and health in circular city. Although Girard and Nocca [116] presented a deducted matrix of indicators is very rich, it is lacking when it comes to indicators referring to circular strategy implementation or specific CE scope (agriculture, construction, food, consumption, health sector, and etc.) identified in those documents.
Table 4 presents the summary of CE scope on city level and identified CE indicators for each Europe’s city, if a published CE strategy, roadmap or map was presented. Only cities with officially published CE indicators was used in this analysis.
Table 4.
CE scope and indicators of circular cities deducted from cities’ official reports.
Each city in their strategy, roadmap or plan identifies strategic scopes (areas), where city focuses on transitioning to CE. Five key scopes were identified within circular cities after strategic documentation review: construction, consumption, economy, environment and material and energy flows (see Figure 4).
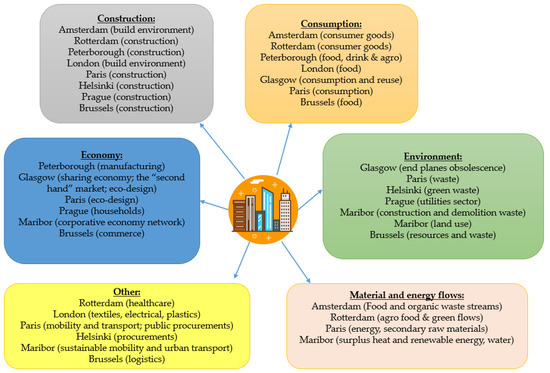
Figure 4.
Circular cities scopes (prepared by authors).
London’s circular economy route map focus on key products value chains (textiles, electrical, plastics, build environment, and food) as it is defined in (COM 2020)98) “A new Circular Economy Action Plan for a cleaner and more competitive Europe” [132] published by European Commission as part of the Green Deal package. CE can be used as a tool to resolve public health problems [9,10]. However, Rotterdam was the only city who identified healthcare as one of the key scopes of the city in the circular transition process. Transport sector and mobility was mentioned in three cities’ circular documentation (Paris, Maribor, and Brussels). Paris and Helsinki included public procurements in their strategic CE documentation. Cities show a narrow view on environmental challenges, mostly focusing on waste management and only Amsterdam, Rotterdam, Paris, and Maribor included material and energy flows as key areas in their CE documentation.
Belmonte-Ureña et al. [133] finds that CE theorization how to address challenges on the ongoing use of natural resources and physical boundaries of circular flows is weak and does not accept boundaries for the application of the concept. Cities’ circular scope results confirms (see Table 4) that cities do not have holistic circularity approach with 3 of 10 cities not including economy as one of the strategic areas in circular transition.
Indicators are critical for CE strategic document implementation, help monitor and measure city’s transition, and provide the basis on which critical urban decisions are taken. As emerged from Table 4, cities assessing CE models focus on technical flows and material cycles, because they are easier to understand. Material and energy flows indicators are mainly specific for industries and production chains (as emerged from Rotterdam, Glasgow, Paris, and Maribor). Cities’ CE indicators do not correlate with identified key circular areas (scopes). For example, Amsterdam uses six indicators measuring circularity and only one circular services indicator was defined measuring consumer goods area. Maribor city identifies “surplus heath and renewable energy”, “sustainable mobility and urban transport”, “corporative economy network” as key areas in CE strategy but does not present any indicators to monitor any of them. As cities follow EU’s CE indicator framework and include public procurement as a focus area in circular documents (Helsinki and Paris) but indicators to measure or how to estimate the data are not provided.
All indicators have to be measurable and understood by different stakeholders. Helsinki and Maribor cities do not have own identified indicators and instead use national CE indicators. However, for some indicators as “imports from non-EU countries”, “exports to non-EU countries”, “imports from EU countries”, and “social cohesion” can be difficult to obtain data and measure on city level. Rotterdam city has identified 37 indicators to measure circular transition divided into 4 groups: resource usage, environmental impact, society, health and culture and economic performance. However, eight of them need further research how to calculate them [121].
Clear definition and understanding of indicators are fundamental for making data comparable among cities and evaluating circular strategy/roadmap/plan implementation and monitoring the progress. In this way, it is impossible to understand if city’s strategy implementation is going in the right direction or if additional measures need to be taken.
4.3. Industrial Symbiosis Indicators
Data are important in cities development and urban planning processes. IS indicators can be useful for monitoring, evaluation, and can support decision making at both city or company level. [91]. There are a wide number of IS indicators available in the literature. For example, Valenzuela-Venegas et al. [134] have identified 249 sustainability indicators classified in environmental, economic and social dimension which can be used to assess eco-industrial parks. Additionally, there are few studies aimed at classifying IS indicators in groups (see Table 5).
Table 5.
Summary of the review of IS methodologies and indicators.
Park and Behera [135] use eco-efficiency indicators to evaluate symbiotic transactions. Authors eco-efficiency indicators divide into two groups: economic and environmental. Environmental performance is measured using raw material consumption, energy consumption and CO2 emissions indicators. Fraccascia and Giannoccaro [87] in their publication discuss four groups of IS analysis methodologies: flow analysis (which can be divided in three methodologies: material flow analysis (MFA), substance flow analysis (SFA), enterprise Input-Output approach), thermodynamics (emergy and exergy methodologies), life cycle assessment (LCA), and network analysis. Lütje and Wohlgemuth [136] divide IS indicators into four groups: general, environmental, economic, and social. General indicators present the specific aspects of IS structure, activity, and knowledge to generate an overview of the current state and activity level in the IS network. Felicio et al. [137] in the research developed Environmental Impact Momentum (EIM) which can be further divided into Inbound (“the total sum of the amount of materials exchanged between the companies within an IS”) and Outbound (“he materials that are not re-used by the companies and which, therefore, exit the IS”) and the rate between these two variables determine the symbiosis level. EU [139] with the project named “FISSAC” proposed 27 indicators for monitoring IS initiatives with sub-indicators. Indicators were divided into five groups: environmental, economic, social, circularity and NSA.
However, too many indicators without critical analysis and classification, create confusion and gives different IS analysis results. In some cases, companies or government might have limited tools and infrastructure to track and measure some of the IS indicators. Considering that IS provides environmental, economic and social benefits, the analysis of IS performance should be based on the evaluation of these natures. While some of the structural indicators such as (use of land, territory, quantity match between demand and supply) can be used to compare different IS networks across the country/region.
5. Industrial Symbiosis Integration into the Circular Urban Metabolism
Historically industrial zones were built in the suburbs outside of the central main city with limited living facilities and the residents remained concentrated in the city center [139]. In recent years, population in the suburbs is growing and industrial sites become a part of the city. Today, shrinking distance between industrial districts and cities incorporate industrial districts in cities material and energy flows by withdrawing the exclusion of industrial districts and cities frames.
IS incorporation in the CUM allows it to contribute economic growth and environmental benefits from reduced consumption of primary resources, reduced amounts of waste and emissions [140] in the city’s systems. IS success is based on the mutual beneficial relationship of industrial entities where the city can be incorporated as a resource of knowledge, waste, infrastructure with coordination function for better improvement of IS and CUM. Close geographical proximity is a strong enabler of the physical position of entities [64,65,141] for IS. Cities have to deal with multiple challenges and develop sustainable measures [108] and with developed infrastructure and knowledge could gain mutual benefits from IS networks. Figure 5 illustrates the identified, structured, and mutually combined framework of IS networks and CUM in the city.
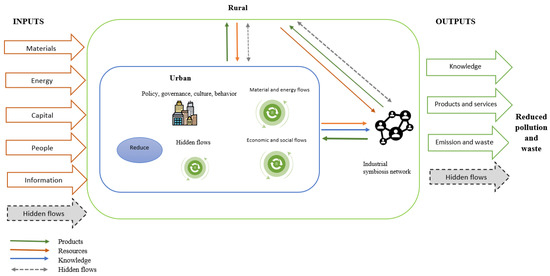
Figure 5.
Circular urban metabolism framework in the context of industrial symbiosis (modified by authors [101,111,140]).
In this framework, IS is incorporated in CUM framework and helps improve cities and industry circularity by closing the urban loops. The CUM can help to understand the relations between urban and rural ecosystems along with IS networks and their urban flows interact within the spaces over time. Giving scientists and urban planners an understanding of how flows between ecosystems and IS networks have to be redesigned in a more sustainable way by using the CE model at the city and industry level, indicating less pressure on the local ecosystems, optimizing the supply chain demand, developing the connections between local supply chains to close loops.
The indicators emerged from the analysis of circular cities and IS in Table 4 and Table 5 neglected some strategic scopes identified in cities’ circular documents. Considering the proposed framework of CUM with IS integration and identified main inputs and outputs, some indicators of CUM are proposed below (see Table 6). Some of these indicators have already been deducted from the CE and IS literature analysis, and from previously analyzed selected circular cities cases studies.
Table 6.
Proposed indicators for CUM framework (prepared by authors).
Using knowledge from circular cities indicators cases analysis and lows identified in CUM framework, proposed CUM indicators are divided into three groups: inputs, indicators of flows existing within city and outputs and with further grouping inside inputs, outputs and within city. The city’s indicators are grouped into: production, consumption, economy, social, construction and building environment, mobility and transport, IS and environmental groups. The main aim of indicators deduction—to propose easily understandable and measurable indicators considering different stakeholders within city, upcoming regulations from the Green Deal documentation package. Scientific literature proposes various lists of detailed indicators related to material and energy flows, waste generation. This paper focuses on presenting the main indicators related to flows inside and outside city and leaves the decision up to the cities when it comes to creating a more detailed indicator list according to their needs and specifics.
6. Empirical Support for Our Framework
In many studies, empirical evidence of the CE, UM, and IS described above are touched upon. Major factors having impact to CUM framework development are listed below:
- -
- Policy programs from the EU and the national government are major conditioning factors. European Circular Economy Action Plan was adopted in 2015 and 2020 as a part of the new industrial strategy [11,31,67] to influence IS development. EU has an ambitious aim to become world’s first climate-neutral continent by 2050 and cities will take the major role in this process because of the high concentration of resources, knowledge, and innovations in cities and their financial capabilities to implement drastic environmental changes in the urban planning process.
- -
- Today, some countries and cities (the United Kingdom, Belgium, Sweden, Denmark, Spain, Netherlands) have already taken a leading role implementing public policies and initiatives for IS development [47,60,63,142,143,144].
- -
- Some cities already measure the impact on the environment [102,145,146], metabolic relations between cities and rural regions [103] to model future metabolism under certain conditions and policies [103,147,148].
- -
- Strategic partnership examples between industrial sectors and cities along with social and knowledge exchanges supporting CE implementation can be found in recent published studies. [15,71,78,84]. Numerous cases of IS can be found in Europe across different countries with planned and facilitated IS initiatives in the United Kingdom, Ireland, Netherlands, traditional manufacturing clusters with IS activities in Spain [75]. Haq et al. [71] discuss the synergy relationship between the regional municipality and the industrial and agricultural companies in the IS network in the Sodankylä region (Finland).
- -
- IS, UM, and CE are often addressed in isolation in the context of sustainable urban planning, but the specific conclusions from various studies allow to combine those elements in CUM framework.
- -
- CE, IS indicators analysis confirms that some cities (Rotterdam, Glasgow, Maribor) are taking first steps integrating IS indicators into CE framework. However, it is necessary to have integrated approach to consider the relationship between different metrics to avoid unintended side effects.
7. Discussion and Conclusions
Scientific literature review of CE, UM, and IS was used to identify key pillars and build the CUM framework. EU documents review on CE and IS, circular cities cases analysis was used to identify circular cities scope, indicators and main gaps measuring cities’ circular transition. Circular cities analysis only confirms that cities are lacking common monitoring framework which not always address in the strategic documentation identified circular scope.
The CUM framework is quite new and lacks well-established scientific field of its own. While separate components of the CUM framework are widely discussed and analyzed from various perspectives, the CUM framework itself requires broader research and deeper data-based analysis. Future research will help to clarify these framework components and their inter-relations.
Resource management is the critical factor for sustainable development in cities in today’s context and it will not lose the importance in the future. Cities must manage resources in a sustainable way to improve their economic development along with minimizing their environmental impact. Cities are not isolated, they are connected to other systems, their rural areas, and industry sector for resources, products, and services exchange. However, concentration to one system will simplify the analysis, but it can give misleading conclusions in the circularity and sustainability context. Resource weight and volume is not sufficient information to apply proper urban policy and take effective urban planning decisions, and social-economic indicators should be taken into consideration. Sustainable urban planning requires deeper analysis of resource location and flows (including hidden flows), their transition directions in the real-time perspective, how flows are connected. While UM focus on flow analysis for critical point identification for future improvement in cities, IS—on industrial sector cooperation opportunities for materials exchange to improve waste use, integrated framework of CE, UM, and IS could improve mutual relations of rural, urban systems and industrial sector. The ability to provide dynamic data for future urban planning scenarios will be an essential factor.
Author Contributions
Formation of the framework, analysis, writing and original draft preparation, A.F.-S.; review and editing of the manuscript, supervision Ž.S. All authors have read and agreed to the published version of the manuscript.
Funding
The communication received no extra funding.
Institutional Review Board Statement
Not applicable.
Informed Consent Statement
Not applicable.
Conflicts of Interest
The authors declare no conflict of interest.
References
- Bradshaw, C.J.A.; Ehrlich, P.R.; Beattie, A.; Ceballos, G.; Crist, E.; Diamond, J.; Dirzo, R.; Ehrlich, A.H.; Harte, J.; Harte, M.E.; et al. Underestimating the challenges of avoiding a ghastly future. Front. Conserv. Sci. 2021, 1, 9. [Google Scholar] [CrossRef]
- World Economic Forum 2020. Global Risks Report, 15th ed. Available online: http://www3.weforum.org/docs/WEF_Global_Risk_Report_2020.pdf (accessed on 19 July 2021).
- Circularity Gap Report. Available online: https://www.circularity-gap.world/2020 (accessed on 28 November 2020).
- The Weight of Cities. Resource Requirements of Future Urbanization. Available online: https://www.resourcepanel.org/reports/weight-cities (accessed on 10 January 2021).
- World Population Prospects 2019. Department of Economic and Social Affairs, Population Division, New York. Available online: https://population.un.org/wpp/ (accessed on 11 January 2021).
- Baynes, T.M.; Musango, J.K. Estimating current and future global urban domestic material consumption. Environ. Res. Lett. 2018, 13, 065012. [Google Scholar] [CrossRef]
- Currie, P.K.; Musango, J.K.; May, N.D. Urban metabolism: A review with reference to Cape Town. Cities 2017, 70, 91–110. [Google Scholar] [CrossRef]
- Baccini, P.; Brunner, P.H. Metabolism of the Anthroposphere: Analysis, Evaluation, Design. 2012. Available online: https://www.jstor.org/stable/j.ctt5vjrm9 (accessed on 13 January 2021).
- Joensuu, T.; Edelman, H.; Saari, A. Circular economy practices in the build environment. J. Clean. Prod. 2020, 276, 124215. [Google Scholar] [CrossRef]
- Koop, S.H.A.; Van Leeuwen, C.J. The challenges of water, waste and climate change in cities. Environ. Dev. Sustain. 2017, 19, 385–418. [Google Scholar] [CrossRef] [Green Version]
- Towards a Circular Economy: A Zero Waste Programme for Europe. Available online: https://eur-lex.europa.eu/legal-content/EN/TXT/?uri=CELEX:52014DC0398R%2801%29 (accessed on 10 January 2021).
- Korhonen, J.; Nuur, C.; Feldmann, A.; Birkie, S.E. Circular economy as an essentially contested concept. J. Clean. Prod. 2018, 175, 544–552. [Google Scholar] [CrossRef]
- Teixeira, J.P.; Bento, N. Circular economy, urban metabolism in the future of regional development: “More of the same won’t do”. In Proceedings of the 25th APDR Congress, Lisbon, Portugal, 5–6 July 2018; University of Azores: Ponta Delgada, Portugal, 2018. [Google Scholar]
- Musango, J.K.; Currie, P.; Robinson, B. Urban Metabolism for Resource-Efficient Cities: From Theory to Implementation. Available online: https://resourceefficientcities.org/wp-content/uploads/2017/09/Urban-Metabolism-for-Resource-Efficient-Cities.pdf (accessed on 11 January 2021).
- Bocken, N.M.P.; Short, S.W.; Rana, P.; Evans, S. A literature and practice review to develop sustainable business model archetypes. J. Clean. Prod. 2014, 65, 42–56. [Google Scholar] [CrossRef] [Green Version]
- European Commission. Circular Economy Indicators. Available online: https://ec.europa.eu/environment/ecoap/indicators/circular-economy-indicators_en (accessed on 29 July 2021).
- City of Amsterdam. Amsterdam Circular 2020–2025 Strategy. Available online: https://www.amsterdam.nl/en/policy/sustainability/circular-economy/ (accessed on 27 July 2021).
- Rotterdam Circular. Rotterdam for Circular Strategy 2019–2023. Available online: https://rotterdamcirculair.nl/wp-content/uploads/2019/02/27403-41-Programma_RdamCirculair_2019-2023_v11-def-lr-losse_paginas.pdf (accessed on 27 July 2021).
- Circular London. London’s Circular Economy Route Map. Available online: https://relondon.gov.uk/wp-content/uploads/2021/03/LWARB-Londons-CE-route-map_16.6.17a_singlepages_sml.pdf (accessed on 27 July 2021).
- Glasgow City Council. Circular Economy Route Map for Glasgow 2020–2030. Available online: https://www.glasgow.gov.uk/councillorsandcommittees/viewSelectedDocument.asp?c=P62AFQDNDX2UT1NTNT (accessed on 29 July 2021).
- Circular Peterborough. Circular City Roadmap—An Ambitious Plan & Performance Monitoring Framework towards 2021. Available online: http://www.futurepeterborough.com/wp-content/uploads/2018/05/PREVIEW_Peterboroughs-Circular-City-Roadmap.pdf (accessed on 27 July 2021).
- Mairie de Paris. Paris Circular Economy Plan. Available online: https://cdn.paris.fr/paris/2019/07/24/38de2f4891329bbaf04585ced5fbdf0f.pdf (accessed on 28 July 2021).
- Helsinki. The City of Helsinki’s Roadmap for Circular and Sharing Economy. Available online: https://circulareconomy.europa.eu/platform/sites/default/files/the-city-of-helsinkis-roadmap-for-circular-and-sharing-economy.pdf (accessed on 28 July 2021).
- Kongres. Prague Focuses Its Attention on Circular Economy. Available online: https://kongres-magazine.eu/2020/05/prague-focuses-its-attention-on-circular-economy/ (accessed on 28 July 2021).
- Wcycle Institute Maribor. Strategy for the Transition to Circular Economy in the Municipality of Maribor. Available online: https://ec.europa.eu/futurium/en/system/files/ged/2018.10.23_maribors_strategy_on_circular_economy.pdf (accessed on 28 July 2021).
- Be Circular. Programme Regional en Economie Circulaire 2016–2020. Available online: https://circulareconomy.europa.eu/platform/sites/default/files/be-circular-brussels-fr.pdf (accessed on 29 July 2021).
- Circular Copenhagen. Resource and Waste Management Plan 2024. Available online: https://kk.sites.itera.dk/apps/kk_pub2/index.asp?mode=detalje&id=1991 (accessed on 28 July 2021).
- City of Vienna. Smart City Wien Framework Strategy 2019–2050. Vienna’s Strategy for Sustainable Development. Available online: https://www.wien.gv.at/stadtentwicklung/studien/pdf/b008552.pdf (accessed on 28 July 2021).
- Witjes, S.; Lozano, R. Towards a more circular economy: Proposing a framework linking sustainable public procurement and sustainable business models. Resour. Conserv. Recycl. 2016, 112, 37–44. [Google Scholar] [CrossRef] [Green Version]
- Polverini, D.; Miretti, U. An approach for the techno-economic assessment of circular economy requirements under the ecodesign directive. Resour. Conserv. Recycl. 2019, 150, 104425. [Google Scholar] [CrossRef]
- European Commission. Communication from the Commission. Available online: https://eur-lex.europa.eu/legal-content/EN/TXT/?qid=1576150542719&uri=COM%3A2019%3A640%3AFIN (accessed on 24 July 2021).
- The United Nations. Brussels Capital Region: Circular Economy Transition. 2019. Available online: https://resourceefficientcities.org/wp-content/uploads/2019/10/GI-REC-Pilot-City-Brussels-FINAL.pdf (accessed on 20 July 2021).
- The Danish Government. Strategy for Circular Economy. More Value and Better Environment through Design, Consumption and Recycling. Available online: https://stateofgreen.com/en/uploads/2018/10/Strategy-for-Circular-Economy-1.pdf (accessed on 20 July 2021).
- Technopolis Group. Ringmajanduse Strateegia Koostamise Metoodika Väljatöötamine. 2019. Available online: https://www.envir.ee/sites/default/files/KKO/Uuringud/1.2_ringmajanduse_indikaatorid_lopparuanne_050719.pdf (accessed on 24 July 2021).
- Finland Ministry of the Environment. Strategic Programme to Promote a Circular Economy. Available online: https://ym.fi/en/strategic-programme-to-promote-a-circular-economy (accessed on 20 July 2021).
- France. Ministère de la Transition Écologique. L’économie Circulaire. Available online: https://www.ecologie.gouv.fr/leconomie-circulaire (accessed on 24 July 2021).
- Hellenic Republic. Ministry of Environment & Energy. National Circular Economy Strategy. 2018. Available online: https://circulareconomy.europa.eu/platform/sites/default/files/national_circular_economy_strategy.pdf (accessed on 24 July 2021).
- Government of Ireland. Circular Economy Programme 2021–2027. Available online: https://www.epa.ie/publications/corporate/consultations/-consultations/CE_prog_for_Consult.pdf (accessed on 24 July 2021).
- Ministero dell’Ambiente e della Tutela del Territorio e del Mare. Towards a Model of Circular Economy for Italy. Overview and Strategic Framework. Available online: https://circulareconomy.europa.eu/platform/sites/default/files/strategy_-_towards_a_model_eng_completo.pdf (accessed on 24 July 2021).
- Informatīvais Ziņojums “Aprites Ekonomikas Stratēģija Latvijai”. Available online: https://www.varam.gov.lv/sites/varam/files/content/files/varamzin_-200120_aestrategija.pdf (accessed on 24 July 2021).
- Schosseler, P.; Tock, C.; Rasqué, P. Circular Economy Strategy Luxembourg. Available online: https://gouvernement.lu/dam-assets/documents/actualites/2021/02-fevrier/08-strategie-economie-circulaire/Strategy-circular-economy-Luxembourg-022021.pdf (accessed on 24 July 2021).
- Government of The Netherlands. A Circular Economy in The Netherlands by 2050. Available online: https://www.government.nl/documents/policy-notes/2016/09/14/a-circular-economy-in-the-netherlands-by-2050 (accessed on 20 July 2021).
- República Portugeasa. Leading the Transition. Action Plan for Circular Economy in Portugal 2017–2020. Available online: https://circulareconomy.europa.eu/platform/sites/default/files/strategy_-_portuguese_action_plan_paec_en_version_3.pdf (accessed on 20 July 2021).
- Ministersvo Životného Prostredia Slovenskej Republiky. Circular Economy Future of the Development of Slovakia. Available online: https://www.enviroportal.sk/uploads/report/9265.pdf (accessed on 24 July 2021).
- Republika Slovenia. Roadmap towards the Circular Economy in Slovenia. Available online: https://circulareconomy.europa.eu/platform/sites/default/files/roadmap_towards_the_circular_economy_in_slovenia.pdf (accessed on 20 July 2021).
- España Circular 2030. Circular Economy Spanish Strategy. Available online: https://circulareconomy.europa.eu/platform/sites/default/files/espana_circular_2030_executive_summary_en.pdf (accessed on 24 July 2021).
- Government Offices of Sweden. Circular Economy—Strategy for the Transition in Sweden. Available online: https://www.government.se/4ad42c/contentassets/d5ab250cf59a47b38feb8239eca1f6ab/circular-economy--strategy-for-the-transition-in-sweden (accessed on 20 July 2021).
- Government of the United Kingdom. Policy Paper “Circular Economy Package Policy Statement”. Available online: https://www.gov.uk/government/publications/circular-economy-package-policy-statement/circular-economy-package-policy-statement (accessed on 20 July 2021).
- Homrich, A.S.; Galvão, G.; Abadia, L.G.; Carvalho, M.M. The circular economy umbrella: Trends and gaps on integrating pathways. J. Clean. Prod. 2018, 175, 525–543. [Google Scholar] [CrossRef]
- Wang, N.; Lee, J.C.K.; Zhang, J.; Chen, H.; Li, H. Evaluation of urban circular economy development: An empirical research of 40 cities in China. J. Clean. Prod. 2018, 180, 876–887. [Google Scholar] [CrossRef]
- Blomsma, F.; Brennan, G. The emergence of circular economy: A new framing around prolonging resource productivity. J. Ind. Ecol. 2017, 21, 603–614. [Google Scholar] [CrossRef]
- Ellen MacArthur Foundation. Cities in the Circular Economy: An Initial Exploration. 2017. Available online: https://www.ellenmacarthurfoundation.org/assets/downloads/publications/Cities-in-the-CE_An-Initial-Exploration.pdf (accessed on 24 July 2021).
- Li, X.; Bao, J.; Sun, J.; Wang, J. Development of circular economy in smart cities based on FPGA and wireless sensors. Microprocess. Microsyst. 2021, 80, 103600. [Google Scholar] [CrossRef]
- Kirchherr, J.; Reike, D.; Hekkert, M. Conceptualizing the circular economy: An analysis of 114 definitions. Resour. Conserv. Recycl. 2017, 127, 221–232. [Google Scholar] [CrossRef]
- Prendeville, S.; Cherim, E.; Bocken, N. Circular cities: Mapping six cities in transition. Environ. Innov. Soc. Transit. 2018, 26, 171–194. [Google Scholar] [CrossRef] [Green Version]
- Paiho, S.; Mäki, E.; Wessberg, N.; Paavola, M.; Tuominen, P.; Antikainen, M.; Heikkilä, J.; Rozado, C.A.; Jung, N. Towards circular cities—Conceptualizing core aspects. Sustain. Cities Soc. 2020, 59, 102143. [Google Scholar] [CrossRef]
- Friant, M.C.; Vermeulen, W.J.; Salomone, R. Analysing European Union circular economy policies: Words versus actions. Sustain. Prod. Consum. 2021, 27, 337–353. [Google Scholar] [CrossRef]
- United Nations. The Sustainable Development Goals Report. 2020. Available online: https://unstats.un.org/sdgs/report/2020/The-Sustainable-Development-Goals-Report-2020.pdf (accessed on 24 July 2021).
- Ellen MacArthur Foundation. Cities and the Circular Economy. 2020. Available online: https://www.ellenmacarthurfoundation.org/explore/cities-and-the-circular-economy (accessed on 24 July 2021).
- Gravagnuolo, A.; Angrisano, M.; Girard, L.F. Circular economy strategies in eight historic port cities: Criteria and indicators towards a circular city assessment framework. Sustainability 2019, 11, 3512. [Google Scholar] [CrossRef] [Green Version]
- Bernhardt, D.; Ho, H.; Zeller, K.; Diakoulakis, S. Municipality-Led Circular Economy Case Studies. The Circular Cities Project. 2018. Available online: https://apo.org.au/sites/default/files/resource-files/2019-01/apo-nid219941.pdf (accessed on 24 July 2021).
- Fratini, C.F.; Georg, S.; Jørgensen, M.S. Exploring circular economy imaginaries in European cities: A research agenda for the governance of urban sustainability transitions. J. Clean. Prod. 2019, 228, 974–989. [Google Scholar] [CrossRef]
- Campbell-Johnston, K.; Cate, J.T.; Elfering-Petrovic, M.; Gupta, J. City level circular transitions: Barriers and limits in Amsterdam, Utrecht and the Hague. J. Clean. Prod. 2019, 235, 1232–1239. [Google Scholar] [CrossRef]
- Johnsen, I.; Berlina, A.; Lindberg, G.; Mikkola, N.; Olsen, L.S.; Terräs, J. The Potential of Industrial Symbiosis as a Key Driver of Green Growth in Nordic Regions. Available online: http://www.diva-portal.org/smash/get/diva2:875756/FULLTEXT01.pdf (accessed on 11 January 2021).
- Chertow, M.R. Industrial symbiosis: Literature and taxonomy. Annu. Rev. Energy Environ. 2000, 25, 313–337. [Google Scholar] [CrossRef] [Green Version]
- European Commission. Communication from the Commission. Available online: https://eur-lex.europa.eu/legal-content/EN/TXT/?qid=1596443911913&uri=CELEX:52019DC0640#document2 (accessed on 11 January 2021).
- Making Industrial Symbiosis Business as Usual for Europe’s Circular Economy. Available online: https://ec.europa.eu/environment/ecoap/about-eco-innovation/experts-interviews/making-industrial-symbiosis-business-usual-europes-circular_en (accessed on 28 December 2020).
- Frosh, R.A.; Galloupolos, N.E. Strategies for manufacturing. Sci. Am. 1989, 261, 94–102. [Google Scholar] [CrossRef]
- Neves, A.; Godina, R.; Azevedo, S.G.; Matias, J.C.O. A comprehensive review of industrial symbiosis. J. Clean. Prod. 2020, 247, 119113. [Google Scholar] [CrossRef]
- SCALER Project. Available online: https://www.scalerproject.eu/why-industrial-symbiosis (accessed on 28 December 2020).
- Haq, H.; Välisuo, P.; Kumpulainen, L.; Tuomi, V.; Niemi, S. A preliminary assessment of industrial symbiosis in Sodankylä. Curr. Res. Environ. Sustain. 2020, 2, 100018. [Google Scholar] [CrossRef]
- Huang, B.; Yong, G.; Zhao, J.; Domenech, T.; Liu, Z.; Chiu, A.S.F.; McDowall, W.; Bleischwitz, R.; Liu, J.; Yao, Y. Review of the development of China’s Eco-industrial Park standard system. Resour. Conserv. Recycl. 2019, 140, 137–144. [Google Scholar] [CrossRef]
- Liu, Z.; Adams, M.; Cote, R.P.; Geng, Y.; Ren, J.; Chen, Q.; Liu, W.; Zhu, X. Co-benefits accounting for the implementation of eco-industrial development strategies in the scale of industrial park based on energy analysis. Renew. Sustain. Energy 2018, 81, 1522–1529. [Google Scholar] [CrossRef]
- Jacobsen, N.B. Industrial symbiosis in Kalundborg, Denmark: A quantitative assessment of economic and environmental aspects. J. Ind. Ecol. 2006, 10, 239–255. [Google Scholar] [CrossRef]
- Domenech, T.; Bleischwitz, R.; Doranova, A.; Panayotopoulos, D.; Roman, L. Mapping industrial symbiosis development in Europe typologies of networks, characteristics, performance and contribution to the circular economy. Resour. Conserv. Recycl. 2019, 141, 76–98. [Google Scholar] [CrossRef]
- Lybaek, R.; Christensen, T.B.; Thomsen, T.P. Enhancing policies for deployment of Industrial symbiosis—What are the obstacles, drivers and future way forward? J. Clean. Prod. 2021, 280, 124351. [Google Scholar] [CrossRef]
- Geissdoerfer, M.; Savaget, P.; Bocken, N.; Hultink, E.J. The circular economy—A new sustainability paradigm? J. Clean. Prod. 2017, 143, 757–768. [Google Scholar] [CrossRef] [Green Version]
- Short, S.W.; Bocken, N.; Barlow, C.Y.; Chertow, M.R. From refining sugar to growing tomatoes: Industrial ecology and business model evolution. J. Ind. Ecol. 2014, 18, 603–618. [Google Scholar] [CrossRef]
- Baldassarre, B.; Schepers, M.; Bocken, N.; Cuppen, E.; Korevaar, G.; Calabretta, G. Industrial symbiosis: Towards a design process for eco-industrial clusters by integrating circular economy and industrial ecology perspectives. J. Clean. Prod. 2019, 216, 446–460. [Google Scholar] [CrossRef]
- Fraccascia, L.; Magno, M.; Albino, V. Business models for industrial symbiosis: A guide for firms. In Proceedings of the Procedia Environmental Science, Engineering and Management, Rimini Fiera, Italy, 8–11 November 2016. [Google Scholar]
- Baptista, R. Do innovations diffuse faster within geographical clusters? Int. J. Ind. Organ. 2000, 18, 515–535. [Google Scholar] [CrossRef]
- Taddeo, R.; Simboli, A.; Ioppolo, G.; Morgante, A. Industrial symbiosis, networking and innovation: The potential role of innovation poles. Sustainability 2017, 9, 169. [Google Scholar] [CrossRef] [Green Version]
- Daddi, T.; Nucci, B.; Iraldo, F. Using Life Cycle Assessment (LCA) to measure the environmental benefits of industrial symbiosis in an industrial cluster of SMEs. J. Clean. Prod. 2017, 147, 157–164. [Google Scholar] [CrossRef]
- Romano, V.A.; Albino, V.; Garavelli, A.C. A clasification of industrial symbiosis networks: A focus on material and energy recovery. In Proceedings IFIP Advances in Information and Communication Technolog, Bari, Italy, 2012; Emmanouilidis, C., Taisch, M., Kiritsis, D., Eds.; Springer: Berlin/Heidelberg, Germany, 2013. [Google Scholar]
- Sun, L.; Spekkink, W.; Cuppen, E.; Korevaar, G. Coordination of industrial symbiosis through anchoring. Sustainability 2017, 9, 549. [Google Scholar] [CrossRef] [Green Version]
- Jensen, P.D.; Basson, L.; Hellawell, E.; Bailey, M.R.; Leach, M. Quantifying ‘geographic proximity’: Experiences from the United Kingdom’s national industrial symbiosis programme. Resour. Conserv. Recycl. 2011, 55, 703–712. [Google Scholar] [CrossRef] [Green Version]
- Fraccascia, L.; Giannoccaro, I. What, where, and how measuring industrial symbiosis: A reasoned taxonomy of relevant indicators. Resour. Conserv. Recycl. 2020, 157, 104799. [Google Scholar] [CrossRef]
- Boons, F.; Chertow, M.; Park, J.; Spekkink, W.; Shi, H. Industrial symbiosis dynamics and the problem of equivalence: Proposal for a comparative framework. J. Ind. Ecol. 2016, 21, 938–952. [Google Scholar] [CrossRef]
- Van der Bergh, J.; Verbruggen, H.; Janssen, M. Policy implications: Towards a materials policy? In Economics of Industrial Ecology; Van den Bergh, J., Janssen, M., Eds.; MIT Press: Cambridge, MA, USA, 2004; pp. 359–376. [Google Scholar]
- DesRochers, P. Industrial ecology and the rediscovery of inter-firm recycling linkages: Historical evidence and policy implications. Ind. Corp. Chang. 2002, 11, 1031–1057. [Google Scholar] [CrossRef]
- Maranghi, S.; Parisi, M.L.; Facchini, A.; Rubino, A.; Kordas, O.; Basosi, R. Integrating urban metabolism and life cycle assessment to analyse urban sustainability. Ecol. Indic. 2020, 112, 106074. [Google Scholar] [CrossRef]
- Batty, M. A theory of city size. Science 2013, 340, 1418–1419. [Google Scholar] [CrossRef] [PubMed]
- Leyzerova, A.; Sharovarova, E.; Alekhin, V. Sustainable cities of urban planning. In Proceedings of the International Conference of Industrial Engineering, ICIE 2016, Tehran, Iran, 25–26 January 2016. [Google Scholar]
- Sun, L.; Fujii, M.; Li, Z.; Dong, H.; Geng, Y.; Liu, Z.; Fujita, T.; Yu, X.; Zhang, Y. Energy-saving and carbon emission reduction effect of urban-industrial symbiosis implementation with feasibility analysis in the city. Technol. Forecast. Soc. Chang. 2020, 151, 119853. [Google Scholar] [CrossRef]
- Sun, L.; Li, H.; Dong, L.; Fang, K.; Ren, J.; Geng, Y.; Fujii, M.; Zhang, W.; Zhang, N.; Liu, Z. Eco-benefits assessment on urban industrial symbiosis based on material flows analysis and emergy evaluation approach: A case of Liuzhou city, China. Resour. Conserv. Recycl. 2017, 119, 78–88. [Google Scholar] [CrossRef] [Green Version]
- Sun, L.; Fujii, M.; Tasaki, T.; Dong, H.; Ohnishi, S. Improving waste to energy rate by promoting an integrated municipal solid-waste management system. Resour. Conserv. Recycl. 2018, 136, 289–296. [Google Scholar] [CrossRef]
- Kim, H.-W.; Dong, L.; Choi, A.E.; Fujii, M.; Fujita, T.; Park, H.-S. Co-benefit potential of industrial and urban symbiosis using waste heat from industrial park in Ulsan, Korea. Resour. Conserv. Recycl. 2018, 135, 225–234. [Google Scholar] [CrossRef]
- Dong, H.; Ohnishi, S.; Fujita, T.; Geng, Y.; Fujii, M.; Dong, L. Achieving carbon emission reduction through industrial & urban symbiosis: A case of Kawasaki. Energy 2014, 64, 277–286. [Google Scholar] [CrossRef]
- Tanguy, A.; Bahers, J.-B.; Athanassiadis, A. Outsourcing of urban metabolisms and its consequences: A multiscale energy flow analysis of a French port-city. Resour. Conserv. Recycl. 2020, 161, 104951. [Google Scholar] [CrossRef]
- Wang, X.; Li, Y.; Liu, N.; Zhang, Y. An urban material flow analysis framework and measurement method from the perspective of urban metabolism. J. Clean. Prod. 2020, 257, 120564. [Google Scholar] [CrossRef]
- Bai, X. Eight energy and material flow characteristics of urban ecosystems. Ambio 2016, 45, 819–830. [Google Scholar] [CrossRef] [Green Version]
- Kennedy, C.; Pincetl, S.; Bunje, P. The study of urban metabolism and its applications to urban planning and design. Environ. Pollut. 2011, 159, 1965–1973. [Google Scholar] [CrossRef] [PubMed]
- Bahers, J.-B.; Tanguy, A.; Pincetl, S. Metabolic relationships between cities and hinterland: A political-industrial ecology of energy metabolism of Saint-Nazaire metropolitan and port area (France). Ecol. Econ. 2020, 167, 106447. [Google Scholar] [CrossRef]
- Newman, P.; Jennings, I. Cities as sustainable ecosystems. In Principles and Practices; Island Press: Washington, DC, USA, 2008. [Google Scholar]
- Ulgiati, S.; Zucaro, A. Challenges in urban metabolism: Sustainability and well-being in cities. Front. Sustain. Cities 2019, 1, 1–3. [Google Scholar] [CrossRef]
- Kennedy, C.; Cuddihy, J.; Engel-Yan, J. The changing metabolism of cities. J. Ind. Ecol. 2007, 11, 43–59. [Google Scholar] [CrossRef]
- Restrepo, J.D.C.; Morales-Pinzón, T. Urban metabolism and sustainability: Precedents, genesis and research perspectives. Resour. Conserv. Recycl. 2018, 131, 216–224. [Google Scholar] [CrossRef]
- van Broekhoven, S.; Vernay, A.L. Integrating functions for a sustainable urban system: A review of multifunctional land use and circular urban metabolism. Sustainability 2018, 10, 1875. [Google Scholar] [CrossRef] [Green Version]
- Novotny, V. Water and energy link in the cities of the future—Achieving net zero carbon and pollution emissions footprint. Water Sci. Technol. 2011, 63, 184–190. [Google Scholar] [CrossRef] [Green Version]
- Agudelo-Vera, C.M.; Leduc, W.R.; Mels, A.R.; Rijnaarts, H.H. Harvesting urban resources towards more resilient cities. Resour. Conserv. Recycl. 2012, 64, 3–12. [Google Scholar] [CrossRef]
- Lucertini, G.; Musco, F. Circular urban metabolism framework. One Earth 2020, 2, 138–142. [Google Scholar] [CrossRef] [Green Version]
- Rogers, R.G. Cities for a Small Planet; Westview: Boulder, CO, USA, 1997. [Google Scholar]
- Girardet, H. Cities People Planet: Urban Development and Climate Change, 2nd ed.; Wiley: Chichester, UK; New York, NY, USA, 2008. [Google Scholar]
- COM(2020)102 “Communication a New Industrial Strategy for Europe”. Available online: https://eur-lex.europa.eu/legal-content/EN/TXT/?qid=1593086905382&uri=CELEX%3A52020DC0102 (accessed on 1 August 2021).
- COM(2018)29 “Communication on a Monitoring Framework for the Circular Economy”. Available online: https://eur-lex.europa.eu/legal-content/EN/TXT/?uri=COM%3A2018%3A29%3AFIN (accessed on 26 July 2021).
- Girard, L.F.; Nocca, F. Moving towards the circular economy/city model: Which tools for operationalizing this model? Sustainability 2019, 11, 6253. [Google Scholar] [CrossRef] [Green Version]
- Superti, V.; Merino-Saum, A.; Baur, I.; Binder, C. Unraveling how the concept of circularity relates to sustainability: An indicator-based meta-analysis applied at the urban scale. J. Clean. Prod. 2021, 315, 128070. [Google Scholar] [CrossRef]
- EASAC. Indicators for a Circular Economy. 2016. Available online: https://easac.eu/fileadmin/PDF_s/reports_statements/Circular_Economy/EASAC_Indicators_web_complete.pdf (accessed on 30 July 2021).
- Velasco-Muñoz, J.F.; Mendoza, J.M.F.; Aznar-Sánchez, J.A.; Gallego-Schmid, A. Circular economy implementation in the agricultural sector: Definition, strategies and indicators. Resour. Conserv. Recycl. 2021, 170, 105618. [Google Scholar] [CrossRef]
- Su, B.; Heshmati, A.; Geng, Y.; Yu, X. A review of the circular economy in China: Moving from rhetoric to implementation. J. Clean. Prod. 2013, 42, 215–227. [Google Scholar] [CrossRef]
- Circle Economy. Circular Rotterdam. Opportunities for New Jobs in a Zero Waste Economy. Available online: https://rotterdamcirculair.nl/wp-content/uploads/2018/11/GemeenteRotterdam_Report_English_15-11-18.pdf (accessed on 27 July 2021).
- Circle Economy. Circular Amsterdam. 2018. Available online: https://www.antonioserranoacitores.com/wp-content/uploads/2018/09/Circular-Amsterdam-EN-small-210316.pdf (accessed on 27 July 2021).
- Peterborough. Measuring the Circular Economy. Developing an Indicator Set for Opportunity Peterborough. 2018. Available online: http://www.futurepeterborough.com/wp-content/uploads/2018/08/Final-Report-Measuring-the-Circular-Economy-of-Peterborough-2-1.pdf (accessed on 27 July 2021).
- London Waste & Recycling Board. London. The Circular Economy Capital. Available online: https://relondon.gov.uk/wp-content/uploads/2021/06/LWARB-circular-economy-report_web_09.12.15.pdf (accessed on 28 July 2021).
- European Commission. Indicators for Circular Economy (CE) Transition in Cities—Issues and Mapping Paper. Available online: https://ec.europa.eu/futurium/en/system/files/ged/urban_agenda_partnership_on_circular_economy_-_indicators_for_ce_transition_-_issupaper_0.pdf (accessed on 28 July 2021).
- Zero Waste Scotland. Measuring Scotland’s Progress towards a Circular Economy to Help Combat the Climate Emergency. Results from a Preliminary Scoping Study Reviewing Key Indicators. Available online: https://www.zerowastescotland.org.uk/sites/default/files/Branded%20Report%20MetricsV1.pdf (accessed on 29 July 2021).
- DATALAB. 10 Key Indicators for Monitoring the Circular Economy. Available online: https://www.statistiques.developpement-durable.gouv.fr/sites/default/files/2018-10/datalab-18-economie-circulaire-Edition-2017-anglais.pdf (accessed on 28 July 2021).
- Statistics Finland. Indicators for the Circular Economy Business. Available online: https://www.stat.fi/tup/kiertotalous/kiertotalousliiketoiminnan-indikaattorit_en.html (accessed on 28 July 2021).
- Circle Economy. Circular Prague. Available online: https://assets.website-files.com/5d26d80e8836af2d12ed1269/5de95a133e0b522c1f9d4ea6_Prague-Final-Report-20190406_MR-compressed%20(1).pdf (accessed on 28 July 2021).
- Statisčini Urad. Experimental Statistics: Circular Economy Indicators, Slovenia, 2016–2019. Available online: https://www.stat.si/StatWeb/nk/News/Index/9406 (accessed on 29 July 2021).
- UN. Brussels Capital Region: Circular Economy Transition. Available online: https://www.circulareconomy.brussels/wp-content/uploads/2019/04/GIREC_Brussels-report_Final.pdf (accessed on 29 July 2021).
- European Commission. A New Circular Economy Action Plan for a Cleaner and More Competitive Europe. Available online: https://eur-lex.europa.eu/legal-content/EN/TXT/?qid=1583933814386&uri=COM:2020:98:FIN (accessed on 30 July 2021).
- Belmonte-Ureña, L.J.; Plaza-Úbeda, J.A.; Vazquez-Brust, D.; Yakovleva, N. Circular economy, degrowth and green growth as pathways for research on sustainable development goals: A global analysis and future agenda. Ecol. Econ. 2021, 185, 107050. [Google Scholar] [CrossRef]
- Valenzuela-Venegas, G.; Salgado, J.C.; Díaz-Alvarado, F.A. Sustainability indicators for the assessment of eco-industrial parks: Classification and criteria for selection. J. Clean. Prod. 2016, 133, 99–116. [Google Scholar] [CrossRef]
- Park, H.-S.; Behera, S.K. Methodological aspects of applying eco-efficiency indicators to industrial symbiosis networks. J. Clean. Prod. 2014, 64, 478–485. [Google Scholar] [CrossRef]
- Lütje, A.; Wohlgemuth, V. Tracking sustainability targets with quantitative indicator systems for performance measurement of industrial symbiosis in industrial parks. Adm. Sci. 2020, 10, 3. [Google Scholar] [CrossRef] [Green Version]
- Felicio, M.; Amaral, D.; Esposto, K.; Durany, X.G. Industrial symbiosis indicators to manage eco-industrial parks as dynamic systems. J. Clean. Prod. 2016, 118, 54–64. [Google Scholar] [CrossRef]
- European Union. FISSAC Project. Industrial Symbiosis Indicators. 2016. Available online: https://ec.europa.eu/research/participants/documents/downloadPublic?documentIds=080166e5ace5dfaf&appId=PPGMS (accessed on 25 July 2021).
- Lu, H. Chapter 12—Madrid, spain. In Eco-Cities and Green Transport; Elsevier: Amsterdam, The Netherlands, 2020; pp. 249–263. [Google Scholar]
- Industrial Symbiosis: Powerful Mechanisms for Sustainable Use of Environmental Resources. Available online: https://sustainabledevelopment.un.org/content/documents/635486-Kusch-Industrial%20symbiosis_powerful%20mechanisms%20for%20sustainable%20use%20of%20environmental%20resources.pdf (accessed on 30 December 2020).
- Velentuf, A.; Jensen, P. Promoting industrial symbiosis: Using the concept of proximity to explore social network development. J. Ind. Ecol. 2016, 20, 700–709. [Google Scholar] [CrossRef] [Green Version]
- Turcu, C.; Gillie, H. Governing the circular economy in the city: Local planning practice in London. Plan. Pr. Res. 2020, 35, 62–85. [Google Scholar] [CrossRef]
- Miteco. España Circular 2030. Circular Economy Spanish Strategy. Available online: https://www.miteco.gob.es/es/calidad-y-evaluacion-ambiental/temas/economia-circular/espanacircular_2030_executivesummary_en_tcm30-510578.pdf (accessed on 30 December 2020).
- Zeller, V.; Towa, E.; Degrez, M.; Achten, W.M.J. Urban waste flows and their potential for a circular economy model at city-regional level. Waste Manag. 2018, 83, 83–94. [Google Scholar] [CrossRef] [PubMed]
- Fan, Y.; Fang, C. Circular economy development in China-current situation, evaluation and policy implications. Environ. Impact Assess. Rev. 2020, 84, 106441. [Google Scholar] [CrossRef]
- Cui, X.; Wang, X.; Feng, Y. Examining urban metabolism: A material flow perspective on cities and their sustainability. J. Clean. Prod. 2019, 214, 767–781. [Google Scholar] [CrossRef]
- Huang, W.; Cui, S.; Yarime, M.; Hashimoto, S.; Managi, S. Improving urban metabolism study for sustainable urban transformation. Environ. Technol. Innov. 2015, 4, 62–72. [Google Scholar] [CrossRef]
- Kissinger, M.; Stossel, Z. An integrated, multi-scale approach for modelling urban metabolism changes as a means for assessing urban sustainability. Sustain. Cities Soc. 2021, 67, 102695, in press. [Google Scholar] [CrossRef]
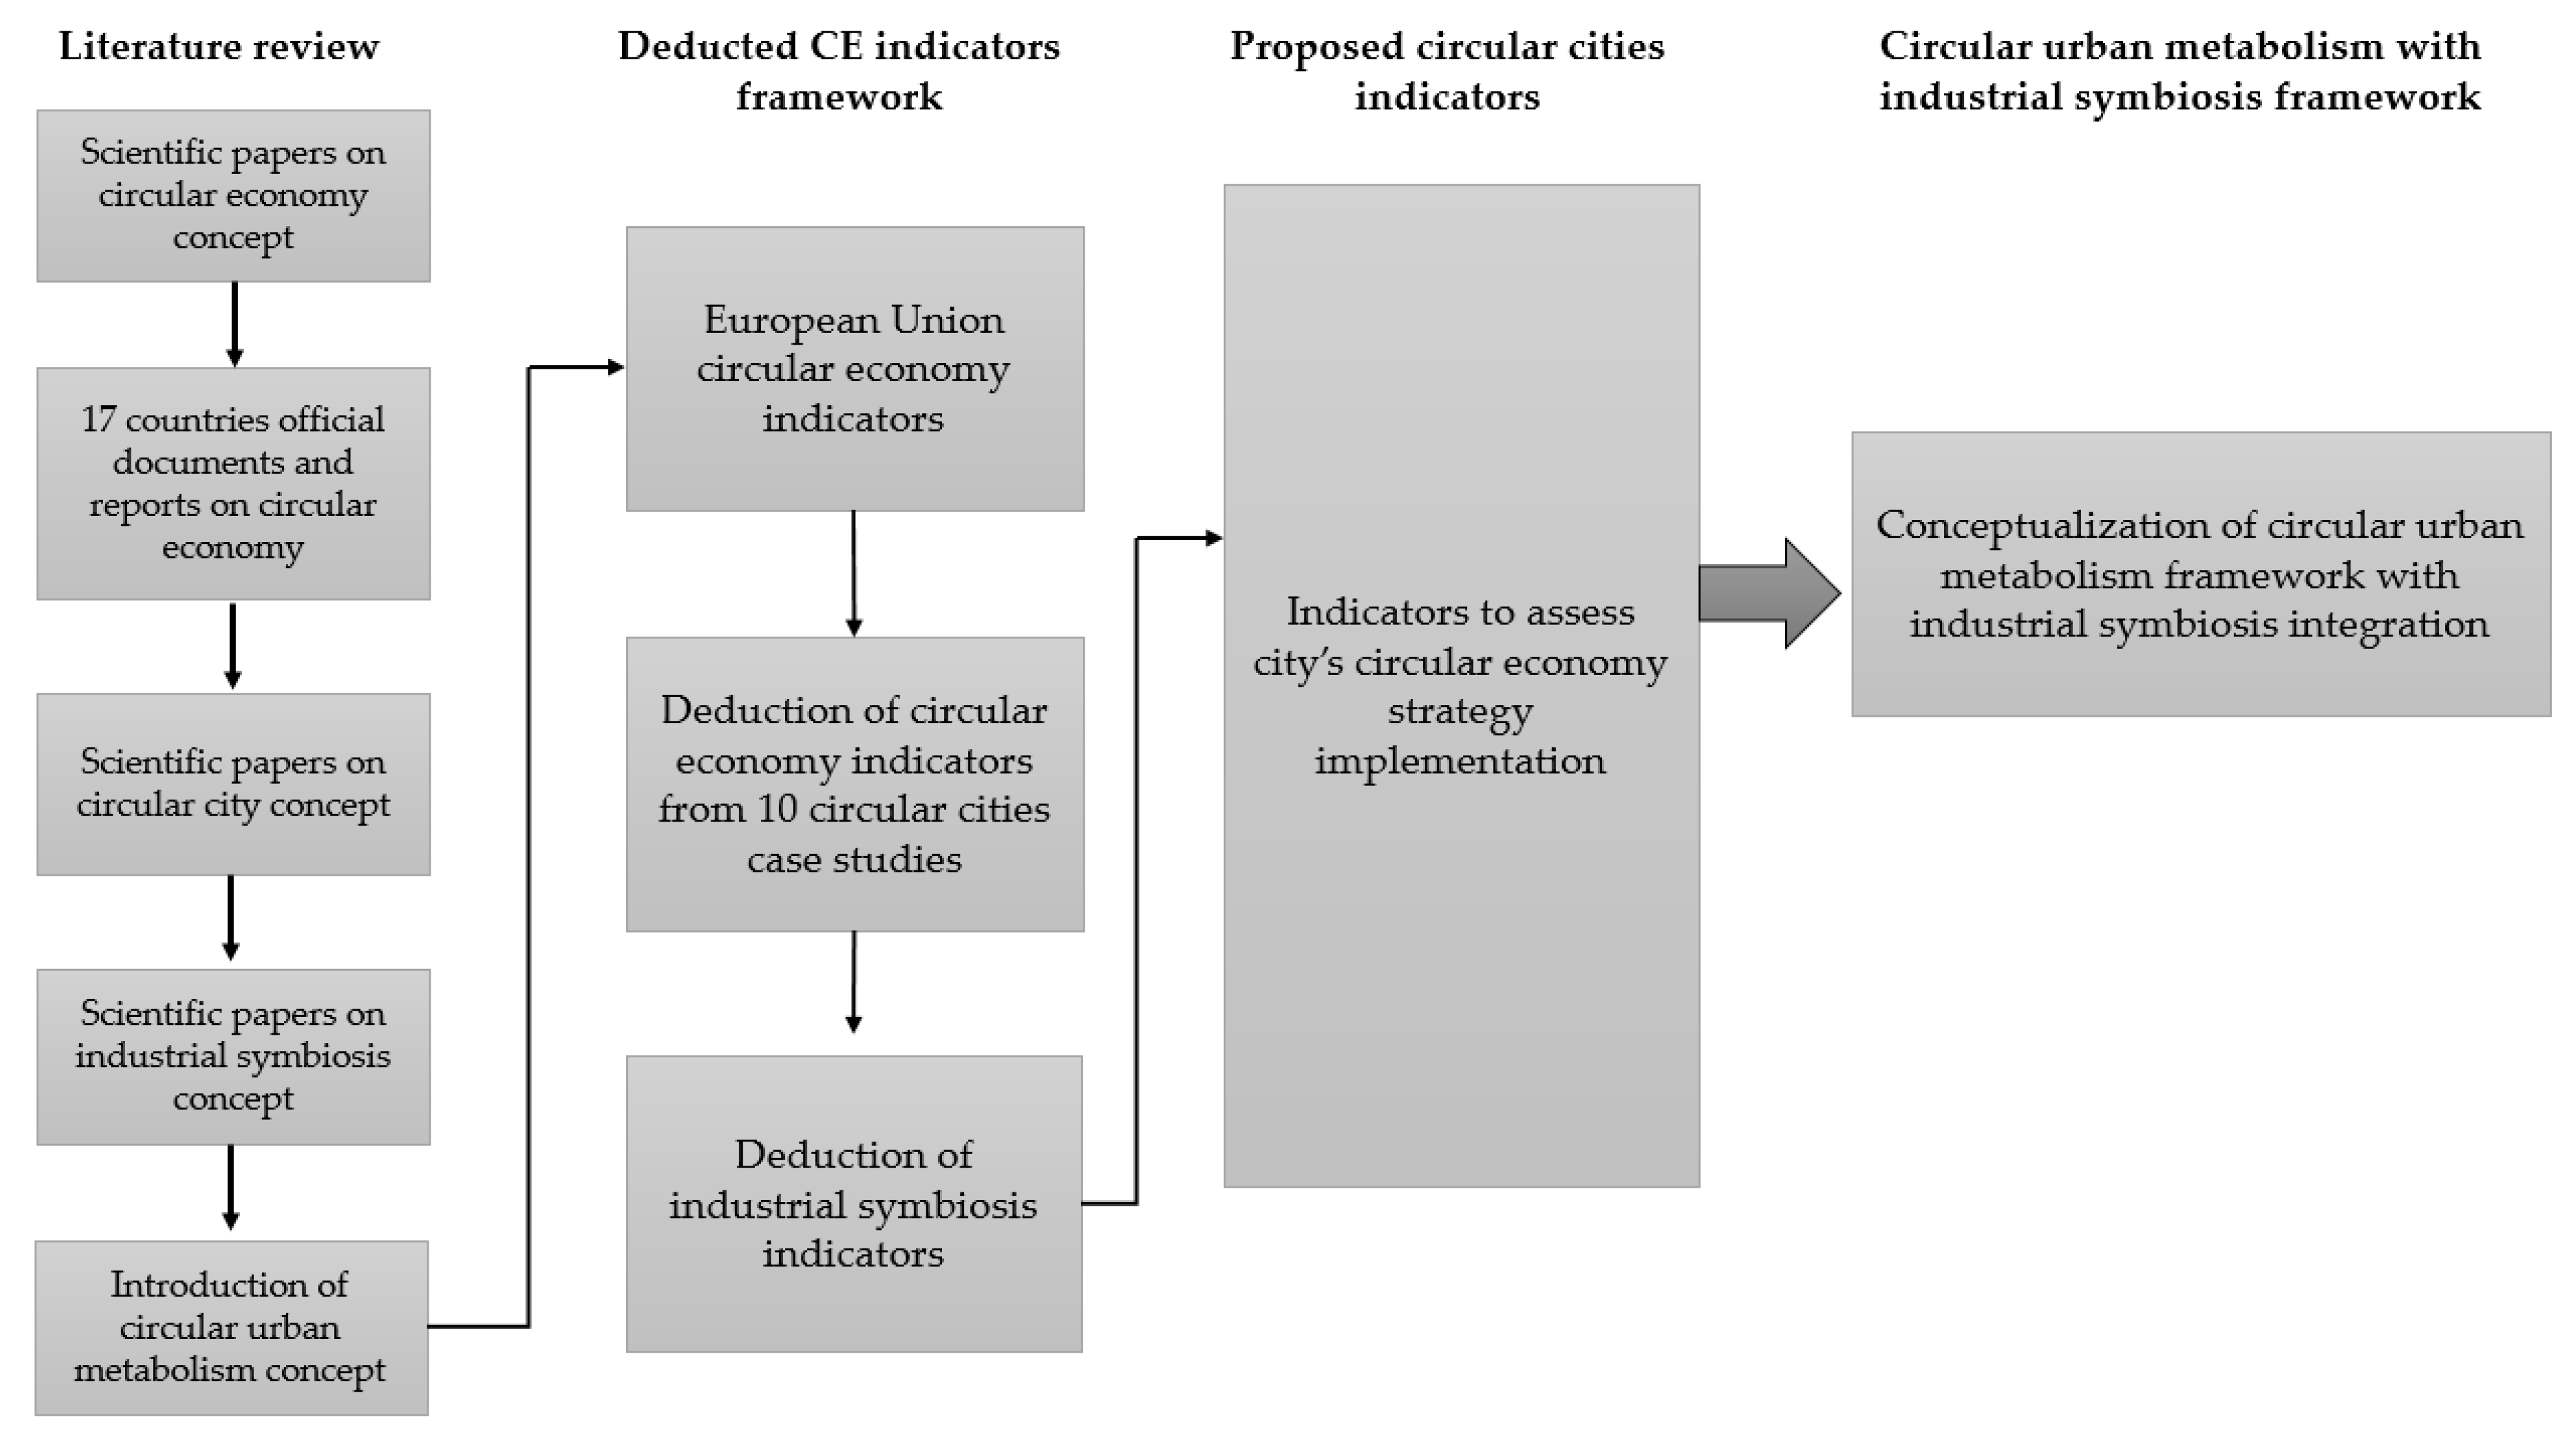
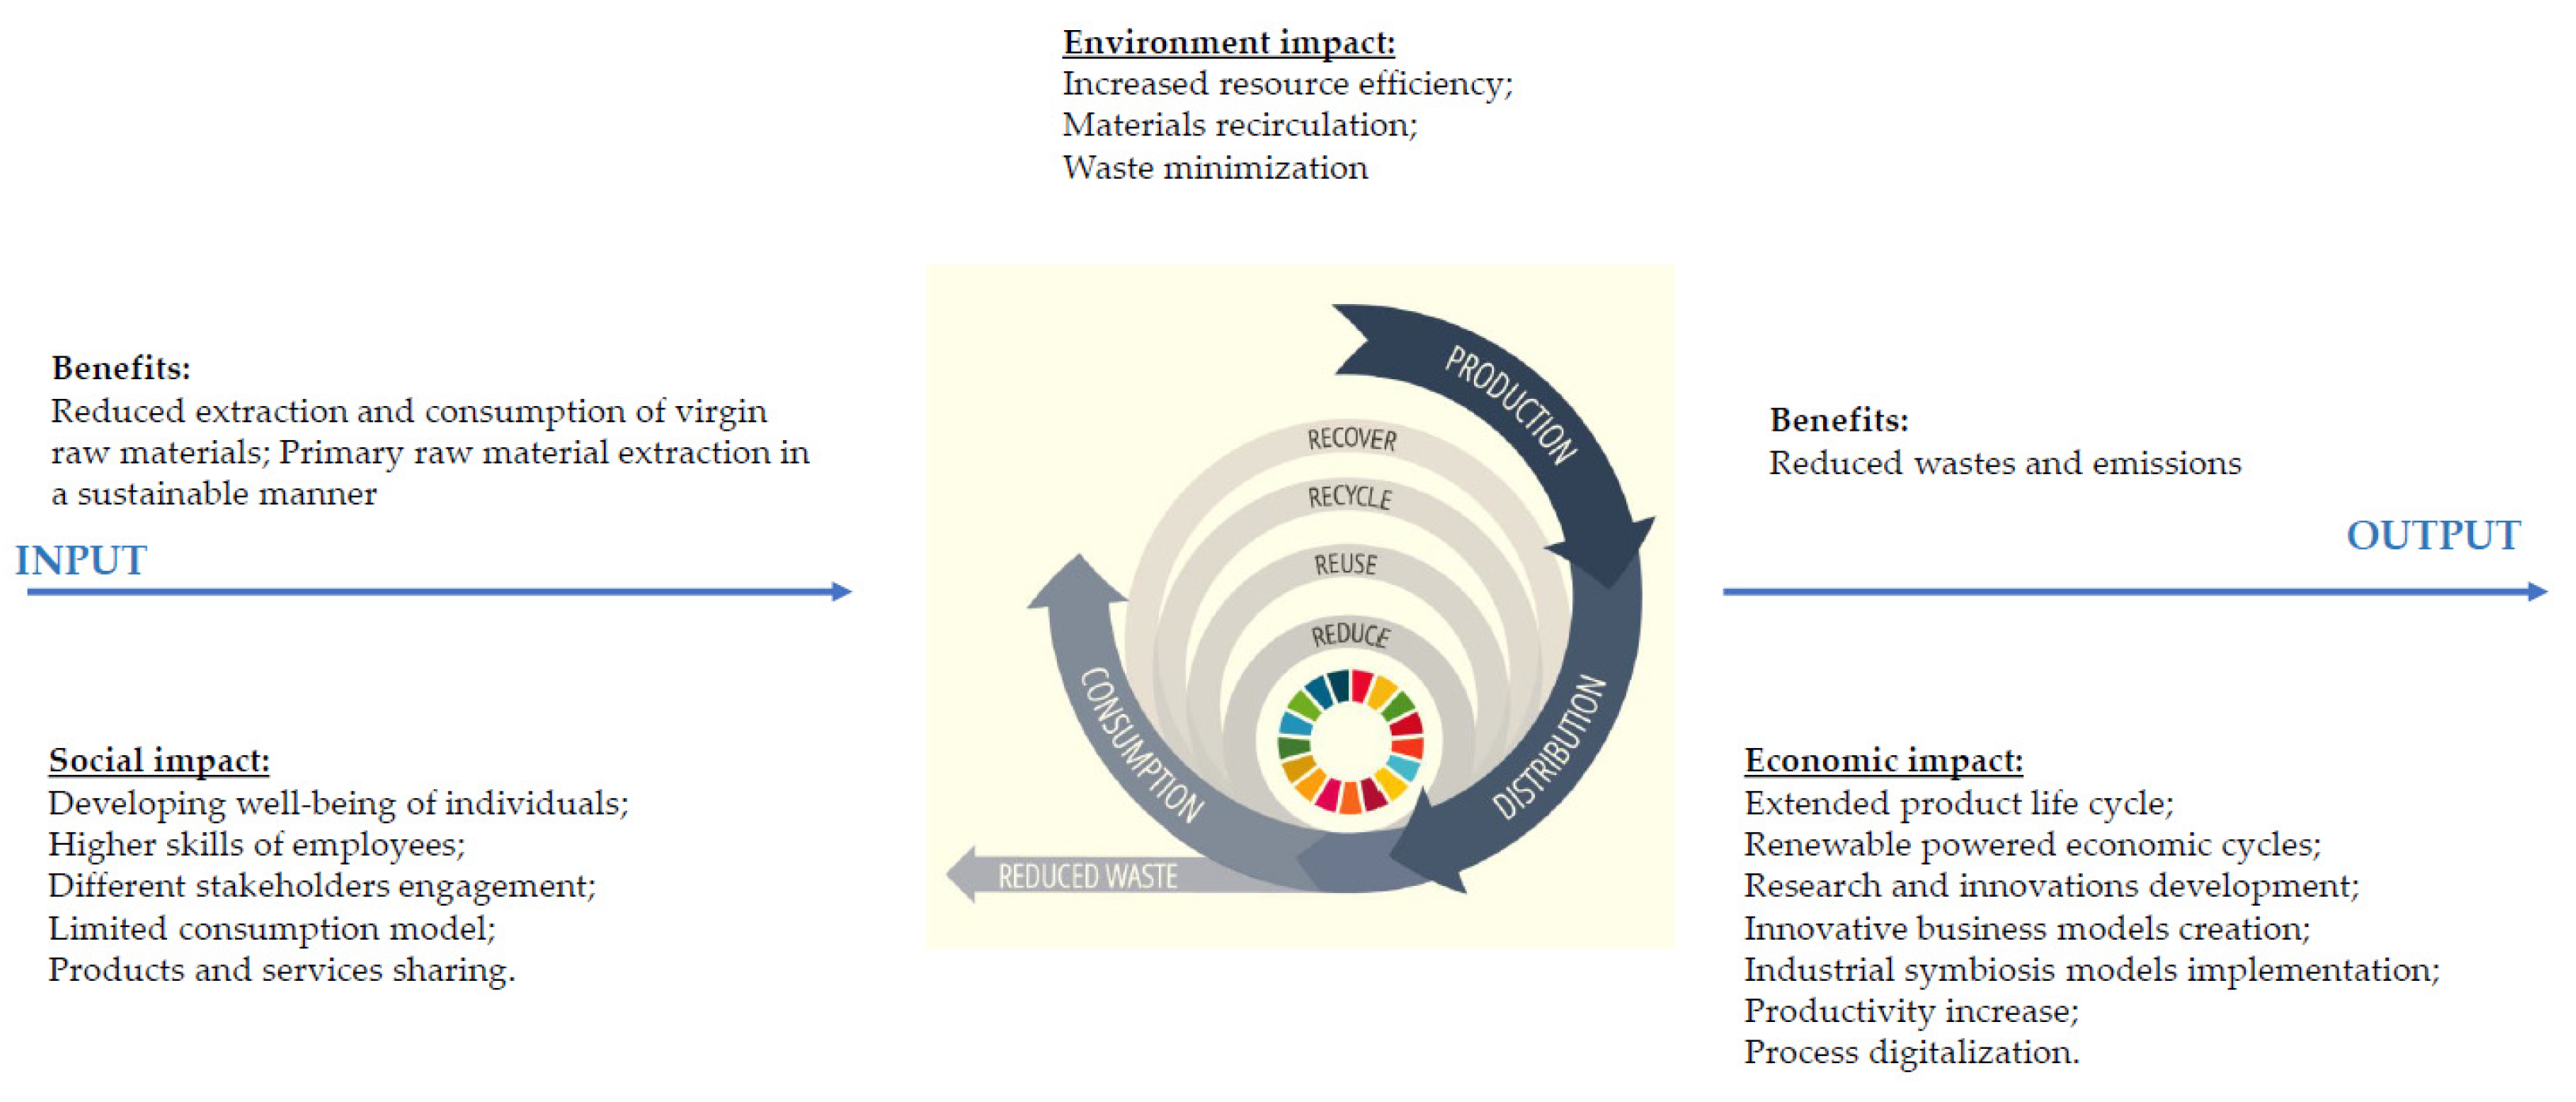

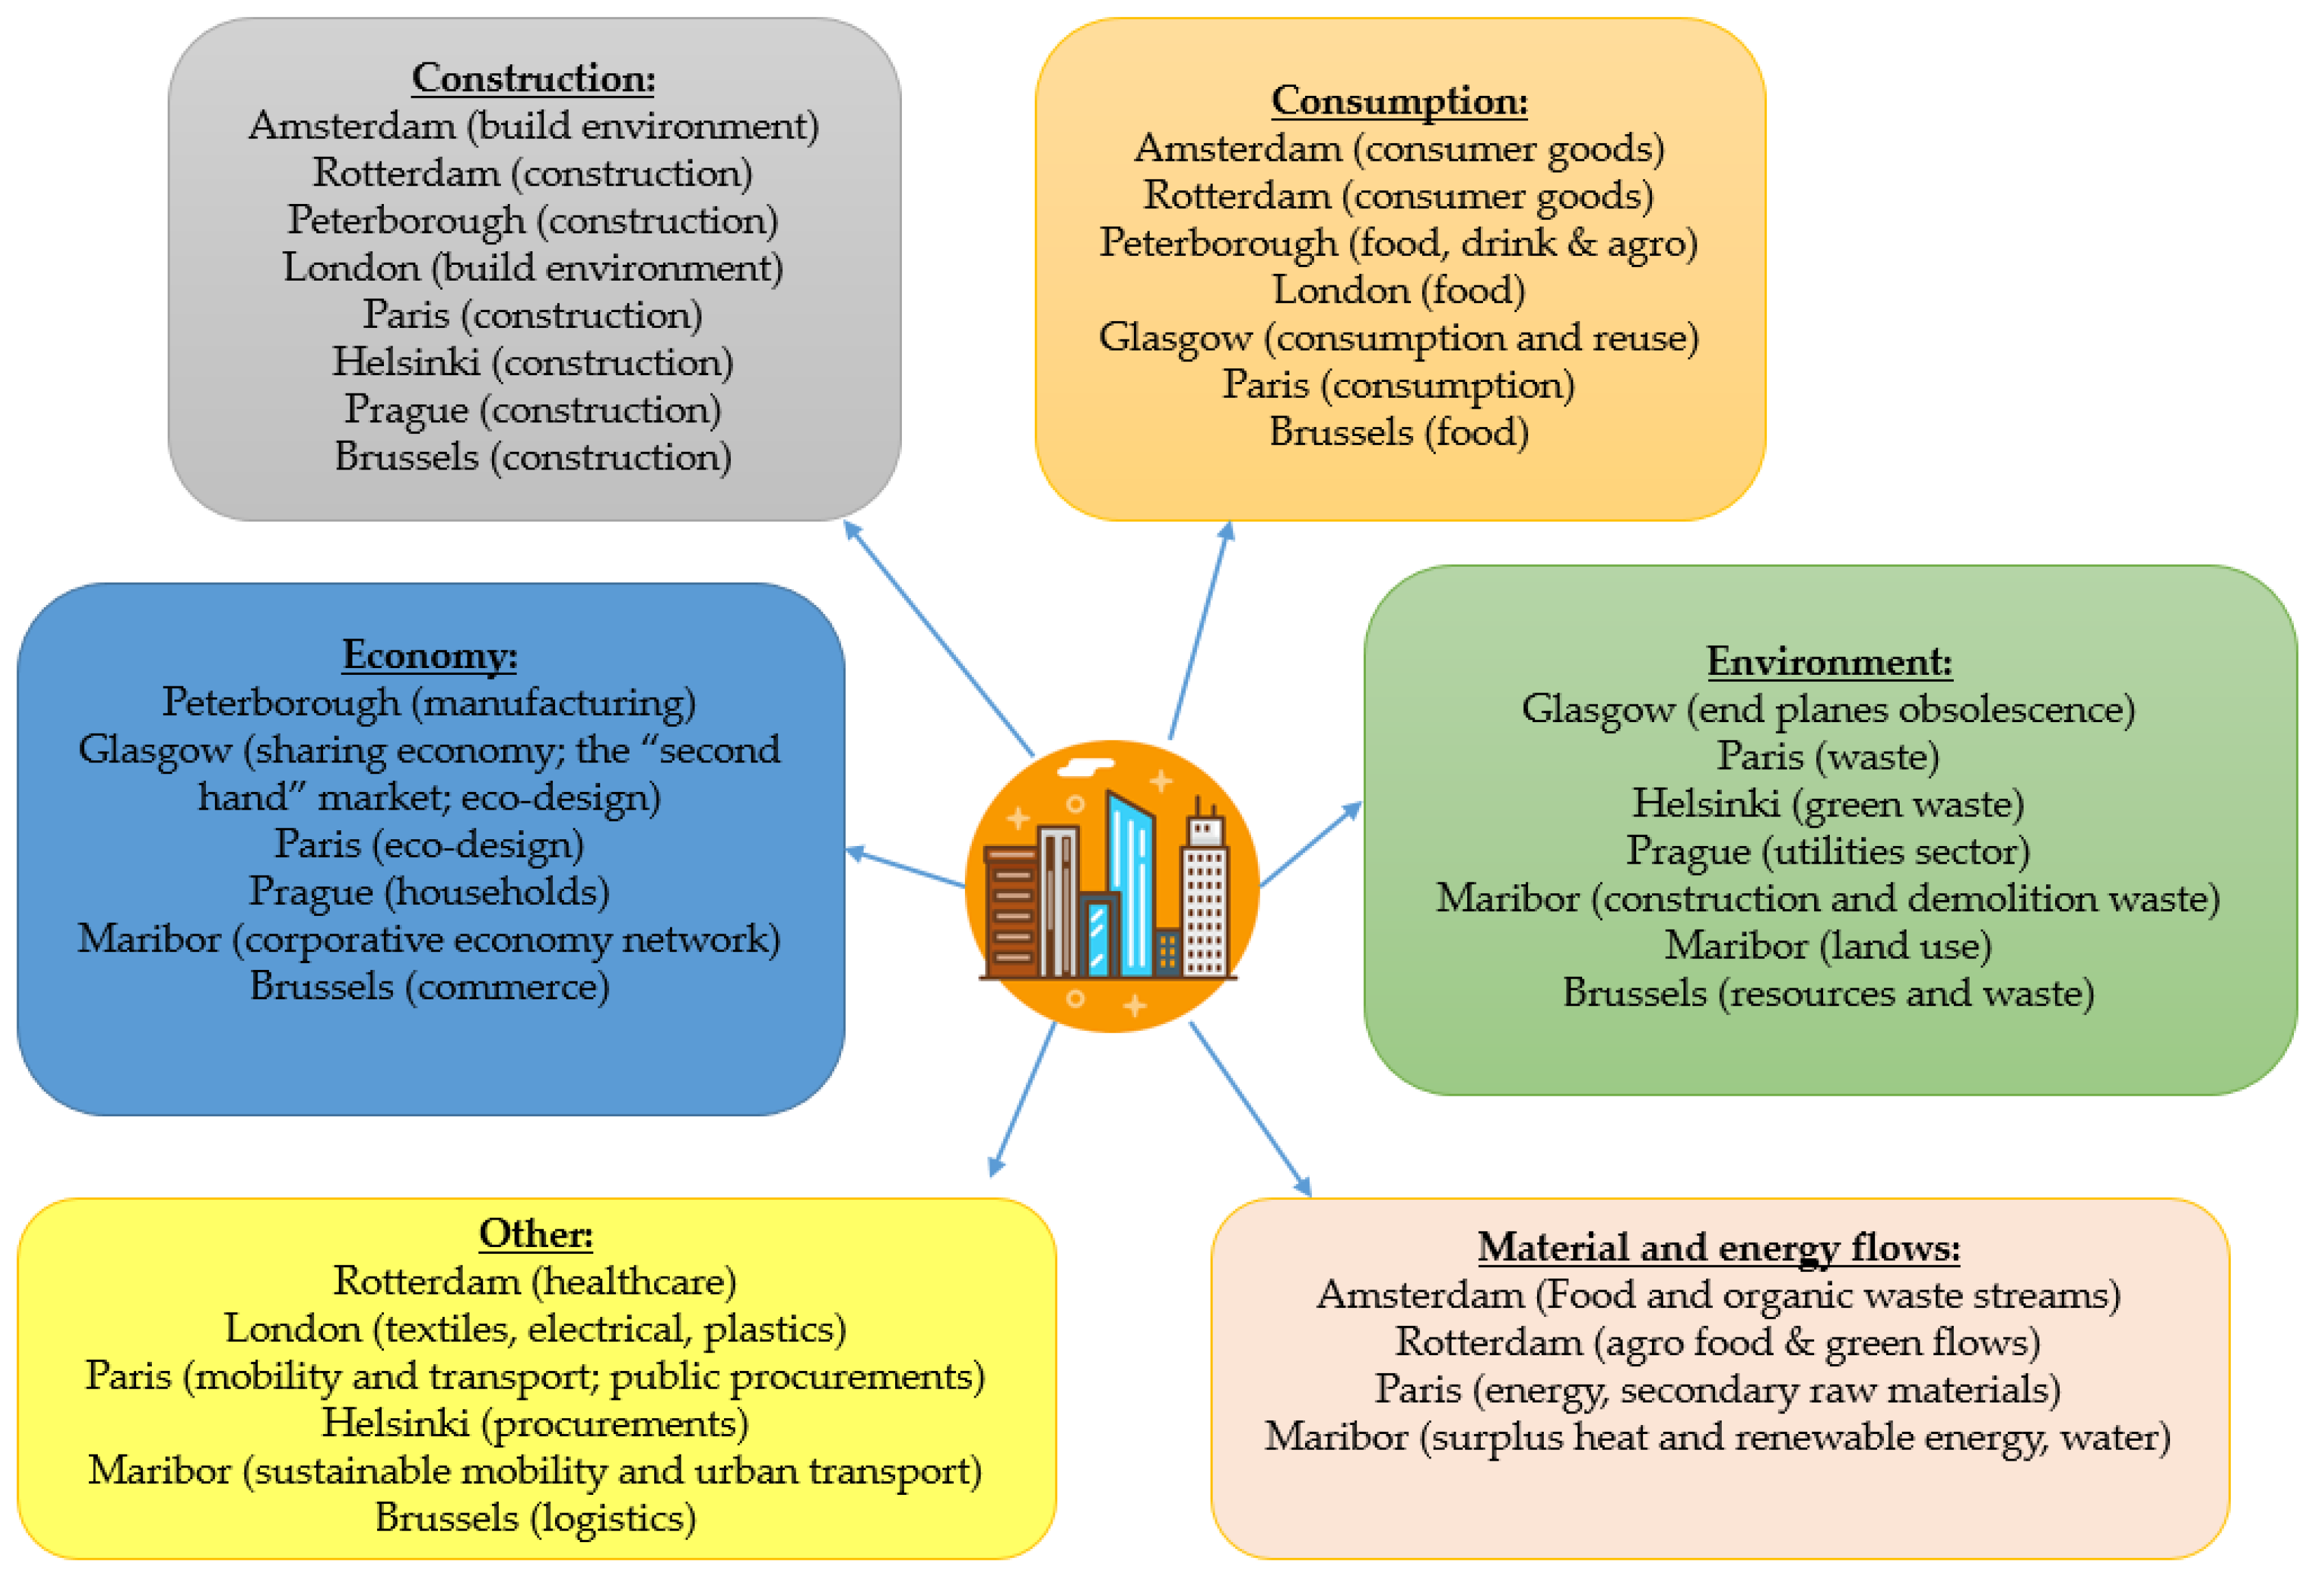
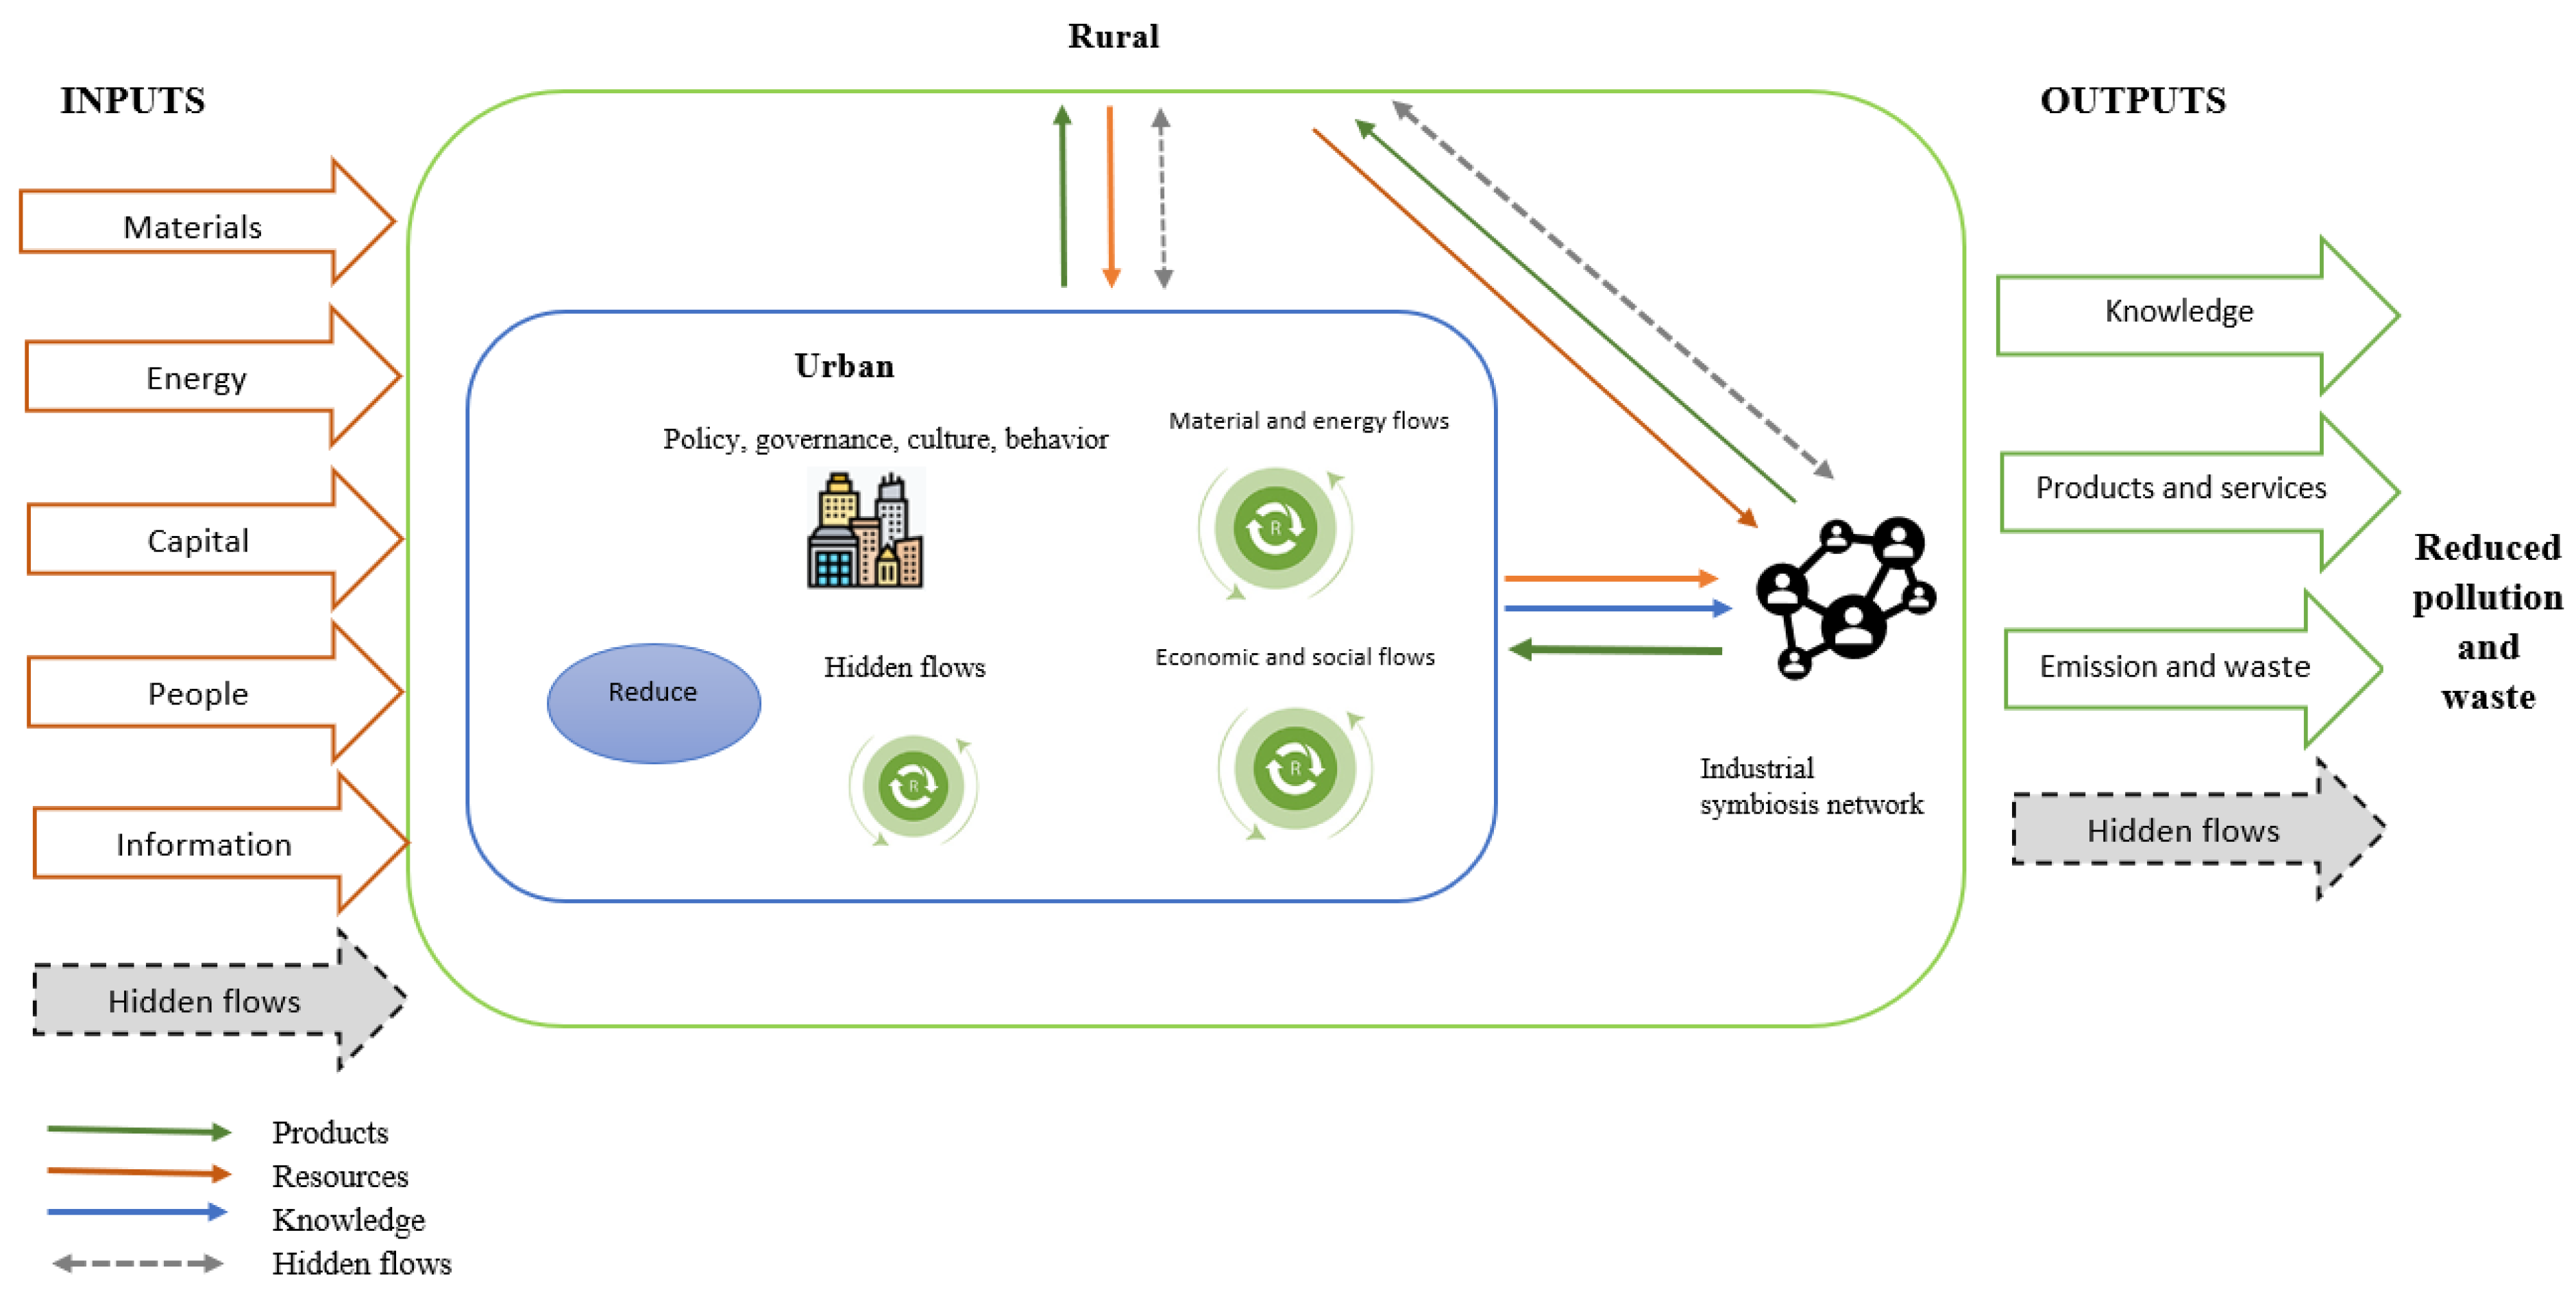
Publisher’s Note: MDPI stays neutral with regard to jurisdictional claims in published maps and institutional affiliations. |
© 2021 by the authors. Licensee MDPI, Basel, Switzerland. This article is an open access article distributed under the terms and conditions of the Creative Commons Attribution (CC BY) license (https://creativecommons.org/licenses/by/4.0/).