Article

Developing Country-Specific Methane Emission Factors and Carbon Fluxes from Enteric Fermentation in South Korean Dairy Cattle Production

1
Department of Eco-Friendly Livestock Science, Institutes of Green Bio Science and Technology, Seoul National University, Pyeongchang, Gangwon-do 25354, Korea
2
Department of International Agricultural Technology, Graduate School of International Agricultural Technology, Seoul National University, Pyeongchang, Gangwon-do 25354, Korea
3
Department of Agricultural Biotechnology, College of Agriculture and Life Sciences, Seoul National University, Seoul 08826, Korea
4
National Institute of Animal Sciences, Rural Development Administration, Jeonju-si, Jeollabuk-do 54875, Korea
5
Asia Pacific Ruminant Institute, Icheon, Gyeonggi-do 17385, Korea
*
Author to whom correspondence should be addressed.
Sustainability 2021, 13(16), 9133; https://doi.org/10.3390/su13169133
Submission received: 6 July 2021 / Revised: 7 August 2021 / Accepted: 10 August 2021 / Published: 15 August 2021
(This article belongs to the Special Issue Dairy Sector: Opportunities and Sustainability Challenges)

Abstract

:
Dairy cattle farming contributes significantly to greenhouse gas (GHG) emissions through methane (CH4) from enteric fermentation. To complement global efforts to mitigate climate change, there is a need for accurate estimations of GHG emissions using country-specific emission factors (EFs). The objective of this study was to develop national EFs for the estimation of CH4 emissions from enteric fermentation in South Korean dairy cattle. Information on dairy cattle herd characteristics, diet, and management practices specific to South Korean dairy cattle farming was obtained. Enteric CH4 EFs were estimated according to the 2019 refinement of the 2006 Intergovernmental Panel on Climate Change (IPCC) using the Tier 2 approach. Three animal subcategories were considered according to age: milking cows >2 years, 650 kg body weight (BW); heifers 1–2 years, 473 kg BW; and growing animals <1 year, 167 kg BW. The estimated enteric CH4 EFs for milking cows, heifers, and growing animals, were 139, 83 and 33 kg/head/year, respectively. Currently, the Republic of Korea adopts the Tier 1 default enteric CH4 EFs from the North America region for GHG inventory reporting. Compared with the generic Tier 1 default EF of 138 (kg CH4/head/year) proposed by the 2019 refinement to the 2006 IPCC guidelines for high-milking cows, our suggested value for milking cows was very similar (139 kg CH4 /head/year) and different to heifers and growing animals EFs. In addition, enteric CH4 EFs were strongly correlated with the feed digestibility, level of milk production, and CH4 conversion rate. The adoption of the newly developed EFs for dairy cattle in the next national GHG inventory would lead to a potential total GHG reduction from the South Korean dairy sector of 97,000 tons of carbon dioxide-equivalent per year (8%). The outcome of this study underscores the importance of obtaining country-specific EFs to estimate national enteric CH4 emissions, which can further support the assessment of mitigation actions.

1. Introduction

Concerns about climate change have increased during the last decade, and the issue has become one of the world’s most serious challenges, threatening the sustainability of agricultural production [1,2]. Global climate change is caused by the accumulation of greenhouse gas (GHG) emissions in the atmosphere [3]. The livestock sector is one of the most significant sources of GHG emissions, contributing 14.5% of global GHG emissions [4]. In addition, methane (CH4) is recognized as the second most important GHG emitted by anthropogenic sources and is a major driver of climate change [4]. Enteric fermentation (CH4) emissions from ruminants account for approximately 17% of total global anthropogenic CH4 emissions [5].
Accurate estimations of GHG emissions are of primary importance when reporting inventories, calculating carbon footprints, identifying GHG sources and sinks, and developing mitigation strategies for GHG emissions at the national scale. Improved estimations using country-specific emission factors (EFs) would support more accurate GHG inventories. The Intergovernmental Panel on Climate Change (IPCC) has developed comprehensive guidelines for national GHG inventories for livestock enteric CH4 emissions and has proposed different levels (Tier 1, Tier 2, and Tier 3) of estimations according to the quantity of information required and the level of complexity [6]. Tier 1 is an empirical method to calculate enteric CH4 emissions that use default EFs per head of livestock. Tier 2 is an improved method that requires information about animal categories, feeding, and production systems. The Tier 3 approach is used when a country-specific methodology for enteric CH4 emission estimation has been developed by the IPCC [7]. Methods for estimating enteric CH4 EFs that were included in the 2006 IPCC guidelines were partly refined in 2019 to provide an updated scientific basis for supporting the preparation and continuous improvement of national GHG inventories. The refinement mainly comprised the update of the CH4 conversion factor (Ym, %) and default EFs [6]. The Republic of Korea (ROK) ranks 10th in the world in terms of GHG emissions and plans to reduce its GHG emissions by more than 200 million tons of carbon dioxide-equivalent (CO2-eq) (37%) by 2030. This plan affects eight different economic sectors, including agriculture [8]. Despite the low contribution of the agriculture sector (3%) to total GHG emissions, the ROK is working towards low-cost strategies to reduce GHG emissions, especially from the livestock sector, which contributes 42% of agriculture emissions (9.4 million tons CO2-eq per year), mainly from the CH4 produced from enteric fermentation. Hence, the ROK has set a target to reduce emissions from livestock production by 0.6 million tons per year by 2030 and to become carbon neutral by 2050 [9]. On the other hand, dairy cattle production is recognized as a strategic sector in the ROK, accounting for 23% of the total enteric fermentation emissions [9,10]. The South Korean dairy sector has grown and undergone significant changes since 1990, with the annual milk production increasing considerably due to the increase in animal productivity. Milk productivity per cow increased from 5500 kg/cow/year in 1990 to more than 9000 kg/cow/year in 2019, and the ROK is considered to have one of the highest milk productivities per cow in the world [11]. This increase in milk production can be explained by the adoption of milking cows with a high milk production potential and the use of a total mixed ration (TMR) based on high feed quality imported from the international market [10]. However, the ROK communicates its enteric CH4 emissions from livestock using default EFs based on the IPCC Tier 1 method from North America [9,12].
To the best of our knowledge, there have been no studies conducted on the development of enteric CH4 EFs in dairy cattle production using the most recently updated IPCC Tier 2 approach in the ROK. In addition, most industrialized countries such as Canada, Japan, Denmark, and Ireland adopted the Tier 2 approach to calculate enteric CH4 EFs instead of the Tier 1 method for reporting their GHG inventory from dairy cattle [13,14]. The synthesis of appropriate data would provide a much-needed improvement over the current IPCC Tier 1 approach, leading to an inventory (Tier 2) that reflects the country-specific feeding management practices as well as animal productivity and animal categories. Therefore, the objective of the current study was to develop CH4 EFs from enteric fermentation in the main dairy cattle subcategories in the ROK using the 2019 refinement to the 2006 IPCC Tier 2 approach and to assess the impact on the national GHG inventory.

2. Materials and Methods

2.1. Development of Tier 2 Enteric Methane Emission Factors for Dairy Cattle

The EFs from enteric CH4 fermentation for each dairy cattle subcategory were developed using the IPCC [6] Tier 2 approach based on gross energy intake (GEI) and Ym (%) as follows:
EF = [ GE   × ( Y m / 100 )   ×   365   days / year ) 55 . 65   MJ / kg   CH 4 ]
where, EF is the CH4 emission factor (kg CH4/head/year) and Ym represents the CH4 conversion rate (%), which is the fraction of gross energy in feed converted to CH4 (CH4 yield).
The calculation procedures involve the following four steps: calculation of net energy (NE) requirements for different functions (maintenance, lactation, pregnancy and growth), conversion of NE requirement to gross energy (GE) requirement, estimation of CH4 energy output using Ym as the proportion of GE intake, and conversion of CH4 energy output to CH4 emissions [6,15] (Figure 1). Activity data are required to calculate the GE based on IPCC guidelines [6] and the effect of input data on CH4 EFs was determined using the random forest procedure [16], which was operated using SAS software (version 9.4). The equation used to calculate daily GEI for dairy cattle subcategories is as follows:
GE = [ ( NE m + NE a + NE l + NE p REM ) + ( NE g REG ) DE % 100 ]
where, GE, Gross energy (MJ/head/ day); NEm, Net energy for maintenance (MJ/day); NEa, Net energy for activity (MJ/day); NEl, Net energy for lactation (MJ/day); NEp, Net energy for pregnancy (MJ/day); NEg, Net energy for growth (MJ/day); DE%, Digestible energy expressed as a percentage of gross energy; REM, Ratio of net energy available in diet for maintenance to digestible energy consumed; REG, Ratio of net energy available for growth in a diet to digestible energy consumed.
Equations used to estimate NE requirements (NEm, NEl, NEp, and NEg), REM and REG are listed as follows:
NE m = C f i × ( weight ) 0.75
where, NEm, Net energy for maintenance (MJ/day); Cfi, maintenance coefficient.
NE l = Milk   × ( 1.47 + 0.40 × Fat )
where, NEl, Net energy for lactation (MJ/day).
NE p = C p r e g n a n c y ×   NE m
where, NEp, Net energy for pregnancy (MJ/day); Cpregnancy, pregnancy coefficient; NEm, Net energy for maintenance (MJ/day).
NE g = 22 . 02   ×   ( BW C × M B W ) 0 . 75 × W G 1.097
where, NEg, Net energy for growth (MJ/day); BW, body weight (kg); C, coefficient with a value of 0.8 for females, 1.0 for castrates, and 1.2 for bulls; MBW, mature body weight (kg); WG, average daily weight gain (kg/day).
REM = [ 1.123 ( 4.092 × 10 3 × D E ) + ( 1.126 × 10 5 × ( D E ) 2 ) ( 25.4 D E ) ]
where, REM, Ratio of net energy available in diet for maintenance to digestible energy consumed; DE, Digestible energy expressed as a percentage of gross energy.
REG = [ 1.164 ( 5.16 × 10 3 × D E ) + ( 1.308 × 10 5 × ( D E ) 2 ) ( 37.4 D E ) ]
where, REG, Ratio of net energy available for growth in a diet to digestible energy consumed; DE, Digestible energy expressed as a percentage of gross energy.

2.2. Identification of Animal Subcategories, Breeds, and Body Weights

The IPCC guidelines [6] recommended that livestock subcategories should be defined to generate relatively homogeneous subcategories of animals that reflect country-specific variations in animal characteristics, performance, and feeding systems [6]. The dairy cattle population is reported in South Korean national statistics as an aggregation of animals based on their age (months) in three main subcategories: milking cows, corresponding to animals aged >2 years; heifers, representing animals 1–2 years of age; and growing animals, corresponding to animals aged <1 year [17]. Although many countries raise several dairy cattle breeds, the ROK raises only a single breed (Holstein), which is characterized by a high potential milk production. Due to the lack of data on the average body weight (BW) and average daily gain (ADG) of dairy cattle subcategories in the ROK, data were gathered from various literature sources. Average BW, mature BW, and ADG were calculated from the South Korean feeding standards for dairy cattle [18] and an updated version of the growing chart of dairy cattle in the USA [19].

2.3. Milk Production and Fat Content

The average milk production from milking cows was obtained from a milk recording dataset of the NongHyup Agribusiness Group Inc. [20]. The NongHyup Agribusiness Database is an online recording system where dairy farmers report their milk production and milk fat content (%) monthly. The national average milk production in 2019 was defined based on milk yield data from 1300 dairy farms. The average milk production and milk fat content of milking cows in the ROK were 10,517 (kg/305 days/head) and 3.9%, respectively. The annual milk production was refined to be equal to the quantity of milk produced per 365 days.

2.4. Feed Intake and Digestibility Assumption

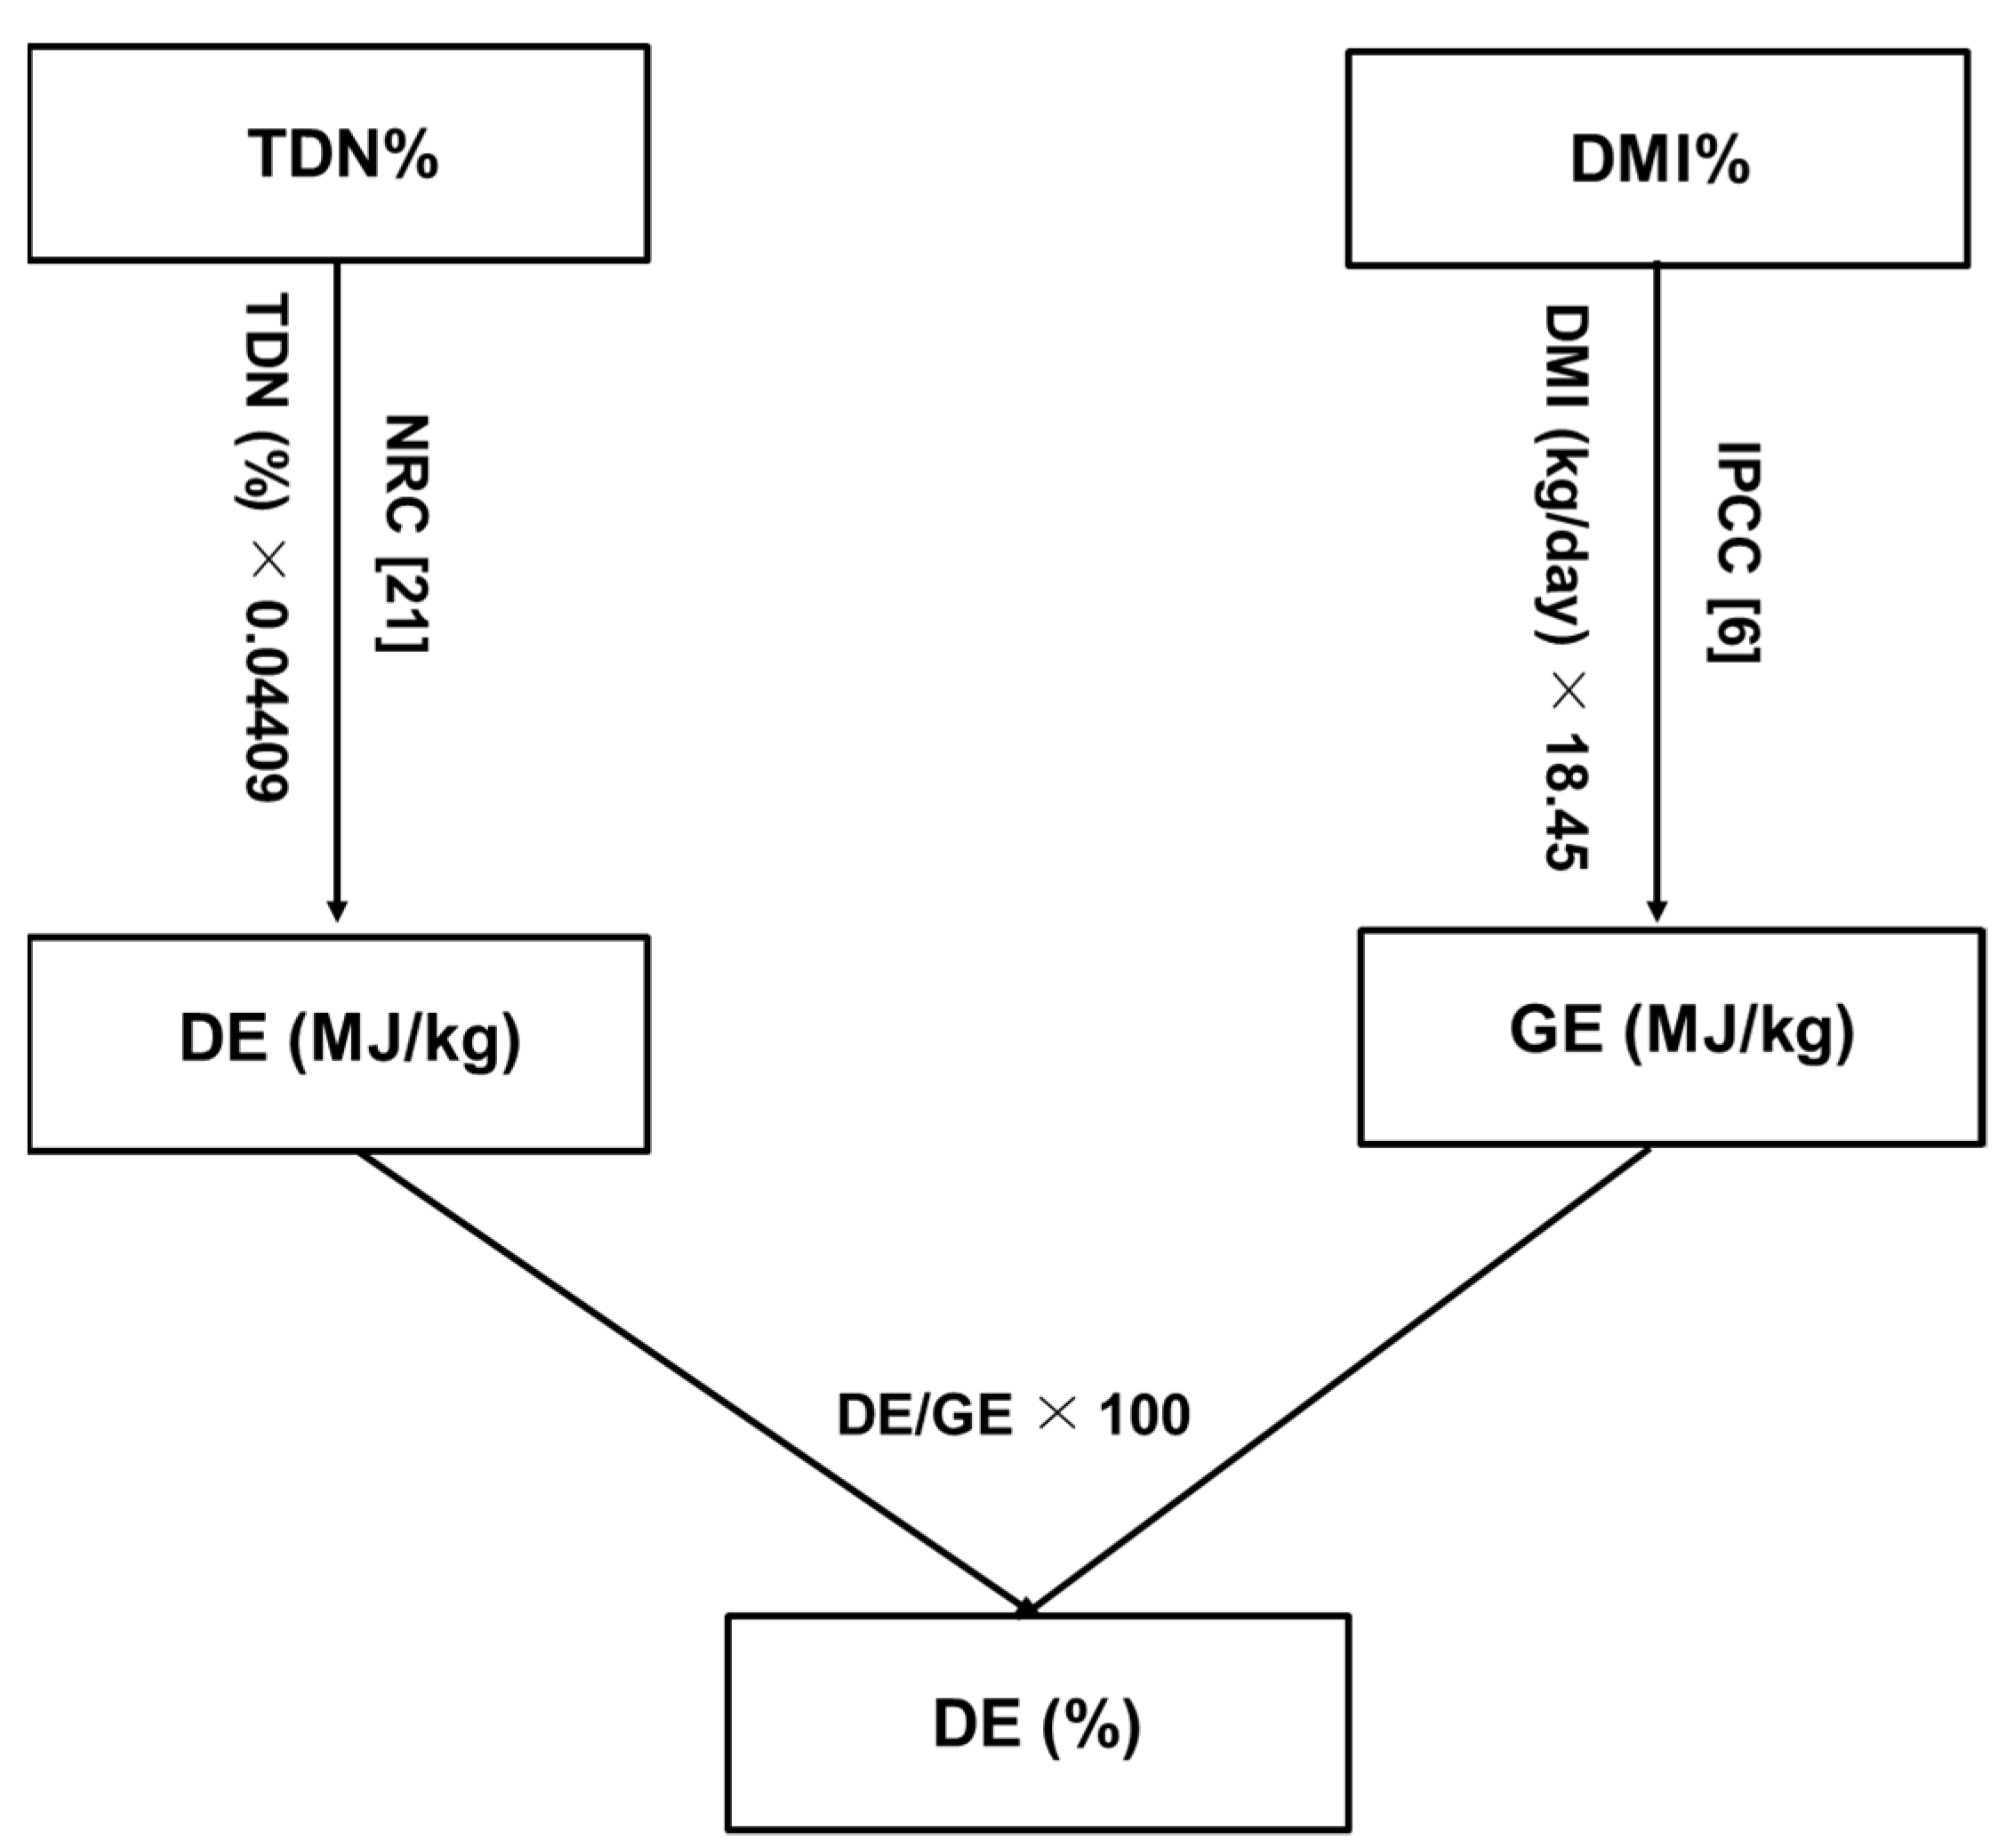
The TMR is the typical feeding system for dairy cattle production in the ROK, with animals fed in stalls [18]. The dry matter intake (DMI) of different dairy cattle subcategories was estimated from daily nutrient requirements reported in the South Korean feeding standard [18]. For animals >2 years, the DMI was determined according to the average milk production and milk fat levels. However, for animals aged 1–2 years and animals <1 year, the DMI was defined according to the average BW and ADG of each category [18]. Data on DE (%) of TMR were not available. The DE was assumed based on the total digestible nutrient content (TDN, %) of TMR feed and the DMI (kg) of each subcategory. The DE (%) assumption process is shown in Figure 2 [6,21].

2.5. Methane Conversion Rate Selection Process

The Ym (%) was defined as the percentage of GEI converted to CH4. The magnitude of the feed energy converted by each subcategory to CH4 depends on several interacting factors, such as feed and animal performance. The selection of the Ym (%) was based on the IPCC recommendation considering the milk yield, the neutral detergent fiber (NDF) content, and the DE (%) of feed [6]. For milking cows receiving a high-quality feed (DE ≥ 70 and NDF ≤ 35), the Ym (%) was a weighted annual value (5.8), using a high-productivity value of 5.7 for the lactating period of 305 days and a value of 6.3 for the dry period (60 days). For non-dairy animals (aged 1–2 years and animals > 1 year old) fed a TMR diet with a DE (%) lower than 72%, an average Ym (%) of 6.3 was selected for both categories. Activity data used to calculate the enteric CH4 EFs are presented in Table 1.

3. Results and Discussion

3.1. National Enteric Methane Emission Factors of Dairy Cattle

The estimated GEI and annual enteric CH4 EFs from dairy cattle subcategories using the 2019 refined IPCC Tier 2 methodology are reported in Table 2. The national values of the EFs of milking cows (>2 years), heifers (1–2 years), and growing animals (<1 year) were 139, 83, and 33 (kg CH4/head/year), respectively. Compared with the default enteric CH4 EF of dairy cattle used for the South Korean GHG inventory (118 kg CH4/head/year) [22], our estimated enteric CH4 EF for milking cows was 15% higher (Table 3). These differences between our predicted CH4 EF and the default value proposed by the IPCC [22] could be explained by the fact that the input data used for Tier 1 are defined to be representative at the continental level. The ROK uses the North America default CH4 EF to report their enteric fermentation emissions from dairy cattle [9] due to the similarity of farm management and animal productivity [22]. The Tier 2 estimations in the current study are specific to the dairy cattle production system in the ROK. Similarly, the enteric CH4 EFs of milking cows (animals >2 years) generated in this study using the IPCC [6] Tier 2 approach were 8% higher than the previous EF default value reported by the IPCC [7]. The default EF (138 kg/head/year) using the IPCC [6] Tier 1 approach was quite similar to the milking cow EF and different to heifers and growing animals EFs generated in this study. Despite the relative similarity between EFs for milking cows generated using the Tier 1 and 2 approaches, the IPCC Tier 2 methodology is preferred to IPCC Tier 1 in estimating the CH4 EF for enteric fermentation of dairy cattle because it provides specific EFs for each dairy cattle subcategory (milking cows, heifers, and growing animals), in addition to the fact that Tier 1 default EF is based on regional data while Tier 2 EFs are based on national data.
The enteric CH4 EF for the milking cows subcategory calculated in this study was lower than those of countries with heavier and higher-yielding cows, such as the USA, Israel, Denmark, and Sweden, where the average enteric CH4 EFs were 146, 150, 161, and 141.6, respectively [23,24,25]. The differences in dairy cow enteric CH4 EFs were related mainly to the differences in input data, such as milk productivity, feed quality, and CH4 conversion rate. By contrast, the enteric CH4 EF for milking cows generated in this study was higher than other reported values for highly productive milking cows in countries such as Japan and Saudi Arabia, where the enteric CH4 EFs were 131.5 and 124.8 kg CH4/head/year, respectively [26,27].

3.2. Effect of Input Data on Enteric Methane Emission Factors

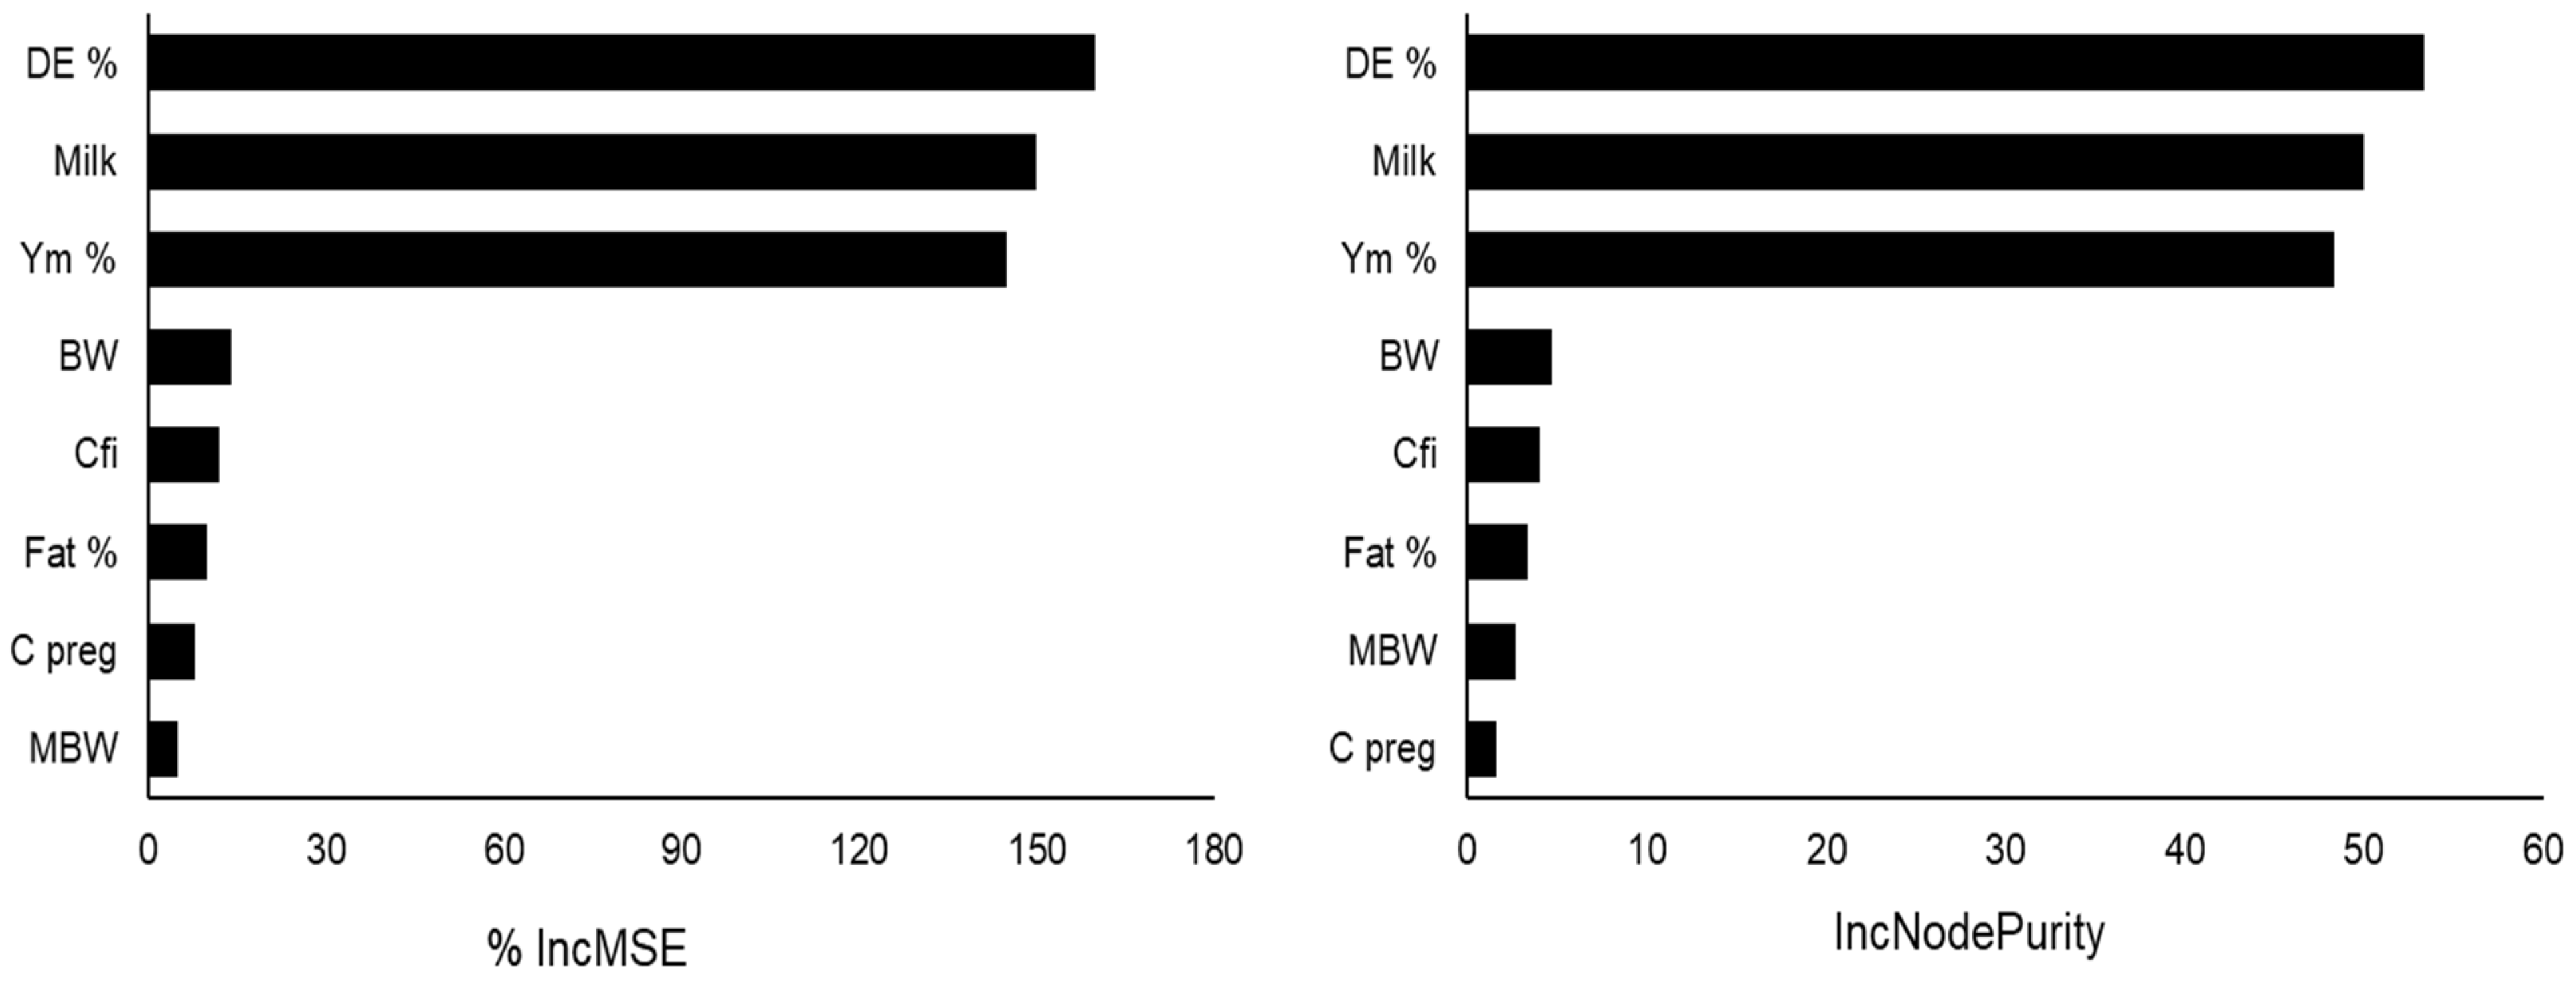
To investigate the importance of using accurate input parameter values in the Tier 2 enteric EFs, we used the random forest procedure [16] available in SAS v9.4. The results (Figure 3) showed that DE (%), milk production, and Ym (%) were the most important parameters that affected and determined the CH4 EFs from enteric fermentation in dairy cattle. For example, applying a higher DE (%) and milk production resulted in a decrease of enteric CH4 EFs.
Several studies have reported that activity data used for the calculation of the enteric CH4 EFs such as DE (%), Ym (%), and milk production could vary across animals, breeds, and feeding and production systems [5,26,27,28]. Parra and Mora-Delgado [29] reported that the enteric CH4 EF from dairy cattle in Colombia is largely influenced by animal performance and management system characteristics, especially dietary composition. In the same context, Ibidhi and Calsamiglia [28] reported that increasing the productivity of milking cows is an effective strategy to mitigate GHG emissions, especially enteric CH4 emissions, which may allow for a reduction in animal numbers while providing the same edible product output at a reduced level of GHG emissions. Parra and Mora-Delgado [29] reported that an increase of ~1500 L/cow/year would reduce the enteric CH4 emissions of milk by 6.4%. In addition, improving the DE (%) by providing high-quality feed to dairy cattle to raise milk productivity per cow will dilute the CH4 costs associated with maintenance energy requirements [5]. Feed supply provides substrates for microbial fermentation, and differences in feed digestibility and chemical composition affect the amount of energy, patterns of volatile fatty acids, and CH4 generated [5].

3.3. Mapping the Methane Flux from Enteric Fermentation

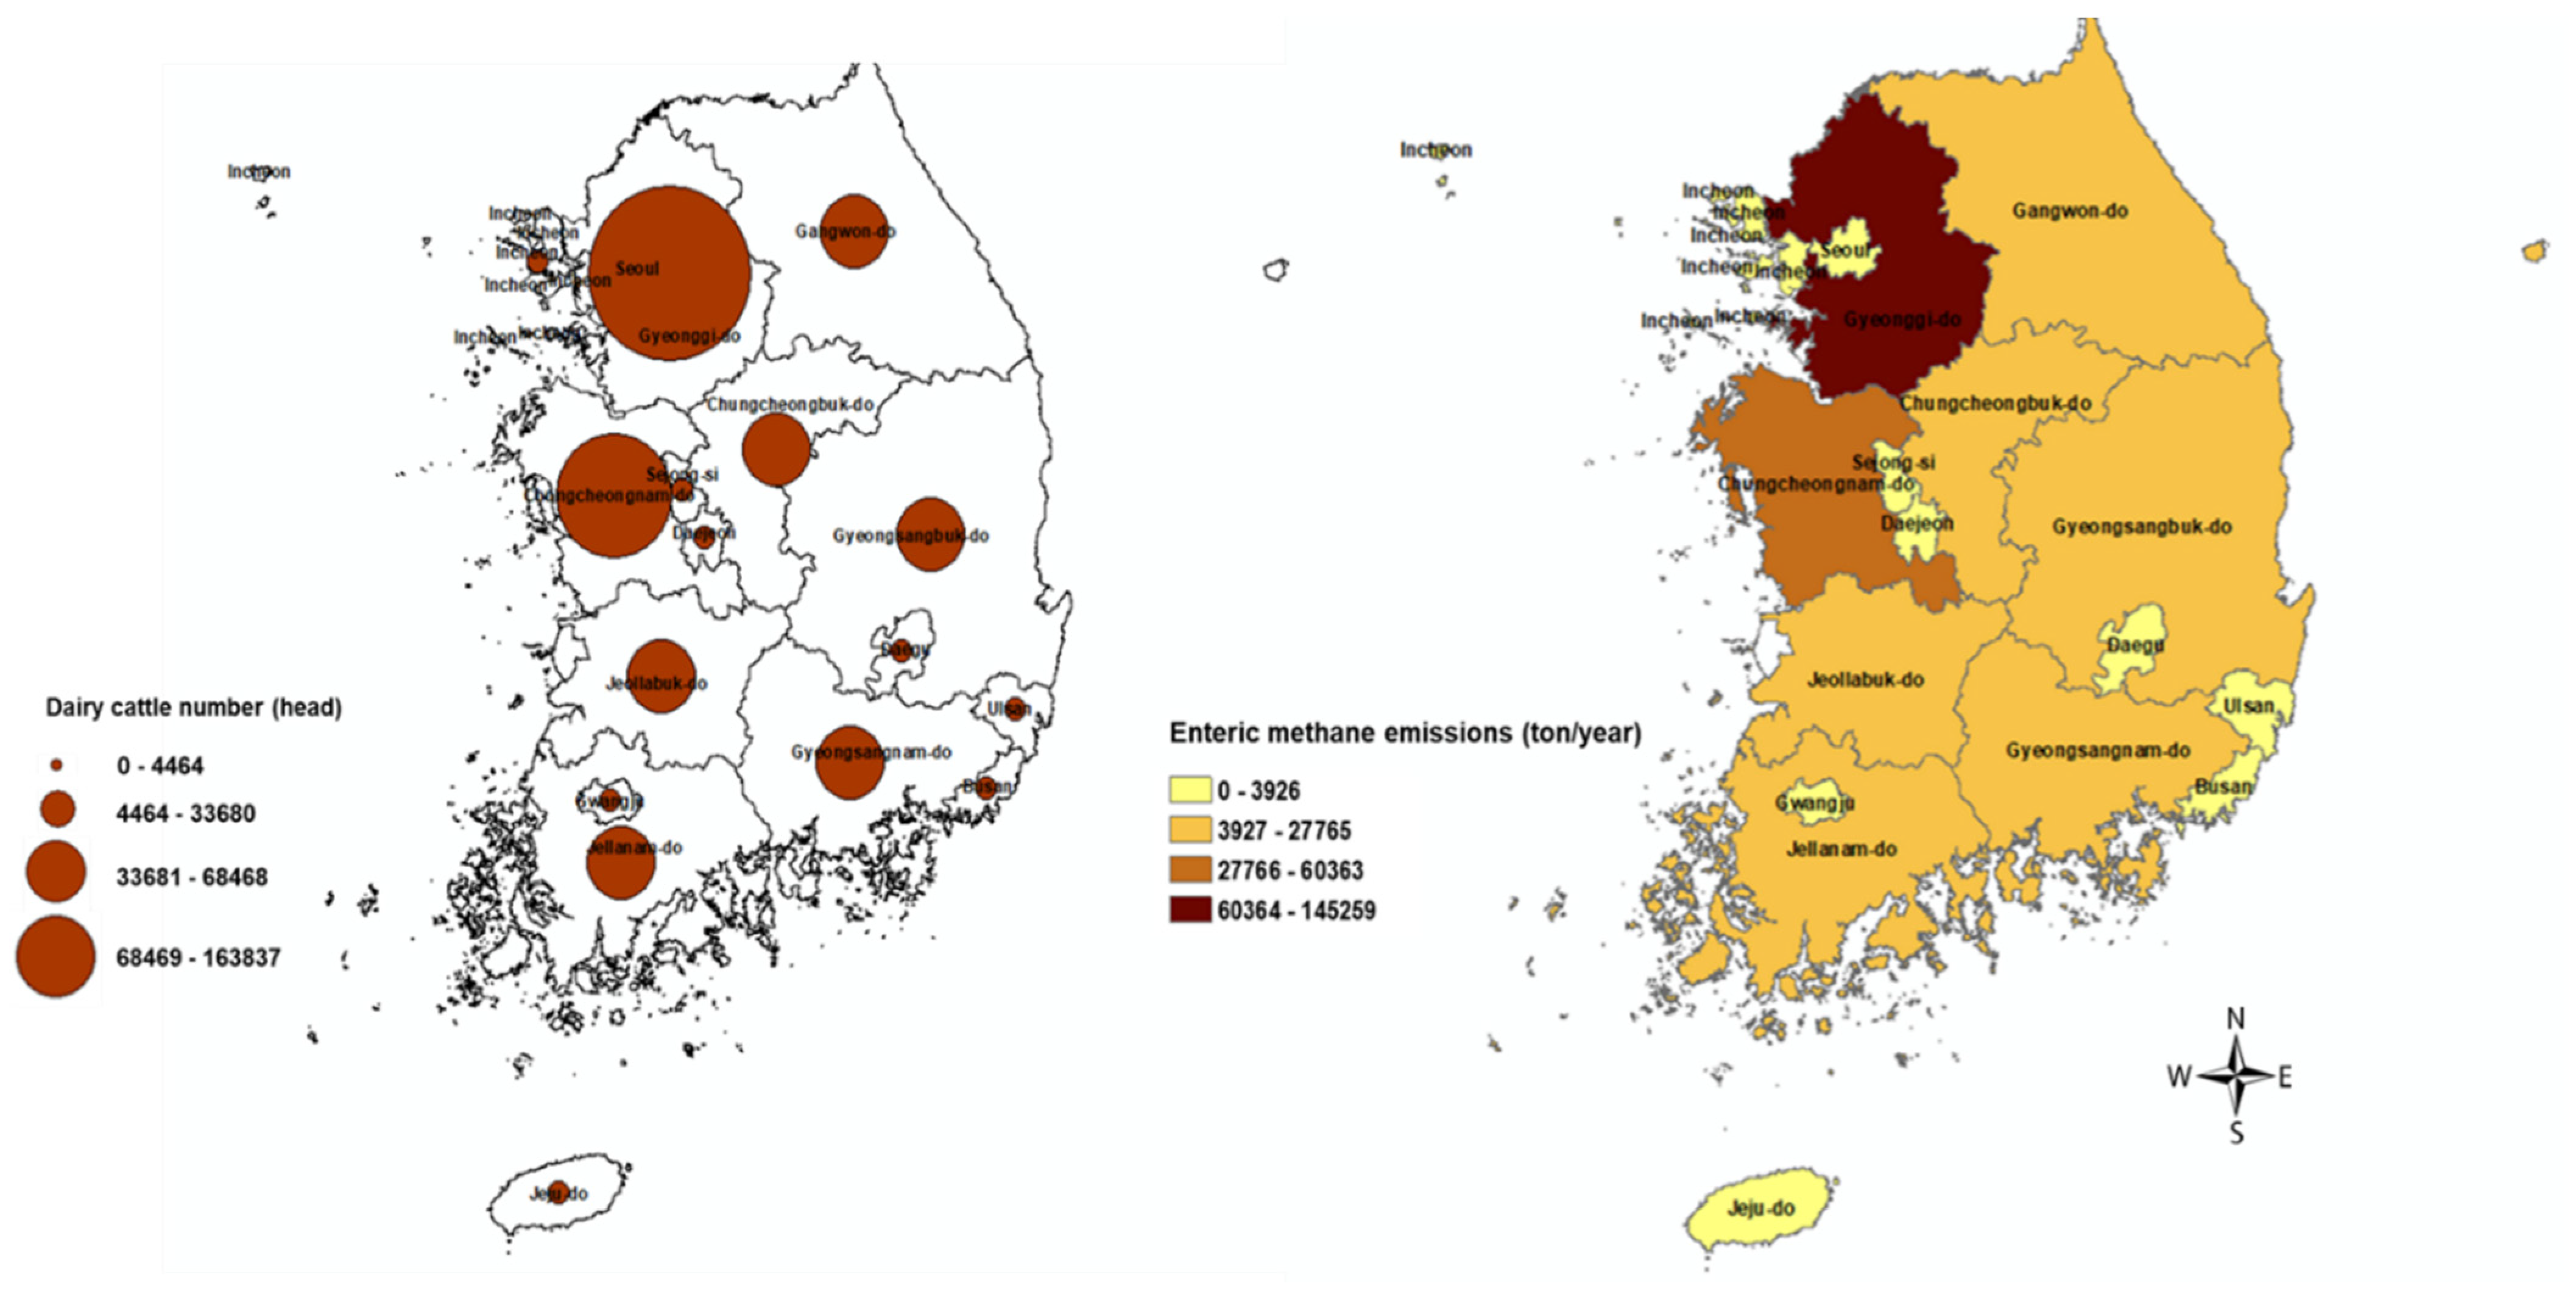
The spatial allocation of enteric fermentation CH4 fluxes using the IPCC Tier 2 methodology and dairy cattle population of 2019/2020 across South Korean districts is presented in Figure 4. The contribution of dairy cattle at the district level to the total national CH4 emissions varied considerably. More than 45% of cattle were concentrated in the Gyeonggi-do and Chungcheongnam-do districts, and therefore the maximum CH4 emissions occurred in those districts. Other districts had lower CH4 emissions due to their lower cattle population. Therefore, strategies to reduce CH4 from enteric fermentation should be adopted, especially in districts with a high emission intensity.

3.4. Implications of the Development of Enteric Methane Emission Factors

The ROK ratified the United Nations Framework Convention on Climate Change (UNFCCC) in September 2002 and made a commitment to become carbon neutral by 2050. The UNFCCC requires involves parties to the convention to develop, publish, and regularly update their national GHG emissions inventories from different sectors including agricultural and livestock production. In the fourth biennial update report of GHG emissions submitted to the UNFCCC in 2019, the ROK reported their enteric CH4 emissions from dairy cattle using the default EF from the IPCC [22] (118 kg CH4/head), which was applied to all dairy cattle subcategories. The annual total enteric CH4 emissions from dairy cattle was 1,204,000 tons CO2-eq. Using our suggested values of 139, 88 and 33 kg CH4 for milking cows (>2 years), heifers (1–2 years), and growing animals (<1 year), respectively, which are based on specific data from the South Korean dairy cattle production system, the enteric CH4 emissions were assumed to average 1,107,000 tons CO2-eq. Moreover, the use of the Tier 1 approach overestimated the enteric CH4 emissions from dairy cattle by 8%. Therefore, it is strongly recommended that the Tier 2 EF values generated in the current study are adopted in the next national GHG inventory communication to the UNFCCC. Finally, the findings of this study strengthen the accuracy of the estimation of GHG emissions from the South Korean dairy industry and provide policy-makers with a global overview of the contribution of this sector to global warming, which could help to develop mitigation strategies at the national level. Specific research-based CH4 EFs are required to define a specific Ym (%) value for each feeding system in the dairy production system. In addition, the national livestock statistics and feed quality data should be improved, which would enhance the quality and the availability of activity data used as inputs in the Tier 2 approach. These improvements could include the use of more subcategories in national statistics, such as dry cows, pregnant heifers, and female calves, and build a DE (%) database specific to each feed ingredient.

3.5. Emission Factor Uncertainty

Generating EFs using the Tier 2 methodology may be limited by the availability and quality of data and carries a certain level of uncertainty [30]. The IPCC recommends that an uncertainty analysis should be conducted at the 95% confidence interval for establishing GHG inventories and the EFs of livestock production. There are many uncertainties in the enteric CH4 generated from the Tier 1 approach compared to values generated from the Tier 2 approach because the results are based on default values [6]. Penman et al. [31] reported that EFs calculated using the Tier 1 approach might be as uncertain as ±50%. The uncertainty using the Tier 2 approach was dependent on the accuracy of input data required to calculate enteric CH4 EFs such as livestock characterization, milk production, and the feeding system. The present study was subject to limitations such as gaps in the BW and ADG data in each subcategory, in addition to the determination of the DE (%) of feed. These data gaps contribute to the uncertainty in estimated EFs. Therefore, an uncertainty analysis of the CH4 EFs from enteric fermentation is difficult to be implemented because of the limited data availability, with much of the input data represented by single values, and a lack of available expert judgment. Studies to evaluate the enteric CH4 EF uncertainties are needed in the future.

4. Conclusions

Country-specific CH4 EFs for the enteric fermentation of dairy cattle were developed using the 2019 IPCC Tier 2 approach, and the carbon flux from CH4 emission variations across districts was determined for the ROK. The EFs of the three main subcategories, animals aged > 2 years, animals aged 1–2 years, and growing animals aged < 1 year, were 139, 83, and 33 kg CH4/head/year, respectively. The IPCC Tier 2 methodology is recommended instead of IPCC Tier 1 in estimating the CH4 EF for enteric fermentation of dairy cattle because it can cover specific EFs for different dairy cattle subcategories (milking cows, heifers, and growing animals), which can increase the accuracy of the GHG inventory. In this essence, improving activity data compilation is a key factor for producing more accurate country-specific emission factors. The outputs of this study will be useful for the preparation of future national GHG inventories. Specific CH4 EFs by region and feeding system considering different Ym (%) values are needed to improve the accuracy of the EFs.

Author Contributions

Conceptualization, R.I. and K.-H.K.; methodology, R.I., T.-H.K. and K.-H.K.; validation, R.I. and T.-H.K.; formal analysis, R.B., H.-J.L., Y.-K.L. and N.-Y.K.; investigation, R.I. and T.-H.K.; data curation, R.I. and T.-H.K.; writing—original draft preparation, R.I.; writing—review and editing, R.I. and K.-H.K.; supervision, K.-H.K.; project administration, K.-H.K. All authors have read and agreed to the published version of the manuscript.

Funding

This research was funded by the National Institute of Animal Sciences, Rural Development Administration, Republic of Korea, research project number “PJ0149402021”.

Institutional Review Board Statement

Not applicable.

Informed Consent Statement

Not applicable.

Data Availability Statement

No data were deposited in an official repository.

Conflicts of Interest

The authors declare no conflict of interest.

References

  1. Gornall, J.; Betts, R.; Burke, E.; Clark, R.; Camp, J.; Willett, K.; Wiltshire, A. Implications of climate change for agricultural productivity in the early twenty-first century. Philos. Trans. R. Soc. B Biol. Sci. 2010, 365, 2973–2989. [Google Scholar] [CrossRef] [PubMed]
  2. Opio, C.; Gerber, P.; Steinfeld, H. Livestock and the environment: Addressing the consequences of livestock sector growth. Adv. Anim. Biosci. 2011, 2, 601. [Google Scholar] [CrossRef]
  3. Rojas-Downing, M.M.; Nejadhashemi, A.P.; Harrigan, T.; Woznicki, S.A. Climate change and livestock: Impacts, adaptation, and mitigation. Clim. Risk Manag. 2017, 16, 145–163. [Google Scholar] [CrossRef]
  4. Steinfeld, H.; Henderson, B.; Mottet, A.; Opio, C.; Dijkman, J.; Falcucci, A.; Tempio, G. Tackling Climate Change Through Livestock: A Global Assessment of Emissions and Mitigation Opportunities; Food and Agriculture Organization of the United Nations (FAO): Rome, Italy, 2013; ISBN 925107920X. [Google Scholar]
  5. Knapp, J.R.; Laur, G.L.; Vadas, P.A.; Weiss, W.P.; Tricarico, J.M. Invited review: Enteric methane in dairy cattle production: Quantifying the opportunities and impact of reducing emissions. J. Dairy Sci. 2014, 97, 3231–3261. [Google Scholar] [CrossRef] [Green Version]
  6. Intergovernmental Panel on Climate Change. 2019 Refinement to the 2006 IPCC Guidelines for National Greenhouse Gas Inventories; Intergovernmental Panel on Climate Change: Kanagawa, Japan, 2019. [Google Scholar]
  7. Intergovernmental Panel on Climate Change. Guidelines for national greenhouse gas inventories. general guidance and reporting. In IPCC National Greenhouse Gas Inventories Programme; Eggleston, H.S., Buendia, L., Miwa, K., Ngara, T., Tanabe, K., Eds.; Institute for Global Environmental Strategies: Hayama, Japan, 2006; Volume 1. [Google Scholar]
  8. Ha, S.; Tae, S.; Kim, R. A study on the limitations of South Korea′s National Roadmap for Greenhouse Gas Reduction by 2030 and suggestions for improvement. Sustainability 2019, 11, 3969. [Google Scholar] [CrossRef] [Green Version]
  9. Greenhouse gas inventory report (GIR) of Korea. Fourth National Communication of the Republic of Korea under the United Nations Framework Convention on Climate Change; Greenhouse Gas Inventory and Research Center: Seoul, Korea, 2019; Volume 1, pp. 23–24. [Google Scholar]
  10. Corazzin, M.; Schermer, M.; Park, S.-Y. Tools to retain added value in dairy farms: The South Korea case. J. Asian Rural. Stud. 2017, 1, 81–96. [Google Scholar] [CrossRef] [Green Version]
  11. The International Committee for Animal Recording Biennial Statistics of Cow Milk, Sheep MILK and Beef Recording: Yearly Survey on the Situation of Milk Recording Systems in ICAR Member Countries for Cow, Sheep and Goats 2021. Available online: www.icar.org (accessed on 3 March 2021).
  12. Greenhouse gas inventory report (GIR) of Korea. Korea’s third national communication under the United Nations Framework Convention on climate change: Low carbon, green growth. Greenh. Gas Invent. Res. Cent. 2012, 1, 1–200. Available online: https://unfccc.int/resource/docs/natc/kornc3.pdf (accessed on 3 March 2021).
  13. Ominski, K.H.; Boadi, D.A.; Wittenberg, K.M.; Fulawka, D.L.; Basarab, J.A. Estimates of enteric methane emissions from cattle in Canada using the IPCC Tier-2 methodology. Can. J. Anim. Sci. 2007, 87, 459–467. [Google Scholar] [CrossRef]
  14. Wilkes, A.; Dijk, S. Tier 2 Inventory Approaches in the Livestock Sector: A Collection of Agricultural Greenhouse Gas Inventory Practices; CGIAR Research Program on Climate Change, Agriculture and Food Security (CCAFS): Wageningen, The Netherlands, 2018. [Google Scholar]
  15. Tongwane, M.I.; Moeletsi, M.E. Emission factors and carbon emissions of methane from enteric fermentation of cattle produced under different management systems in South Africa. J. Clean. Prod. 2020, 265, 121931. [Google Scholar] [CrossRef]
  16. Breiman, L. Random forests. Mach. Learn. 2001, 45, 5–32. [Google Scholar] [CrossRef] [Green Version]
  17. KOSTAT. Livestock Statistics Survey. 2019. Available online: http://kostat.go.kr/portal/eng/surveyOutline/1/10/index.static (accessed on 12 October 2020).
  18. Rural Development Administration. Korean Feeding Standards for Dairy Cattle, 3rd ed.; National Institute of Animal Science, Rural Development Administration (RDA): Suwon, Korea, 2017; Available online: http://lib.rda.go.kr/search/searchDetail.do?ctrl=000000217076&marcType=m&lang=kor&loca=rda00001&sysDiv=TOT&siteCode=home&sMenu=3010&paramStrlink=siteCode%3dhome%26amp%3bamp%3bsType%3dKWRD%26amp%3bamp%3bq%3d%25EA%25B0%2580%25EC%25B6%2595%25EC%2582%25AC%25EC%2596%2591%25ED%2591%259C%25EC%25A4%2580%26amp%3bamp%3bsysDiv%3dTOT%26amp%3bamp%3bnDt%3d%26amp%3bamp%3bsi%3dTOTAL%26amp%3bamp%3bloca%3drda00001%26amp%3bamp%3bsMenu%3dnull (accessed on 8 January 2021).
  19. Jones, C.; Heinrichs, A.J. Customized Dairy Heifer Growth Chart; Penn State University: State College, PA, USA, 2016. [Google Scholar]
  20. Nonghyup. Nonghyup (NH) Dairy Farm Association: Inquiry of Verification Score by Farm: NongHyup Agribusiness Group Inc (NH), Korea. 2019. Available online: www.dcic.co.kr (accessed on 15 November 2019).
  21. National Research Council. Nutrient Requirements of Dairy Cattle: 2001; National Academies Press: Washington, DC, USA, 2001; ISBN 0309069971. [Google Scholar]
  22. Intergovernmental Panel on Climate Change. Intergovernmental Panel on Climate Change/Organization for Economic Cooperation and Development) Guidelines for National Greenhouse Gas Inventories; OECD/OCDE: Paris, France, 1997. [Google Scholar]
  23. Koch, J.; Dayan, U.; Mey-Marom, A. Inventory of emissions of greenhouse gases in Israel. Water. Air. Soil Pollut. 2000, 123, 259–271. [Google Scholar] [CrossRef]
  24. Greenhouse Gas Inventory Report of Sweden. National Inventory Report Sweden 2019; Environmental Protection Agency: Stockholm, Sweden, 2019; Volume 5, pp. 314–346. Available online: https://www.naturvardsverket.se/upload/miljoarbete-i-samhallet/internationellt-miljoarbete/miljokonventioner/FN/nir-sub-15-april.pdf (accessed on 4 April 2021).
  25. O′Brien, D.; Shalloo, L. A Review of Livestock Methane Emission Factors EPA Research Report. 2019, 1–62.
  26. Aljaloud, A.A.; Yan, T.; Abdukader, A.M. Development of a national methane emission inventory for domestic livestock in Saudi Arabia. Anim. Feed Sci. Technol. 2011, 166, 619–627. [Google Scholar] [CrossRef]
  27. Greenhouse gas inventory report of Japan. National greenhouse gas inventory report of Japan. Cent. Glob. Environ. Res. 2019, 5, 1–63. Available online: https://www.env.go.jp/earth/ondanka/ghg-mrv/unfccc/NIR-JPN-2019-v3.0.pdf (accessed on 4 April 2021).
  28. Ibidhi, R.; Calsamiglia, S. Carbon footprint assessment of Spanish dairy dattle farms: Effectiveness of dietary and farm management practices as a mitigation strategy. Animals 2020, 10, 2083. [Google Scholar] [CrossRef] [PubMed]
  29. Parra, A.S.; Mora-Delgado, J. Emission factors estimated from enteric methane of dairy cattle in Andean zone using the IPCC Tier-2 methodology. Agrofor. Syst. 2019, 93, 783–791. [Google Scholar] [CrossRef]
  30. Kouazounde, J.B.; Gbenou, J.D.; Babatounde, S.; Srivastava, N.; Eggleston, S.H.; Antwi, C.; Baah, J.; McAllister, T.A. Development of methane emission factors for enteric fermentation in cattle from Benin using IPCC Tier 2 methodology. Animal 2015, 9, 526–533. [Google Scholar] [CrossRef] [PubMed] [Green Version]
  31. Penman, J.; Kruger, D.; Galbally, I.E.; Hiraishi, T.; Nyenzi, B.; Emmanuel, S.; Buendia, L.; Hoppaus, R.; Martinsen, T.; Meijer, J. Good Practice Guidance and Uncertainty Management in National Greenhouse Gas Inventories; Intergovernmental Panel on Climate Change: Kanagawa, Japan, 2000. [Google Scholar]
Figure 1. Flow chart presenting the calculation of enteric methane emission factors for dairy cattle using the IPCC [6] Tier 2 approach. NE, net energy; GE, gross energy; CH4, methane; CH4-E, energy emitted by methane.
Sustainability 13 09133 g001
Figure 2. Flowchart of the feed digestibility assumption. The TDN (%) and DMI (kg) were obtained from RDA [18]. TDN, total digestible nutrients; DMI, dry matter intake; DE, digestibility; GE, gross energy.
Sustainability 13 09133 g002
Figure 3. A decision forest tree indicating the importance of input parameters used in the Tier 2 approach to estimate the enteric methane emission factor in milk cows (animals > 2 years). % IncMSE, increase in the mean square error in terms of percentage; IncNodePurity, increase in the mean square error in terms of quality.
Sustainability 13 09133 g003
Figure 4. The dairy cattle numbers and enteric methane emission fluxes from dairy cattle (ton/year) at the provincial level.
Sustainability 13 09133 g004
Table 1. Input parameters used to estimate CH4 emission factors from enteric fermentation in dairy cattle subcategories using the 2019 refined 2006 IPCC Tier 2 methodology and their reference sources.
ParameterSymbolUnitSubcategoriesReference
<1 Year1–2 Years>2 Years
Net energy for maintenance
Body weightBWkg167473650RDA [18]
Jones and Heinrichs [19]
Maintenance coefficientCfiMJ day/kg0.0770.0770.093IPCC [6]
Net energy for lactation
Milk yield-kg/305 days--10517NH [20]
Milk yield-kg/head/day--28.8NH [20]
Milk fat content-%--3.9NH [20]
Net energy for growth
Average daily gainADGkg/day0.790.660RDA [18]
Mature body weightMBWkg680680680RDA [18]
Net energy for pregnancy
Pregnancy coefficientCp%--0.10IPCC [6]
Feeding system
Total digestible nutrientsTDN%64.757.873RDA [18]
Dry matter intakeDMIkg/day4.111.022.0RDA [18]
Methane conversion rateYm%6.36.35.8IPCC [6]
Table 2. Estimated net energy requirements, feed digestibility, gross energy intake, and enteric CH4 emission factors by dairy cattle subcategory.
ParameterAnimal Subcategories
<1 Year1–2 Years>2 Years
NEm (MJ/day)1532.749.7
NEg (MJ/day)712.6-
NEl (MJ/day)--87.3
NEp (MJ/day)--5
REM (%)0.510.480.54
REG (%)0.310.26-
DE (%)64.457.672.7
GEI (MJ/day)81201365
CH4 EF (kg/head per year)3383139
NEm, net energy for maintenance; NEg, net energy for growth; NEl, net energy for lactation; NEp, net energy required for pregnancy; REM, ratio of net energy available in a diet for maintenance to digestible energy consumed; REG, ratio of net energy available for growth in a diet to digestible energy consumed; GEI, gross energy intake; DE, digestible energy; CH4, methane; EF, emission factor.
Table 3. Comparison of enteric CH4 emission factors generated from this study with emission factors from previous IPCC emission factor estimation approaches.
ApproachEnteric CH4 EF (kg CH4/Head/Year)
<1 Year1–2 Years>2 Years
IPCC [22], Tier 1--118
IPCC [7], Tier 1--128
IPCC [6], Tier 1--138
IPCC [6], Tier 23383139
EF, emission factor; CH4, methane; IPCC, Intergovernmental Panel on Climate Change.
Publisher’s Note: MDPI stays neutral with regard to jurisdictional claims in published maps and institutional affiliations.