Usability of Visual Analogue Scales in Assessing Human Perception of Sound with University Students Using a Web-Based Tablet Interface


Abstract
:1. Introduction
1.1. Background
1.2. Literature Review
1.3. Research Objectives
2. Methods
2.1. Participants
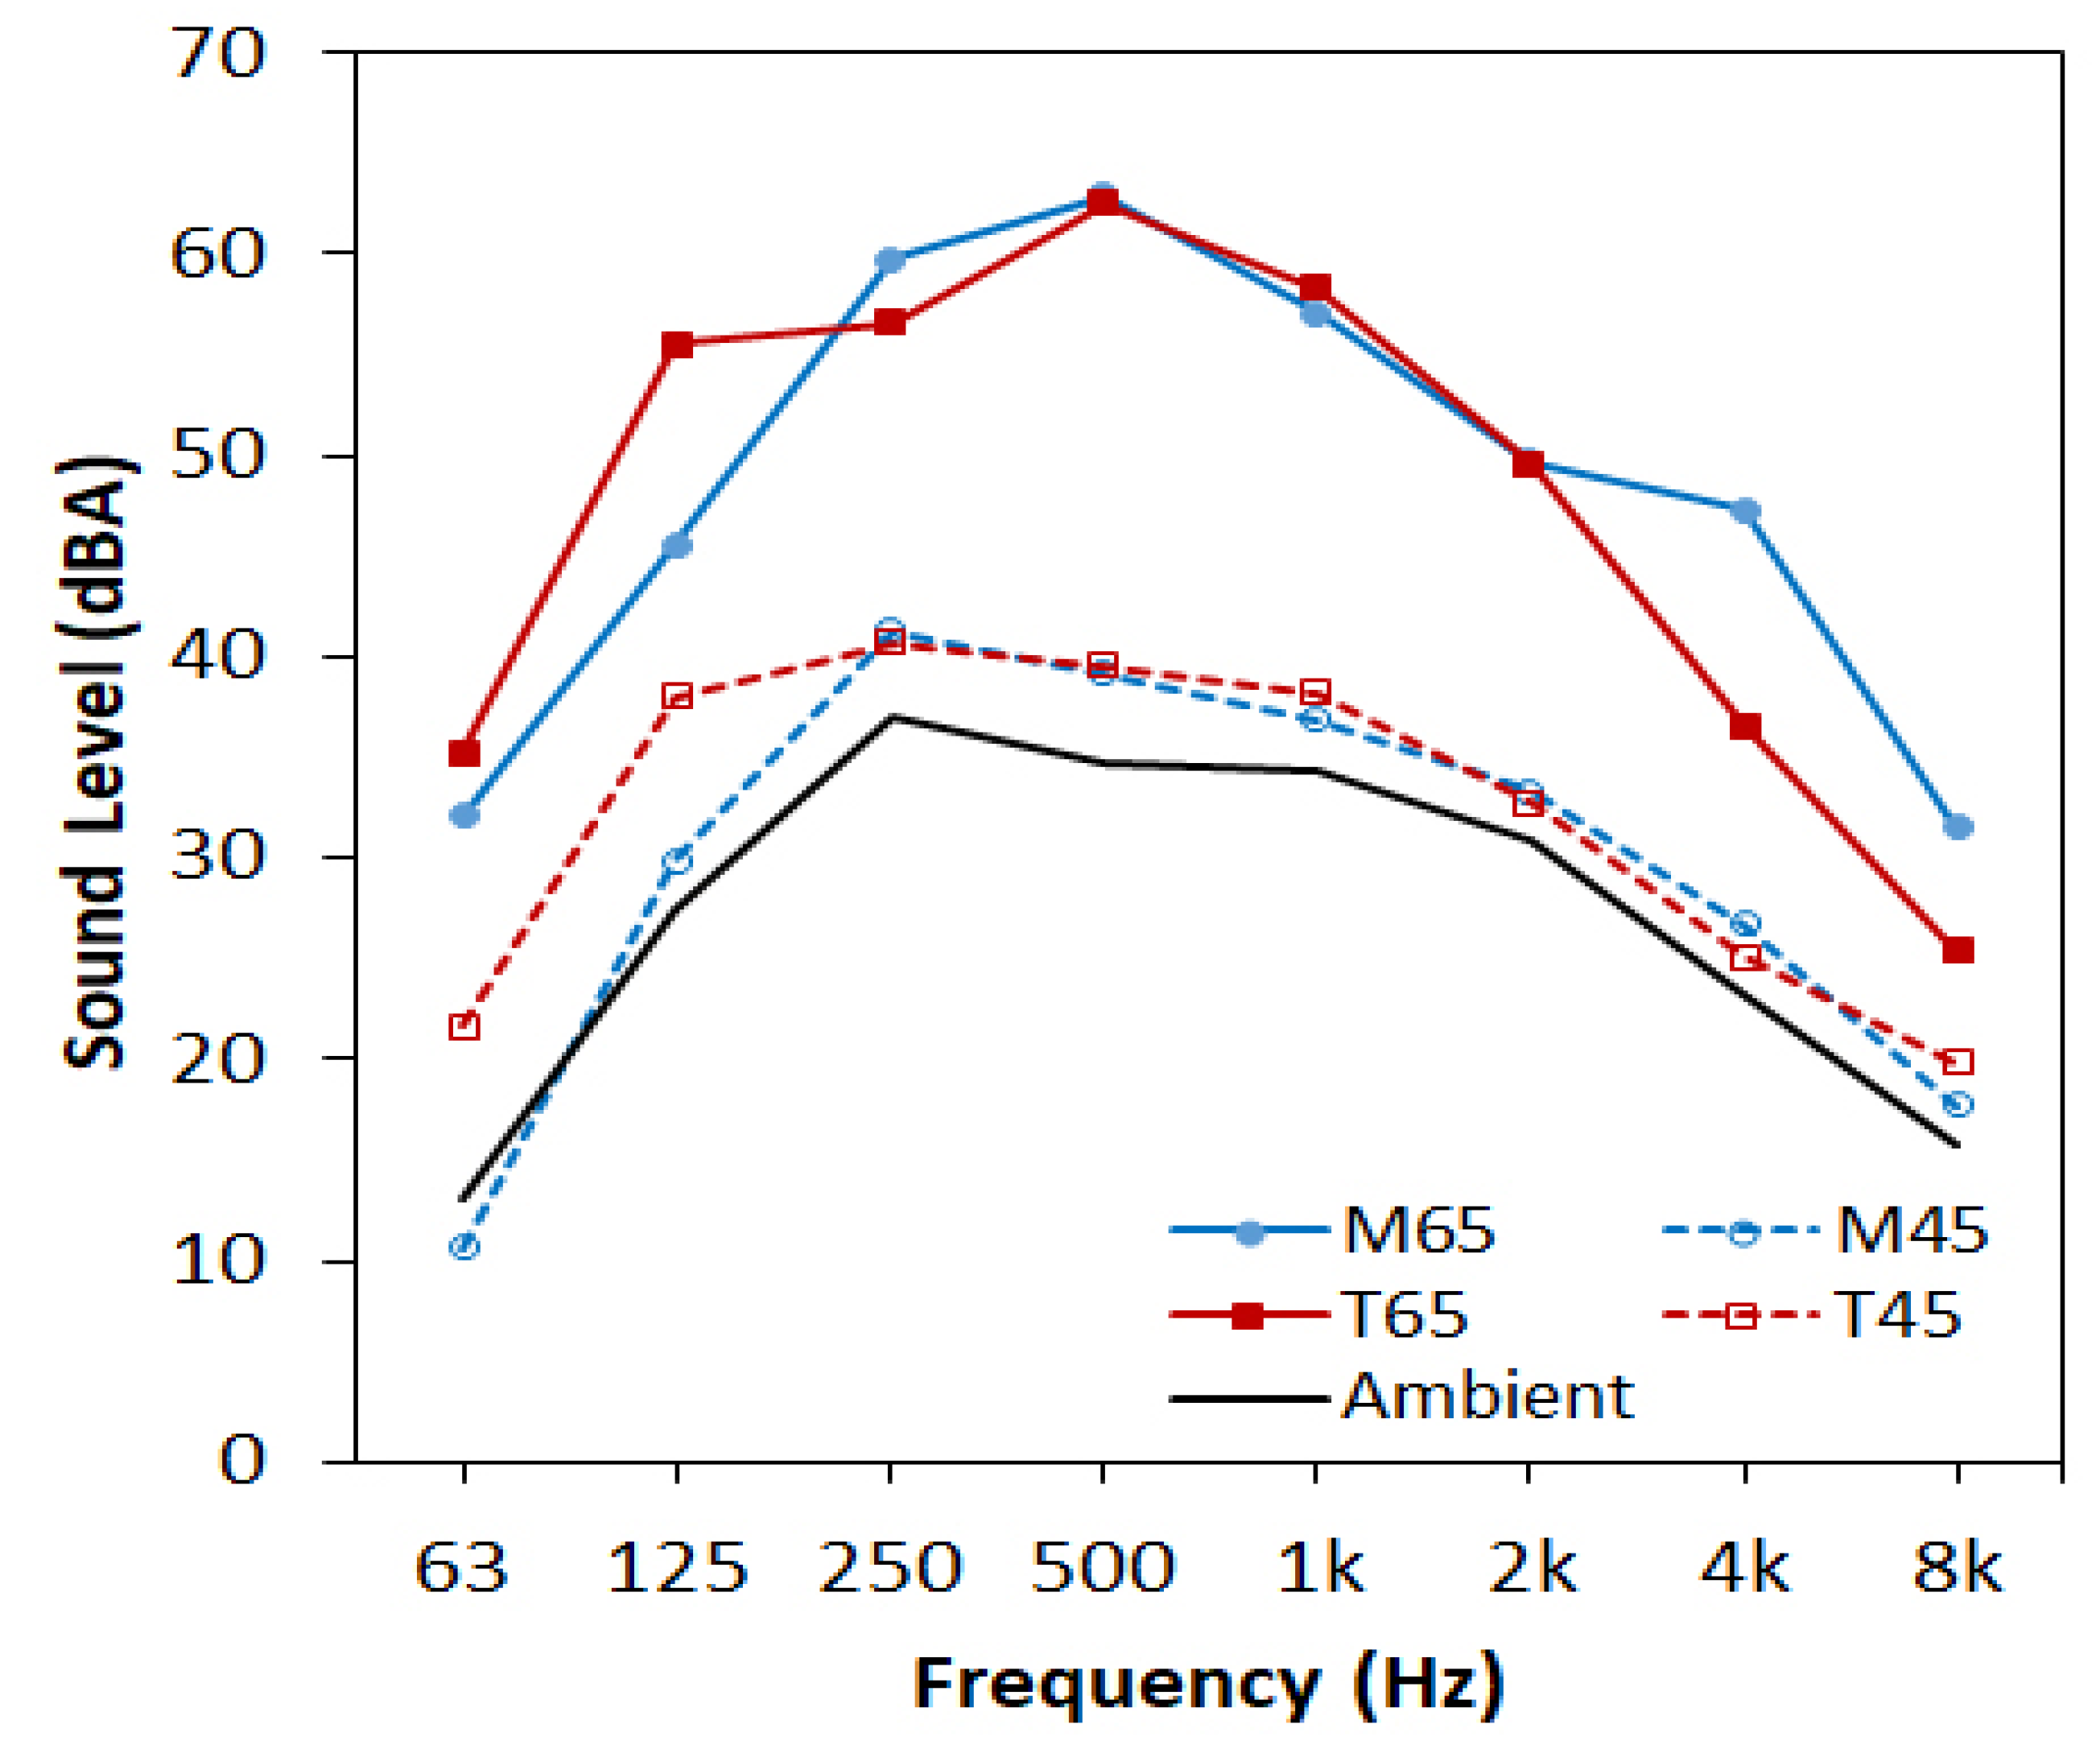
2.2. Experimental Conditions
2.3. Response Scales and Semantic Adjectives
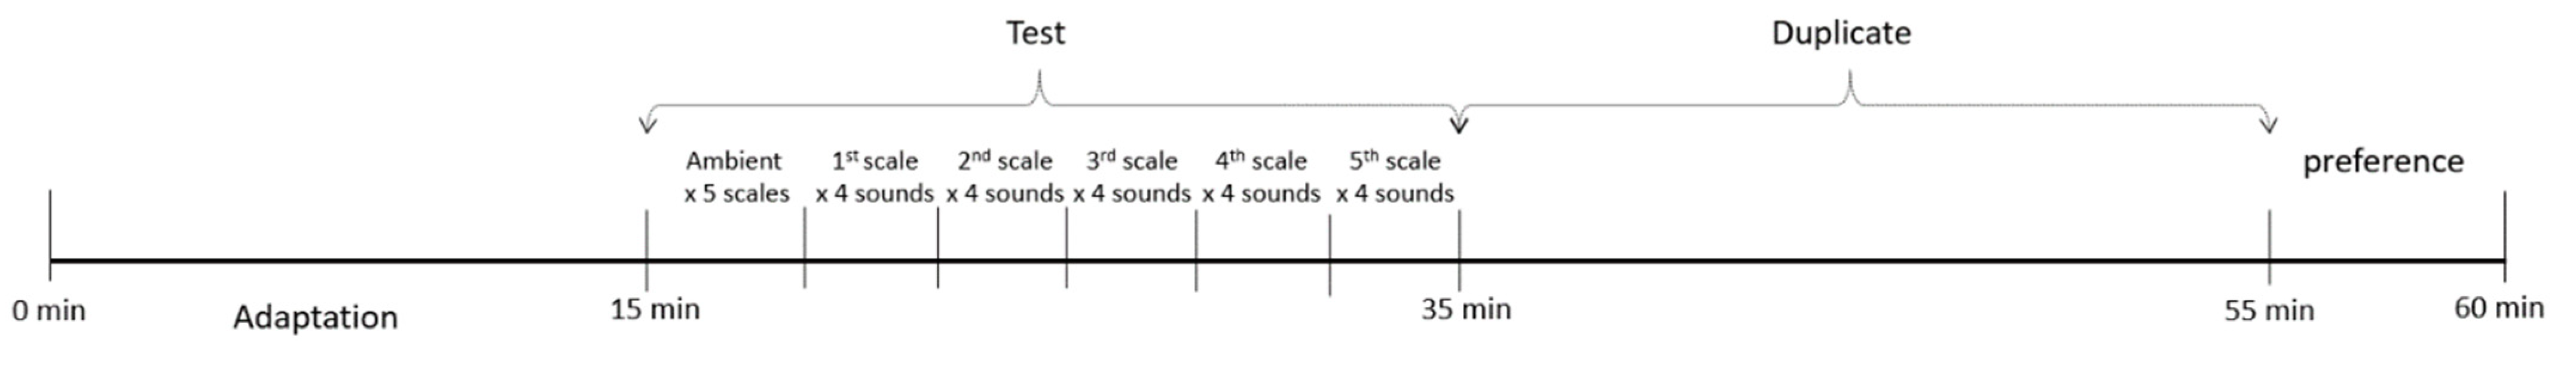
2.4. Experimental Design and Procedure
3. Results
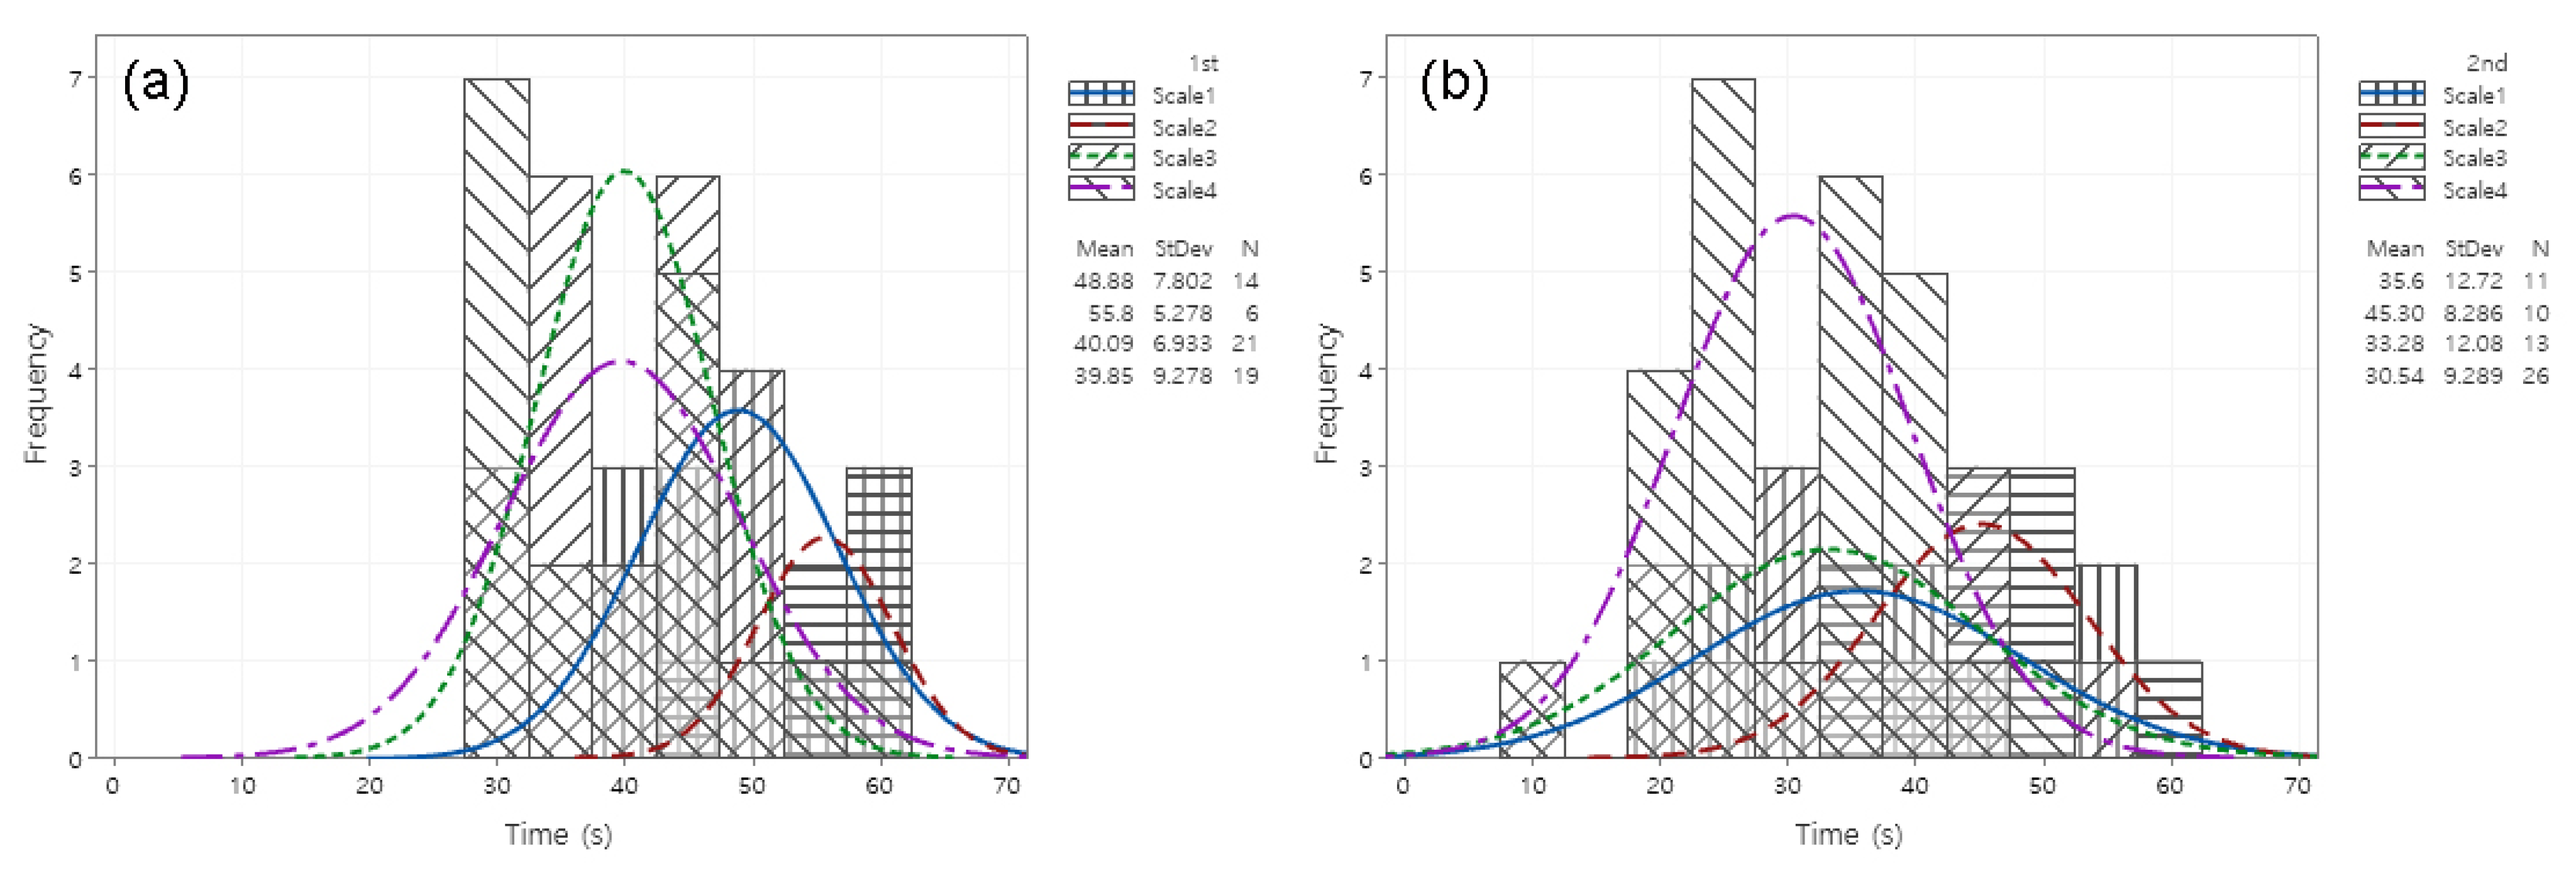
3.1. Response Times
3.2. Data Normalisation
3.3. Repeated Measures ANOVA
3.4. Correlation Coefficients and Fisher’s Z-Transformation
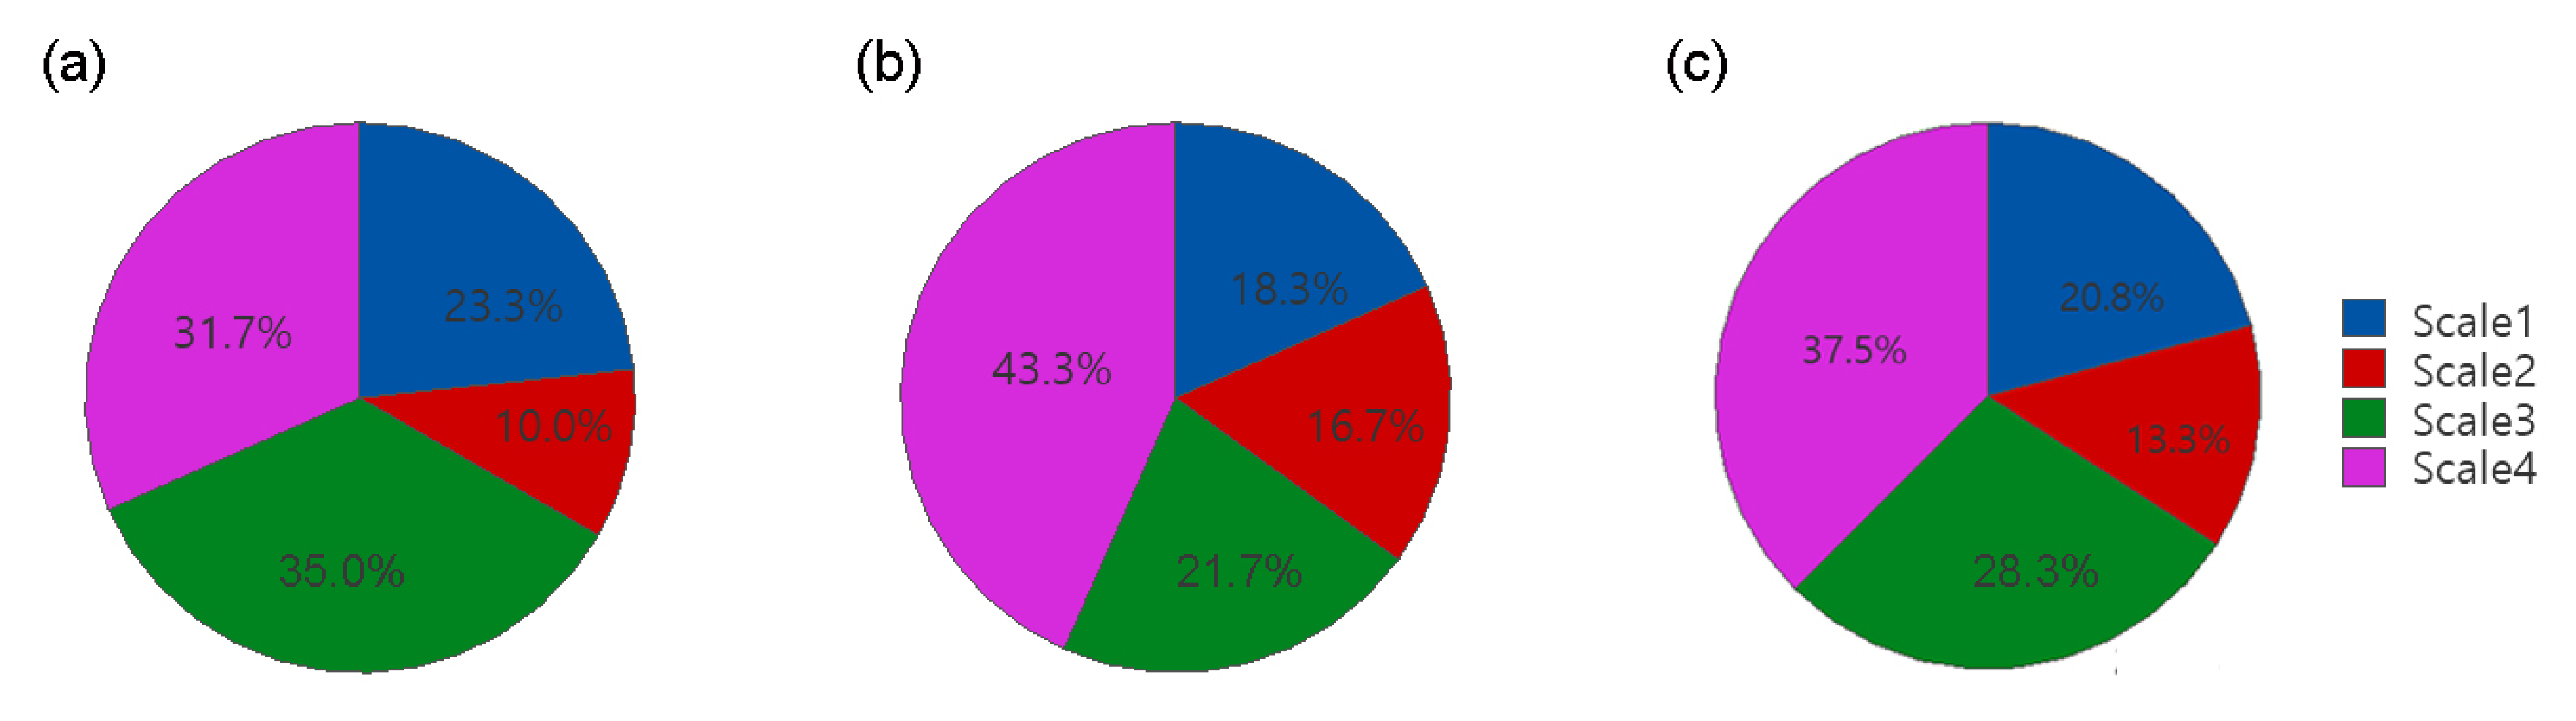
3.5. Respondents’ Preference
4. Discussion
4.1. Reliability over Repeated Measures
4.2. Sensitivity for Degree of Differentiation in Auditory Perception
4.3. Preference by Young Adults as Mobile Users
4.4. Numerical Scale vs. VAS: Types of Response Scale
4.5. Unipolar vs. Bipolar: Polarity of Response Scale
4.6. Negation and Reversal Labels
5. Conclusions
Author Contributions
Funding
Institutional Review Board Statement
Informed Consent Statement
Data Availability Statement
Acknowledgments
Conflicts of Interest
References
- DeCastellarnau, A. A classification of response scale characteristics that affect data quality: A literature review. Qual. Quant. 2018, 52, 1523–1559. [Google Scholar] [CrossRef] [PubMed]
- Wetzel, E.; Greiff, S. The world beyond rating scales. Eur. J. Psychol. Assess. 2018, 34, 1–5. [Google Scholar] [CrossRef]
- Fields, J.M.; De Jong, R.G.; Gjestland, T.; Flindell, I.H.; Job, R.F.S.; Kurra, S.; Lercher, P.; Vallet, M.; Yano, T.; Guski, R.; et al. Standardized general-purpose noise reaction questions for community noise surveys: Research and a recommendation. J. Sound Vib. 2001, 242, 641–679. [Google Scholar] [CrossRef] [Green Version]
- ISO/TS 15666: 2021. Acoustics—Assessment of Noise Annoyance by Means of Social and Socio-Acoustic Surveys; International Organization for Standardization: Geneva, Switzerland, 2021; Volume 15666. [Google Scholar]
- ISO 12913-1: 2014. Acoustics-Soundscape-Part 1: Definition and Conceptual Framework; International Organization for Standardization: Geneva, Switzerland, 2014. [Google Scholar]
- ISO/TS 12913-2: 2018. Acoustics-Soundscape-Part 2: Methodsand Measurements; International Organization for Standardization: Geneva, Switzerland, 2014. [Google Scholar]
- Bond, A.; Lader, M. The use of analogue scales in rating subjective feelings. Br. J. Med. Psychol. 1974, 47, 211–218. [Google Scholar] [CrossRef]
- Joyce, C.; Zutshi, D.; Hrubes, V.; Mason, R. Comparison of fixed interval and visual analogue scales for rating chronic pain. Eur. J. Clin. Pharmacol. 1975, 8, 415–420. [Google Scholar] [CrossRef] [PubMed]
- Seymour, R.A. The use of pain scales in assessing the efficacy of analgesics in post-operative dental pain. Eur. J. Clin. Pharmacol. 1982, 23, 441–444. [Google Scholar] [CrossRef] [PubMed]
- Guyatt, G.H.; Townsend, M.; Berman, L.B.; Keller, J.L. A comparison of Likert and visual analogue scales for measuring change in function. J. Chronic Dis. 1987, 40, 1129–1133. [Google Scholar] [CrossRef]
- Herr, K.A.; Mobily, P.R. Comparison of selected pain assessment tools for use with the elderly. Appl. Nurs. Res. 1993, 6, 39–46. [Google Scholar] [CrossRef]
- Bolognese, J.A.; Schnitzer, T.J.; Ehrich, E.W. Response relationship of VAS and Likert scales in osteoarthritis efficacy measurement. Osteoarthr. Cartil. 2003, 11, 499–507. [Google Scholar] [CrossRef] [Green Version]
- Herr, K.A.; Spratt, K.; Mobily, P.R.; Richardson, G. Pain intensity assessment in older adults: Use of experimental pain to compare psychometric properties and usability of selected pain scales with younger adults. Clin. J. Pain 2004, 20, 207–219. [Google Scholar] [CrossRef]
- Cox, J.M.; Davison, A. The visual analogue scale as a tool for self-reporting of subjective phenomena in the medical radiation sciences. Radiographer 2005, 52, 22–24. [Google Scholar] [CrossRef]
- Skovlund, E.; Bretthauer, M.; Grotmol, T.; Larsen, I.K.; Hoff, G. Sensitivity of pain rating scales in an endoscopy trial. Clin. J. Pain 2005, 21, 292–296. [Google Scholar] [CrossRef] [PubMed]
- Davey, H.M.; Barratt, A.L.; Butow, P.N.; Deeks, J.J. A one-item question with a Likert or Visual Analog Scale adequately measured current anxiety. J. Clin. Epidemiol. 2007, 60, 356–360. [Google Scholar] [CrossRef]
- Hjermstad, M.J.; Fayers, P.M.; Haugen, D.F.; Caraceni, A.; Hanks, G.W.; Loge, J.H.; Fainsinger, R.; Aass, N.; Kaasa, S. Studies comparing numerical rating scales, verbal rating scales, and visual analogue scales for assessment of pain intensity in adults: A systematic literature review. J. Pain Symptom Manag. 2011, 41, 1073–1093. [Google Scholar] [CrossRef]
- Demoly, P.; Bousquet, P.; Mesbah, K.; Bousquet, J.; Devillier, P. Visual analogue scale in patients treated for allergic rhinitis: An observational prospective study in primary care: Asthma and rhinitis. Clin. Exp. Allergy 2013, 43, 881–888. [Google Scholar] [CrossRef]
- Akad, K.; Solmaz, D.; Sari, I.; Onen, F.; Akkoc, N.; Akar, S. Performance of response scales of activity and functional measures of ankylosing spondylitis: Numerical rating scale versus visual analog scale. Rheumatol. Int. 2013, 33, 2617–2623. [Google Scholar] [CrossRef] [PubMed]
- Sayin, Y.Y.; Akyolcu, N. Comparison of pain scale preferences and pain intensity according to pain scales among turkish patients: A descriptive study. Pain Manag. Nurs. 2014, 15, 156–164. [Google Scholar] [CrossRef] [PubMed]
- Bahreini, M.; Jalili, M.; Moradi-Lakeh, M. A comparison of three self-report pain scales in adults with acute pain. J. Emerg. Med. 2015, 48, 10–18. [Google Scholar] [CrossRef]
- Voutilainen, A.; Pitkäaho, T.; Kvist, T.; Vehviläinen-Julkunen, K. How to ask about patient satisfaction? The visual analogue scale is less vulnerable to confounding factors and ceiling effect than a symmetric Likert scale. J. Adv. Nurs. 2016, 72, 946–957. [Google Scholar] [CrossRef]
- Alghadir, A.H.; Anwer, S.; Iqbal, A.; Iqbal, Z.A. Test–retest reliability, validity, and minimum detectable change of visual analog, numerical rating, and verbal rating scales for measurement of osteoarthritic knee pain. J. Pain Res. 2018, 11, 851. [Google Scholar] [CrossRef] [Green Version]
- Le May, S.; Ballard, A.; Khadra, C.; Gouin, S.; Plint, A.C.; Villeneuve, E.; Mâsse, B.; Tsze, D.S.; Neto, G.; Drendel, A.L. Comparison of the psychometric properties of 3 pain scales used in the pediatric emergency department: Visual analogue scale, faces pain scale-revised, and colour analogue scale. Pain 2018, 159, 1508–1517. [Google Scholar] [CrossRef]
- Karcioglu, O.; Topacoglu, H.; Dikme, O.; Dikme, O. A systematic review of the pain scales in adults: Which to use? Am. J. Emerg. Med. 2018, 36, 707–714. [Google Scholar] [CrossRef] [PubMed]
- Safikhani, S.; Gries, K.S.; Trudeau, J.J.; Reasner, D.; Rüdell, K.; Coons, S.J.; Bush, E.N.; Hanlon, J.; Abraham, L.; Vernon, M. Response scale selection in adult pain measures: Results from a literature review. J. Patient Rep. Outcomes 2018, 2, 1–9. [Google Scholar] [CrossRef] [PubMed]
- Elera-Fitzcarrald, C.; Vega, K.; Gamboa-Cárdenas, R.V.; Zúñiga, K.; Zevallos, F.; Reátegui-Sokolova, C.; Pastor-Asurza, C.; Perich-Campos, R.; Bellido, Z.R.; Aranow, C. Reliability of visual analog scale and numeric rating scale for the assessment of disease activity in systemic lupus erythematosus. JCR J. Clin. Rheumatol. 2020, 26, S170–S173. [Google Scholar] [CrossRef]
- Shafshak, T.S.; Elnemr, R. The visual analogue scale versus numerical rating scale in measuring pain severity and predicting disability in low back pain. J. Clin. Rheumatol. Pract. Rep. Rheum. Musculoskelet. Dis. 2020. [Google Scholar] [CrossRef]
- Turnbull, A.; Sculley, D.; Escalona-Marfil, C.; Riu-Gispert, L.; Ruiz-Moreno, J.; Gironès, X.; Coda, A. Comparison of a mobile health electronic visual analog scale app with a traditional paper visual analog scale for pain evaluation: Cross-sectional observational study. J. Med. Internet Res. 2020, 22, e18284. [Google Scholar] [CrossRef] [PubMed]
- Couper, M.P.; Tourangeau, R.; Conrad, F.G.; Singer, E. Evaluating the effectiveness of visual analog scales:A web experiment. Soc. Sci. Comput. Rev. 2006, 24, 227–245. [Google Scholar] [CrossRef]
- Reips, U.-D.; Funke, F. Interval-level measurement with visual analogue scales in Internet-based research: VAS generator. J. Behav. Res. Methods 2008, 40, 699–704. [Google Scholar] [CrossRef]
- Toepoel, V.; Funke, F. Sliders, visual analogue scales, or buttons: Influence of formats and scales in mobile and desktop surveys. Math. Popul. Stud. 2008, 40, 699–704. [Google Scholar] [CrossRef]
- Gummer, T.; Kunz, T. Using only numeric labels instead of verbal labels: Stripping rating scales to their bare minimum in web surveys. Soc. Sci. Comput. Rev. 2020. [Google Scholar] [CrossRef]
- De Bruijne, M.; Wijnant, A. Can mobile web surveys be taken on computers? A discussion on a multi-device survey design. Surv. Pract. 2013, 6, 2886. [Google Scholar] [CrossRef] [Green Version]
- Toepoel, V.; Lugtig, P. Online surveys are mixed-device surveys. Issues associated with the use of different (mobile) devices in web surveys. Methods Data Anal. 2015, 9, 8. [Google Scholar]
- Hong, J.Y.; Lam, B.; Ong, Z.-T.; Ooi, K.; Gan, W.-S.; Kang, J.; Feng, J.; Tan, S.-T. Quality assessment of acoustic environment reproduction methods for cinematic virtual reality in soundscape applications. Build. Environ. 2019, 149, 1–14. [Google Scholar] [CrossRef]
- Jo, H.I.; Jeon, J.Y. Downstairs resident classification characteristics for upstairs walking vibration noise in an apartment building under virtual reality environment. Build. Environ. 2019, 150, 21–32. [Google Scholar] [CrossRef]
- Brink, M.; Schreckenberg, D.; Vienneau, D.; Cajochen, C.; Wunderli, J.-M.; Probst-Hensch, N.; Röösli, M. Effects of scale, question location, order of response alternatives, and season on self-reported noise annoyance using ICBEN scales: A field experiment. Int. J. Environ. Res. Public Health 2016, 13, 1163. [Google Scholar] [CrossRef] [PubMed] [Green Version]
- Nguyen, T.; Yano, T.; Morihara, T.; Yokoshima, S.; Morinaga, M. Comparison of annoyance response measured with ICBEN 5-point verbal and 11-point numerical scales in Japanese and Vietnamese. In Proceedings of the 12th ICBEN Congress on Noise as a Public Health Problem, Zurich, Switzerland, 18–22 June 2017. [Google Scholar]
- Tristán-Hernández, E.; Pavón García, I.; López Navarro, J.M.; Campos-Cantón, I.; Kolosovas-Machuca, E.S. Evaluation of psychoacoustic annoyance and perception of noise annoyance inside University facilities. Int. J. Acoust. Vib 2018, 23, 3–8. [Google Scholar]
- Bjerre, L.C.; Larsen, T.M.; Sørensen, A.J.; Santurette, S.; Jeong, C.-H. On-site and laboratory evaluations of soundscape quality in recreational urban spaces. Noise Health 2017, 19, 183. [Google Scholar] [PubMed]
- Pellerin, N.; Candas, V. Effects of steady-state noise and temperature conditions on environmental perception and acceptability. Indoor Air 2004, 14, 129–136. [Google Scholar] [CrossRef] [PubMed]
- Nagano, K.; Horikoshi, T. New comfort index during combined conditions of moderate low ambient temperature and traffic noise. Energy Build. 2005, 37, 287–294. [Google Scholar] [CrossRef]
- Tiller, D.K.; Wang, L.M.; Musser, A.; Radik, M. Combined effects of noise and temperature on human comfort and performance. ASHRAE Trans. 2010, 116, 522–540. [Google Scholar]
- Hall, D.A.; Irwin, A.; Edmondson-Jones, M.; Phillips, S.; Poxon, J.E. An exploratory evaluation of perceptual, psychoacoustic and acoustical properties of urban soundscapes. Appl. Acoust. 2013, 74, 248–254. [Google Scholar] [CrossRef]
- Yang, W.; Moon, H.J.; Kim, M.-J. Combined effects of short-term noise exposure and hygrothermal conditions on indoor environmental perceptions. Indoor Built Environ. 2018, 27, 1119–1133. [Google Scholar] [CrossRef]
- Yang, W.; Moon, H.J. Cross-modal effects of noise and thermal conditions on indoor environmental perception and speech recognition. Appl. Acoust. 2018, 141, 1–8. [Google Scholar] [CrossRef]
- IOS 10551: 2019. Ergonomics of the Thermal Environment—Assessment of the Influence of the Thermal Environment Using Subjective Judgement Scales; International Organization for Standardization: Geneva, Switzerland, 2019. [Google Scholar]
- Yang, W.; Jeon, J.Y. Performance and preference of response scales for semantic differentials in auditory perception among university students. Can. Acoust. 2019, 47, 41–50. [Google Scholar]
- Yang, W.; Moon, H.J.; Jeon, J.Y. Comparison of response scales as measures of indoor environmental perception in combined thermal and acoustic conditions. Sustainability 2019, 11, 3975. [Google Scholar] [CrossRef] [Green Version]
- Chyung, S.Y.; Swanson, I.; Roberts, K.; Hankinson, A. Evidence-based survey design: The use of continuous rating scales in surveys. Perform. Improv. 2018, 57, 38–48. [Google Scholar] [CrossRef] [Green Version]
- Ma, K.W.; Wong, H.M.; Mak, C.M. A systematic review of human perceptual dimensions of sound: Meta-analysis of semantic differential method applications to indoor and outdoor sounds. Build. Environ. 2018, 133, 123–150. [Google Scholar] [CrossRef]
- Berglund, B.; Berglund, U.; Lindvall, T. Scaling loudness, noisiness, and annoyance of aircraft noise. J. Acoust. Soc. Am. 1975, 57, 930–934. [Google Scholar] [CrossRef]
- Berglund, B.; Berglund, U.; Lindvall, T. Scaling loudness, noisiness, and annoyance of community noises. J. Acoust. Soc. Am. 1976, 60, 1119–1125. [Google Scholar] [CrossRef]
- Berglund, B.; Lindvall, T. Community Noise; Center for Sensory Research: Stockholm, Sweden, 1995. [Google Scholar]
- Marquis-Favre, C.; Premat, E.; Aubrée, D. Noise and its effects–A review on qualitative aspects of sound. Part II: Noise and annoyance. Acta Acust. United Acust. 2005, 91, 626–642. [Google Scholar]
- Yang, W.; Moon, H.J. Combined effects of sound and illuminance on indoor environmental perception. Appl. Acoust. 2018, 141, 136–143. [Google Scholar] [CrossRef]
- Fanger, P.O. Thermal Comfort. Analysis and Applications in Environmental Engineering; Danish Technical Press: Copenhagen, Denmark, 1970; p. 244. [Google Scholar]
- Kooi, F.L.; Toet, A. Visual comfort of binocular and 3D displays. Displays 2004, 25, 99–108. [Google Scholar] [CrossRef]
- Arif, M.; Katafygiotou, M.; Mazroei, A.; Kaushik, A.; Elsarrag, E. Impact of indoor environmental quality on occupant well-being and comfort: A review of the literature. Int. J. Sustain. Built Environ. 2016, 5, 1–11. [Google Scholar]
- Karimipanah, T.; Awbi, H.; Sandberg, M.; Blomqvist, C. Investigation of air quality, comfort parameters and effectiveness for two floor-level air supply systems in classrooms. Build. Environ. 2007, 42, 647–655. [Google Scholar] [CrossRef]
- Weijters, B.; Geuens, M.; Schillewaert, N. The proximity effect: The role of inter-item distance on reverse-item bias. Int. J. Res. Mark. 2009, 26, 2–12. [Google Scholar] [CrossRef]
- Weijters, B.; Baumgartner, H. Misresponse to reversed and negated items in surveys: A review. J. Mark. Res. 2012, 49, 737–747. [Google Scholar] [CrossRef] [Green Version]
- Budescu, D.V.; Appelbaum, M.I. Variance stabilizing transformations and the power of the F test. J. Educ. Stat. 1981, 6, 55–74. [Google Scholar] [CrossRef]
- Box, G.E.P. Some theorems on quadratic forms applied in the study of analysis of variance problems, II. effects of inequality of variance and of correlation between errors in the two-way classification. Ann. Math. Stat. 1954, 25, 484–498. [Google Scholar] [CrossRef]
- Nielsen, J.; Levy, J. Measuring usability: Preference vs. performance. Commun. ACM 1994, 37, 66–75. [Google Scholar] [CrossRef]
- Shaki, S.; Fischer, M.H. Deconstructing spatial-numerical associations. Cognition 2018, 175, 109–113. [Google Scholar] [CrossRef]
- Cipora, K.; Haman, M.; Domahs, F.; Nuerk, H.-C. On the development of space-number relations: Linguistic and cognitive determinants, influences, and associations. Front. Psychol. 2020, 11, 182. [Google Scholar] [CrossRef] [PubMed]
- Felisatti, A.; Laubrock, J.; Shaki, S.; Fischer, M.H. A biological foundation for spatial–numerical associations: The brain's asymmetric frequency tuning. Ann. N. Y. Acad. Sci. 2020, 1477, 44–53. [Google Scholar] [CrossRef]
- Rodway, P.; Schepman, A. A leftward bias for the arrangement of consumer items that differ in attractiveness. Laterality 2020, 25, 599–619. [Google Scholar] [CrossRef]


| Order. | N | Mean (s) | Grouping |
|---|---|---|---|
| 2nd | 120 | 62.16 | A |
| 6th | 120 | 58.57 | AB |
| 5th | 120 | 52.47 | BC |
| 3rd | 120 | 50.08 | CD |
| 4th | 120 | 43.85 | DE |
| 7th | 120 | 41.84 | EF |
| 17th | 120 | 40.9 | EF |
| 14th | 120 | 40.88 | EF |
| 19th | 120 | 40.64 | EF |
| 15th | 120 | 40.23 | EFG |
| 18th | 120 | 39.31 | EFG |
| 22nd | 120 | 39.24 | EFG |
| 12th | 120 | 39.04 | EFG |
| 16th | 120 | 37.77 | EFG |
| 8th | 120 | 37.5 | EFG |
| 20th | 120 | 36.82 | EFG |
| 10th | 120 | 36.67 | EFG |
| 21st | 120 | 36.58 | EFG |
| 11th | 120 | 36.41 | EFG |
| 9th | 120 | 36.083 | FG |
| 23rd | 120 | 35.875 | FG |
| 13th | 120 | 35.55 | FG |
| 24th | 120 | 35.48 | FG |
| 25th | 120 | 32.892 | G |
| F | 25.33 | ||
| p | <0.0005 |
| N | Mean (s) | Grouping | |||
|---|---|---|---|---|---|
| Repeat | 1st | 1080 | 40.99 | A | F = 151.31 |
| 2nd | 1080 | 34.92 | B | p < 0.0005 | |
| Scale | scale 1 | 432 | 41.39 | B | F = 72.26 p < 0.0005 |
| scale 2 | 432 | 39.96 | B | ||
| scale 3 | 420 | 33.15 | C | ||
| scale 4 | 423 | 30.98 | C | ||
| scale 5 | 453 | 44.30 | A | ||
| Sound sources | T45dB | 543 | 40.93 | A | F = 10.46 p < 0.0005 |
| T65dB | 519 | 37.59 | B | ||
| M45dB | 567 | 37.06 | B | ||
| M65dB | 531 | 36.25 | B |
| Softness | Loudness | Quietness | Noisiness | Pleasantness | Annoyance | Comfort | Discomfort | |||||||||
|---|---|---|---|---|---|---|---|---|---|---|---|---|---|---|---|---|
| p | μ | p | μ | p | μ | p | μ | p | μ | p | μ | p | μ | p | μ | |
| mean | Group | mean | Group | mean | Group | mean | Group | mean | Group | mean | Group | mean | Group | mean | Group | |
| Repeat | 0.086 | 0.002 | 0.206 | 0.001 | 6.221 | 0.013 | 0.147 | 0.001 | 0.035 | 0.003 | 0.035 | 0.003 | 0.247 | 0.001 | 0.119 | 0.005 |
| 1st | 5.46 | A | 4.18 | A | 5.16 | A | 4.22 | A | 5.23 | B | 3.75 | B | 5.61 | A | 3.90 | A |
| 2nd | 5.56 | A | 4.25 | A | 5.31 | A | 4.30 | A | 5.67 | A | 3.88 | A | 5.68 | A | 3.91 | A |
| Scale | 0.000 | 0.019 | 0.560 | 0.002 | 0.000 | 0.043 | 0.199 | 0.004 | 0.000 | 0.041 | 0.000 | 0.034 | 0.000 | 0.019 | 0.011 | 0.009 |
| Scale 1 | 5.53 | A | 4.13 | A | 5.07 | BC | 4.22 | A | 5.24 | B | 3.62 | BC | 5.64 | ABC | 3.93 | AB |
| Scale 2 | 5.52 | A | 4.20 | A | 5.15 | B | 4.17 | A | 4.98 | BC | 3.59 | BC | 5.41 | B | 3.82 | AB |
| Scale 3′ | 5.74 | A | 4.26 | A | 5.61 | A | 4.39 | A | 5.67 | A | 4.33 | A | 5.85 | AB | 4.15 | A |
| Scale 4′ | 5.70 | A | 4.30 | A | 5.64 | A | 4.36 | A | 5.85 | A | 4.15 | A | 6.00 | A | 4.00 | AB |
| Scale 5 | 5.09 | B | 4.16 | A | 4.72 | C | 4.15 | A | 4.76 | C | 3.39 | C | 5.30 | C | 3.61 | B |
| Source | 0.000 | 0.707 | 0.000 | 0.833 | 0.000 | 0.762 | 0.000 | 0.774 | 0.000 | 0.447 | 0.000 | 0.511 | 0.000 | 0.542 | 0.000 | 0.542 |
| Ambient | 7.52 | B | 1.46 | D | 8.29 | A | 1.39 | E | 6.71 | B | 2.02 | D | 7.38 | B | 2.15 | D |
| T45 | 6.94 | C | 2.30 | C | 6.85 | C | 2.75 | C | 5.85 | C | 3.10 | C | 6.40 | C | 3.05 | C |
| T65 | 1.69 | E | 8.24 | A | 1.34 | E | 8.26 | A | 2.51 | E | 6.83 | A | 2.51 | E | 7.10 | A |
| M45 | 8.25 | A | 1.47 | D | 7.63 | B | 1.78 | D | 7.34 | A | 1.79 | D | 7.82 | A | 1.74 | D |
| M65 | 3.18 | D | 7.60 | B | 2.07 | D | 7.14 | B | 4.10 | D | 5.33 | B | 4.09 | D | 5.48 | B |
| Softness | Loudness | |||||||||
|---|---|---|---|---|---|---|---|---|---|---|
| Scale 1 | Scale 2 | Scale 3′ | Scale 4′ | Scale 5 | Scale 1 | Scale 2 | Scale 3′ | Scale 4′ | Scale 5 | |
| A 41 dBA | A | B | AB | AB | A | D | D | CD | CD | C |
| Music 45 dBA | A | A | A | A | A | CD | CD | D | D | C |
| Traffic 45 dBA | B | B | B | B | B | BC | B | C | C | B |
| Music 65 dBA | C | C | C | C | C | A | A | AB | B | A |
| Traffic 65 dBA | D | D | D | D | D | A | A | A | A | A |
| Quietness | Noisiness | |||||||||
| Scale 1 | Scale 2 | Scale 3′ | Scale 4′ | Scale 5 | Scale 1 | Scale 2 | Scale 3′ | Scale 4′ | Scale 5 | |
| A 41 dBA | A | A | A | A | A | C | D | D | D | D |
| Music 45 dBA | A | A | AB | AB | AB | C | D | CD | CD | D |
| Traffic 45 dBA | B | B | B | B | B | B | C | C | C | C |
| Music 65 dBA | C | C | C | C | C | A | B | AB | B | B |
| Traffic 65 dBA | C | C | D | D | C | A | A | A | A | A |
| Pleasantness | Annoyance | |||||||||
| Scale 1 | Scale 2 | Scale 3′ | Scale 4′ | Scale 5 | Scale 1 | Scale 2 | Scale 3′ | Scale 4′ | Scale 5 | |
| A 41 dBA | AB | AB | AB | AB | A | D | D | CD | CD | C |
| Music 45 dBA | A | A | A | A | A | D | D | D | D | C |
| Traffic 45 dBA | B | B | B | B | AB | C | C | C | C | C |
| Music 65 dBA | C | C | C | C | BC | B | B | B | B | B |
| Traffic 65 dBA | D | D | D | D | D | A | A | A | A | A |
| Comfort | Discomfort | |||||||||
| Scale 1 | Scale 2 | Scale 3′ | Scale 4′ | Scale 5 | Scale 1 | Scale 2 | Scale 3′ | Scale 4′ | Scale 5 | |
| A 41 dBA | AB | A | AB | AB | A | D | D | CD | CD | C |
| Music 45 dBA | A | A | A | A | AB | CD | CD | D | D | C |
| Traffic 45 dBA | B | B | B | B | B | C | C | C | C | C |
| Music 65 dBA | C | C | C | C | C | B | B | B | B | B |
| Traffic 65 dBA | D | D | D | D | D | A | A | A | A | A |
| Scale 1 | Scale 2 | Scale 3 | Scale 4 | Scale 5 | ||||||
|---|---|---|---|---|---|---|---|---|---|---|
| Softness | 0.739 | C | 0.746 | C | 0.8 | B | 0.822 | A | 0.71 | C |
| Loudness | 0.843 | B | 0.877 | A | 0.8 | C | 0.822 | BC | 0.831 | BC |
| Quietness | 0.753 | B | 0.827 | A | 0.821 | AB | 0.802 | B | 0.754 | C |
| Noisiness | 0.782 | B | 0.757 | C | 0.821 | A | 0.802 | AB | 0.824 | A |
| Pleasantness | 0.596 | C | 0.593 | C | 0.666 | B | 0.707 | A | 0.648 | B |
| Annoyance | 0.669 | B | 0.683 | B | 0.666 | B | 0.707 | B | 0.755 | A |
| Comfort | 0.653 | B | 0.673 | B | 0.701 | AB | 0.733 | A | 0.701 | AB |
| Discomfort | 0.632 | C | 0.671 | BC | 0.701 | AB | 0.733 | A | 0.693 | AB |
| Scale 1 vs. Scale 2 | Scale 3 vs. Scale 4 | Scale 5 vs. Scale 1 | ||||
|---|---|---|---|---|---|---|
| Softness | 0.850 | B | 0.882 | A | 0.796 | C |
| Loudness | 0.918 | A | 0.882 | B | 0.878 | B |
| Quietness | 0.856 | A | 0.875 | A | 0.800 | B |
| Noisiness | 0.869 | A | 0.875 | A | 0.866 | A |
| Pleasantness | 0.838 | A | 0.826 | A | 0.797 | B |
| Annoyance | 0.818 | A | 0.826 | A | 0.782 | B |
| Comfort | 0.836 | A | 0.857 | A | 0.835 | A |
| Discomfort | 0.799 | B | 0.857 | A | 0.796 | B |
| Response | 1st | 2nd |
|---|---|---|
| Pearson’s Correlation Coefficient | −0.907 | −0.796 |
Publisher’s Note: MDPI stays neutral with regard to jurisdictional claims in published maps and institutional affiliations. |
© 2021 by the authors. Licensee MDPI, Basel, Switzerland. This article is an open access article distributed under the terms and conditions of the Creative Commons Attribution (CC BY) license (https://creativecommons.org/licenses/by/4.0/).
Share and Cite
Yang, W.; Jeon, J.Y. Usability of Visual Analogue Scales in Assessing Human Perception of Sound with University Students Using a Web-Based Tablet Interface. Sustainability 2021, 13, 9207. https://doi.org/10.3390/su13169207
Yang W, Jeon JY. Usability of Visual Analogue Scales in Assessing Human Perception of Sound with University Students Using a Web-Based Tablet Interface. Sustainability. 2021; 13(16):9207. https://doi.org/10.3390/su13169207
Chicago/Turabian StyleYang, Wonyoung, and Jin Yong Jeon. 2021. "Usability of Visual Analogue Scales in Assessing Human Perception of Sound with University Students Using a Web-Based Tablet Interface" Sustainability 13, no. 16: 9207. https://doi.org/10.3390/su13169207