Article

Vulnerability of Human Populations to Contamination from Petroleum Exploitation in the Napo River Basin: An Approach for Spatially Explicit Risk Assessment

by
Carlos Iván Espinosa
1,*,
Fabián Reyes-Bueno
1,
María Isabel Ramírez
2,
Ana Paulina Arévalo
2,3,
Natalia Bailon-Moscoso
2 and
David H. Duncan
1,4
1
Departamento de Ciencias Biológicas y Agropecuarias, Universidad Técnica Particular de Loja, Loja 1101608, Ecuador
2
Facultad de Ciencias de la Salud, Universidad Técnica Particular de Loja, Loja 1101608, Ecuador
3
Doctorate Program in Science, Universidad Nacional de Educación a Distancia, Senda del Rey 9, 28040 Madrid, Spain
4
School of BioSciences, University of Melbourne, Parkville 3010, Australia
*
Author to whom correspondence should be addressed.
Sustainability 2021, 13(16), 9230; https://doi.org/10.3390/su13169230
Submission received: 30 June 2021 / Revised: 31 July 2021 / Accepted: 10 August 2021 / Published: 17 August 2021
(This article belongs to the Special Issue Sustainable Development, Environment, and Health)

Abstract

:
Background: contamination of aquatic ecosystems by oil spills associated with petroleum exploitation represents a serious problem of environmental contamination that can affect human health. We developed a spatial model of contamination risk in the Ecuadorian Amazon, and evaluated the model using independent datasets on environmental contamination and clinical indicators of human health risk factors. Methods: the spatial risk of contamination for the Napo River basin was based on the calculation of a friction surface and the accessibility of possible oil contamination. Human health was evaluated using peripheral blood samples from 256 individuals. We used monitoring data on contamination to validate the spatial model of contamination risk and analyzed whether the estimated risk explained the incidence of human health risk factors. Results: our risk model showed a significant association with actual contamination detected in the study area. According to our risk model, around 30% of the territory has some level of contamination. Risk of contamination was associated with an increasing mean incidence in risk factors for human health in resident populations, but elevated contamination risk was not a significant predictor of the incidence of selected health indicators; only the incidence of inflammation was significantly increased. Conclusions: a large proportion of the populations in the Napo River basin has high vulnerability to contamination from petroleum exploitation, and this contamination risk may be traced in some indicators of health risk. Closer examination of health risk factors is warranted, and our spatial model of contamination risk can inform the design and analysis of such studies, as well as risk mitigation and management. Our approach to building the model of contamination risk could be applied in other catchments where petroleum exploitation is contemplated.

1. Introduction

In recent decades, the increase in toxic residues in aquatic ecosystems has attracted increasing attention from researchers and politicians [1,2,3,4]. The impacts of these toxic residues on human health [5,6,7,8] and the consequences by the use and reuse of the water [6] are the main reasons for the renewed attention. Contamination of aquatic ecosystems by anthropogenic activities is varied in type and grade of impact [9], and among these activities the petroleum exploitation has shown a particularly serious impact in aquatic ecosystems. Notorious disasters such as the Gulf of Mexico in 2010 [10] evidence the environmental damage that can result from the exploration, extraction and transport of petroleum products [11]. In addition to these large spills, smaller volume oil spills can be alarmingly common and can have significant impacts in oilfield areas.
The main environmental concern for the risk of contamination from petroleum exploitation is associated with potentially dangerous compounds in oil. Among these compounds, polycyclic aromatic hydrocarbons (PAH), represent a particularly serious problem of environmental contamination [12]. Petroleum exploration and production contribute in large measure to increased concentration of PAH [13]. In oil fields, PAHs are discharged into rivers as a consequence of spills and leaks [3,11,12], and accumulate in the sediments [14,15,16,17,18]. PAHs can cause ecological and health risks because of their toxic, carcinogenic and persistent nature [19,20,21]. Studies have shown that environmental accumulation of toxic waste from petroleum exploitation can affect human health [22] and prolonged exposure has been linked to the incidence of the development of cancer [23,24,25]. Being highly lipophilic and of low solubility in water, PAHs are particularly persistent and toxic organic compounds for living organisms [26], that present a high rate of bioaccumulation in food chains [27].
Petroleum exploration, extraction, transport and processing involve an inevitable risk of contamination [28,29]. The quantity and the composition of the oil spill, as well as the size of the contamination area, determine the seriousness of the pollution [30]. In this context, the development of models that characterize the spatial distribution of risk of contamination is important to improve the management of aquatic ecosystems. Risk assessment is a systematic process that organizes the identification, description, analysis and quantification of risk associated with dangerous substances, activities or events [5]. Therefore, risk is used as a relative indicator rather than an absolute quantitative measure that describes the impact on environmental and human health [5,31].
Understanding the risk of contamination to which a land and water surface may be exposed is a challenge because of the many variables that influence the movement of contaminants in the environment [32]. It has been common to use simple proximity to known contamination sources to spatially represent the degree of exposure [33,34]. Such analyses offer the advantages of simplicity, ease of use and interpretation and rapid preparation [33], and they have formed the basis of many studies [34,35,36,37,38]. However, an analysis of risk based purely on distance has its disadvantages. Firstly, the assumption that contamination disperses in a homogenous manner from the source fails to recognize the characteristics of the contaminant and the medium through which it is dispersing. Secondly, the buffer distances used are often arbitrary and subjective, which may cause gross errors of omission or commission with respect to the distribution of contamination [33].
More complex models of contamination risk may modify the effect of distance by introducing an expected impediment to the movement of contaminants through the environment (be it soil, oceanic currents or aquatic systems). Incorporation of impediment, more often modeled as its inverse, “accessibility”, is one alternative that can reduce the arbitrariness of simpler spatial models of contamination risk. The “access” in a geographic context refers to the effort required for the transfer of an entity from an origin to a certain destination. The approach has been commonly employed in studies of equity access to infrastructure, but little conceptual adjustment is required to apply it to the dispersal of contaminants in the environment. Some studies [39,40,41] have modeled the energetic cost (effort) of the movement of petroleum contamination from wells, transfer stations and pipes, and later translated the cost into a risk surface. By integrating factors that influence spatial heterogeneity into the dispersal of contaminants, these models successfully link the greater dispersal of petroleum products through the landscape with heightened risk of exposure to contamination, [32].
This study aims to model the risk of exposure to petroleum contamination in the Napo River basin, Ecuador, as a tool to evaluate the vulnerability of human populations. Specifically, we were interested in: (i) generating a model of spatial risk to contamination by petroleum, (ii) validating the model based on independent dataset on hydrocarbon contamination in the Napo basin and (iii) determining the vulnerability of the human population to oil contamination in the Napo basin. We expected that a useful spatial model of oil contamination risk should have skill at predicting actual contamination from independent data. On the other hand, if the proposed model is correlated with the probability of contamination, we assume that the localities with the highest risk of hydrocarbon contamination must present high levels of oil toxic compounds that can affect human health. Therefore, our risk model should explain the changes in the health variables.

2. Materials and Methods

2.1. Study Area

This work was undertaken in the mid basin of the Napo River in Ecuador. This catchment comprises great ecological variation, from montane forests to Amazonian forest. The Napo River basin encompasses the provinces of Napo, Sucumbios and Orellana. Most of the territory has a hydronomic index “superhumid” and a hot thermal regime. Throughout the three provinces there are a great many water bodies and the oil wells and pipeline infrastructure of the petroleum industry generally coincide with those water bodies (Figure 1).
The Napo River basin is one of the most important in the Ecuadorian Amazon and supports a large human population (416,565 inhabitants [42]). However, the Napo is presumed to have a high level of contamination risk from petroleum exploration and exploitation. The basin has been one of the central areas of petroleum production since exploitation began in Ecuador in 1972, yielding millions of barrels of petroleum [22]. The Napo basin has the highest density of oil wells in Ecuador, with 886 oil wells distributed over 59,242 km2. Between 1972 and 2009, 740 oil spills were registered (see data in http://ide.ambiente.gob.ec/mapainteractivo/ (accessed on 29 July 2021)). The two biggest spills to date were in 1974 in the Lumbaqui parish (83,690 tons) and in 2000 in the Joya de los Sachas parish (62,528 tons, Petroecuador, Subsecretaria de Calidad Ambiental EX-DINAPAH).

2.2. Model Overview

The spatial risk of contamination by oil was defined in three phases: (i) calculation of the friction surface, (ii) analysis of accessibility to petroleum waste and (iii) contamination potential. The friction surface calculated the displacement cost of the petroleum depending on the characteristics of the landscape. The analysis of accessibility established the expected displacement pattern of potential and existing seeps and spills from wells and pipelines based on the friction values. Lastly, we determined the map of contamination risk for the region.

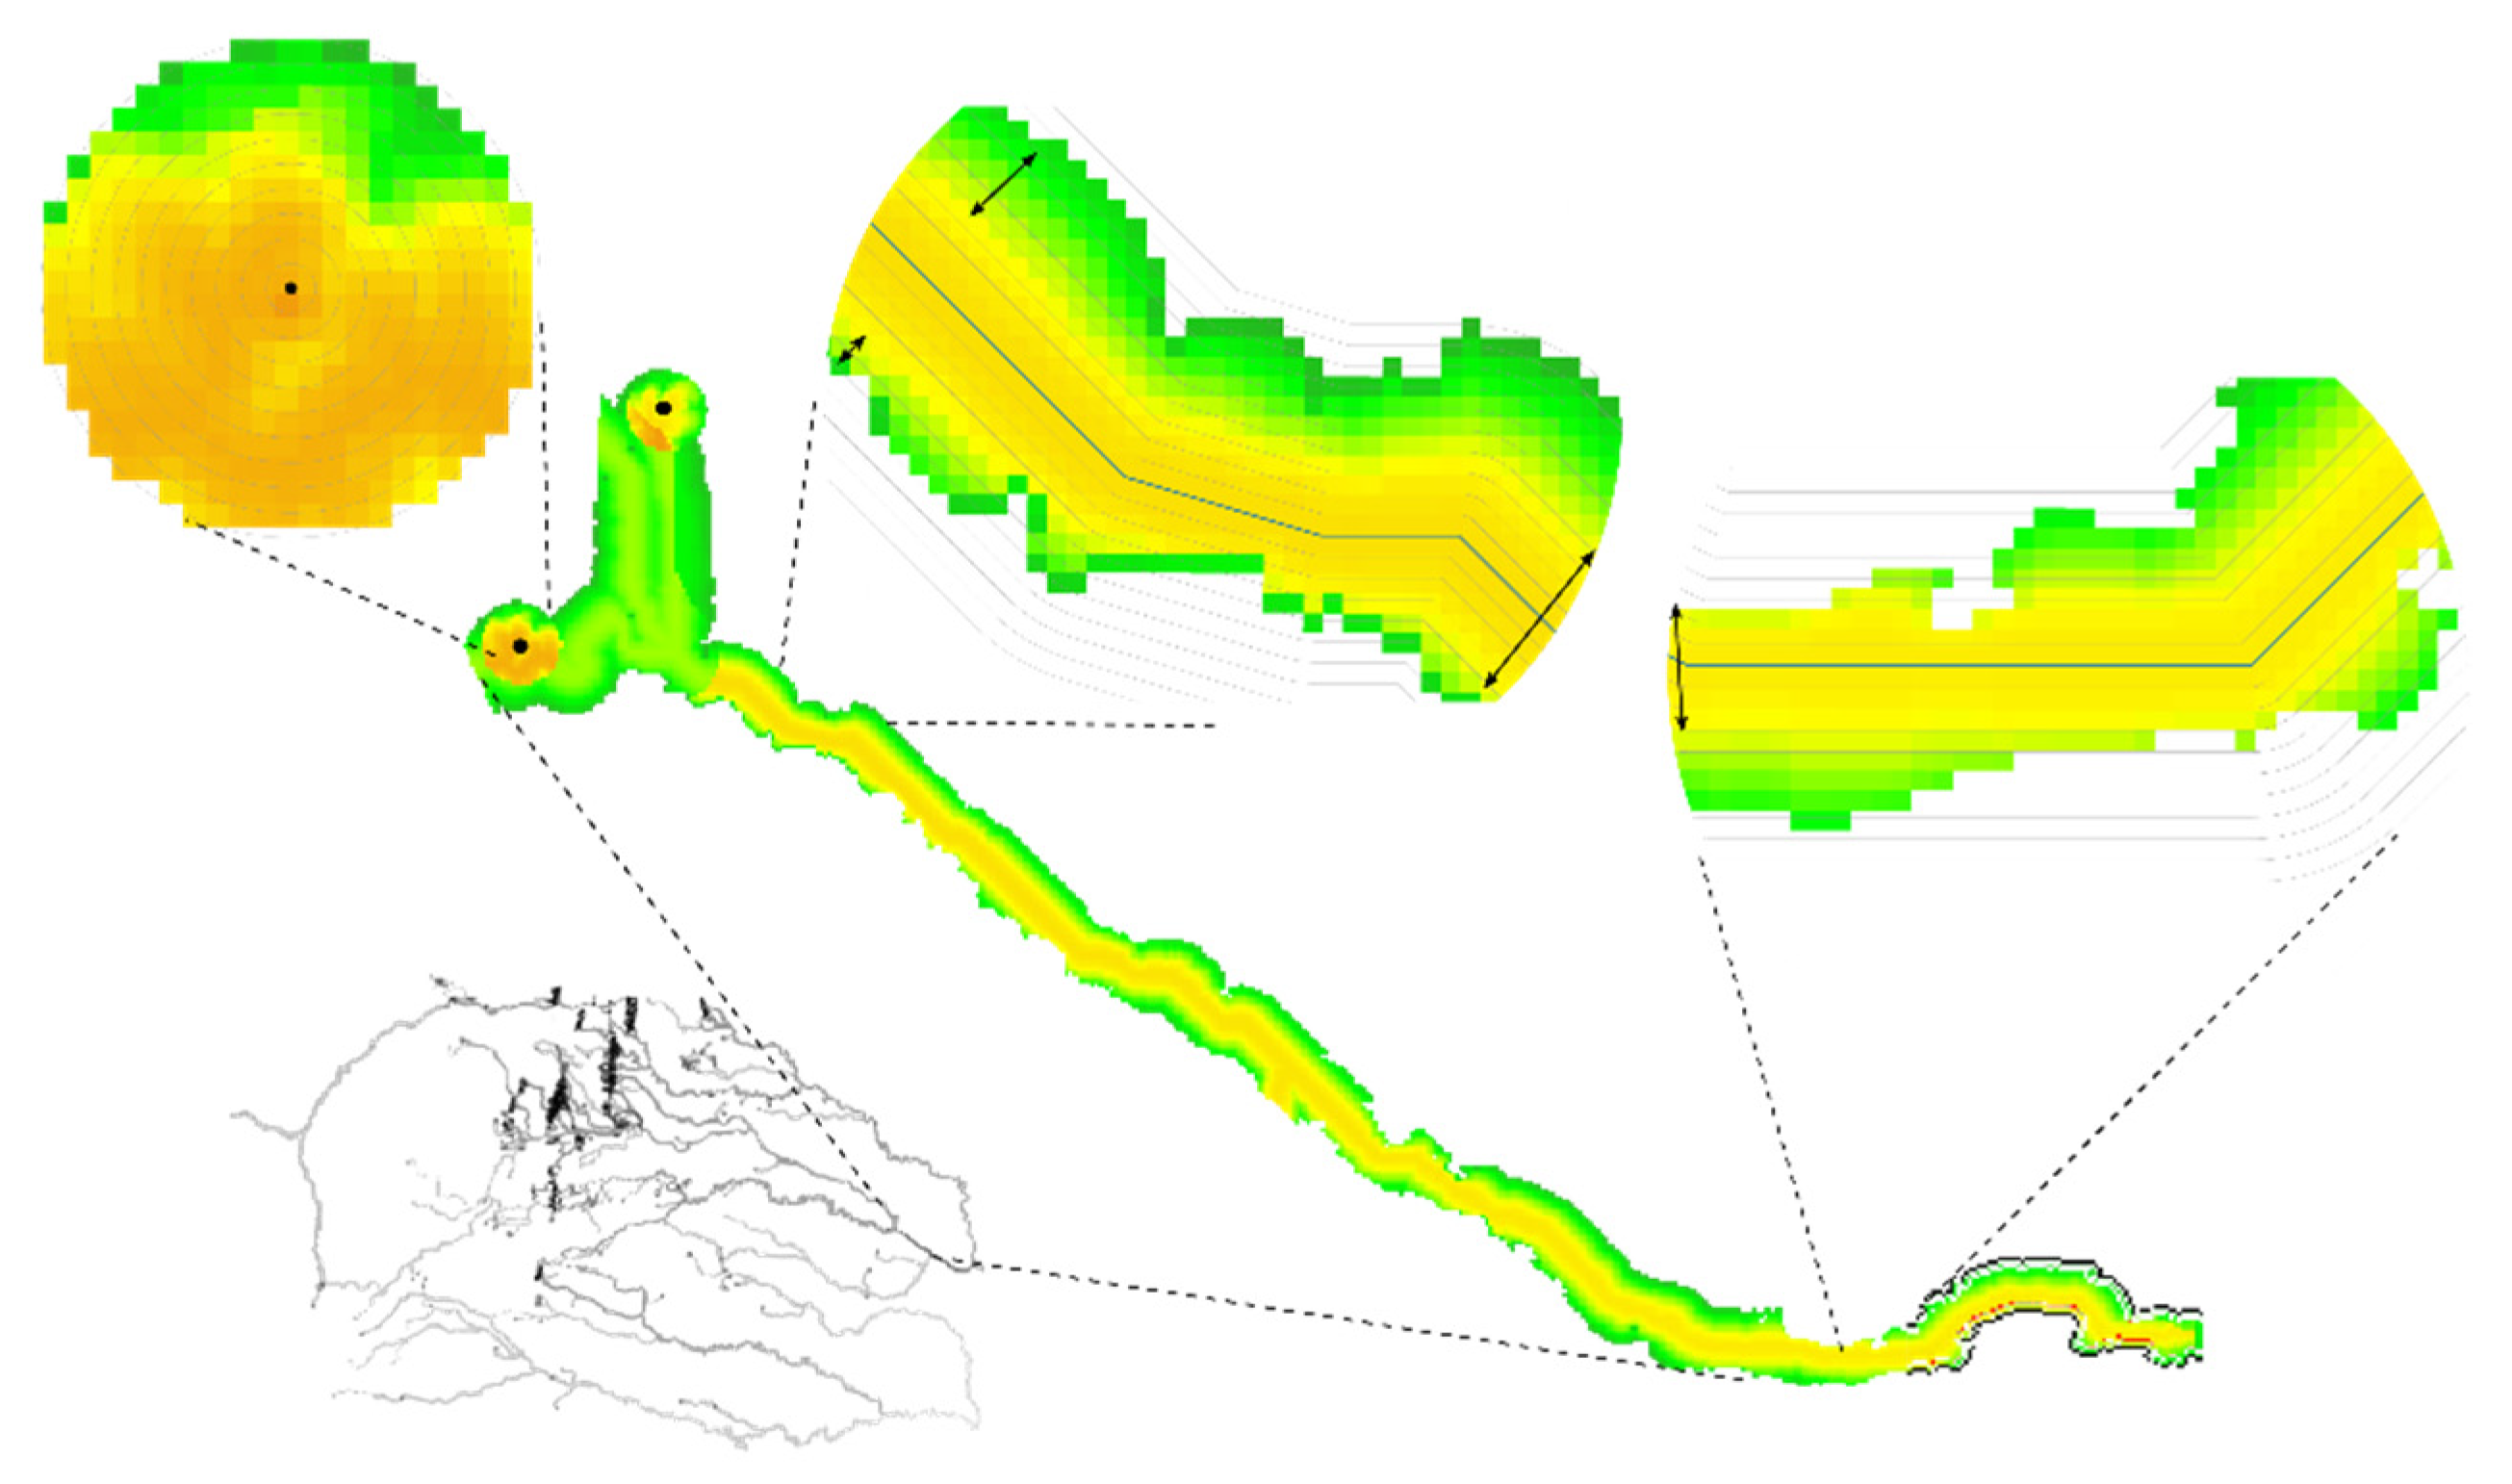
2.2.1. Calculation of the Friction Surface

We calculated a friction surface for contaminants to anticipate the ways in which they might disperse in the area surrounding a particular spill source. The pattern of dispersal was calculated differently for hydrological networks and terrestrial surfaces.
The friction surface in water was conceived as the capacity of contaminants to penetrate the hydrological network. All watercourses connected to contamination sources were selected. An initial friction variable was generated based on a slope map and a map of inundation zones (INAMHI-MAGAP). The displacement costs of contaminants from each cell were conceived as penalty according to slope (Table 1); gentle slopes present a lower access penalty compared with steeper slopes. The calculated penalties represent the inverse of those used in the method of Agüero and Pujol [43]. The data representing areas subject to inundation were rasterized, assigning the value 1 to the relevant cells. It was assumed that contaminants had an elevated degree of access to those units due to their susceptibility to inundation. The surface of the slopes and rasterized inundation data were combined with a condition operator. This operator allowed us to assign the lower values (inundation shape) to those pixels with values in the two layers. Finally, we determined the surface area that would be affected by contamination through an analysis of accessibility. In those cases, where a watercourse may have a level surface around it, or land otherwise susceptible to inundation, the maximum distance of penetration would be 1000 m.
In the case of terrestrial areas, the friction surface was calculated based on the accumulation of flow in the basin as determined from a 30 m digital elevation model [44]. The accumulation data indicated how water would run over land owing solely to slope. The areas with high values were those that would accumulate more flow, that is, where there was a higher probability of flow of water or other liquid. Given that areas upslope of wells, pipes or potential spills have lower values due to lower probability of inflow, the raster values for flow accumulation were normalized and inverted up to a radius of 1 km around each well, pipe or spill location.
The movement of water, and therefore contaminants, over or through terrain depends on factors such as vegetation cover and the slope and texture of soils. Therefore, to evaluate the surface movement of contaminants, our runoff model incorporated a classification of the land and soil following Rázuri [45]. Finally, the soil friction surface was obtained by dividing the inverted flow accumulation layer by the runoff surface.

2.2.2. Analysis of Accessibility

The accessibility analysis was undertaken for the spread of contamination from each potential source (886 wells and the system of pipelines) across the friction surfaces for land and watercourses. The movement of contaminants depended on the distance to the contamination source and the friction surface from that location.
The values for each accessibility layer were normalized between 0 and 100. Given that the environment had been conceived from the perspective of friction that limits accessibility, the cells closest to the sources of pollution had the lowest values. To consider the results from the perspective of risk of contamination, the scale was inverted such that the cells closest to sources had the value of 100, representing the highest accessibility, and the most distant cells had the value 0. Given that any given cell could be affected by one or more hypothetical sources of contamination, the spatial models of accessibility for the various sources were combined and each cell was assigned the highest value amongst the set of models.

2.2.3. Potential for Contamination

To model the pattern of contamination from recorded petroleum spill events towards watercourses and lands, we used data on the estimated volume of unrecovered spill, and the amount of time that had elapsed since the spill. The volume of spill not recovered was normalized between 0 (last volume) and 1 (most volume), and the date of the spill was codified as a value between 1 (oldest recorded) and 2 (most recent). The product of the two variables resulted in a scale where 1 represented a recent spill where a relatively large proportion of the volume was not recovered. The watercourses that could potentially be contaminated by each spill event were identified and assigned the normalized value previously described. After each implicated watercourse and drainage line was rasterized, all of the segments from each spill were summed (superimposed) to simulate the accumulation of contaminants in the drainage network within 1000 m of the spill origin. The resulting data were normalized as values between 1 and 2 before being multiplied with the accessibility data generated in the previous step.
In the final step, the rasters representing accessibility to contamination directly from wells and pipelines, via drainage networks and weighted accessibility from drainage networks (together describing latent risk), and through direct proximity to recorder spills (manifest risk) were summed to derive the final map of risk of contamination by petroleum. The resulting variable was rescaled from 0 to 1 for ease of interpretation. All spatial analyses were implemented in Qgis version 2.6.1. [46].

2.3. Model Validation

As a form of external model validation, we tested the association between the probability of contamination extracted from our spatial model of contamination risk and detected contamination data from 27 monitoring points in water sources obtained from the “Ilustre Consejo Provincial de Orellana” (see the locations of sample points in Figure 3). These points cover an area of 100 × 60 km with different levels of contamination. This province has been developing an annual program of monitoring of the levels of contamination in the Napo basin. We used information reported for the concentration of total petroleum hydrocarbons (TPH) in water and riverine sediments from the years 2012, 2013 and 2014. We evaluated the existence of contamination in six samples: three sample years (2012–2013) and two elements (water and sediment), for each monitoring point. We defined samples as contaminated when the levels of TPH were above the allowed levels of 620 mg/kg for agricultural soil and 0.5 mg/L for water (Registro oficial No. 097-A annexes 2 and 1, respectively).
We developed a test for the association between the probability of contamination predicted by our model (risk of contamination) with the probability of real contamination (detected contamination) of the water courses, the association was calculated as of Pearson’s product moment correlation coefficient.
Detected contamination was calculated as:
D c = c e / t s
where ce (contamination events) are the times in which samples showed values in excess of the permitted levels, and ts refers to the total samples available from that sample location.
The analyses were undertaken with the function “cor.test” of the “stat” package in R environment [47].

2.4. Vulnerability of Human Populations and Human Health

We determined vulnerability to contamination risk using two approaches. First, we calculated the degree to which the different land uses in the region are exposed to contamination risk. Second, we tested whether human health risk indicators that can be affected by exposure to petroleum toxic compounds were related to our risk model.
To calculate the percentage of land surface affected by different levels of contamination risk, we divided the land surface of the Napo basin into four cover types: population centers, arboriculture, pasture and crops. Additionally, we obtained the surface of up to third-level rivers in this basin. For each one of these cover types we obtained the percentage of area having low, medium or high contamination risk using cut tools of Qgis version 2.6.1. [46] We used as the land cover or river shape as the input layer and our risk contamination model thresholded as low (between 0 to 0.3), medium (>0.3 to 0.60) and high (>0.6) contamination risk as the cut layer. The percentage was calculated as the extracted area of each land use and contamination risk level divided by the total area of each land use, and multiplied by one hundred.
We calculated the health vulnerability using a case control approach, testing whether the proportion of the sample population with abnormal measures of functionality in human health was related to calculated contamination risk.
We used the thresholded contamination risk map to identify population areas to be sampled, eliminating areas where oil pollution can be confounded with other likely sources of pollution. For example, populations near large crop areas and in areas downstream of large cities were excluded to avoid confounding factors associated with pesticide exposure or organic contamination. The largest populated centers were also eliminated, because of the existence of confounding factors such as automotive or industrial pollution. We selected 26 localities from the provinces of Orellana and Sucumbios that fulfilled these requirements and that were exposed to different level of contamination according our risk model; nine localities with high risk of contamination, eight with medium risk and nine with low risk of contamination. We obtained peripheral blood samples from 256 local inhabitants. Of the samples obtained in the localities, 50% modeled as high risk, 23% as medium risk and 27% as low risk. All individuals signed prior informed consent after attending a socialization workshop. The prior informed consent was approved by the bioethics committee of the Universidad San Francisco de Quito (permit 2015-056E) and the research permit of Ministerio de Salud Pública del Ecuador (MSP-DIS-2015-0078-O). All participants filled out a survey about their alcohol and cigarette consumption and the amount of time that they had lived in that locality, factors that could influence exposure to contamination or be a confounding factor for health risk factors. We analyzed whether consumption or residence time was associated with the different levels of contamination risk as an internal control measure. Blood samples were obtained by venipuncture and stored in Vacutainer tubes with anticoagulant (EDTA) and without anticoagulant. The samples were maintained at 4 °C until laboratory analysis was performed. The different blood and biochemical parameters were determined according to standard methods, using a BC-3200 Auto Hematology Analyzer (Mindray, Shenzhen, China) and a semiautomatic analyzer Humalyzer-3000 (Wiesbanden, Germany). Anemia was determined according to WHO criteria, which defines anemia in men when hemoglobin levels are below 13.0 g/dL and in women when levels are below 12.0 g/dL. WHO also uses hemoglobin values for classification in mild, moderate and severe anemia (World Health Organization, 2011).
A normal white blood cell (WBC) count is between 4500–10,000 (µL); lower or higher values are considered altered. WBC are closely related to the human immune system which is helpful in fighting viruses and bacteria. Elevated WBC is a nonspecific marker of inflammation associated with immune system response to both acute and chronic infection and irritating and toxic exposures [48]. C-reactive protein is a liver protein that increases its concentration in the blood in inflammatory processes throughout the body. Values over 6 mg/L are considered an indicator of an inflammatory process. The determination of C Reactive Protein was made by direct latex agglutination test according to the Weiner lab technique.
Alanine aminotransferase or serum glutamic pyruvic transaminase (ALT or SGPT) and aspartate aminotransferase or serum glutamic oxaloacetic transaminase (AST or SGOT), are the common liver enzymes of liver function tests and well-known markers of liver damage. Among the liver enzymes, SGPT is the most specific marker of liver function since it is found in the cytosol of hepatocytes, while SGOT can be found in other organs such as the heart, liver, skeletal muscle, kidneys, brain, pancreas, lung, erythrocytes and leukocytes. Values above 38 and 41 U/L are considered altered in men for STGO and STGP, respectively. Values over 32 and 31 U/L are considered altered in women for STGO and STGP, respectively (Wiener Laboratorios S.A., Rosario, Argentina)
The geographic coordinates of the residence site were obtained for all participants. The risk of contamination to which a patient might be exposed was calculated from the risk model based on the location of their residence. Two measures were calculated: the point of contamination risk and the local maximum contamination risk. Point of contamination risk is the level of contamination in a pixel that coincided with their residence, while the maximum contamination risk refers to the maximum value of contamination risk in a 500 m buffer around that location. We built a double entrance table with cases and control in columns, and categories of contamination risk (low, middle and high) in rows for all health variables. Cases were the patients with abnormal levels and control all patients with normal levels of health variables. The incidence of abnormal levels was calculated as number of cases in each contamination risk level divided to total individuals studied.
Risk ratio estimation and confidence intervals were calculated with “riskratio” function in the “epitools” package [49]. Risk ratio is calculated by unconditional maximum likelihood estimation and small sample adjustment. Normal approximation with small sample adjustment was used for calculated confidence intervals [49]. We compared the low risk as reference level and test of two-sided independence. P values were calculated using Fisher’s exact test, the Monte Carlo simulation and the chi-square test. All analyses were implemented in the R environment [47].

3. Results

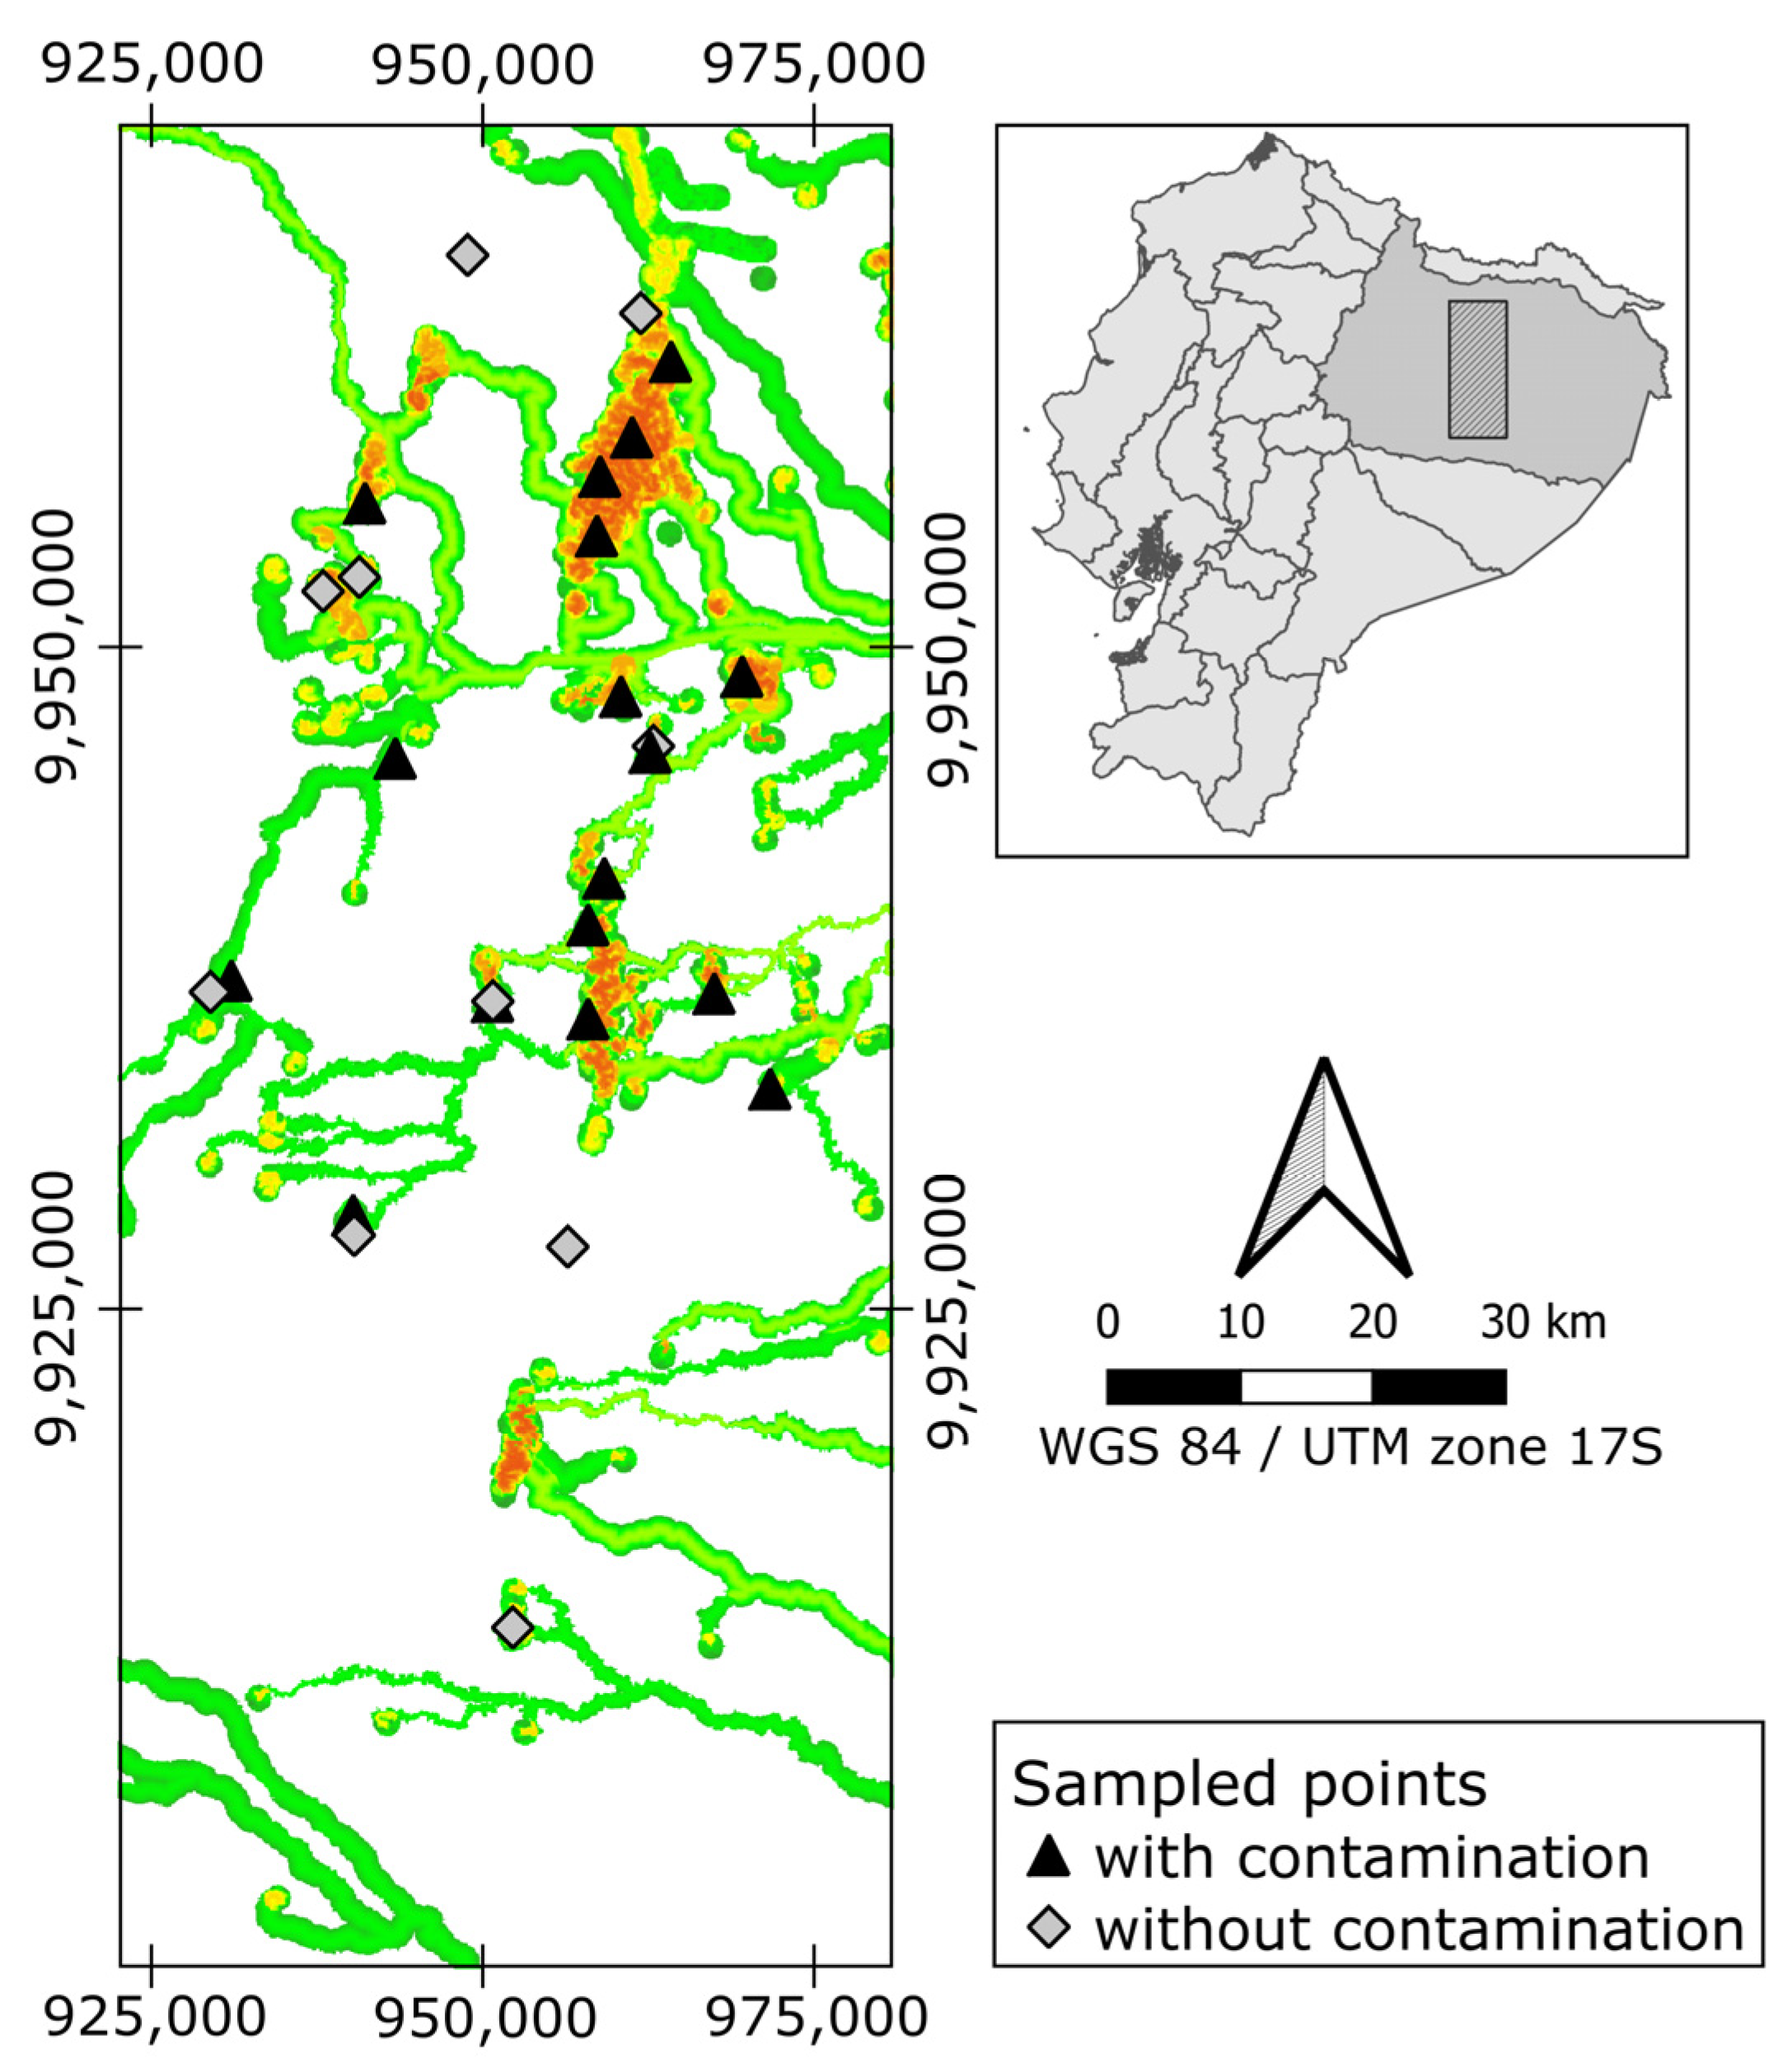
3.1. Spatial Model of Contamination Risk and Model Validation

Our spatial model of contamination risk posits the dispersal behavior of petroleum contamination in water and over land. The expression of the model of accessibility to contamination produced distinct results from a model based solely in distance from contamination sources (Figure 2). Consequently, the model based on accessibility to contamination reflects considerable nuance in the spatial distribution of risk (Figure 2). This model facilitates consideration not only of the area exposed to contamination but the concentration of contamination too. Locations at similar distances from a spill origin may have different concentrations of contaminants, as Figure 2 shows. The riparian zones represented in Figure 2 are not homogeneous and variation exists in the area and degree of contamination according to the variables driving the accessibility index. Moreover, the sum of the potential sources of contamination can amplify the level of contamination risk. We assumed that oil wells and pipelines could become contamination sources from which contaminants could be transported in water as runoff. An interesting finding was that flow of contaminant from oil pipes might have a more important effect than the wells. Although wells may have an important local effect, the effect on watercourses may be lower from wells than from pipes.
This model was shown to effectively predict the levels of pollutants in water, we found a significantly positive correlation between contamination risk and detected contamination (Pearson correlation 0.57, t = 3.0335, df = 19, p-value = 0.007). The monitoring points with contamination are associated to the localities where the model shows high levels of contamination risk (Figure 3).

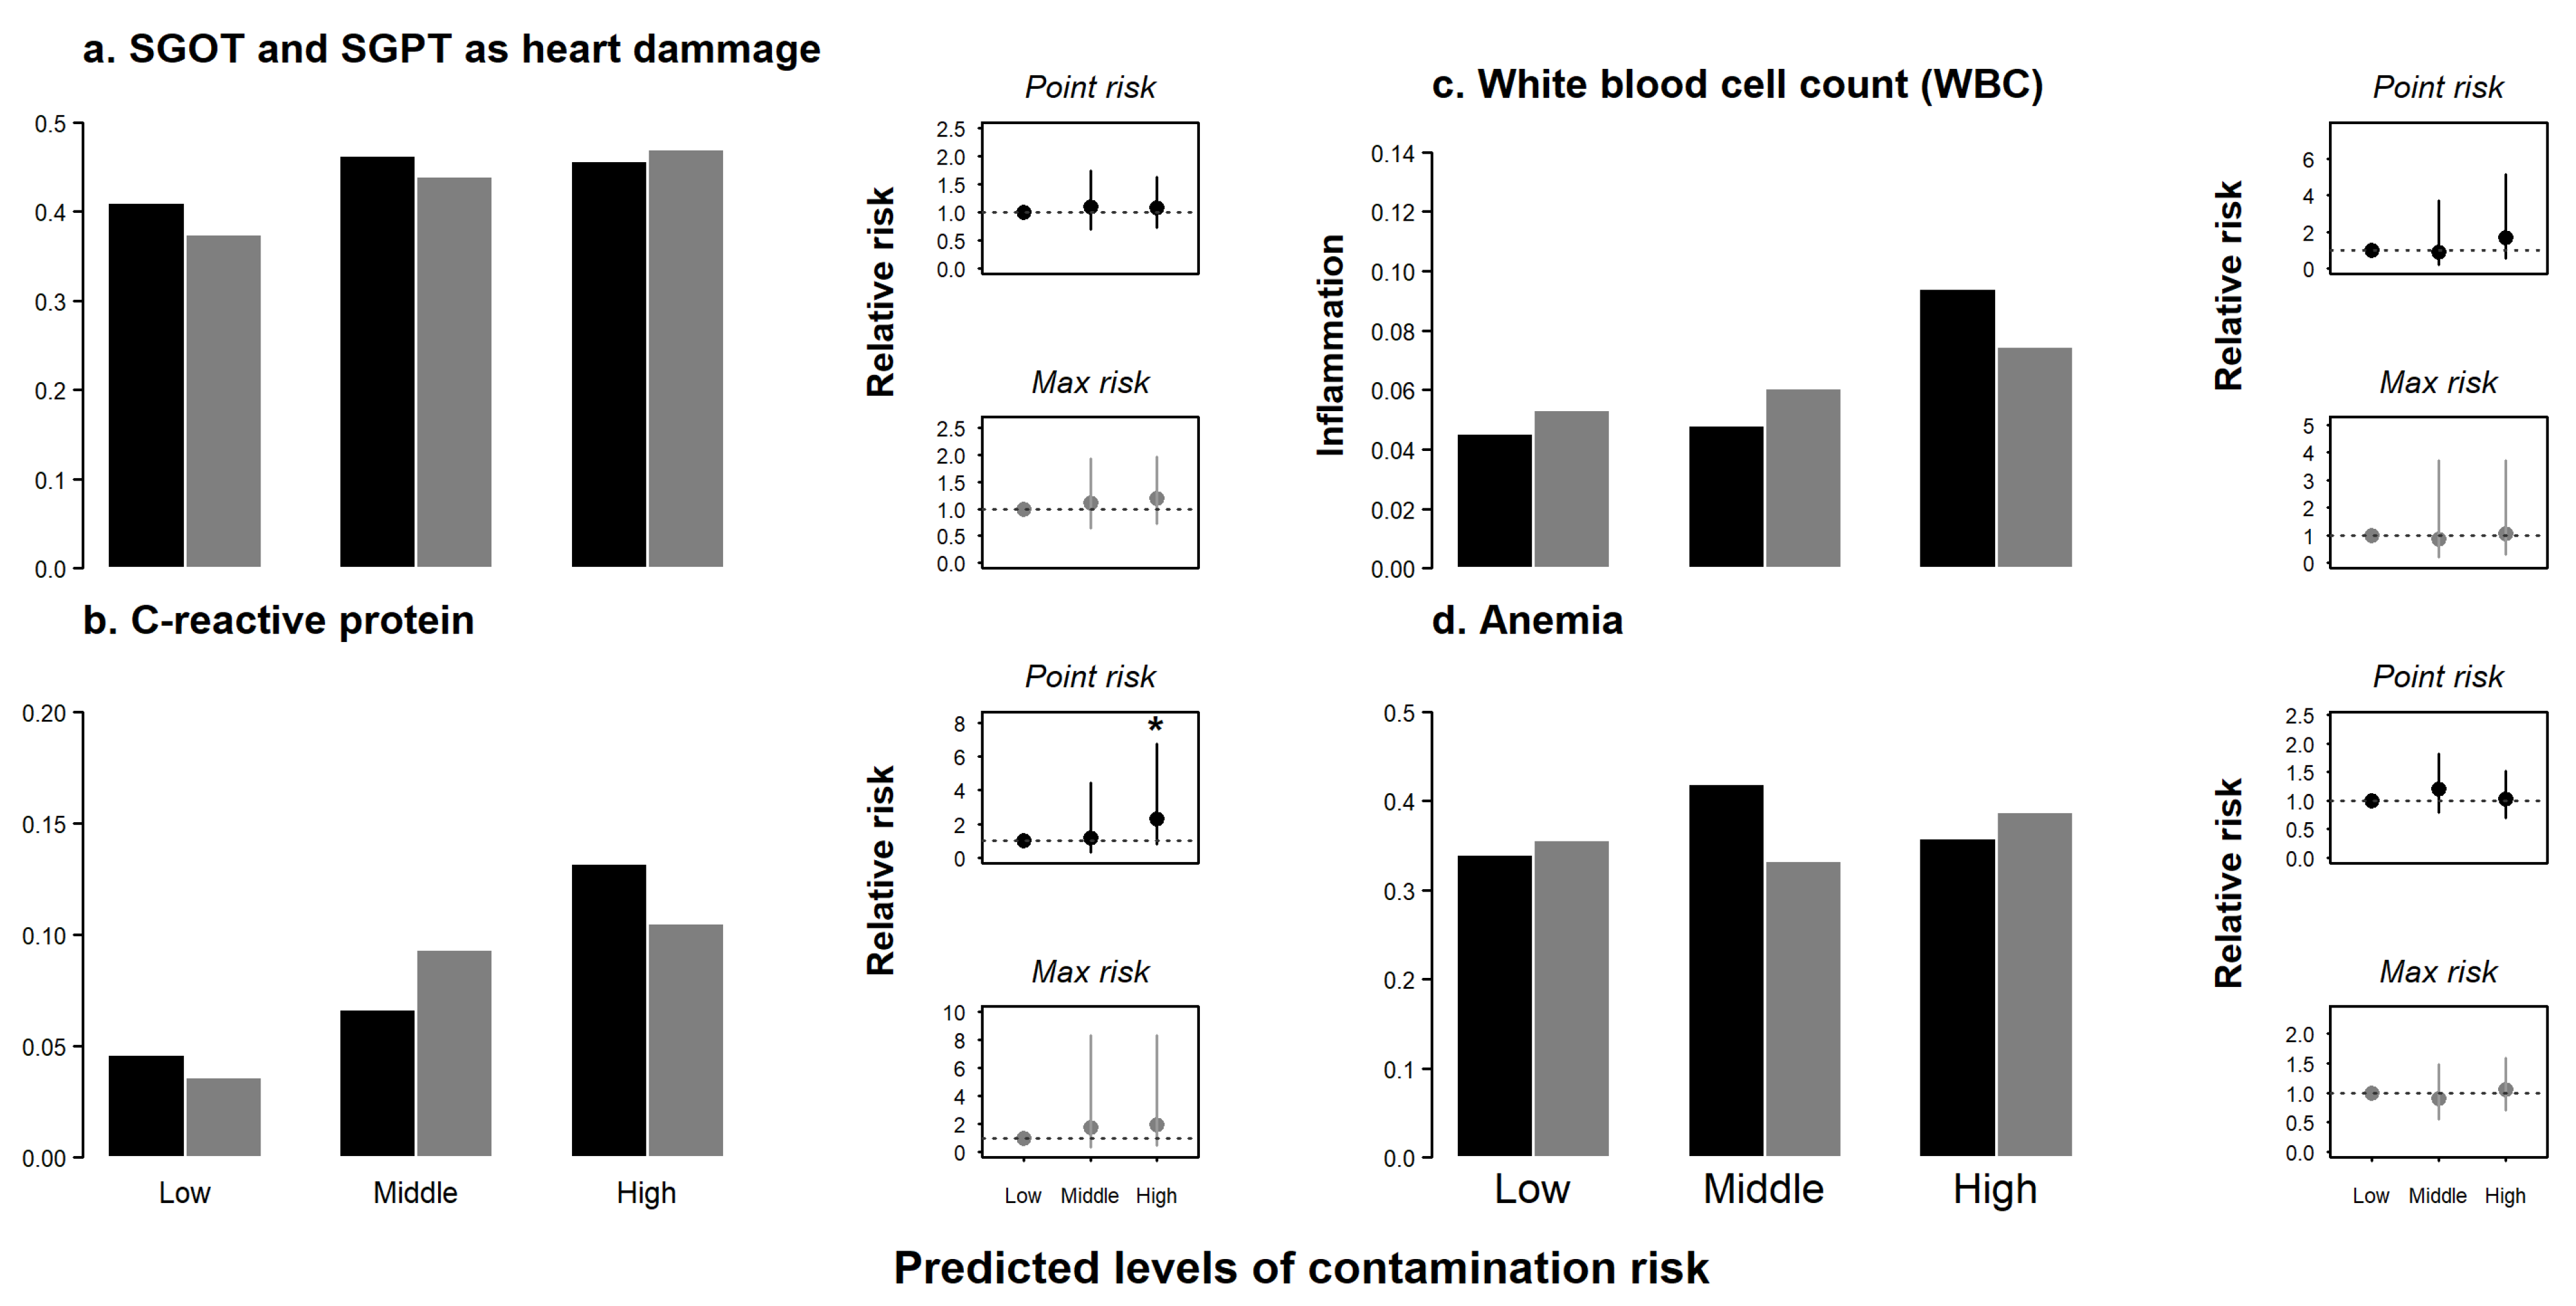
3.2. Vulnerability of Land and People

Sixty-five percent of population centers had some level of contamination risk of oil spills. An alarming 39% of those populated areas were coincided with area modeled as having high risk of contamination. The other land using the percentages of risk of contamination were lower than populated areas; however, these present percentages between 20 to 30% of their area with some level of contamination (Figure 4).
Our results showed that of the total hydrological network, 48% (232) of rivers were predicted to be affected by pollution in at least some reaches. Of these, 44 (1%) rivers presented a risk of contamination in more than 75% of their length water flow, 120 rivers were found with a contamination risk between 25 to 75% of their length (Figure 4b) and 108 (36%) rivers were affected in less than 25% of their length.
We did not find significant effects of contamination risk in the studied variables of human health except for C-reactive protein where, for participants whose residence was modeled as at high point risk of contamination, the incidence of inflammation was higher (Figure 5). In the case of C-reactive protein, the incidence shifted from a proportion of 0.05 in places of low risk of contamination to 0.14 in places with high contamination risk. At the high level of risk of contamination, the probability that people would show inflammation was 1.29 times the probability of showing the same problems at the low level (p value = 0.04, with 95% C.I., low 0.78 and high 6.72). In those areas with a medium contamination risk level, the probability of people presenting inflammation was 1.16 times higher than in areas with low contamination risk (p value: 0.615, with 95% C.I., low 0.30 and high 4.46).

4. Discussion

The development of risk maps is essential to support the management of environmental contamination and for targeting monitoring activity. However, the development of a credible risk map involves modeling how the pollutants could be distributed in the territory (pollution map), determining if this model corresponds to pollutant measurements (pollution hazard map), to finally determine the effects that these pollutants have on human health or ecological systems [31]. In this context, the development of risk models that allow us to quantify the vulnerability of populations to risk of contamination is a key step for the management of basins with contamination concerns. However, many variables combine to influence the behavior of contaminants that enter the environment, making it difficult to accurately predict at-risk zones [32].
According to Lahr and Kooistra [31], maps of the risk of contamination can be used to identify areas of concern for populations or assets, and are important tools that allow decision makers to explore scenarios of proposed developments and management approaches. Although some studies have found evidence that exposition to oil contamination can increase the incidence of cancer [20,21,22], the establishment of causal relationships is extremely complex, due to the nature of the contamination, which is often intermittent with changing magnitudes. Our spatial model of contamination risk proved to be efficient to predict the risk of oil contamination. The inclusion of an accessibility layer that allows modeling of the movement of pollutants on different surfaces proved to be useful and to correct the possible biases that a distance model could generate. The proposed model becomes a powerful tool for better understanding the possible impacts that oil exploitation can cause on the ecosystem, and to develop appropriate management actions.
Our results on the health of the human population show some worrying effects: we found that medium and high levels of risk contamination showed a relative risk between 10 and 20% higher mean inflammation incidence than localities with a low level of contamination. Inflammation can predispose individuals to developing serious health problems such as cancer, and promotes tumorigenesis [50,51]; even the CRP values can be an independent indicator in most solid tumors [52].
Other health parameters such as white blood cells and anemia did not show a significant association with the modeled contamination risk. However, the levels of findings in the entire population are worrying. The incidence of anemia in the studied area was higher than the Ecuadorian population average. According to the national health and nutrition survey ENSANUT-ECU 2012, the prevalence of anemia in adults was 19.1% (2.2 and 16.9% for men and women, respectively), while the mean of anemia found in the studied area was around 30%. Lamentably, we did not have a real counterfactual dataset comprised of people not exposed to contamination. In our study area, the populations without contamination risk are indigenous populations and populations located over 1000 m asl. Those populations are exposed to other environmental conditions or have different genetic predisposition, so these could not be used as control.
It should also be noted that we characterized the level of contamination risk that a participant was exposed to on the basis of their place and time of residence. A more comprehensive approach might have obtained data on other locations that featured prominently in their routines, or other potential risk factors in addition to cigarettes and alcohol. Given that 49% of the area of population centers was modeled as exposed to high and medium levels of risk of oil contamination, more detailed examination of possible adverse health effects associated with petroleum exploration in the Napo basin is warranted.
We believe that the model would allow regional governments in affected areas to improve their monitoring plans, as well as to define management actions and control strategies for areas with high contamination risk.

5. Conclusions

A large proportion of the human populations in the Ecuadorian Napo River have high vulnerability, the risk contamination by exploitation of petroleum affected a large proportion of these populations, and this contamination risk affects some variables of health. The accessibility model used to predict the risk of oil contamination proved to be a viable tool with a high level of correspondence with the probability of contamination. The human populations of the Napo River basin are highly vulnerable to hydrocarbon contamination, and the different areas populated and used for agricultural and livestock production are exposed to a high risk of contamination.
We recommend further studies to clarify the effects of pollution on the health of the population. Special emphasis should be placed on the analysis of the effects of contamination on anemia, as although we did not find significant effects of the level of contamination, our results show a particularly high incidence.

Author Contributions

Conceptualization, C.I.E., D.H.D. and F.R.-B.; methodology, F.R.-B. and C.I.E.; formal analysis, C.I.E.; laboratory analysis, M.I.R., A.P.A., N.B.-M.; resources, C.I.E. and N.B.-M.; data curation, D.H.D., C.I.E., F.R.-B., M.I.R.; writing—original draft preparation, C.I.E., D.H.D., F.R.-B.; writing—review and editing, all authors; project administration, C.I.E. and N.B.-M. All authors have read and agreed to the published version of the manuscript.

Funding

This research was funded by SENESCYT, grant number (CPC-SENESCYT-03-2014).

Institutional Review Board Statement

The study was conducted according to the guidelines of the Declaration of Helsinki, and approved by the Ethics Committee of Universidad San Francisco de Quito (protocol code 2015-056E and date of approval 25-05-2015) and Ministerio de Salud of Ecuador, MSP-DIS-2015-0078-O.

Informed Consent Statement

Informed consent was obtained from all subjects involved in the study.

Data Availability Statement

The data are not publicly available due to restriction of the fund agency.

Acknowledgments

This manuscript was improved with the help of suggestions of three anonymous reviewers.

Conflicts of Interest

The authors declare no conflict of interest. The funders had no role in the design of the study; in the collection, analyses or interpretation of data; in the writing of the manuscript, or in the decision to publish the results.

References

  1. Bryan, G.W.; Langston, W.J. Bioavailability, accumulation and effects of heavy metals in sediments with special reference to United Kingdom estuaries: A review. Environ. Pollut. 1992, 76, 89–131. [Google Scholar] [CrossRef]
  2. Norwood, W.P.; Borgmann, U.; Dixon, D.G.; Wallace, A. Effects of metal mixtures on aquatic biota: A review of observations and methods. Hum. Ecol. Risk Assess. 2003, 9, 795–811. [Google Scholar] [CrossRef]
  3. Sakan, S.M.; Dordević, D.S.; Manojlović, D.D.; Predrag, P.S. Assessment of heavy metal pollutants accumulation in the Tisza river sediments. J. Environ. Manag. 2009, 90, 3382–3390. [Google Scholar] [CrossRef]
  4. Kumar, A.; Pinto, M.C.; Candeias, C.; Dinis, P.A. Baseline maps of potentially toxic elements in the soils of Garhwal Himalayas, India: Assessment of their eco-environmental and human health risks. L. Degrad. Dev. 2021. [Google Scholar] [CrossRef]
  5. Korre, A.; Durucan, S.; Koutroumani, A. Quantitative-spatial assessment of the risks associated with high Pb loads in soils around Lavrio, Greece. Appl. Geochem. 2002, 17, 1029–1045. [Google Scholar] [CrossRef]
  6. Carlon, C.; Pizzol, L.; Critto, A.; Marcomini, A. A spatial risk assessment methodology to support the remediation of contaminated land. Environ. Int. 2008, 34, 397–411. [Google Scholar] [CrossRef]
  7. Kumar, A.; Jigyasu, D.K.; Kumar, A.; Subrahmanyam, G.; Mondal, R.; Shabnam, A.A.; Cabral-Pinto, M.M.S.; Malyan, S.K.; Chaturvedi, A.K.; Gupta, D.K.; et al. Nickel in terrestrial biota: Comprehensive review on contamination, toxicity, tolerance and its remediation approaches. Chemosphere 2021, 275, 129996. [Google Scholar] [CrossRef]
  8. Cabral Pinto, M.M.S.; Marinho-Reis, A.P.; Almeida, A.; Freitas, S.; Simões, M.R.; Diniz, M.L.; Pinto, E.; Ramos, P.; Ferreira da Silva, E.; Moreira, P.I. Fingernail Trace Element Content in Environmentally Exposed Individuals and Its Influence on Their Cognitive Status in Ageing. Expo. Heal. 2019, 11, 181–194. [Google Scholar] [CrossRef]
  9. Bashir, I.; Lone, F.A.; Bhat, R.A.; Mir, S.A.; Dar, Z.A.; Dar, S.A. Concerns and threats of contamination on aquatic ecosystems. Bioremediation Biotechnol. Sustain. Approaches Pollut. Degrad. 2020, 1–26. [Google Scholar] [CrossRef] [Green Version]
  10. Norse, E.A.; Amos, J. Impacts, Perception, and Policy Implications of the Deepwater Horizon Oil and Gas Disaster. Law Rep. 2010, 40, 11058–11073. [Google Scholar]
  11. Goldman, R.; Biton, E.; Brokovich, E.; Kark, S.; Levin, N. Oil spill contamination probability in the southeastern Levantine basin. Mar. Pollut. Bull. 2015, 91, 347–356. [Google Scholar] [CrossRef] [Green Version]
  12. Muñoz, F.; Barriga, R.; Vera, E. Identificación de hidrocarburos aromáticos policíclicos (HAP’s) en peces y sedimentos en la zona de Shushufindi, Sucumbios, Ecuador. Rev. Politec. 2010, 29, 143–149. [Google Scholar]
  13. Liang, Y.; Zhang, X.; Wang, J.; Li, G. Spatial variations of hydrocarbon contamination and soil properties in oil exploring fields across China. J. Hazard. Mater. 2012, 241–242, 371–378. [Google Scholar] [CrossRef]
  14. Li, J.; Dong, H.; Zhang, D.; Han, B.; Zhu, C.; Liu, S.; Liu, X.; Ma, Q.; Li, X. Sources and ecological risk assessment of PAHs in surface sediments from Bohai Sea and northern part of the Yellow Sea, China. Mar. Pollut. Bull. 2015, 96, 485–490. [Google Scholar] [CrossRef]
  15. Wang, Y.-B.; Liu, C.-W.; Kao, Y.-H.; Jang, C.-S. Characterization and risk assessment of PAH-contaminated river sediment by using advanced multivariate methods. Sci. Total Environ. 2015, 524–525, 63–73. [Google Scholar] [CrossRef]
  16. Xu, L.; Wang, T.; Ni, K.; Liu, S.; Wang, P.; Xie, S.; Meng, J.; Zheng, X.; Lu, Y. Ecological Risk Assessment of Arsenic and Metals in Surface Sediments from Estuarine and Coastal Areas of the Southern Bohai Sea, China. Hum. Ecol. Risk Assess. An Int. J. 2014, 20, 388–401. [Google Scholar] [CrossRef] [Green Version]
  17. Liu, F.; Liu, J.L.; Chen, Q.Y.; Wang, B.B.; Cao, Z.G. Pollution characteristics and ecological risk of polycyclic aromatic hydrocarbons (PAHs) in surface sediments of the southern part of the Haihe River system in China. Chin. Sci. Bull. 2013, 58, 3348–3356. [Google Scholar] [CrossRef] [Green Version]
  18. Christensen, E.R.; Li, A.; Ab Razak, I.A.; Rachdawong, P.; Karls, J.F. Sources of polycyclic aromatic hydrocarbons in sediments of the Kinnickinnic River, Wisconsin. J. Great Lakes Res. 1997, 23, 61–73. [Google Scholar] [CrossRef]
  19. Ingersoll, C.G.; MacDonald, D.D.; Wang, N.; Crane, J.L.; Field, L.J.; Haverland, P.S.; Kemble, N.E.; Lindskoog, R.A.; Severn, C.; Smorong, D.E. Predictions of sediment toxicity using consensus-based freshwater sediment quality guidelines. Arch. Environ. Contam. Toxicol. 2001, 41, 8–21. [Google Scholar] [CrossRef]
  20. San Sebastián, M.; Armstrong, B.; Stephens, C. The health of women who live near oil wells and oil production stations in the Amazon region of Ecuador. Rev. Panam. Salud Publica/Pan Am. J. Public Health 2001, 9, 375–384. [Google Scholar] [CrossRef] [Green Version]
  21. Kim, K.H.; Jahan, S.A.; Kabir, E.; Brown, R.J.C. A review of airborne polycyclic aromatic hydrocarbons (PAHs) and their human health effects. Environ. Int. 2013, 60, 71–80. [Google Scholar] [CrossRef] [PubMed]
  22. Sebastian, S. Oil Development and Health in the Amazon Basin of Ecuador: The Popular Epidemiology Process. Available online: https://pubmed.ncbi.nlm.nih.gov/15571897/ (accessed on 1 July 2021).
  23. Salerno, C.; Berchialla, P.; Palin, L.A.; Vanhaecht, K.; Panella, M. Cancer morbidity of residents living near an oil refinery plant in North-West Italy. Int. J. Environ. Health Res. 2013, 23, 342–351. [Google Scholar] [CrossRef] [PubMed]
  24. Bertazzi, P.A.; Pesatori, A.C.; Zocchetti, C.; Latocca, R. Mortality study of cancer risk among oil refinery workers. Int. Arch. Occup. Environ. Health 1989, 61, 261–270. [Google Scholar] [CrossRef] [PubMed]
  25. Sorahan, T. Mortality of UK oil refinery and petroleum distribution workers, 1951–2003. Occup. Med. 2007, 57, 177–185. [Google Scholar] [CrossRef] [Green Version]
  26. Semple, K.T.; Morriss, A.W.J.; Paton, G.I. Bioavailability of hydrophobic organic contaminants in soils: Fundamental concepts and techniques for analysis. Eur. J. Soil Sci. 2003, 54, 809–818. [Google Scholar] [CrossRef]
  27. Arnot, J.A.; Gobas, F.A.P.C. A food web bioaccumulation model for organic chemicals in aquatic ecosystems. Environ. Toxicol. Chem. 2004, 23, 2343–2355. [Google Scholar] [CrossRef] [Green Version]
  28. Gassiat, C.; Gleeson, T.; Lefebvre, R.; McKenzie, J. Hydraulic fracturing in faulted sedimentary basins: Numerical simulation of potential contamination of shallow aquifers over long time scales. Water Resour. Res. 2013, 49, 8310–8327. [Google Scholar] [CrossRef] [Green Version]
  29. Mayer, B.; Humez, P.; Becker, V.; Nightingale, M.; Ing, J.; Kingston, A.; Clarkson, C.; Cahill, A.; Parker, E.; Cherry, J.; et al. Prospects and Limitations of Chemical and Isotopic Groundwater Monitoring to Assess the Potential Environmental Impacts of Unconventional Oil and Gas Development. Procedia Earth Planet. Sci. 2015, 13, 320–323. [Google Scholar] [CrossRef] [Green Version]
  30. Besser, H.; Hamed, Y. Causes and risk evaluation of oil and brine contamination in the Lower Cretaceous Continental Intercalaire aquifer in the Kebili region of southern Tunisia using chemical fingerprinting techniques. Environ. Pollut. 2019, 253, 412–423. [Google Scholar] [CrossRef]
  31. Lahr, J.; Kooistra, L. Environmental risk mapping of pollutants: State of the art and communication aspects. Sci. Total Environ. 2010, 408, 3899–3907. [Google Scholar] [CrossRef]
  32. Machado, D. Desarrollo de un SIG en plataforma Arc-Info, para Modelar Espacialmente Derrames de Petróleo en Tierra. Caso de estudio: Campos Petroleros de la Región Oriental de Venezuela. In Proceedings of the VI Conferencia Latinoamericana de usuarios ARC/INFO y ERDAS, Caracas, Venezuela, 12–16 April 1999; Available online: https://proceedings.esri.com/library/userconf/latinproc99/ponencias/ponencia21.html (accessed on 1 August 2021).
  33. Maroko, A.R. Using air dispersion modeling and proximity analysis to assess chronic exposure to fine particulate matter and environmental justice in New York City. Appl. Geogr. 2012, 34, 533–547. [Google Scholar] [CrossRef]
  34. Omo-Irabor, O.O.; Olobaniyi, S.B. Application of Multi-criteria Decision Analysis and GIS Techniques in Vulnerability Assessment of Coastal Inhabitants in Nigeria to Crude Oil Production and Transportation Activities. In Spatial Enablement in Support of of Economic Development and Poverty Reduction; Onsrud, H., Rajabifard, A., Eds.; GSDI Association Press: Needham, MA, USA, 2013; pp. 169–190. [Google Scholar]
  35. Zurita-Arthos, L.; Mulligan, M. Multi-criteria GIS analysis and geo-visualisation of the overlap of oil impacts and ecosystem services in the Western Amazon. Int. J. Geoinform. 2013, 9, 45–52. [Google Scholar]
  36. French-McCay, D. Modeling as a Scientific Tool in NRDA for Oil and Chemical Spills. Int. Oil Spill Conf. 2008, 53, 160. [Google Scholar] [CrossRef]
  37. Jones, R.; Barron, M. Site Selection of Petroleum Pipelines: A GIS Approach to Minimize Environmental Impacts and Liabilities. Available online: https://proceedings.esri.com/library/userconf/proc99/proceed/papers/pap350/p350.htm (accessed on 1 August 2021).
  38. Rahman, A.; Lownes, N. Risk Assessment of Hazardous Material Transportation Routes in the City of New Haven. Available online: https://citeseerx.ist.psu.edu/viewdoc/download?doi=10.1.1.965.6642&rep=rep1&type=pdf (accessed on 1 August 2021).
  39. Miller, J.; Onwuetaka, J. Using GIS to Model Environmental Vulnerability in Coastal Oil Fields, East Central Nigeria. In Proceedings of the ESRI Proceedings, 1999; Available online: https://proceedings.esri.com/library/userconf/proc99/proceed/papers/pap460/p460.htm (accessed on 1 August 2021).
  40. Udoh, J.; Ekanem, E. GIS based risk assessment of oil spill in the coastal areas of Akwa Ibom State, Nigeria. Afr. J. Environ. Sci. 2011, 5, 205–211. [Google Scholar]
  41. Mohamadi, B.; Xie, Z.; Liu, F. GIS based oil spill risk assessment model for the Niger Delta’s vegetation. Nat. Environ. Pollut. Technol. 2015, 14, 545–552. [Google Scholar]
  42. INEC Censo Nacional de Población y Vivienda del Ecuador 2010. Available online: https://www.ecuadorencifras.gob.ec/institucional/home/ (accessed on 1 August 2021).
  43. Análisis de Vulnerabilidad a la Contaminación de una Sección de los Acuíferos del Valle Central de Costa Rica; Esri. Available online: https://proceedings.esri.com/library/userconf/latinproc00/costa_rica/analisis_vulnerabilidad/vulnerabilidad_acuiferoscr.htm (accessed on 1 August 2021).
  44. IGM. WCS Service of Digital Elevation Model. 2014. Available online: http://www.geoportaligm.gob.ec/portal/ (accessed on 1 August 2021).
  45. Rázuri, L. Estructura de conservación de suelos y aguas. In Serie Riesgo y Drenaje, 32; Centro Interamericano de Desarrollo de Agua y Tierras: Mérida, Mexico, 1982; pp. 7–33. [Google Scholar]
  46. QGIS Development Team QGIS Geographic Information System 2021. Available online: https://www.qgis.org/es/site/ (accessed on 1 August 2021).
  47. R Development Core Team. R Core Team R: A Language and Environment for Statistical Computing. 2020. Available online: https://www.gbif.org/tool/81287/r-a-language-and-environment-for-statistical-computing (accessed on 1 August 2021).
  48. Kabat, G.C.; Kim, M.Y.; Manson, J.A.E.; Lessin, L.; Lin, J.; Wassertheil-Smoller, S.; Rohan, T.E. White Blood Cell Count and Total and Cause-Specific Mortality in the Women’s Health Initiative. Am. J. Epidemiol. 2017, 186, 63–72. [Google Scholar] [CrossRef] [PubMed]
  49. Aragon, T.J. Epitools: Epidemiology Tools 2020. Available online: https://www.r-project.org/ (accessed on 1 August 2021).
  50. Setiawan, A.; Yin, L.; Auer, G.; Czene, K.; Smedby, K.E.; Pawitan, Y. Patterns of acute inflammatory symptoms prior to cancer diagnosis. Sci. Rep. 2017, 7, 1–5. [Google Scholar] [CrossRef] [PubMed]
  51. Greten, F.R.; Grivennikov, S.I. Inflammation and Cancer: Triggers, Mechanisms, and Consequences. Immunity 2019, 51, 27–41. [Google Scholar] [CrossRef]
  52. Shrotriya, S.; Walsh, D.; Nowacki, A.S.; Lorton, C.; Aktas, A.; Hullihen, B.; Benanni-Baiti, N.; Hauser, K.; Ayvaz, S.; Estfan, B. Serum c-reactive protein is an important and powerful prognostic biomarker in most adult solid tumors. PLoS ONE 2018, 13, e0202555. [Google Scholar] [CrossRef]
Figure 1. Hydrological network and oil infrastructure in Napo basin. The oil well and pipeline data were obtained from Petroecuador (2009).
Sustainability 13 09230 g001
Figure 2. Sample expression of the model of oil contamination risk. The gray lines indicate equal distance from the pollution source (simple distance-based risk) while the colored cells indicate risk ranging from low (green) to higher risk (orange) derived from our model of accessibility to potential and known contamination sources.
Sustainability 13 09230 g002
Figure 3. Validation of the spatial model of oil contamination risk. The distribution of the contamination monitoring points for TPHs superimposed over zones of predicted risk: low (green) to high (red). Black triangles indicate locations that returned at least one sample with TPH above acceptable levels between 2012 and 2014 and grey diamonds indicate locations without contamination.
Sustainability 13 09230 g003
Figure 4. Risk of hydrocarbon contamination expressed as: the percentage of area of various soil use types affected (a) and the percentage of the length of water courses of the Napo River basin (b). The percentage values are annotated above each bar.
Sustainability 13 09230 g004
Figure 5. Incidence and relative risk of health variables in relationship with contamination risk levels. Bars show the incidence of health variables. Risk plots show relative risk in relation with low contamination risk (1 = same risk). Black bars and points show values in relation with contamination levels of point contamination, gray bars and point show values in relation with contamination levels of max buffer contamination (see methods). * show the significance of the model (p value < 0.05).
Sustainability 13 09230 g005
Table 1. Weights assigned to slope categories in the calculation of the friction surface.
Slope (%)Weight
0–21
2–62
6–126
12–188
>1810
Publisher’s Note: MDPI stays neutral with regard to jurisdictional claims in published maps and institutional affiliations.

