Article

Towards Sustainable Farm Production System: A Case Study of Corn Farming

1
Land Science Research Center, Nanjing University of Information Science & Technology, Nanjing 210044, China
2
College of Engineering, China Agricultural University, Beijing 100083, China
3
Center of Excellence in Water Resources, University of Engineering and Technology, Lahore 54890, Pakistan
4
Department of Civil and Architectural Engineering, University of Wyoming, Laramie, WY 82071, USA
*
Author to whom correspondence should be addressed.
Sustainability 2021, 13(16), 9243; https://doi.org/10.3390/su13169243
Submission received: 3 July 2021 / Revised: 11 August 2021 / Accepted: 12 August 2021 / Published: 17 August 2021

Abstract

:
Many recent studies show that most of the crop production systems in developing countries are not environmentally sustainable. This study uses the life cycle assessment (LCA) to investigate the potential impacts of corn production in Pakistan on global warming and human health damages and also suggests mitigation strategies to reduce environmental impacts towards sustainable crop production based on the results. Land-based, mass-based, and energy-based functional units were used. IMPACT 2002+ methodology—a combination of IMPACT 2002, Eco-Indicator 99, CML, and intergovernmental panel on climate change (IPCC)—is used for the impact assessment. The results demonstrated that the global warming potential of one-ton production of corn, one-hectare corn farm, and production of 1000 MJ energy were 354.18, 34,569.90, and 1275.13 kg CO2 equivalents, respectively. The off-farm and on-farm emissions of nitrogen-based chemical fertilizers were the hotspots in the most impact categories. Moreover, human health damages followed by global warming as environmental externalities were also associated with corn production. We also highlighted the production areas with light, medium and extreme environmental externalities with Toba Tek Singh and Okara districts in the Punjab province of Pakistan being the most and least contributing districts towards global warming, respectively. Results further indicated that a 5 to 100% reduction of chemical fertilizers would mitigate the environmental impacts of corn production by 4.38 to 87.58% and 2.16 to 43.30% in terms of aquatic acidification and global warming, respectively. Modern farming systems and conservation technologies were suggested to reduce emissions and improve the environmental performance of corn production. Furthermore, agricultural extension and the ministry of agriculture should pay more attention to farmers’ education on emissions from farming inputs and their impact on climate.

1. Introduction

Climate change caused by the increasing concentration of greenhouse gases in the environment is a significant issue defying policymakers around the world. Major contributing factors include increased utilization of non-renewable energy resources since the industrial revolution in the eighteenth century and expanded farming activities associated with the growing population [1]. A growth rate of 4.1% in greenhouse gas emissions (GHG) was observed in Pakistan from 1994 to 2012, with energy and agriculture as the major stakeholders responsible for 89% of the total emissions [2]. As the agriculture sector is widely dispersed throughout the country and alone has contributed 44% to CO2 equivalent GHG emissions [3], considerable mitigation strategies are required in this sector. Mitigation practices may include crop, land, and energy management, efficiency improvement measures, and provision of renewable energy systems [4]. Before suggesting a particular mitigation strategy to reduce environmental impacts, it is imperative to study the life cycle of crops [5].
The life cycle approach is considered to be the main tool for addressing the production and consumption challenges of agricultural systems. Life cycle-based approaches support the transition to improving the sustainability of existing production and consumption practices, e.g., LCA (life cycle assessment), SLCDA (Social Life Cycle Assessment), LCDA (Life Cycle Cost), and LEXA (Overall Life Cycle Sustainability Assessment). LCA is the most commonly used method for environmental impact assessment of a product over its life. Previous studies supported the application of LCA in agricultural production systems [6,7].
Moreover, in the agricultural domain LCA was used on various crops such as wheat [8], rice [9], maize [10], sugarcane [11], and cotton [12], as well as fruits and vegetables such as apples, sweet berries, plums [13,14], peaches [15], grapes [16], tomatoes [17], and carrots [18]. In addition to the stepwise examination of environmental burdens due to agricultural activities/inputs [19], the LCA can also be used to develop climate change adaptation strategies under existing production methods by scientists, managers, and decision-makers as a decision-making tool [20].
Pakistan is one of the top 20 corn-producing countries of the world [21]; corn itself is the third most important cereal crop in the country after rice and wheat. Due to its flexible domain as a grain and cash crop, it is quickly becoming the main crop in Pakistan [22]. As a vital crop, the utilization of inputs has been increased as farmers presumed that increased application would lead to increased yield and eventually increased farm profit. Climate change and greenhouse gas emissions from crop productions are mainly due to the excessive use of inputs especially fossil fuels, synthetic fertilizers, and pesticides [23]. Agriculture, however, has the potential to mitigate its emissions through the adoption of appropriate measures like low carbon and resource conservation [24]. Therefore, an in-depth understanding of the trends in emissions of greenhouse gases, drivers of these emissions, and the linkage between them is essential to develop mitigation and adaptation strategies. In this regard, life cycle assessment (LCA) as a standard-based methodology that is accepted by researchers, policymakers, and industries can play a key role in a sustainable agricultural production system [25].
Despite the importance of this particular food crop (corn) and its bulky annual global production of 1116.41 million tons [21], studies of its environmental performance are still rare in the literature. The lack of life cycle assessment studies of corn and knowledge about environmental hotspots in the corn production chain is an important research gap. There are many studies on the LCA of crops such as wheat, rice, sugarcane, and cotton. However, due to specific crop inputs requirements and climatology, these studies could not be used as a benchmark for other crops in different continents. Furthermore, the ecological performance of a crop could also diverge from the economic status and industrial progress of production farms, and therefore, it is imperative to apply the LCA in different areal domains to establish production benchmarks for individual crops.
There have been a few studies of the LCA applications on Pakistani agriculture [26,27]. However, to the best of the authors’ knowledge, no study exists regarding the environmental externalities of corn productions in the country. Therefore, this study emphasizes the LCA of corn production to investigate environmental impacts and improvement options. The aggregated, normalized, and weighted impact assessment measures are established for resource consumption and land uses. Moreover, currently, the best accessible techniques have been selected and refined to incorporate standardizations and weighting factors for impact categories. The current study described the LCA application on Pakistani corn with specific emphasis on the identification of hotspots in the production chain. The objectives of this study were to: (1) identify the LCA impacts of Pakistani corn and environmental hotspots in corn farming; (2) quantitatively analyze the impact of corn growing on human health, ecosystem, climate change, and resources and explore the mechanism of climate change and human activities on the production chain; and (3) provide the available mitigation options for corn production in Pakistan.

2. Materials and Methods

The LCA is divided into four steps [28].
  • “Definition of the goal and scope”;
  • “Life cycle inventory”;
  • “Life cycle impact assessment”;
  • “Interpretation of results”.

2.1. First Step—Definition of the Goal and Scope

2.1.1. Goal and Scope
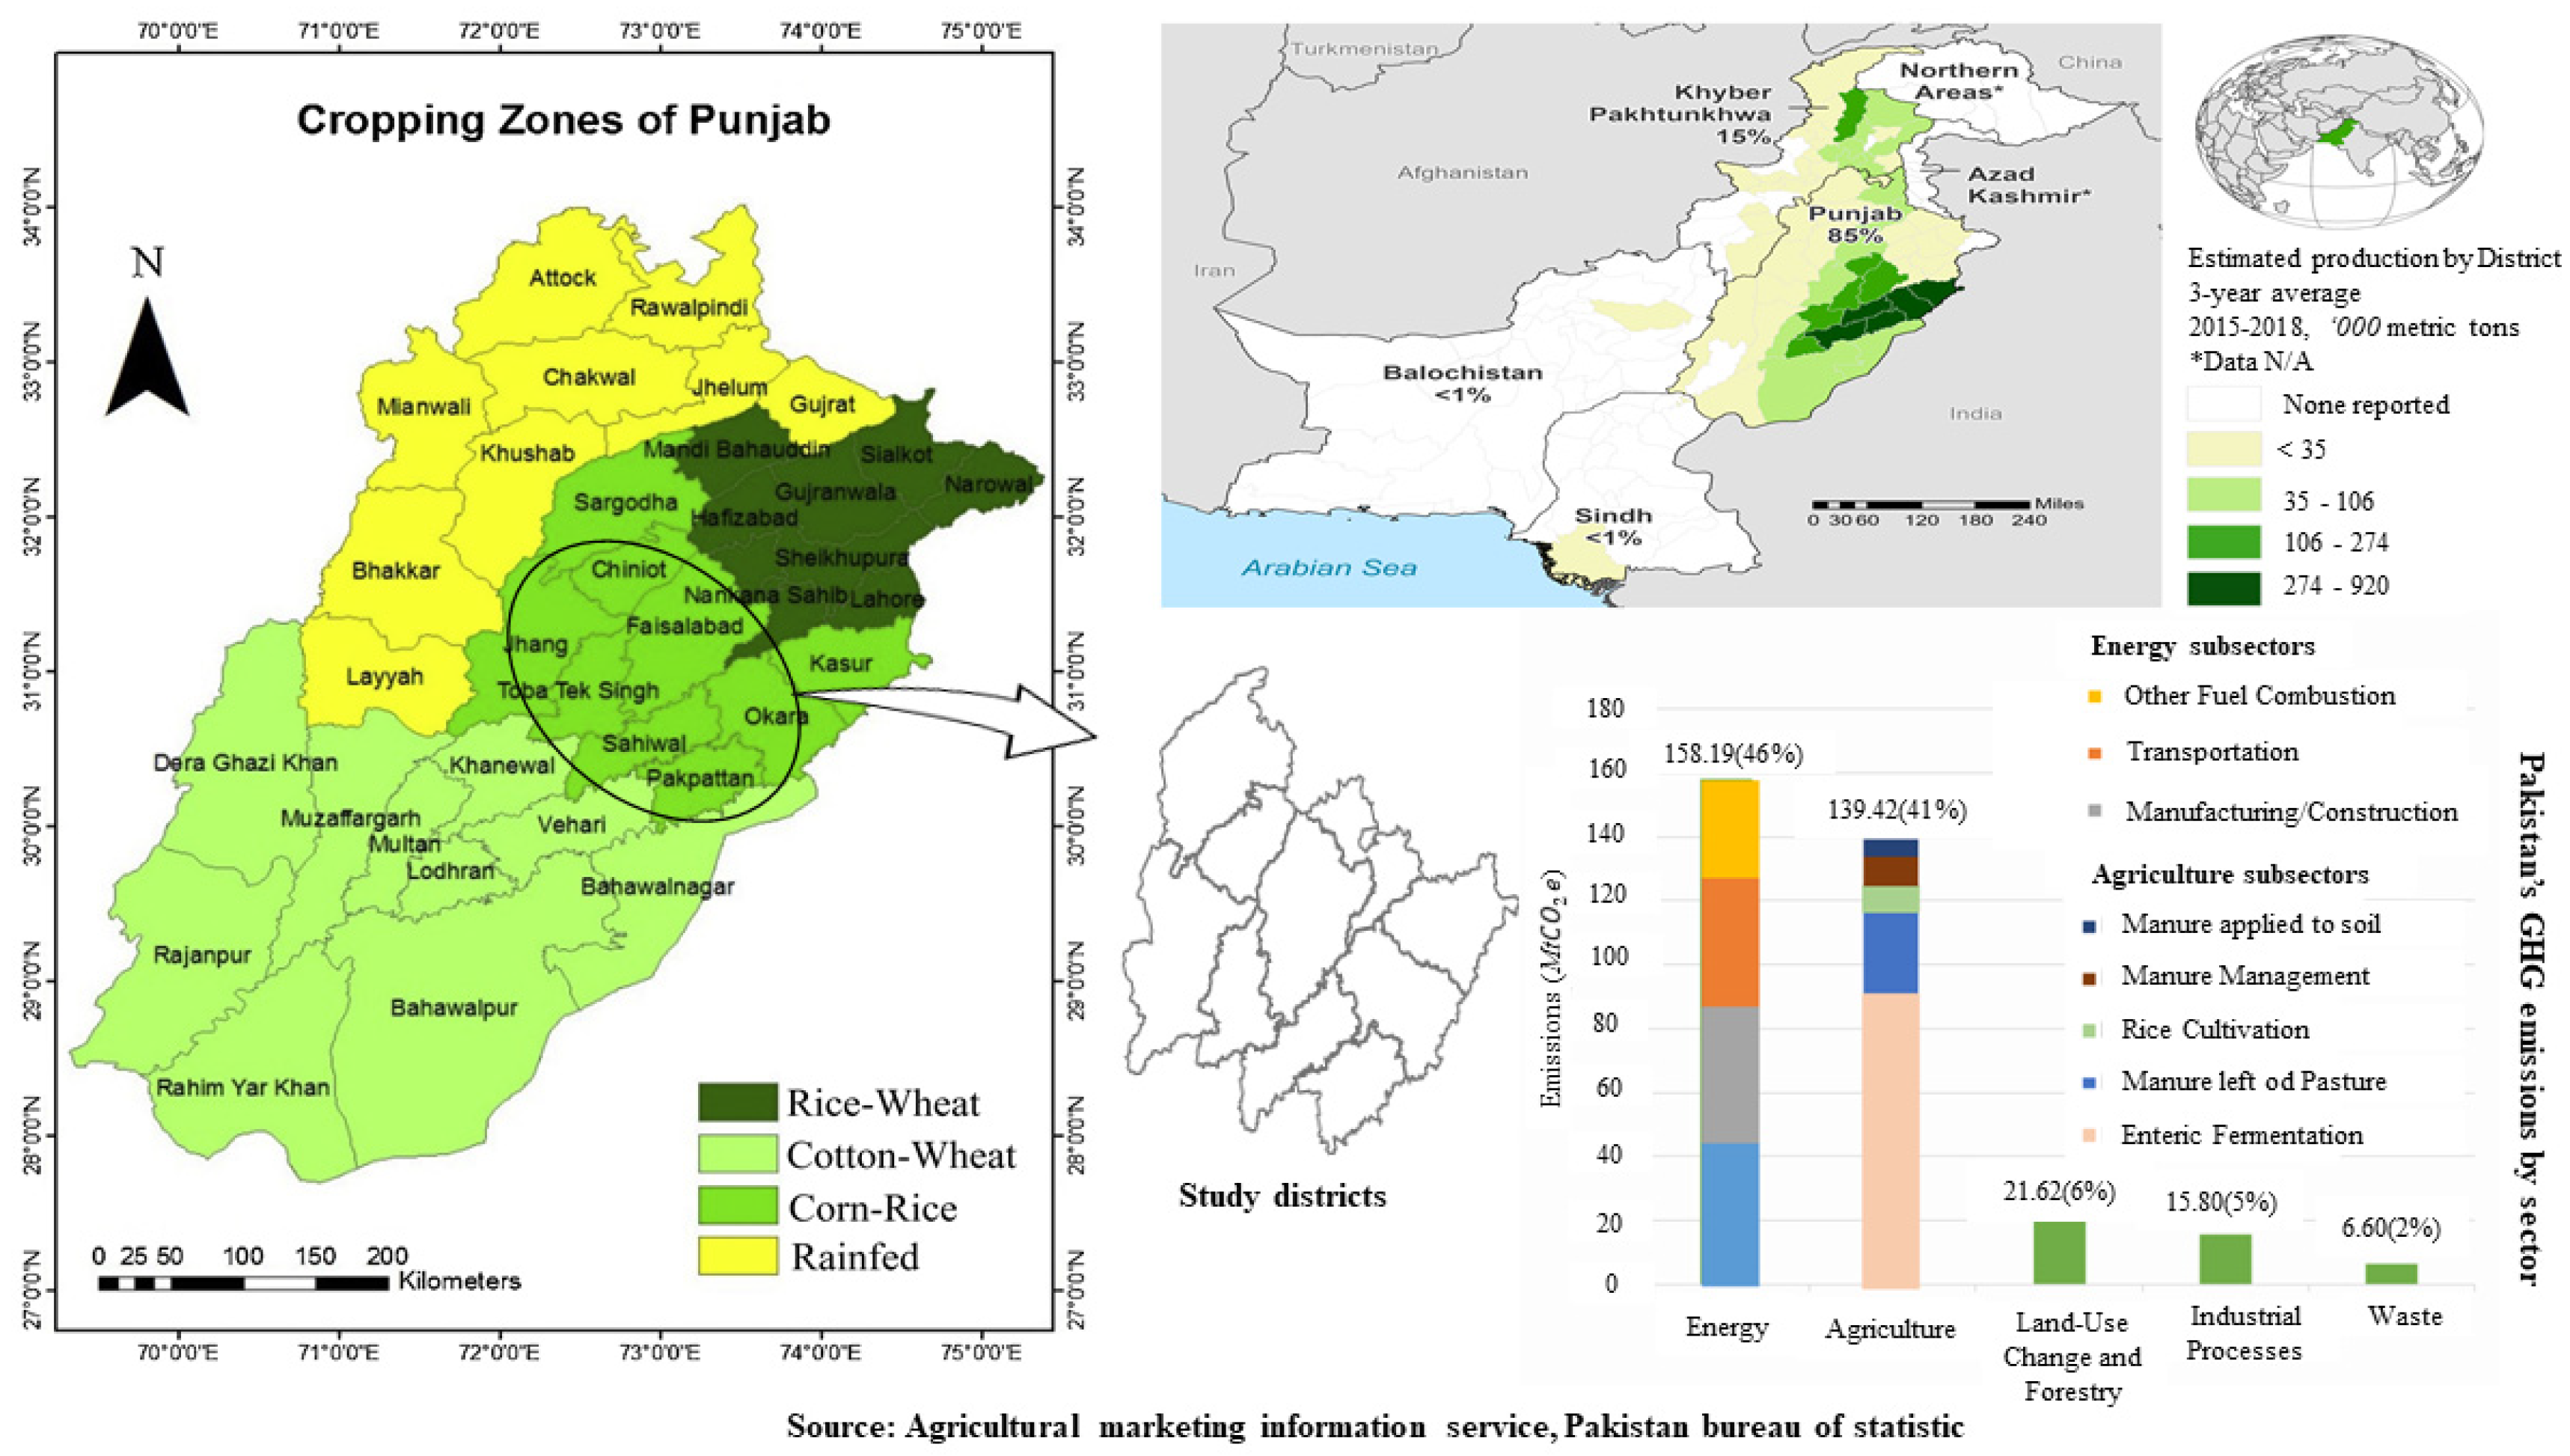
The goal of this research is to determine the environmental LCA of corn production in the Punjab province of Pakistan. Three functional units (FUs) namely, land-based (one hectare), mass-based (one tonne of corn), and energy-based (1000 MJ energy generation) units were considered.

2.1.2. Case Study

The case study was corn production system in the Punjab province of Pakistan, a key focus of the study. Figure 1 shows the study area with coordinates of potential districts of corn production in Punjab.
The data were collected from 500 corn producers through a well-structured questionnaire from 2018 to 2019. Following Elahi et al. [29,30], the questionnaire was developed to conduct interviews with farmers of Punjab. Each producer was asked questions of the number of inputs used from cultivation to harvesting such as diesel fuel (liters), machinery use (h), chemical fertilizers (kgs), biocides (kgs), seed (kgs), and yield (kgs).
The selection of these farmers has been made through a five-stage sampling technique. In the first stage, Punjab province was chosen purposively since it is the major corn-producing province in the country. Secondly, 10 municipalities (MP) of the corn-rice cropping zone were selected. In the third and fourth stages, 2 union councils (UCs) and 5 villages were randomly selected. Finally, 5 farmers from each Vs were chosen for the interview. Therefore, 50 farmers from every MP were interviewed for inputs and output of corn productions. The questionnaire was designed to obtain per acre information (a unit of land measurement locally used in Pakistan) converted to per hectare.
For the scope of LCA in corn productions, cradle to farm gate system boundary was used. The emitted pollutants were divided into two groups of off-farm emissions (i.e., the emitted pollutants from extraction, production, and transportation of raw materials), and on-farm emissions (i.e., direct emissions which were released at the farm).

2.2. Second Step—Life Cycle Inventory

In this step, the input consumption and their emitted pollutants were investigated. Within the system boundary of the cradle-to-farm gate, both foreground and background emissions from corn productions were considered. Background emissions include emission from production (at industry) and transportation of material inputs (to farm), while foreground includes the direct emission from consumption of materials inputs at the farm. The data collected through questionnaires described in the previous section were used for foreground emissions, while the associated background emissions were extracted from EcoInvent 2.2 database [31]. For foreground emissions, the quantity of each input was multiplied by its CO2 equivalent, and the LCA included its algorithms to evaluate these equivalent CO2 emissions of any processes throughout the corn production cycle.

2.3. Third Step—Life Cycle Impact Assessment

The impact assessment (IA) methodology was used. In this methodology selection of impact categories and characterization are mandatory, while normalization and weighing are optional elements [32]. We selected fifteen impact categories for investigation. The characterization index was calculated by using the potential of pollutants in these impact categories. Then, the values were normalized, the normalization indices were calculated by dividing the characterization indices to normalization factors based on the following equation:
N I i = C I i N F i
where, NI, CI, and NF are the normalization index, characterization index, and normalization factor of impact category i, respectively [33].
For IA of LCA, IMPACT 2002+ methodology—a combination of IMPACT 2002, CML, IPCC, and Eco-Indicator 99—was used in this study [34]. The IA methodology is strongly based on the initial outcomes from life cycle inventory (LCA), the calculated emissions in the LCI results were then entered into the intermediate stage, where the results with similar impact pathways were grouped into impact categories called midpoint categories. Later on, these results of the midpoint were then quantified to represent the quality change in terms of four damage categories at the endpoint level. The overall framework of impact methodology has been represented in Figure 2.
Since different studies used different methods for impact IA in crop productions, a comparative analysis was carried out to examine the effects of different IA methods on the final results. To do so, four different methods of IA methods of CML-IA baseline, ILCD 2011 Midpoint, EDIP 2003, and EDP (2013) were evaluated for comparison through LCA with SimaPro 8.2.3.0 version [32].

3. Results and Discussions

3.1. Step Four—Interpretation of LCA Results

This step involves the interpretation of the IA findings. The study considered 15 IA categories. The characterization indices of these categories for corn production are presented in Table 1. Impact categories like global warming potential (GWP) are considered as imperious concerning the ecological recitation of the crops [35]. Results showed that field emission and nitrogen fertilizers are the primary contributors to the GWP of the corn cropping system. Field emission is the main source of eutrophication, aquatic acidification, and CO2. The application of nitrogen fertilizer is responsible for nitrous oxide (N2O), which is 310 times more dangerous than CO2 due to its heat-trapping effects [36]. Mass (one tonne), land (one hectare), and energy (1000 MJ) based GWP of corn production was found 354.18, 34,569.90, and 1275.13 kg CO2 eq, respectively. In the literature, mass-based GWP of canola production was reported to be 1181 kg CO2 eq [37]; traditional and semi-mechanized potato to be 228 and 153 kg CO2 eq, respectively [38]; canola, soybean, and sunflower to be 2132, 1549, 2283 kgCO2 eq, respectively [39]; and irrigated and dryland wheat to be 1220 and 720, respectively [40].
Therefore, compared to these studies the GWP of corn production in Pakistan is not high. Moreover, the amount of eutrophication and acidification indices are almost the same as the corresponding values in different study regions. The results indicate that corn production is inefficient in terms of fuel and fertilizer application, which contributes the most towards global warming.
Table 2, illustrates the percentage involvement of each input towards impact categories. The results emphasized that direct emissions were the hotspot in terms of aquatic acidification, terrestrial acid/nutria, and respiratory inorganics. Mousavi-Avval et al. [37] reported that 70% of the environmental impact of terrestrial ecotoxicity within corn production was related to on-farm emissions. Ghasempour and Ahmadi [41] studied a corn production system in Iran and estimated that nitrogen-based fertilizers caused the highest negative impacts. Heidari et al. [42] studied the LCA of pasta production and found that foreground emissions were the major stakeholders towards environmental externalities.
Furthermore, nitrogen-based fertilizers were the flashpoint in terms of GWP, mineral extraction, non-renewable energy, terrestrial ecotoxicity, and carcinogens. The application of farm inputs especially fertilizers was different at different farms depending upon farmers’ specific characteristics, for example, their knowledge about precision agriculture, financial condition, extension services, soil fertility, and crop rotation. Joy et al. [43] also reported an imbalanced use of fertilizers in Pakistan. As the excessive use of fertilizers caused more nitrogen emission, and thus, increased global warming, farmers should pay special attention to the pattern of use of fertilizers. Another important non-renewable energy input is the diesel fuel use in different machines such as tractors for crop activities (from land preparation to harvesting) and pumps for groundwater pumping, which also causes on-farm emissions.
Table 3, further demonstrates the normalized damage assessment (NDA) of the corn crop. Human health stands for the highest damaged category caused by direct emissions due to the application of fertilizers. The results are in line with the study of Elahi et al. [44]. They have also found associated occupational health damages due to the application of synthetic agrochemicals for crop production in the Punjab province of Pakistan. Furthermore, nitrogen fertilizers have also the highest negative effect on the resource depletion damage category followed by diesel fuel consumption. Our results are in line with the studies of Payandeh et al. [45] and Taki et al. [46].
Furthermore, the description of corn production indices through different impact assessment methodologies is presented in Table 4. Results indicate that the land-based GWP of corn ranges from 2295.34 kg CO2 eq to 3134.44 kg CO2 eq per hectare under different IA methodologies, while OLP (ozone layer depletion) stays the same at 6.40 × 10⁻⁴ kg CFC-11 eq. for all IA methodologies. Rafiee et al. [47] also signified the variations of LCA results among the IA methodologies in the agriculture sector.
Figure 3 illustrates the NDA of the corn crop. Our results show that corn production in Pakistan causes the highest damage to the human health category. The results are in line with the study of Paramesh et al. [32]. They have estimated human health damage assessment as the largest environmental impact during areca nut production. The direct emissions into the air during the agricultural production process are most responsible for human health damages. Furthermore, climate change/global warming and resource depletion are found the second and third most damaging categories after human health. This is because a frequent number of irrigations and excessive input requirements for corn production contribute to climate change and resource depletion.

3.2. Distribution of Study Area Based on Impact Categories

Since the LCA results reveal nitrogen fertilizers as the main contributors towards global warming evidenced by the weighted global warming index of 2295.34 kg CO2 equivalent, the utilization of nitrogen fertilizers was calculated for each district and the entire study region (10 districts) and then the districts were categorized into light, medium and extreme areas, shown in Figure 4. Light, medium, and extreme emission areas include the global warming index ranges from 1698 to 2019 kg CO2 equivalent, 2020 to 2295 kg CO2 equivalent, and above 2295 kg CO2 equivalent, respectively. Okara, and Faisalabad, and Toba Tek Singh and Jhang are found to be the light and extreme regions, respectively. More specifically, the farmers of Jhang and Toba Tek Singh have high use of nitrogen fertilizers. Previous studies [48,49,50] also concluded that inadequate usage of synthetic fertilizers was significantly related to emission and other related consequences. Zulfiqar and Thapa [51] determined the imbalanced use of fertilizers was the main reason for getting lower wheat efficiency in the Punjab province of Pakistan. Developing countries like Pakistan, where farmers expect to have increased crop yield with increased use of chemical fertilizers are becoming the major reasons for greenhouse gas emissions and climate change.

3.3. Mitigation Strategies

Table 5 represents the potential of environmental impacts mitigation through the reduction of nitrogen-based chemical fertilizers. Results indicate that a 5 to 100% reduction in chemical fertilizers mitigates the environmental impacts of corn production in terms of aquatic acidification by 4.38 to 87.58%. It can be concluded that nitrogen-based fertilizer is an environmental hotspot in the corn production system. Sadeghi et al. [52] evaluated the environmental impacts of corn production in Iran based on the application of three nitrogen-based fertilizer levels of 300, 400, and 500 kg per hectare. The results showed that the corn yield increased with increasing fertilizer rate from 300 to 400 kg per hectare; however, a further increase in the fertilizer rate (500 kg ha−1) was not environmentally friendly.
Nitrogen-based fertilizer is one of the main inputs in corn production [53,54]. Chemical fertilizer has been considered the main driver or input to increase crop production in developing countries such as the production of groundnut-bean [55], peach [15], and areca nut [32]. Integrating a legume into the crop rotation can contribute to the supply of required chemical nitrogen by atmospheric nitrogen fixation [37]. Moreover, planting winter cover crops can be considered as a strategy to increase soil organic carbon levels and to reduce nitrogen losses from the soil and to increase soil organic carbon levels [56,57] suggested that replacing conventional chemical fertilizers with biofertilizers could mitigate the environmental impacts of the crop production system. Currently, there is a common misconception among Pakistani farmers that the excessive use of fertilizers would increase crop yield. However, E. Elahi, Weijun, Zhang et al. [50] found that only an optimal use of NPK fertilizers could improve the crop efficiency.
Moreover, the excessive use of nitrogen-based fertilizers and fuel reduces energy use efficiency and threatens the environment. Prabhakar and Elder [58] also reported that most farmers in Pakistan did not use the optimal amount of farm inputs, and thus, resulted in low resource use efficiency. Zulfiqar and Thapa [51] found a lack of access to extension services, crop production technology, and knowledge about environmental impacts of crop production were among the main reason for low crop efficiency and negative environmental impacts.

4. Conclusions

This study applied the life cycle assessment (LCA) to determine the damage categories of global warming potential GWP, human health, resources depletion, and ecosystems of corn production in Pakistan. Human health was found to be the most damaged category, followed by climate change/global warming and resource depletion, and the direct emissions into the air during the corn production intercultural process are most responsible to the human health damages. On the other hand, frequent irrigations and excessive input consumptions for corn production contribute to climate change and resource depletion. The results further revealed that direct and indirect emissions of nitrogenous fertilizers were the environmental hotspot. The results also suggested that the reduction in the excessive use of farm inputs could be a potential sustainable crop production strategy. Therefore, the study calls for the proper use of agrochemicals. The on-farm emissions through fuel consumption can be minimized using conservation tillage, high-efficiency irrigation systems, and other integrated methods to control weeds and pests. Moreover, agricultural extension and the ministry of agriculture need to pay more attention to farmers’ education to improve energy resource use efficiency and reduction of negative environmental impacts of crop production. Further research is required to determine life cycle assessment in other agricultural production systems particularly focusing on climate change mitigation potential of different technologies and management practices.

Author Contributions

Conceptualization, A.A., R.A. and C.Z.; methodology, A.A.; software, A.A.; validation, C.Z., W.U. and J.Z.; formal analysis, A.A. and J.Z.; investigation, A.A. and R.A.; resources, A.A.; data curation, C.Z. and W.U.; writing—original draft preparation, A.A.; writing—review and editing, M.W. and J.Z.; visualization, M.W.; supervision, C.Z.; project administration, C.Z.; funding acquisition, C.Z. All authors have read and agreed to the published version of the manuscript.

Funding

The authors of this study would like to express their appreciation to the key project of National Natural Science Foundation (4213000267), the Innovative and Entrepreneurial Talent Program of Jiangsu Province (R2020SC04) and the Strategic Priority Research Program of the Chinese Academy of Sciences (XDA2006030201) for their sponsorship.

Institutional Review Board Statement

Not applicable.

Informed Consent Statement

Informed consent was obtained from all subjects involved in the study.

Data Availability Statement

The datasets used and/or analyzed during the current study are available from the corresponding author on reasonable request.

Acknowledgments

We would like to thank our survey team members for conducting the field survey.

Conflicts of Interest

The authors declare no conflict of interest.

References

  1. Leach, M.; Nisbett, N.; Cabral, L.; Harris, J.; Hossain, N.; Thompson, J. Food Politics and Development. World Dev. 2020, 134, 105024. [Google Scholar] [CrossRef]
  2. Mir, K.A.; Park, C.; Purohit, P.; Kim, S. Comparative Analysis of Greenhouse Gas Emission Inventory for Pakistan: Part I Energy and Industrial Processes and Product Use. Adv. Clim. Chang. Res. 2020, 11, 40–51. [Google Scholar] [CrossRef]
  3. Abdullah, F.B.; Iqbal, R.; Hyder, S.I.; Jawaid, M. Energy Security Indicators for Pakistan: An Integrated Approach. Renew. Sustain. Energy Rev. 2020, 133, 110122. [Google Scholar] [CrossRef]
  4. Adegbeye, M.J.; Ravi Kanth Reddy, P.; Obaisi, A.I.; Elghandour, M.M.M.Y.; Oyebamiji, K.J.; Salem, A.Z.M.; Morakinyo-Fasipe, O.T.; Cipriano-Salazar, M.; Camacho-Díaz, L.M. Sustainable Agriculture Options for Production, Greenhouse Gasses and Pollution Alleviation, and Nutrient Recycling in Emerging and Transitional Nations—An Overview. J. Clean. Prod. 2020, 242, 118319. [Google Scholar] [CrossRef]
  5. Gomez-Zavaglia, A.; Mejuto, J.C.; Simal-Gandara, J. Mitigation of Emerging Implications of Climate Change on Food Production Systems. Food Res. Int. 2020, 134, 109256. [Google Scholar] [CrossRef]
  6. Nemecek, T.; Jungbluth, N.; i Canals, L.M.; Schenck, R. Environmental Impacts of Food Consumption and Nutrition: Where Are We and What Is Next? Int. J. Life Cycle Assess. 2016, 21, 607–620. [Google Scholar] [CrossRef] [Green Version]
  7. Notarnicola, B.; Sala, S.; Anton, A.; McLaren, S.J.; Saouter, E.; Sonesson, U. The Role of Life Cycle Assessment in Supporting Sustainable Agri-Food Systems: A Review of the Challenges. J. Clean. Prod. 2017, 140, 399–409. [Google Scholar] [CrossRef]
  8. Jiang, Z.; Zheng, H.; Xing, B. Environmental Life Cycle Assessment of Wheat Production Using Chemical Fertilizer, Manure Compost, and Biochar-Amended Manure Compost Strategies. Sci. Total Environ. 2021, 760, 143342. [Google Scholar] [CrossRef]
  9. Habibi, E.; Niknejad, Y.; Fallah, H.; Dastan, S.; Tari, D.B. Life Cycle Assessment of Rice Production Systems in Different Paddy Field Size Levels in North of Iran. Environ. Monit. Assess. 2019, 191, 202. [Google Scholar] [CrossRef]
  10. Król-Badziak, A.; Pishgar-Komleh, S.H.; Rozakis, S.; Księżak, J. Environmental and Socio-Economic Performance of Different Tillage Systems in Maize Grain Production: Application of Life Cycle Assessment and Multi-Criteria Decision Making. J. Clean. Prod. 2021, 278, 123792. [Google Scholar] [CrossRef]
  11. Meza-Palacios, R.; Aguilar-Lasserre, A.A.; Morales-Mendoza, L.F.; Pérez-Gallardo, J.R.; Rico-Contreras, J.O.; Avarado-Lassman, A. Life Cycle Assessment of Cane Sugar Production: The Environmental Contribution to Human Health, Climate Change, Ecosystem Quality and Resources in México. J. Environ. Sci. Health Part A Toxic/Hazard. Subst. Environ. Eng. 2019, 54, 668–678. [Google Scholar] [CrossRef]
  12. Hedayati, M.; Brock, P.M.; Nachimuthu, G.; Schwenke, G. Farm-Level Strategies to Reduce the Life Cycle Greenhouse Gas Emissions of Cotton Production: An Australian Perspective. J. Clean. Prod. 2019, 212, 974–985. [Google Scholar] [CrossRef]
  13. Naderi, S.; Ghasemi Nejad Raini, M.; Taki, M. Measuring the Energy and Environmental Indices for Apple (Production and Storage) by Life Cycle Assessment (Case Study: Semirom County, Isfahan, Iran). Environ. Sustain. Indic. 2020, 6, 100034. [Google Scholar] [CrossRef]
  14. Svanes, E.; Johnsen, F.M. Environmental Life Cycle Assessment of Production, Processing, Distribution and Consumption of Apples, Sweet Cherries and Plums from Conventional Agriculture in Norway. J. Clean. Prod. 2019, 238, 117773. [Google Scholar] [CrossRef]
  15. Nikkhah, A.; Royan, M.; Khojastehpour, M.; Bacenetti, J. Environmental Impacts Modeling of Iranian Peach Production. Renew. Sustain. Energy Rev. 2017, 75, 677–682. [Google Scholar] [CrossRef]
  16. Litskas, V.D.; Irakleous, T.; Tzortzakis, N.; Stavrinides, M.C. Determining the Carbon Footprint of Indigenous and Introduced Grape Varieties through Life Cycle Assessment Using the Island of Cyprus as a Case Study. J. Clean. Prod. 2017, 156, 418–425. [Google Scholar] [CrossRef]
  17. Bosona, T.; Gebresenbet, G. Life Cycle Analysis of Organic Tomato Production and Supply in Sweden. J. Clean. Prod. 2018, 196, 635–643. [Google Scholar] [CrossRef]
  18. Lopes, J.; Medeiros, D.L.; Kiperstok, A. Combining Cleaner Production and Life Cycle Assessment for Reducing the Environmental Impacts of Irrigated Carrot Production in Brazilian Semi-Arid Region. J. Clean. Prod. 2018, 170, 924–939. [Google Scholar] [CrossRef]
  19. Bojacá, C.R.; Wyckhuys, K.A.G.; Schrevens, E. Life Cycle Assessment of Colombian Greenhouse Tomato Production Based on Farmer-Level Survey Data. J. Clean. Prod. 2014, 69, 26–33. [Google Scholar] [CrossRef]
  20. Campos-Guzmán, V.; García-Cáscales, M.S.; Espinosa, N.; Urbina, A. Life Cycle Analysis with Multi-Criteria Decision Making: A Review of Approaches for the Sustainability Evaluation of Renewable Energy Technologies. Renew. Sustain. Energy Rev. 2019, 104, 343–366. [Google Scholar] [CrossRef]
  21. Rehman, A.; Luan, J.; Shahzad, B.; Chandio, A.A.; Hussain, I.; Nabi, G.; Iqbal, M.S. Economic Perspectives of Major Field Crops of Pakistan: An Empirical Study. Pac. Sci. Rev. B Humanit. Soc. Sci. 2015, 1, 145–158. [Google Scholar] [CrossRef] [Green Version]
  22. Ahmad, I.; Ahmad, B.; Boote, K.; Hoogenboom, G. Adaptation Strategies for Maize Production under Climate Change for Semi-Arid Environments. Eur. J. Agron. 2020, 115, 126040. [Google Scholar] [CrossRef]
  23. Rehman, A.; Ma, H.; Ahmad, M.; Irfan, M.; Traore, O.; Chandio, A.A. Towards Environmental Sustainability: Devolving the Influence of Carbon Dioxide Emission to Population Growth, Climate Change, Forestry, Livestock and Crops Production in Pakistan. Ecol. Indic. 2021, 125, 107460. [Google Scholar] [CrossRef]
  24. Abbas, A.; Waseem, M.; Yang, M. An Ensemble Approach for Assessment of Energy Efficiency of Agriculture System in Pakistan|. Energy Effic. 2020, 13, 683–696. [Google Scholar] [CrossRef]
  25. Costa, M.P.; Chadwick, D.; Saget, S.; Rees, R.M.; Williams, M.; Styles, D. Representing Crop Rotations in Life Cycle Assessment: A Review of Legume LCA Studies. Int. J. Life Cycle Assess. 2020, 25, 1942–1956. [Google Scholar] [CrossRef]
  26. Ali, M.; Geng, Y.; Robins, D.; Cooper, D.; Roberts, W. Impact Assessment of Energy Utilization in Agriculture for India and Pakistan. Sci. Total Environ. 2019, 648, 1520–1526. [Google Scholar] [CrossRef] [PubMed]
  27. Ullah, A.; Perret, S.R.; Gheewala, S.H.; Soni, P. Eco-Efficiency of Cotton-Cropping Systems in Pakistan: An Integrated Approach of Life Cycle Assessment and Data Envelopment Analysis. J. Clean. Prod. 2016, 134 Pt B, 623–632. [Google Scholar] [CrossRef]
  28. Nikkhah, A.; Khojastehpour, M.; Abbaspour-Fard, M.H. Hybrid Landfill Gas Emissions Modeling and Life Cycle Assessment for Determining the Appropriate Period to Install Biogas System. J. Clean. Prod. 2018, 185, 772–780. [Google Scholar] [CrossRef]
  29. Elahi, E.; Cui, W.; Jha, S.K.; Zhang, H. Estimation of Realistic Renewable and Non-Renewable Energy Use Targets for Livestock Production Systems Utilising an Artificial Neural Network Method: A Step towards Livestock Sustainability. Energy 2019, 183, 191–204. [Google Scholar] [CrossRef]
  30. Elahi, E.; Abid, M.; Zhang, L.; ul Haq, S.; Sahito, J.G.M. Agricultural Advisory and Financial Services; Farm Level Access, Outreach and Impact in a Mixed Cropping District of Punjab, Pakistan. Land Use Policy 2018, 71, 249–260. [Google Scholar] [CrossRef]
  31. Ecoinvent v2.2 Database. Available online: http://esu-services.ch/data/ecoinvent/ (accessed on 26 March 2021).
  32. Paramesh, V.; Arunachalam, V.; Nikkhah, A.; Das, B.; Ghnimi, S. Optimization of Energy Consumption and Environmental Impacts of Arecanut Production through Coupled Data Envelopment Analysis and Life Cycle Assessment. J. Clean. Prod. 2018, 203, 674–684. [Google Scholar] [CrossRef]
  33. Nikkhah, A.; Firouzi, S.; El Haj Assad, M.; Ghnimi, S. Application of Analytic Hierarchy Process to Develop a Weighting Scheme for Life Cycle Assessment of Agricultural Production. Sci. Total Environ. 2019, 665, 538–545. [Google Scholar] [CrossRef]
  34. Wowra, K.; Zeller, V.; Schebek, L. Nitrogen in Life Cycle Assessment (LCA) of Agricultural Crop Production Systems: Comparative Analysis of Regionalization Approaches. Sci. Total Environ. 2020, 763, 143009. [Google Scholar] [CrossRef] [PubMed]
  35. Jiang, Y.; Liao, P.; van Gestel, N.; Sun, Y.; Zeng, Y.; Huang, S.; Zhang, W.; van Groenigen, K.J. Lime Application Lowers the Global Warming Potential of a Double Rice Cropping System. Geoderma 2018, 325, 1–8. [Google Scholar] [CrossRef]
  36. Smith, K.; Watts, D.; Way, T.; Torbert, H.; Prior, S. Impact of Tillage and Fertilizer Application Method on Gas Emissions in a Corn Cropping System. Pedosphere 2012, 22, 604–615. [Google Scholar] [CrossRef]
  37. Mousavi-Avval, S.H.; Rafiee, S.; Sharifi, M.; Hosseinpour, S.; Notarnicola, B.; Tassielli, G.; Renzulli, P.A.; Khanali, M. Use of LCA Indicators to Assess Iranian Rapeseed Production Systems with Different Residue Management Practices. Ecol. Indic. 2017, 80, 31–39. [Google Scholar] [CrossRef]
  38. Shahmohammadi, A.; Veisi, H.; Khoshbakht, K. Compartive Life Cycle Assessment of Mechanized and Semi-Mechanized Methods of Potato Cultivation. Energy Ecol. Environ. 2018, 3, 288–295. [Google Scholar] [CrossRef]
  39. Dekamin, M.; Barmaki, M.; Kanooni, A. Selecting the Best Environmental Friendly Oilseed Crop by Using Life Cycle Assessment, Water Footprint and Analytic Hierarchy Process Methods. J. Clean. Prod. 2018, 198, 1239–1250. [Google Scholar] [CrossRef]
  40. Esmaeilzadeh, S.; Asgharipour, M.R.; Bazrgar, A.B.; Soufizadeh, S.; Karandish, F. Assessing the Carbon Footprint of Irrigated and Dryland Wheat with a Life Cycle Approach in Bojnourd. Environ. Prog. Sustain. Energy 2019, 38, 13134. [Google Scholar] [CrossRef]
  41. Ghasempour, A.; Ahmadi, E. Evaluation of Environmental Effects in Producing Three Main Crops (Corn, Wheat and Soybean) Using Life Cycle Assessment. Agric. Eng. Int. CIGR J. 2018, 20, 126–137. [Google Scholar]
  42. Heidari, M.D.; Huijbregts, M.A.J.; Mobli, H.; Omid, M.; Rafiee, S.; van Zelm, R. Regionalised Life Cycle Assessment of Pasta Production in Iran: Damage to Terrestrial Ecosystems. J. Clean. Prod. 2017, 159, 141–146. [Google Scholar] [CrossRef]
  43. Joy, E.J.M.; Ahmad, W.; Zia, M.H.; Kumssa, D.B.; Young, S.D.; Ander, E.L.; Watts, M.J.; Stein, A.J.; Broadley, M.R. Valuing Increased Zinc (Zn) Fertiliser-Use in Pakistan. Plant Soil 2017, 411, 139–150. [Google Scholar] [CrossRef] [Green Version]
  44. Elahi, E.; Cui, W.; Zhang, H.; Nazeer, M. Agricultural Intensification and Damages to Human Health in Relation to Agrochemicals: Application of Artificial Intelligence. Land Use Policy 2019, 83, 461–474. [Google Scholar] [CrossRef]
  45. Payandeh, Z.; Kheiralipour, K.; Karimi, M.; Khoshnevisan, B. Joint Data Envelopment Analysis and Life Cycle Assessment for Environmental Impact Reduction in Broiler Production Systems. Energy 2017, 127, 768–774. [Google Scholar] [CrossRef]
  46. Taki, M.; Soheili-Fard, F.; Rohani, A.; Chen, G.; Yildizhan, H. Life Cycle Assessment to Compare the Environmental Impacts of Different Wheat Production Systems. J. Clean. Prod. 2018, 197, 195–207. [Google Scholar] [CrossRef] [Green Version]
  47. Rafiee, S.; Khoshnevisan, B.; Mohammadi, I.; Aghbashlo, M.; Mousazadeh, H.; Clark, S. Sustainability Evaluation of Pasteurized Milk Production with a Life Cycle Assessment Approach: An Iranian Case Study. Sci. Total Environ. 2016, 562, 614–627. [Google Scholar] [CrossRef]
  48. van den Berg, H.; Gu, B.; Grenier, B.; Kohlschmid, E.; Al-Eryani, S.; da Silva Bezerra, H.S.; Nagpal, B.N.; Chanda, E.; Gasimov, E.; Velayudhan, R.; et al. Pesticide Lifecycle Management in Agriculture and Public Health: Where Are the Gaps? Sci. Total Environ. 2020, 742, 140598. [Google Scholar] [CrossRef]
  49. Williams, J.D.; Long, D.S.; Reardon, C.L. Productivity and Water Use Efficiency of Intensified Dryland Cropping Systems under Low Precipitation in Pacific Northwest, USA. Field Crops Res. 2020, 254, 107787. [Google Scholar] [CrossRef]
  50. Elahi, E.; Cui, W.; Zhang, H.; Abid, M. Use of Artificial Neural Networks to Rescue Agrochemical-Based Health Hazards: A Resource Optimisation Method for Cleaner Crop Production. J. Clean. Prod. 2019, 238, 117900. [Google Scholar] [CrossRef]
  51. Zulfiqar, F.; Thapa, G.B. Agricultural Sustainability Assessment at Provincial Level in Pakistan. Land Use Policy 2017, 68, 492–502. [Google Scholar] [CrossRef]
  52. Sadeghi, S.M.; Noorhosseini, S.A.; Damalas, C.A. Environmental Sustainability of Corn (Zea Mays L.) Production on the Basis of Nitrogen Fertilizer Application: The Case of Lahijan, Iran. Renew. Sustain. Energy Rev. 2018, 95, 48–55. [Google Scholar] [CrossRef]
  53. Pishgar Komleh, S.H.; Keyhani, A.; Rafiee, S.; Sefeedpary, P. Energy Use and Economic Analysis of Corn Silage Production under Three Cultivated Area Levels in Tehran Province of Iran. Energy 2011, 36, 3335–3341. [Google Scholar] [CrossRef]
  54. Banaeian, N.; Zangeneh, M. Study on Energy Efficiency in Corn Production of Iran. Energy 2011, 36, 5394–5402. [Google Scholar] [CrossRef]
  55. Firouzi, S.; Nikkhah, A.; Rosentrater, K.A. An Integrated Analysis of Non-Renewable Energy Use, GHG Emissions, Carbon Efficiency of Groundnut Sole Cropping and Groundnut-Bean Intercropping Agro-Ecosystems. Environ. Prog. Sustain. Energy 2017, 36, 1832–1839. [Google Scholar] [CrossRef]
  56. Kim, S.; Dale, B.E.; Jenkins, R. Life Cycle Assessment of Corn Grain and Corn Stover in the United States. Int. J. Life Cycle Assess. 2009, 14, 160–174. [Google Scholar] [CrossRef]
  57. Maham, S.G.; Rahimi, A.; Smith, D.L. Environmental Assessment of the Essential Oils Produced from Dragonhead (Dracocephalum Moldavica L.) in Conventional and Organic Farms with Different Irrigation Rates. J. Clean. Prod. 2018, 204, 1070–1086. [Google Scholar] [CrossRef]
  58. Prabhakar, S.V.R.K.; Elder, M. Biofuels and Resource Use Efficiency in Developing Asia: Back to Basics. Appl. Energy 2009, 86 (Suppl. S1), S30–S36. [Google Scholar] [CrossRef]
Figure 1. The study area of Punjab province with estimated corn production of each district and sectorial GHG emissions from Pakistan.
Sustainability 13 09243 g001
Figure 2. A systemic scheme of the IA methodology of corn production.
Sustainability 13 09243 g002
Figure 3. NDA of corn production.
Sustainability 13 09243 g003
Figure 4. Study area with light, medium, and extreme externalities.
Sustainability 13 09243 g004
Table 1. Characterization indices of the corn production system.
Impact CategoriesUnitsFunctional Units
Land-BasedMass-BasedPer 1000 MJ
Energy Generation
CarcinogensKg C2H3Cl equivalent87.2413.3448.01
Non-carcinogensKg C2H3Cl equivalent48.677.3626.48
Respiratory inorganicsKg PM2.5 equivalent8.561.314.71
Ionizing radiationBq C-14 equivalent20,111.043087.2811,115.61
Ozon layer depletionKg CFC-11 equivalent6.40 × 10−49.99 × 10−50.00036
Respiratory organicsKg C2H4 equivalent0.840.130.47
Aquatic ecotoxicityKg TEG water231,588.2735,152.98126,571.60
Terrestrial EcotoxicityKg TEG soil29,304.284483.8016,145.65
Terrestrial acid/nutriaKg SO2 equivalent742.12113.38408.17
Land occupationm2org.arable97.9014.8353.42
Aquatic acidificationKg SO2 equivalent102.7815.7056.53
Aquatic eutrophicationKg PO4 P-lim1.390.210.76
Global warmingKg CO2 equivalent2295.34354.181275.13
Non-renewable energyMJ primary34,569.905353.0419,272.15
Mineral extractionMJ surplus165.0125.0590.18
Note: C2H3Cl Vinyl chloride; PM Particulate matter; CFC chlorofluorocarbons; TEG Triethylene glycol; C2H4 Ethylene; SO2 Sulphur dioxide; PO4 Phosphate.
Table 2. Percentage share of inputs towards impact categories.
Impact CategoriesSeedPotassium
Fertilizer
Phosphate
Fertilizer
Nitrogen
Fertilizer
PesticideDiesel FuelOn-Farm
Carcinogens0.90.914.064.516.03.70.0
Non-carcinogens4.85.239.431.013.51.64.5
Respiratory inorganics0.01.010.411.95.61.070.1
Ionizing radiation1.61.134.723.322.017.30.0
Ozon layer depletion0.50.03.25.484.46.50.0
Respiratory organics1.02.012.433.421.030.20.0
Aquatic ecotoxicity2.91.153.322.117.63.00.0
Terrestrial Ecotoxicity9.01.030.036.017.75.01.3
Terrestrial acid/nutria0.70.02.32.71.30.093.0
Land occupation39.015.037.05.04.00.00.0
Aquatic acidification0.01.05.06.03.00.085.0
Aquatic eutrophication0.01.564.511.820.22.00.0
Global warming1.12.515.045.012.03.421.0
Non-renewable energy1.01.415.036.417.628.60.0
Mineral extraction1.01.039.046.013.00.00.0
Table 3. Normalized damage for different input consumptions.
Damage CategoriesSeedPotassium
Fertilizer
Phosphate
Fertilizer
Nitrogen
Fertilizer
PesticideDiesel FuelOn-Farm
Human health0.00450.00540.09890.12770.05510.01150.5964
Eco systems0.00460.00140.00950.00870.00390.00110.0527
Climate change0.00250.00280.03730.10020.03160.00940.0481
Resources0.00180.00180.03410.08600.03890.06600.0000
Table 4. Description of production indices calculated by various IA methods.
IAGWP (Kg CO2 eq)OLP (Kg CFC-11 eq)
CML-IA baseline3134.386.40 × 10−4
EDIP 20033134.446.40 × 10−4
EDP (2013)3134.386.40 × 10−4
ILCD 2011 Midpoint3135.256.40 × 10−4
IMPACT 2002+ *2295.346.40 × 10−4
* This IA method was considered in this study.
Table 5. The environmental impact mitigation through the reduction of nitrogen-based fertilizers.
Impact CategoriesUnitsThe Characterization Based on the Various Scenarios
Current5% N-Based Fertilizer Reduction10% N-Based Fertilizer Reduction20% N-Based Fertilizer Reduction50% N-Based Fertilizer Reduction100% N-Based Fertilizer Reduction
CarcinogensKg C2H3Cl equivalent87.2484.4281.5875.9258.9330.61
Non-carcinogensKg C2H3Cl equivalent48.6747.8146.9445.2039.9931.31
Respiratory inorganicsKg PM2.5 equivalent8.568.247.917.265.312.06
Ionizing radiationBq C-14 equivalent20,111.0419,879.3319,647.3419,183.5617,792.2215,473.33
Ozon layer depletionKg CFC-11 equivalent6.40 × 10−46.39 × 10−46.38 × 10−46.34 × 10−46.24 × 10−46.07 × 10⁻⁴
Respiratory organicsKg C2H4 equivalent0.840.830.820.790.700.56
Aquatic ecotoxicityKg TEG water231,588.27229,090.20226,589.10221,589.20206,589.50181,589.90
Terrestrial EcotoxicityKg TEG soil29,304.2828,749.870.8227,085.2023,756.3318,208.22
Terrestrial acid/nutriaKg SO2 equivalent742.12707.41672.70603.28395.0247.92
Land occupationm2org.arable97.9097.6497.3696.8295.1892.45
Aquatic acidificationKg SO2 equivalent102.7898.2893.7784.7757.7712.76
Aquatic eutrophicationKg PO4 P-lim1.391.381.371.361.311.24
Global warmingKg CO2 equivalent2295.342245.792196.182097.011799.501303.66
Non-renewable energyMJ primary34,569.9033,920.6233,270.5731,971.0528,072.4721,574.85
Mineral extractionMJ surplus165.01161.24157.46149.9127.2389.45
Publisher’s Note: MDPI stays neutral with regard to jurisdictional claims in published maps and institutional affiliations.

