Article

Statistical Modelling of the Market Value of Dwellings, on the Example of the City of Kraków

by
Elżbieta Jasińska
and
Edward Preweda
*
Department of Integrated Geodesy and Cartography, AGH University of Science and Technology, 30-059 Krakow, Poland
*
Author to whom correspondence should be addressed.
Sustainability 2021, 13(16), 9339; https://doi.org/10.3390/su13169339
Submission received: 3 July 2021 / Revised: 9 August 2021 / Accepted: 16 August 2021 / Published: 20 August 2021

Abstract

:
The analysis of a city’s spatial development, in terms of a location that meets the needs of its inhabitants, requires many approaches. The preliminary assessment of the collected material showed that there was real estate in the database whose price did not have market characteristics. For the correct formulation of the valuation model, it is necessary to detect and eliminate or reduce the impact of these properties on the valuation results. In this study, multivariate analysis was used and three methods of detecting outliers were verified. The database of 8812 residential premises traded on the primary market in Kraków was analyzed. In order to detect outliers, the following indices were determined: projection matrix, Mahalanobis distances, standardized chi test and Cook distances. Critical values were calculated based on the formulas proposed in the publication. The probability level was P = 0.95. The article shows that the selected methods of eliminating outliers—the methods of standardized residuals and the Cook’s distance method give similar regression models. Further analysis (with the use of classification tree methods) made it possible to distinguish zones that are homogeneous in terms of price dispersion. In these zones, a set of features influencing real estate prices were determined.

1. Introduction

Kraków is the second largest city in Poland by population and is undergoing a housing boom, particularly in apartment development. It is an important centre in Poland for many sectors of the economy, including higher education, start-ups, outsourcing, business, tourism and culture. The motive of some of the purchasers of apartments is to derive income from renting, attracted by its high profitability compared to low-interest bank deposits. The average rental yield was over three times higher than that gained from bank deposits. Today, the real estate market is facing the COVID-19 (coronavirus) pandemic that has been ongoing for several months [1]. The tourism industry has been particularly affected by the pandemic, which has meant that private short-term rentals have suffered [2]. Long-term rentals have also deteriorated because of the increasing popularity of remote learning and working. Rental prices in large agglomerations have decreased significantly. Most of the apartments for rent are empty so their owners often consider selling. Thus, the supply on the secondary market is increasing [1].
The housing market provides random information. Random factors disaggregate into the type of characteristics that shape the market value, which obliges the application of statistical rules. One of these features is the location of the property [3]. The work in the present paper characterizes the original market of residential real estate in Kraków. The research, covering the period 2015–2019, aims to determine the market processes in 18 districts of the city (Figure 1).
One of the most important market process is to estimate the value of real estate in individual city zones. Short descriptions of the zones are written below (based on [5] and subpages linked in the text on this website).
District I, Stare Miasto (English name: the Old Town) is the oldest district of Krakow, the heart of the city. Because of the large number of monuments, there is the greatest tourist traffic here. The district has been inscribed on the UNESCO World Heritage List. The Old Town is also the center of entertainment and cultural events in Krakow. There are many clubs, pubs, cafes and restaurants around the Main Square. In the Old Town, there is the Regional Bus Station and the Main Railway Station. Apartments in this district are among the most expensive in the Krakow real estate market.
District II Grzegórzki (English name is not used)—a small district next to the Old Town from the east. The construction of Grzegórzki is extremely diverse. There are many historic buildings on their premises. The area in the center of Krakow attracts more residents and developers who introduce modern buildings to the district. The biggest disadvantages of the district, apart from high prices, include too fast development and traffic jams at rush hour in some regions. However, this does not adversely affect the popularity of Grzegórzki. The prices of apartments in this district are in third place, right after the Old Town and Zwierzyniec.
III Prądnik Czerwony—next to Grzegórzki and the Old Town, it is in Śródmieście, the former district of the city. It is located close to the center, but away from the hustle and bustle of the city. High residential buildings and modern office buildings dominate here, with lower buildings in several places. There are many green and recreational areas in Prądnik Czerwony. The district is very well connected to the center of Krakow. The biggest disadvantages of the district are traffic jams and air quality. Despite this, Prądnik Czerwony is very popular among both people looking for a flat and developers. Prices in the district are lower compared to other districts of Krakow, and the location is exceptionally favorable.
IV Prądnik Biały—the most populous district of Krakow in the city’s north. It is one of the most dynamically developing districts of Krakow. Every year there are more and more housing investments in its area. Prądnik Biały used to be the bedroom of Krakow, now it is becoming one of the most modern districts. There are many green areas in the district where the residents like to spend their time. Unfortunately, there are also exit streets to other cities, which increase the volume of traffic. This has a negative impact on the air quality, which frequently exceeds the dust norms. For some, Prądnik Biały may also be too quiet a district, as there is a shortage of pubs and nightclubs.
V Krowodrza—because of the proximity of the Old Town and the AGH campus, Krowodrza is quite a busy district of Krakow. The nearby Błonia (large grassy area surrounded by bicycle paths) and the beautiful Jordan Park are an ideal place for walks and sports. The district is characterized by a very large number of new residential investments. It is a kind of compromise between the bustling Old Town and the quieter surroundings that are ideal for the elderly and families with children. As a result, real estate prices in Krowodrza are much higher than the average.
VI Bronowice—a sparsely populated district on the outskirts of the city. It is currently one of the most popular districts of Krakow. Residents appreciate this district, it is a more intimate neighborhood, adapted mainly to families with children and people looking for peace. There are many green and recreational places. Unfortunately, the district suffers from an insufficient number of nurseries, kindergartens and cultural centers. In Bronowice, there are both modern apartments in apartment buildings, slightly larger and cheaper premises in blocks of flats, as well as single-family houses. The district is very well connected with the rest of Krakow. VII Zwierzyniec—is one of the greenest, most prestigious and the most beautiful districts of Krakow. In its area there are, among others, two mounds: Kościuszko and Piłsudski, the monastery complex in Salwator, the Zoo, Lasek Wolski and Błonia. The district can boast excellent medical and educational facilities, interesting premises and interesting events. The Zwierzyniec housing estates are very diverse. There are both compact urban buildings, modern blocks and villas. Typically, large-city construction is only found in a small area. Zwierzyniec is the least populated district in Krakow. Apartment prices are second only to the Old Town.
VIII Dębniki—one of the prettier and quieter districts of Krakow. Dębniki is on the southern side of the Vistula River, on which it borders and which separates it from Zwierzyniec and the Old Town. The proximity to the city center makes it an interesting location for living. The air here is much cleaner than in the center of Krakow, which makes it possible to stay outdoors more often. Currently, many new investments, housing estates, educational, entertainment, service and commercial facilities are being built here. The district has a wonderful connection with other districts through many tram and bus lines. Dębniki is one of the most dynamically developing districts of Krakow. Developers currently offer thousands of apartments for sale here.
IX Łagiewniki—Borek Fałęcki—a district known mainly for the Sanctuary of Divine Mercy, to which Catholics make pilgrimages. It is characterized by vast green areas and a recently launched suburban railway. The buildings are diversified, but the farther from the city center, the faster it moves from multi-story apartment blocks to single-family houses.
X Swoszowice—a district built up with single-family houses, and is rather quiet. It is not of particular interest to real estate market participants rather than tourists, although there is a health resort in this district and council flats have been built there in recent years (because of cheap land); it is a district on the border of Krakow.
XIII Podgórze—one of the oldest districts of Krakow, although it was connected to Krakow in 1915. The area of mainly pre-war buildings, modernized over time, supplemented with new facilities in recent years. Next to Kazimierz, it is a painful memory of the Second World War (the forced labor camp in Płaszów, the Kraków Ghetto). It is a well-urbanized area, enabling the use of local transport; it is full of parks (Bednarski Park, Jordan Park) and green areas (the former Korona stadium, area next to Vistula River) and is one of the pleasant parts of Krakow, both for residents and tourists. XI Podgórze Duchackie, XII Bieżanów—Prokocim—two districts built in a similar period (1950–1980 of the 20th century), with the assumption of providing housing facilities for the developing Krakow. They have good public transport and green areas. However, it is mainly about housing estates, not parks. Bieżanów is connected to the city center by a suburban railway, which significantly shortens the transport time.
XIV Czyżyny—there are 5–15-storey multi-family apartment blocks with pure social infrastructure (kindergarten, school, playground, medical clinic, park), as well as the Polish Aviation Museum, which has been open since 2003. The aviation park is a large green area enjoying great popularity by residents. However, recent housing investments are assessed negatively—there is a lack of green areas and parking spaces.
XV Mistrzejowice, XVI Bieńczyce, XVII Wzgórza Krzesławickie—districts of single-family houses with a small share in the Krakow real estate market.
XVIII Nowa Huta—the largest district of Krakow in terms of area. Designed in the 1950s, it is well thought-out for housing. Low (4-storey) blocks are surrounded by advantages of the district, including greenery, very good city communication, parks, a lagoon, green areas. It was once intended to serve the employees of Huta im. Tadeusz Lenin (later Sędzimir). Although it is at a distance from the center of Krakow, it is practically self-sufficient and now and then you hear voices about the proposal to disconnect it from Krakow.
The basic source of data on real estate in Poland is data from the Price Register, but the information contained often requires appropriate analysis before starting the study of statistical relationships [6,7,8]. The analysis is based on data from the Register of Prices. This is a public register which contains data on the prices of immovable property specified in the notarial deeds and the value of the property as estimated by the property valuers. Over 9000 (exactly 9312) residential properties from the primary market were surveyed. 500 were eliminated because of incomplete data (8812 left). The reason for removing the property from the database was the lack of information about the location (25%), transaction date (25%), usable area (20%), and number of rooms or storeys (30%). The preliminary analysis of the collected material showed that the database registered observed values since 2015. Outliers may be caused by errors in the data or may be present because the set contains unusual observations, for example, motions intended for speculative purposes, with very small or very large areas compared to the cut value of the set [9]. A large number of outliers may also indicate incorrect model selection. Methods and estimators based on the assumption of a normal distribution and linear relationships are particularly resistant to outliers, so it is necessary to remove them from the set or minimize their impact [10]. The problem of rejecting outlier properties is not limited only to the study of price volatility, it also finds its way into the analyses of consolidation and replacement of land [11,12]. The identification of outliers was carried out based on the rest of the model [13], using the Mahalanobis distance metric [14,15] and by determining Cook’s distance [16,17]. The Mahalanobis distances were used for real estate market analyses, mainly as a verification of bank portfolios [18,19], however, the authors did not find the application presented in this publication [20,21]. The method of the smallest squares was determined by the regression model for individual districts of the city, before and after the elimination of outlier observations. The regression and classification measures used in the further part of the work confirmed the results of analyses carried out by multiple regression. Hedonic modeling of real estate values is the subject of many studies [22,23,24,25,26]. Some of them concern the detection of outliers with selected methods, e.g., [18,19,20], others use solutions minimizing the impact of outliers [27,28]. A certain gap in the analyzed works is the lack of a precise definition of the criterion allowing for the recognition of the real estate as an outlier. This applies especially to Cook’s distances in real estate market analysis. Based on the Fisher–Snedecor distribution, the authors precisely defined the Cook’s distances criterion.
The article uses 4 methods of detecting outliers; we present them in points 2.2–2.5. Section 2.6 presents classification and regression trees. In Section 3, outliers were identified and C&RT and CHAID tree models were constructed after eliminating outliers from the base. The conclusions can be found in Section 4.

2. Materials and Methods

2.1. Multidimensional Regression

Forecasting the market value of a property is often carried out according to the classic multi-regression model. According to the classic linear regression model, explanatory variables should be correlated with the explained variable and not correlated with each other. For a simple model with one y-explained variable and two explanatory variables, the following dependencies should occur: ( x 1 , x 2 )
cov ( y , x 1 ) 0   cov ( y , x 2 ) 0   cov ( x 1 , x 2 ) = 0
In practice, these assumptions are very rarely met. Real estate data are always correlated to some extent, so regressors are colinear. The variance of each model estimator can be saved as:
V ( b j ) = σ 2 ( 1 r 12 2 ) × i = 1 n ( x i , j x ¯ j ) 2 =   σ 2 ( 1 r 12 2 ) × V j   ( j = 1 2 )
If the explanatory variables of the model are strongly correlated (the correlation coefficient tends to 1), then the estimator variance tends to infinity. Equation (2) can be generalized to multiple explanatory variables. If it is a vector of explanatory variables and a correlation coefficient of the kth regressor with the others, then the variance of the estimator can be saved as: ( x 1 , x 2 , , x k ) r k 2 b k
V ( b j ) = σ 2 ( 1 r j . 2 ) × i = 1 n ( x i , j x ¯ j ) 2 = σ 2 ( 1 r j . 2 ) × V j   ( j = 1 k )
It follows that the variance of the parameter estimator increases with the correlation between the jth regressor and the others and decreases with the variance of the jth variable. In practice, there are often cases where there is a relationship between explanatory variables, but this is not a strictly linear relationship. Then, although the assumptions of the classic linear regression model are met (as we are dealing with a linear relationship, the number of observations must be greater than or equal to the number of parameters derived from the regression analysis, the variance of the residuals, the random component is the same for all observations, there is no autocorrelation of residuals, residuals have a distribution close to the normal distribution, and there is no predictor collinearity) [13,29,30]. There are other problems, the most important of which are two:
  • small changes in the database result in large changes in the value of estimators;
  • regression equation coefficients have large standard deviations, thus they may be statistically insignificant, despite even a high R2 determination factor (together they are relevant).
Both of these problems may be due to outliers in the database. In regression analysis, we mean atypical values of explanatory (independent) variables, unusual values of a dependent variable (explained), or unusual values for both variables. Outliers can be caused by data errors, such as mistakes when entering information in the property price and value register. They may also exist because the database contains unusual observations, for example, properties with very small or very large areas compared to the average value of the set. Methods and estimators based on the assumption of a normal distribution and linear dependencies are particularly resistant to outliers, so it is necessary to remove them from the set or minimize their impact. In the case of linear multidimensional regression, diagnostic tests to detect outliers are most common: standardized model residual analysis, Mahalanobis distance and Cook’s distance. It has been noted that on different databases, these tests detect observations as outliers slightly differently, although all are based on a similar principle.
To detect outliers, descriptive statistics were set out in the first stage, broken down by the district of Krakow (Table 1).
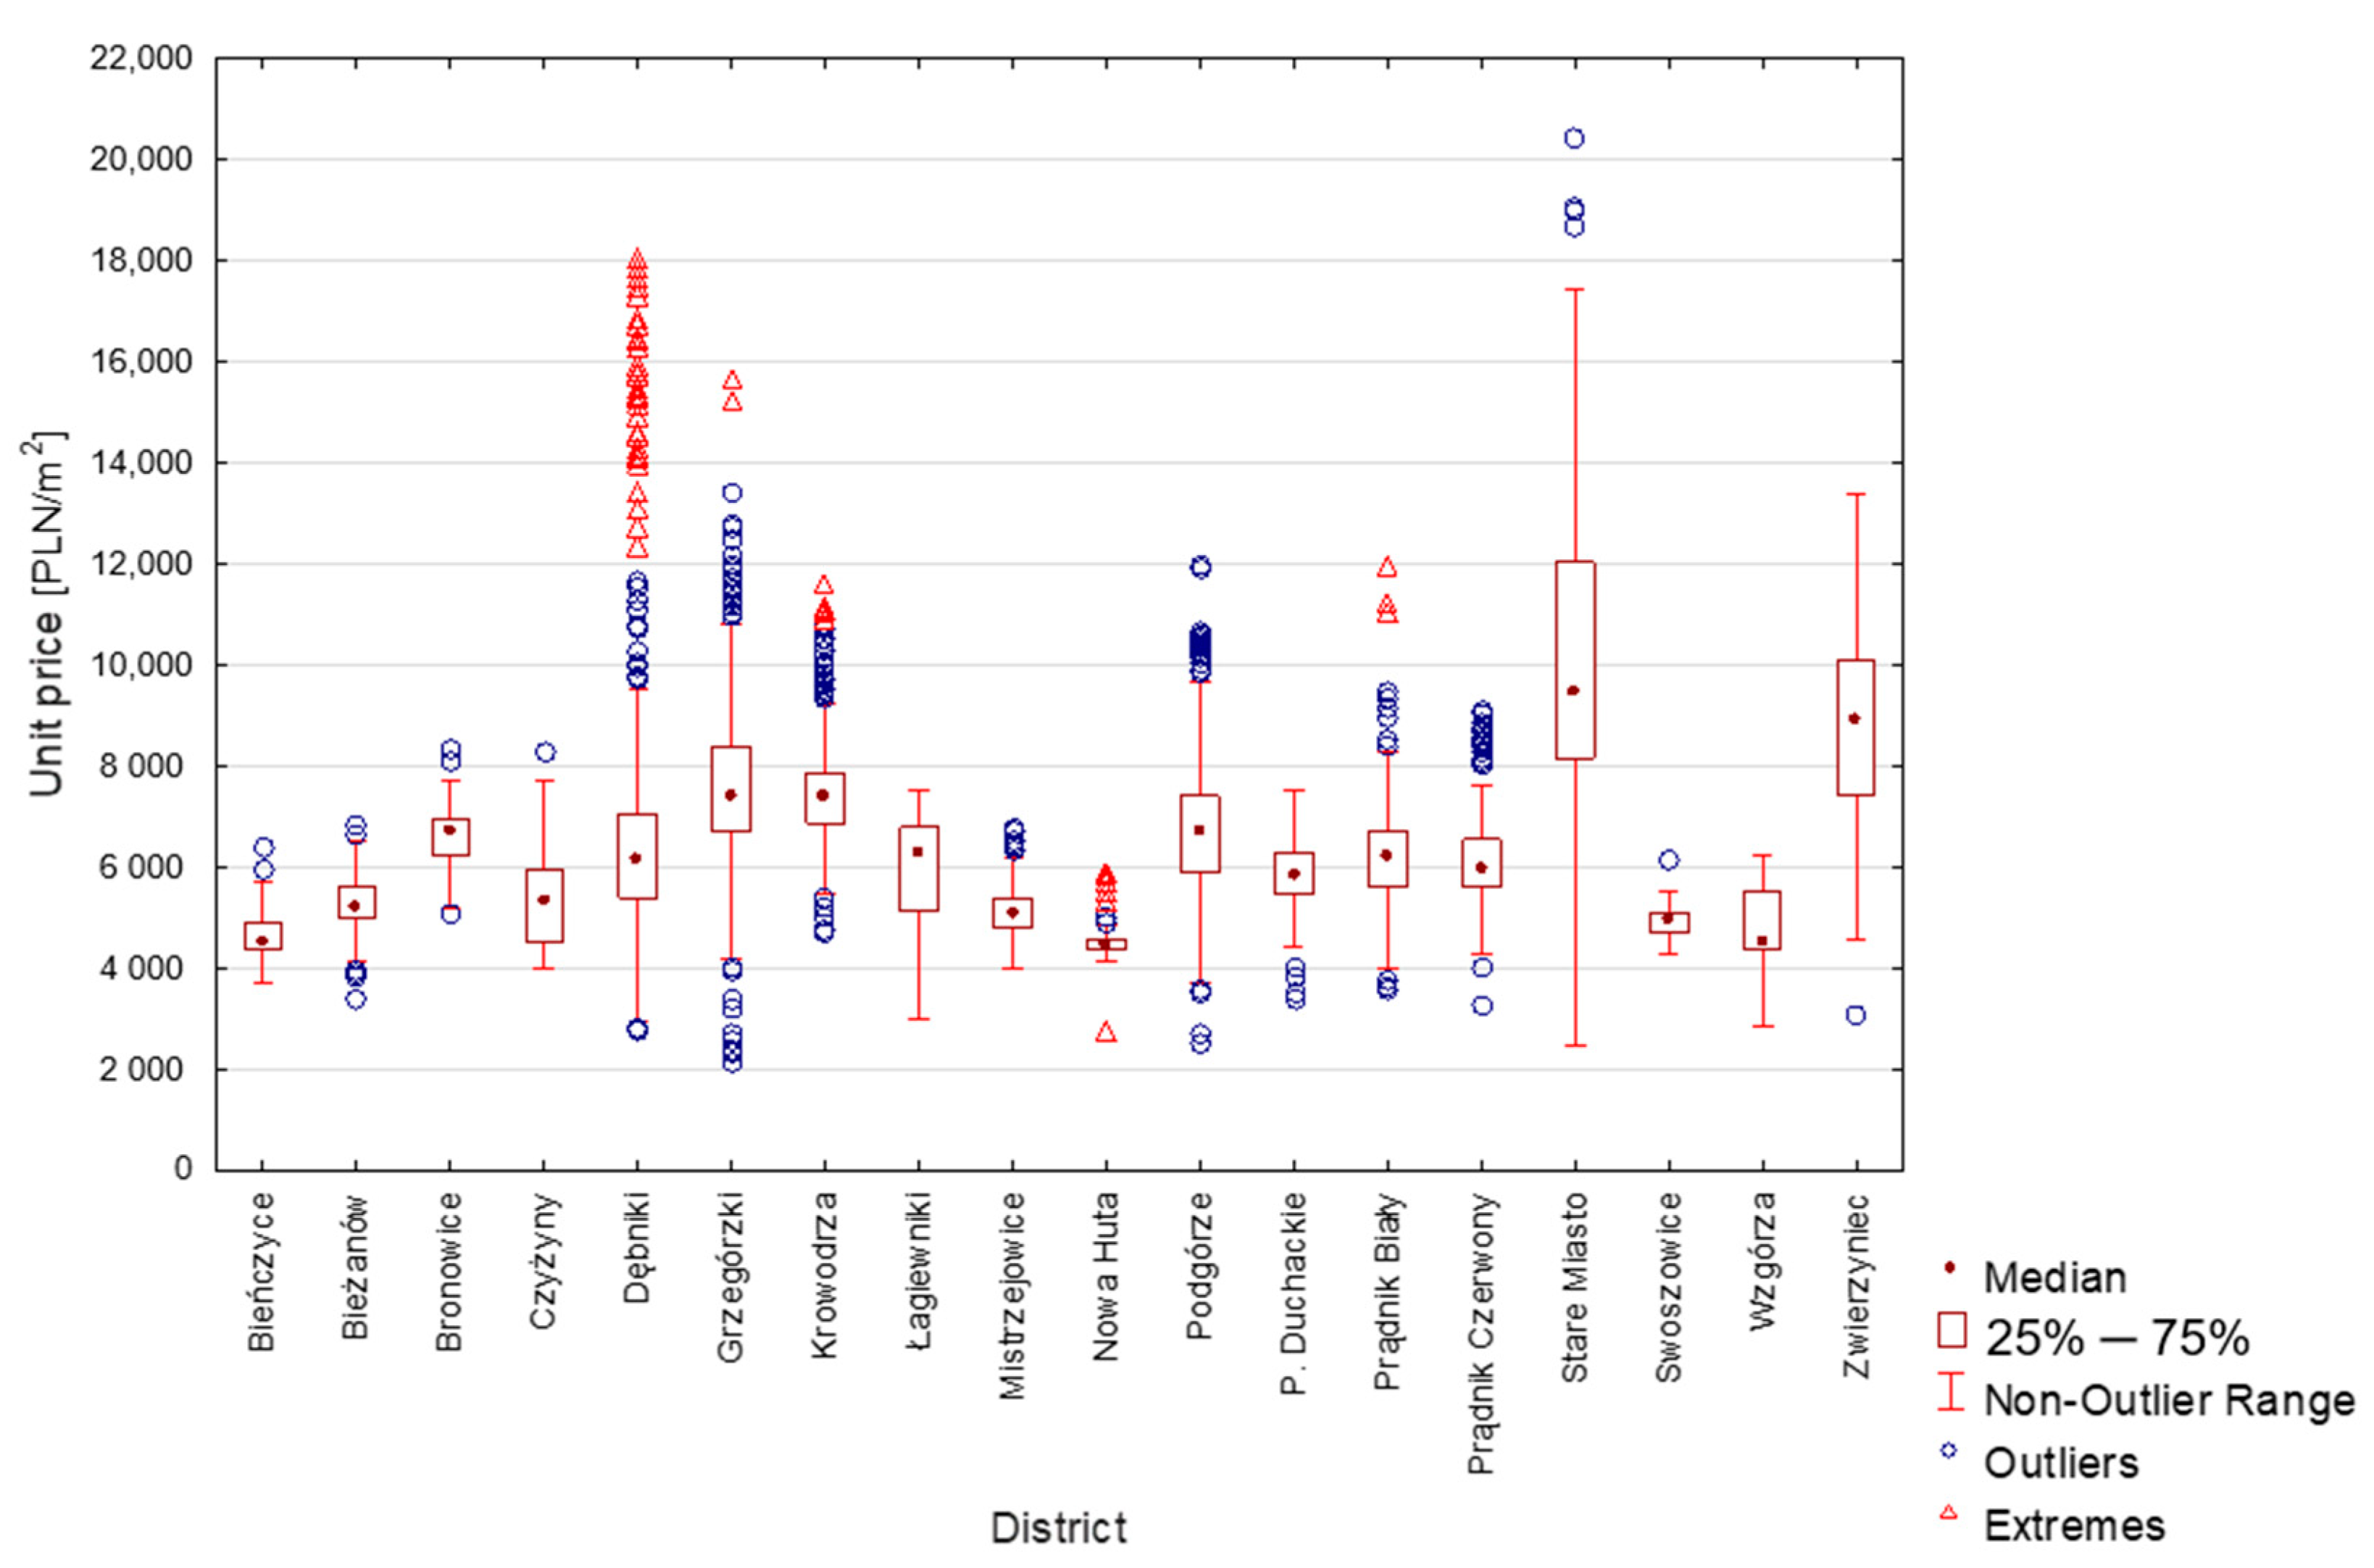
Figure 2 presents the boxplot, presenting information on the location, dispersion and shape of the distribution of data from individual districts of the city.
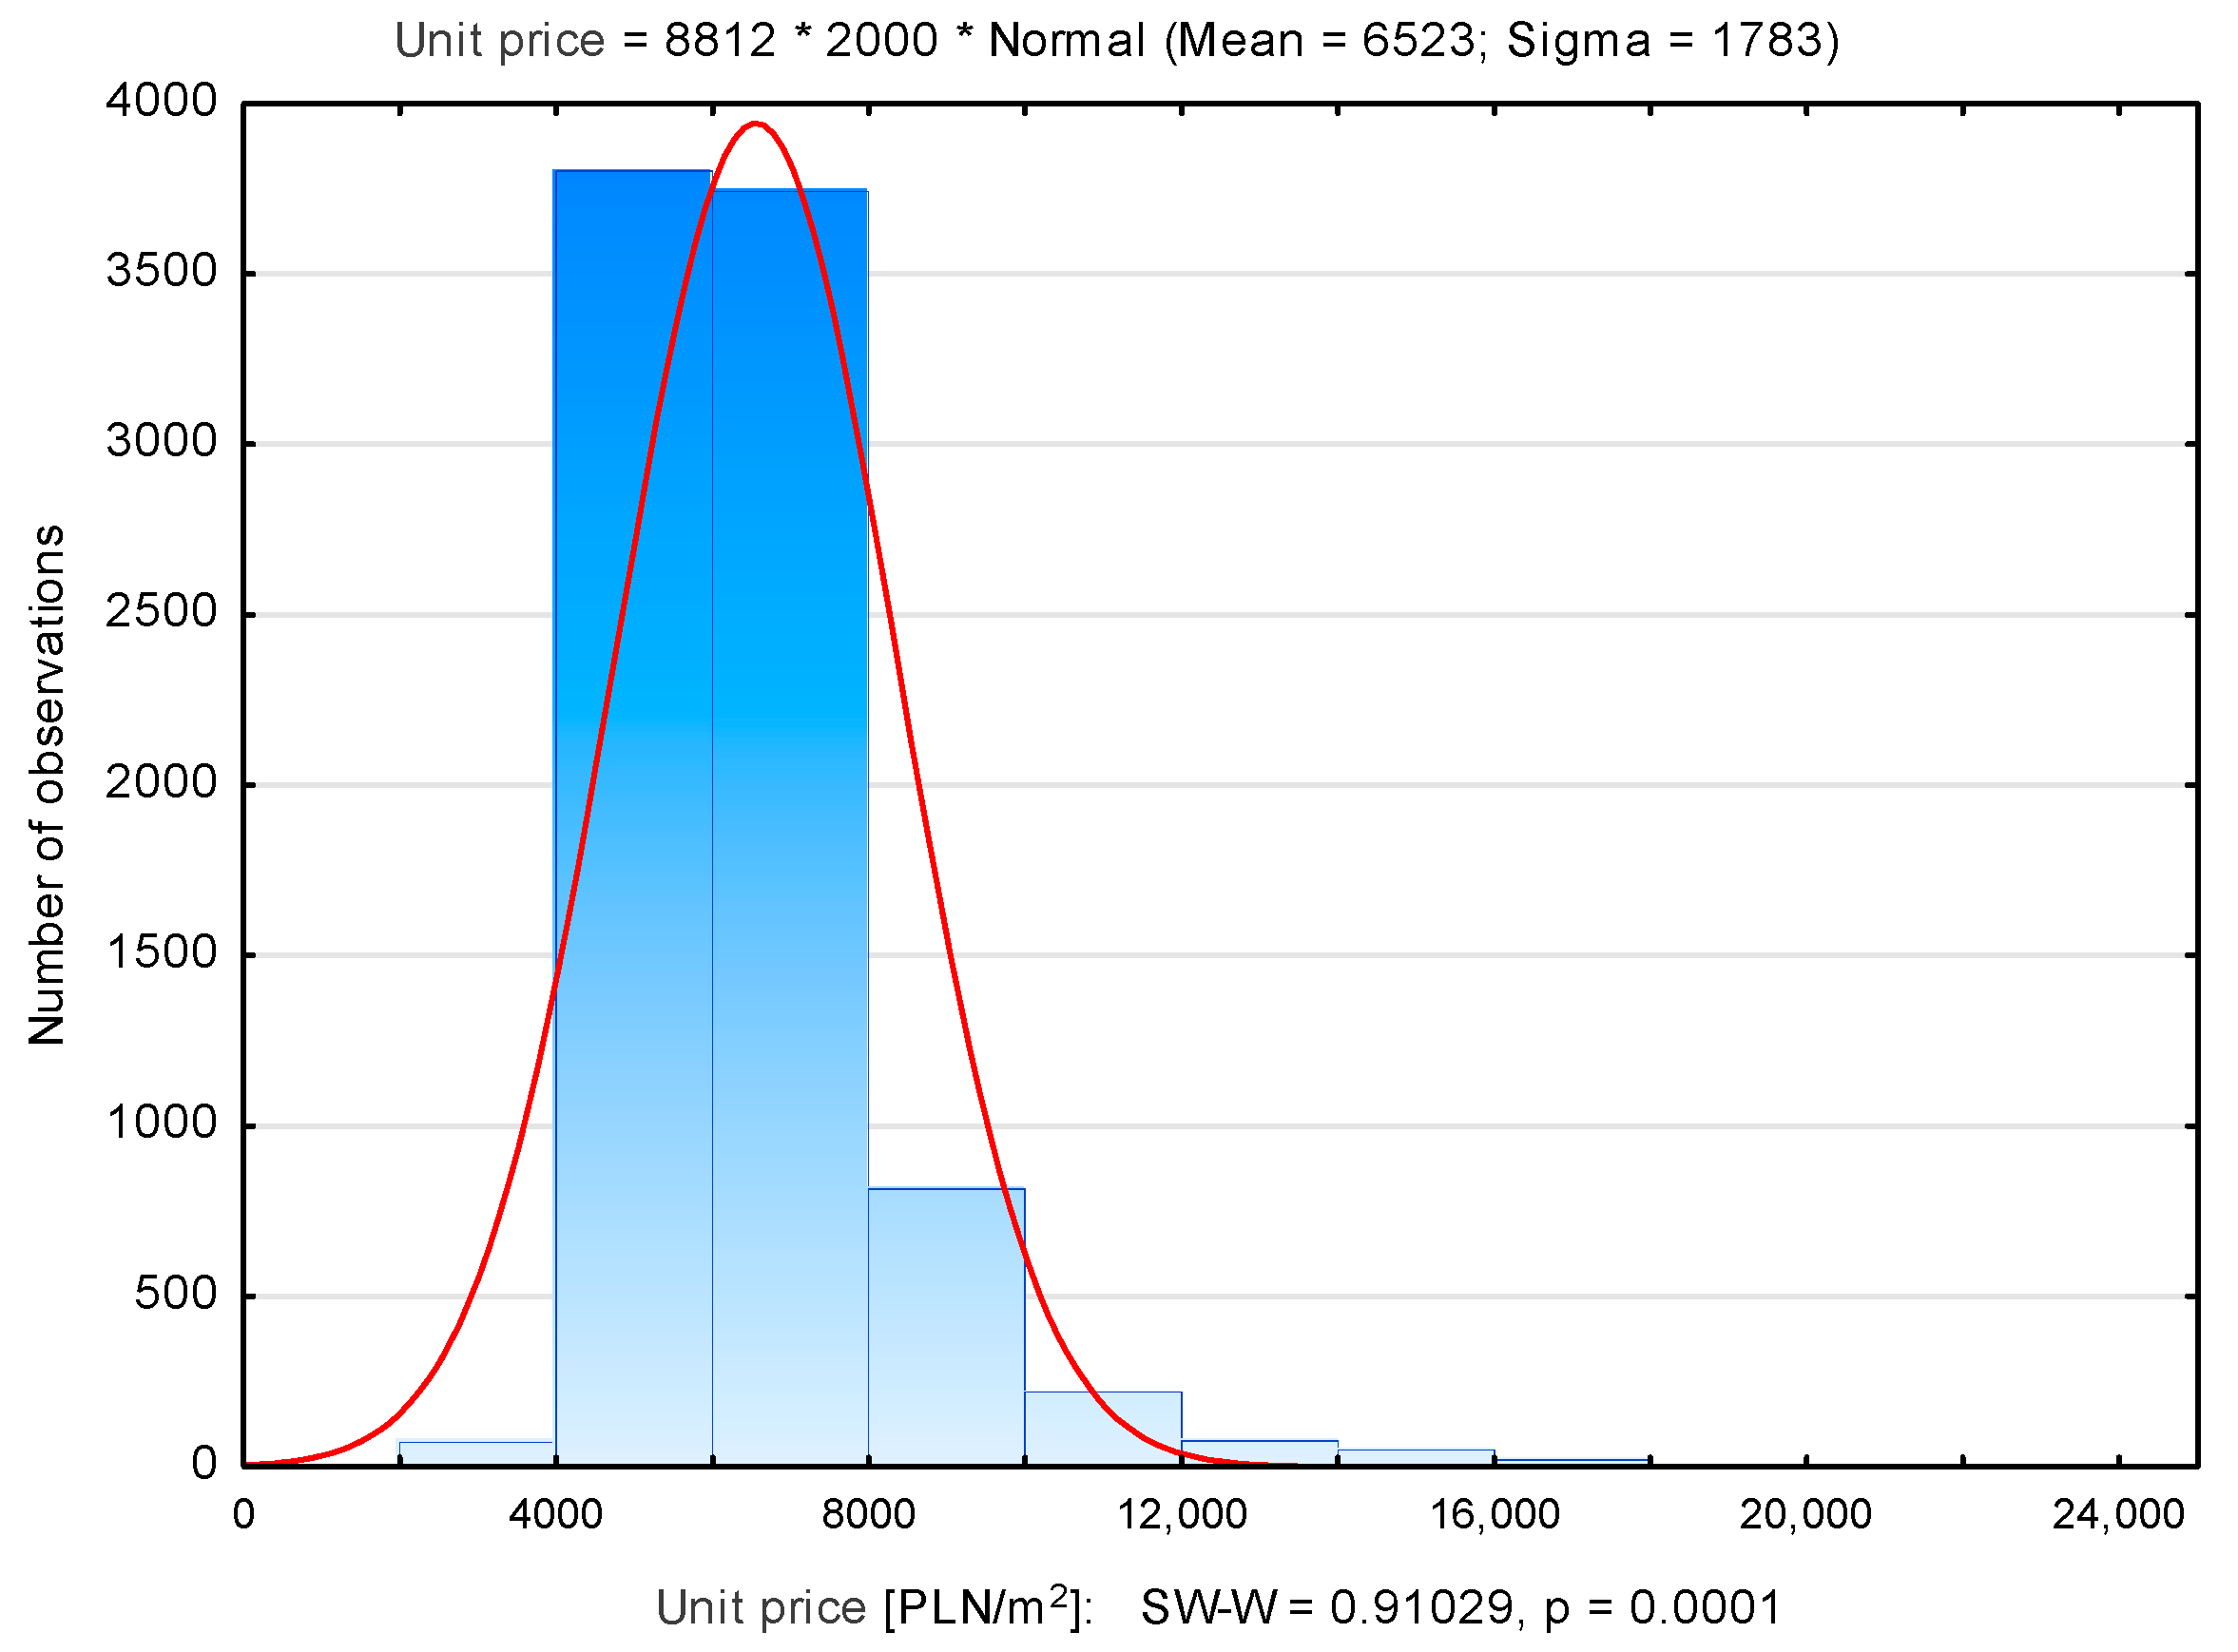
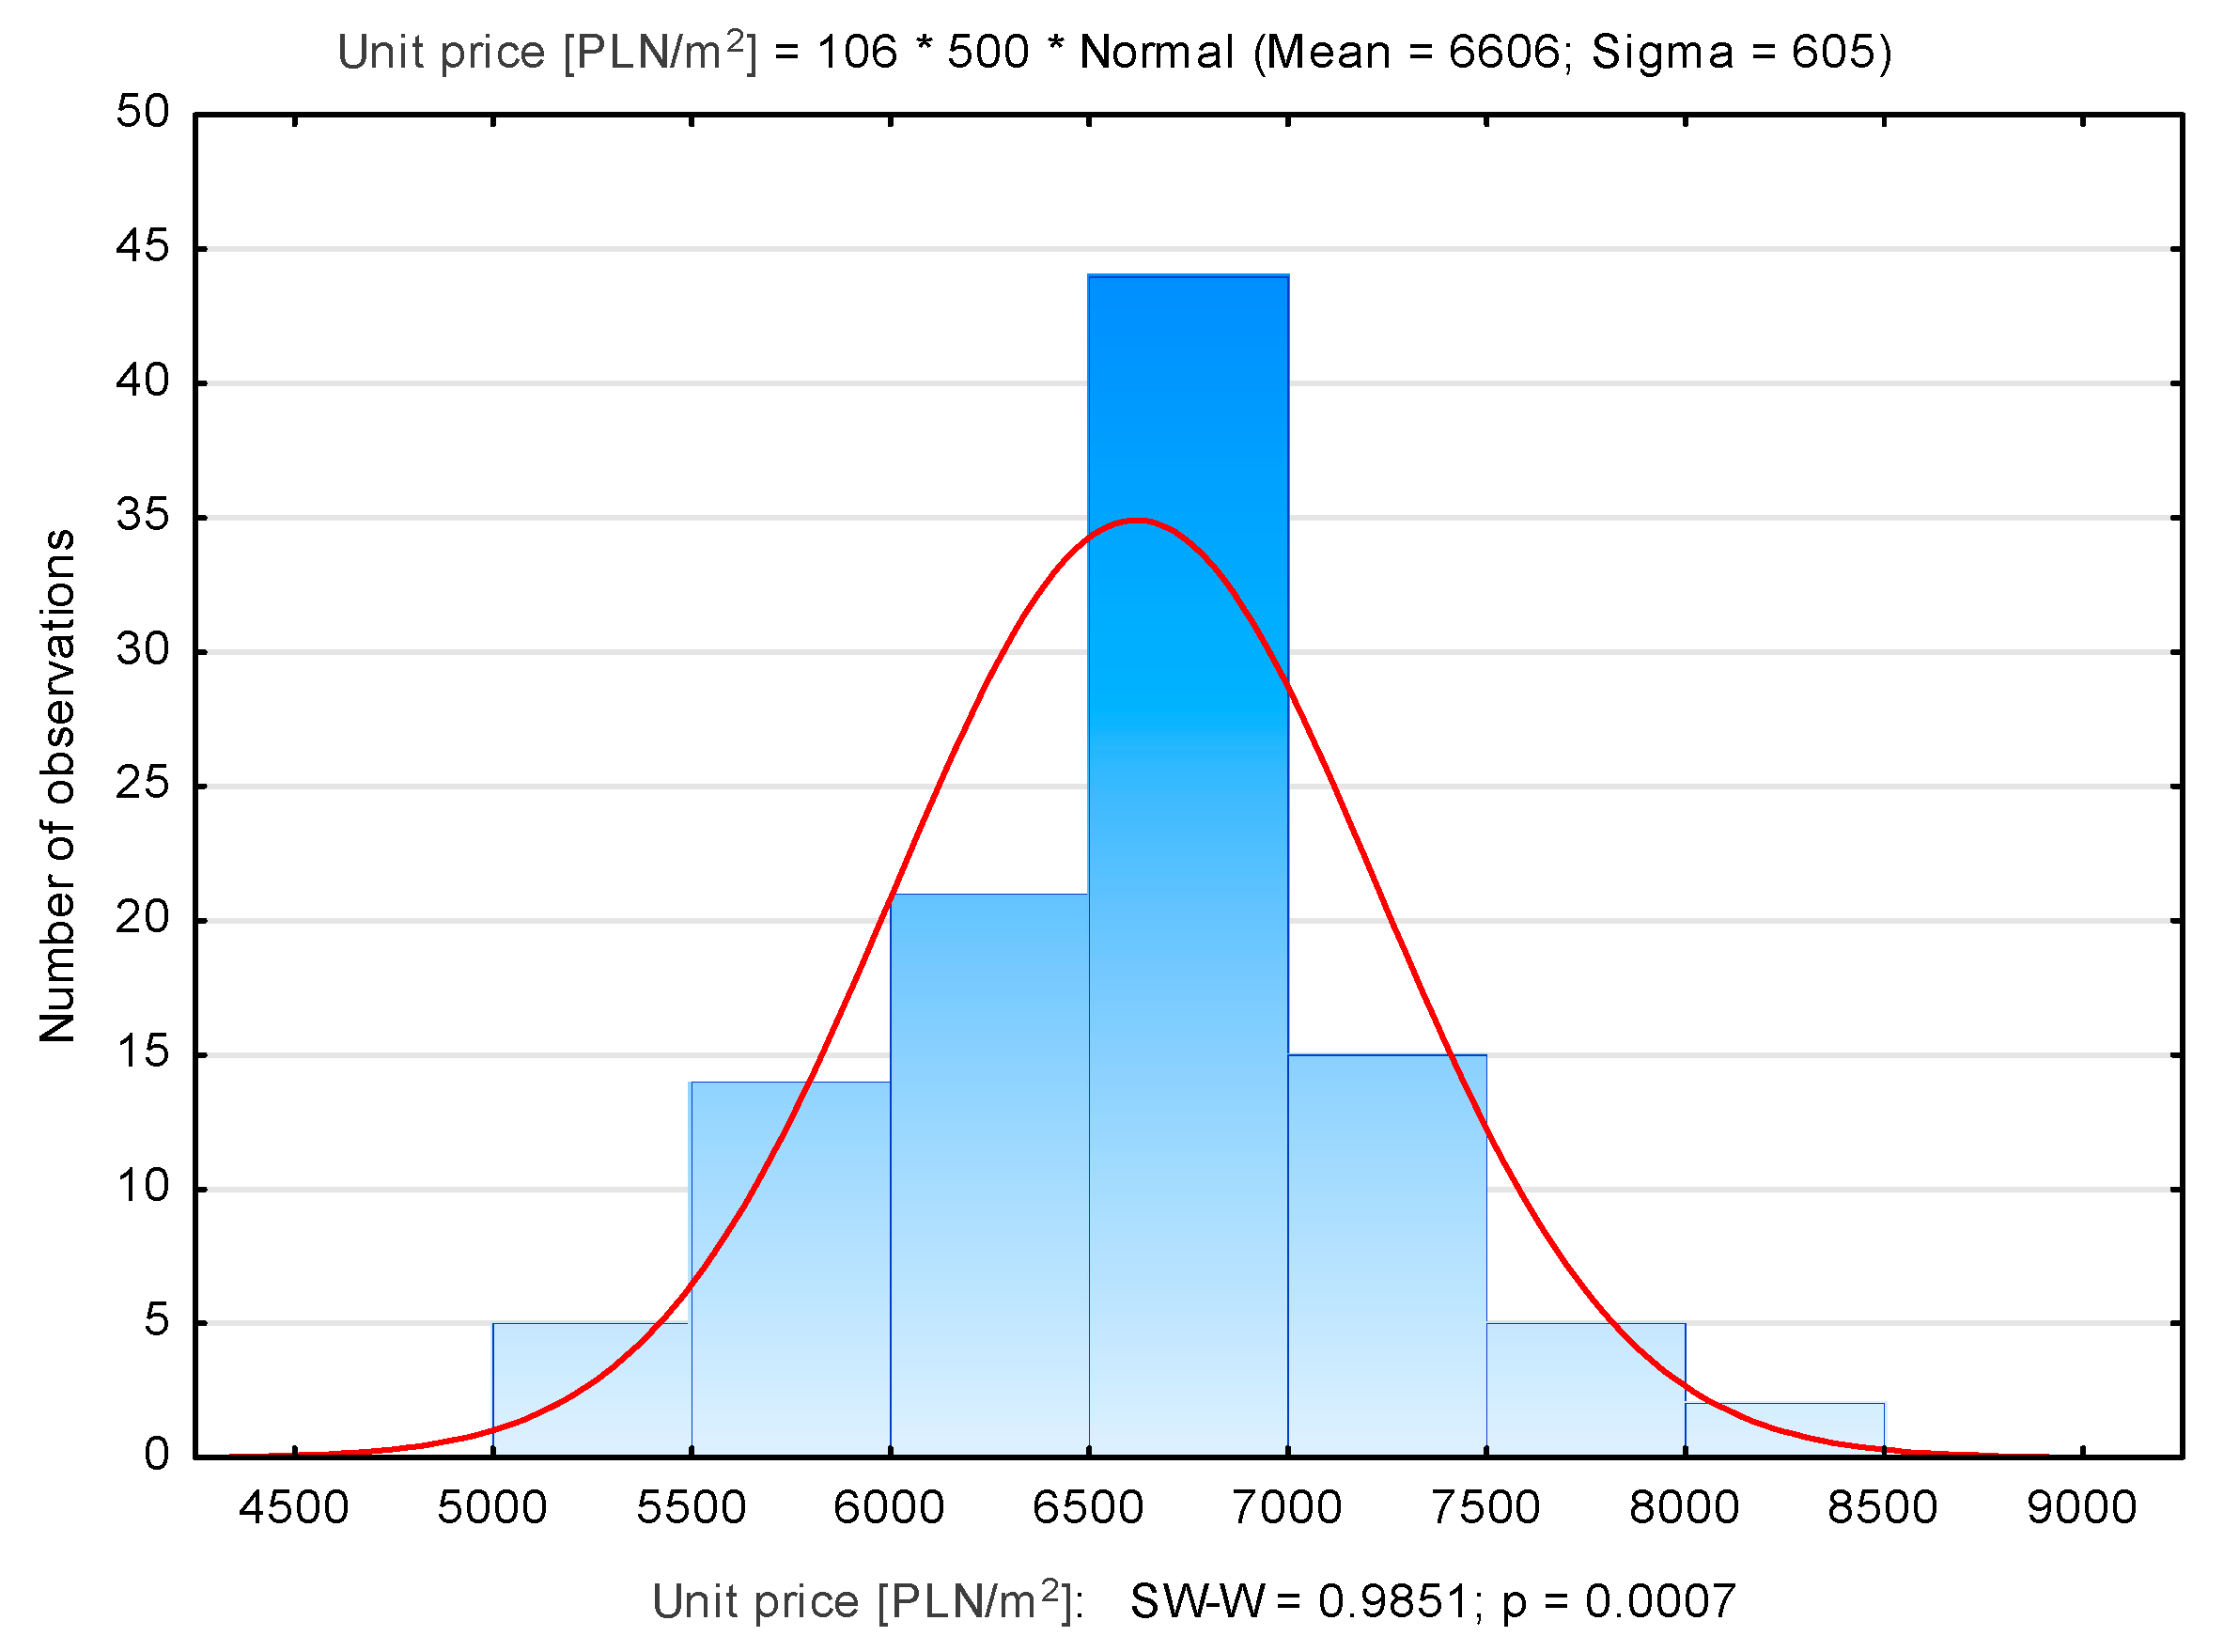
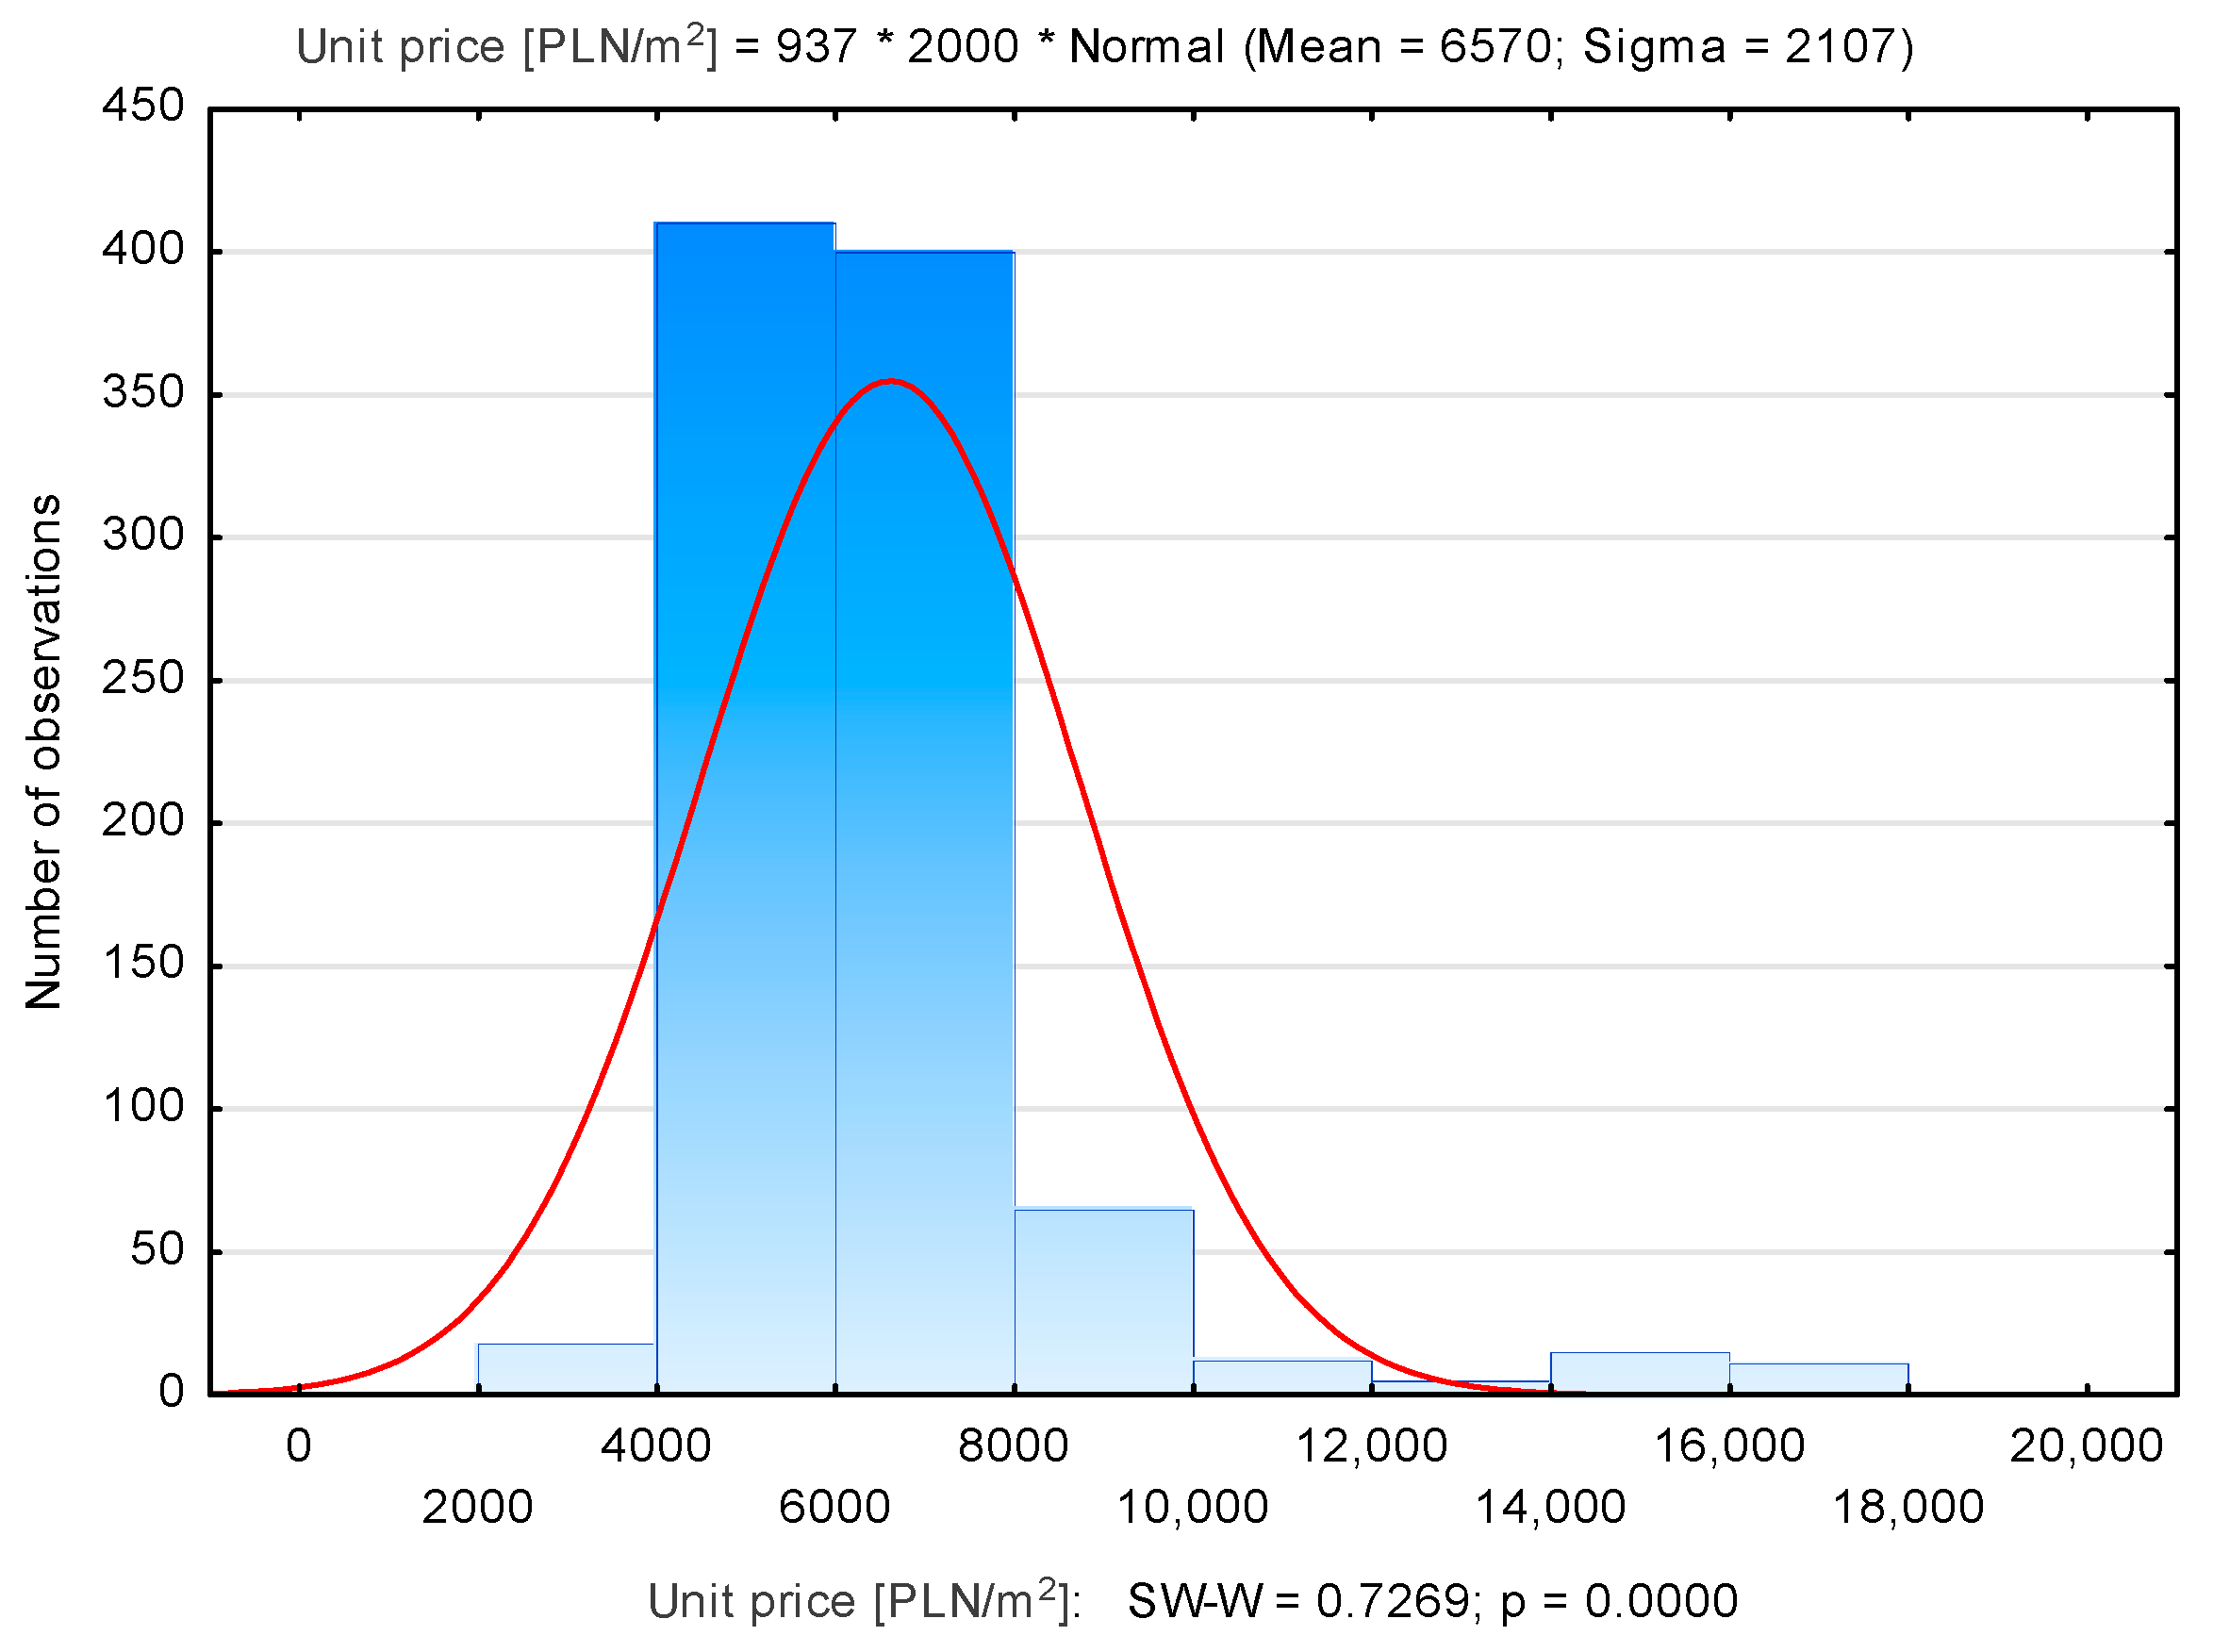
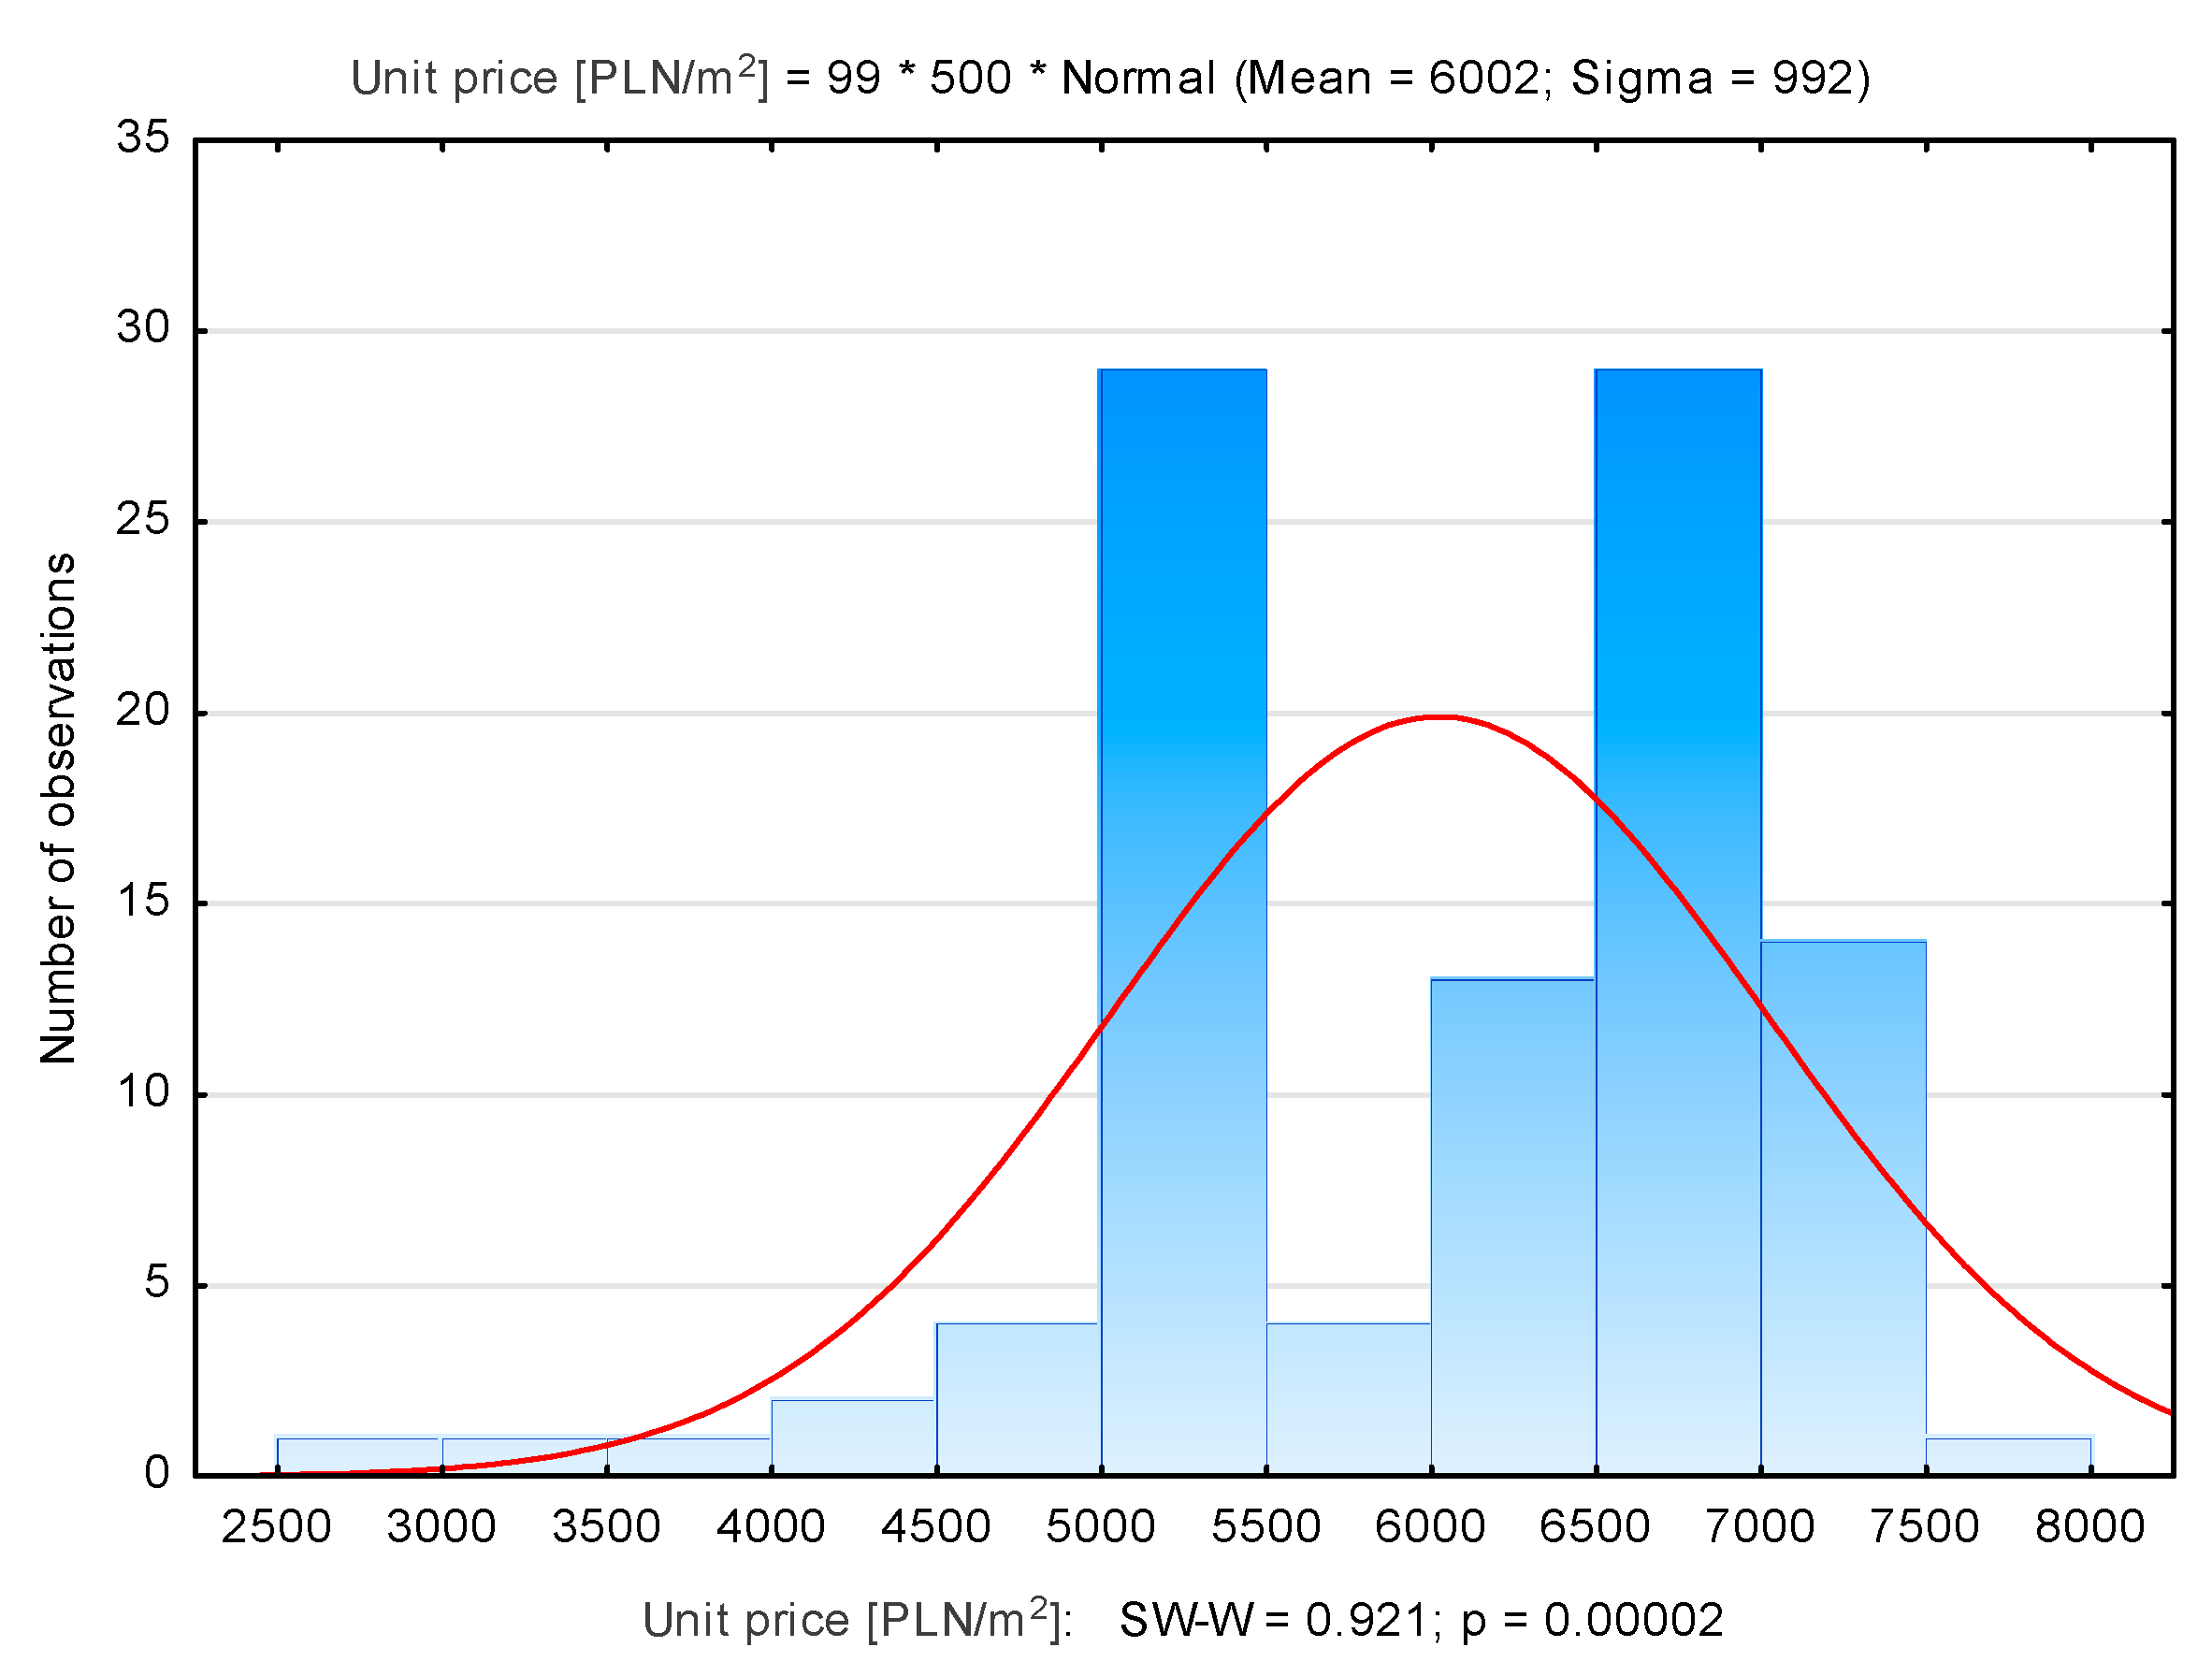
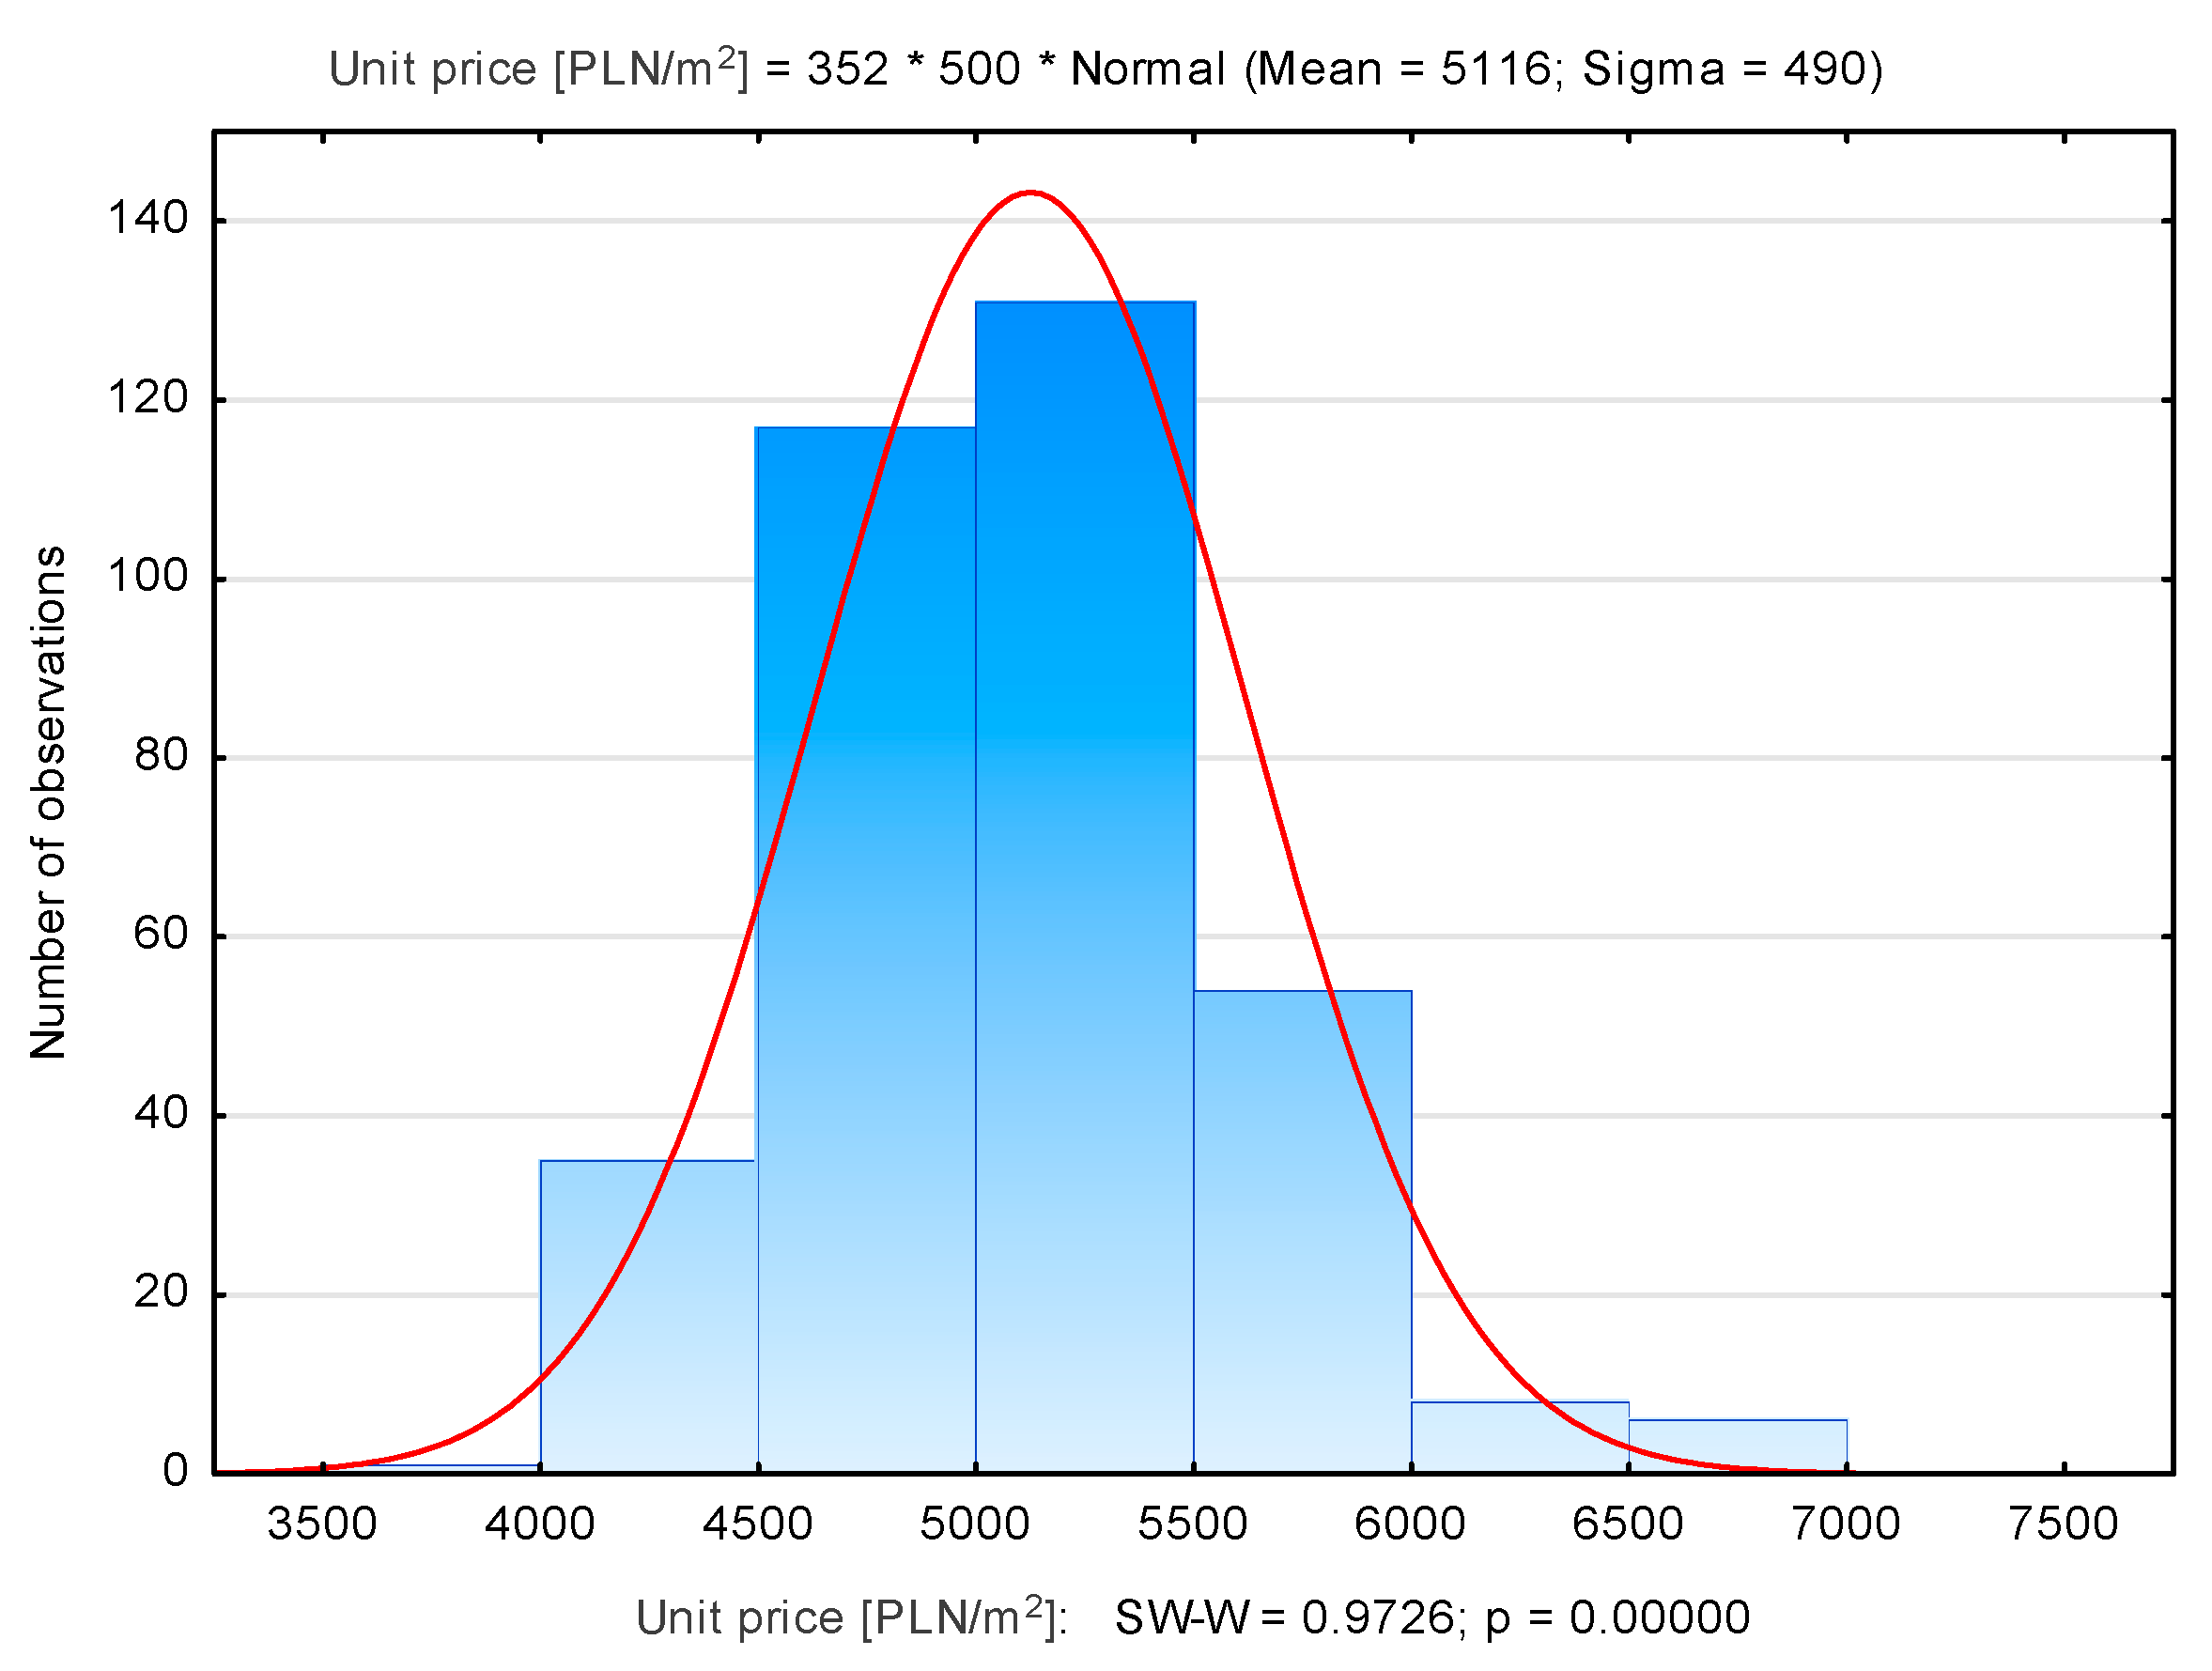
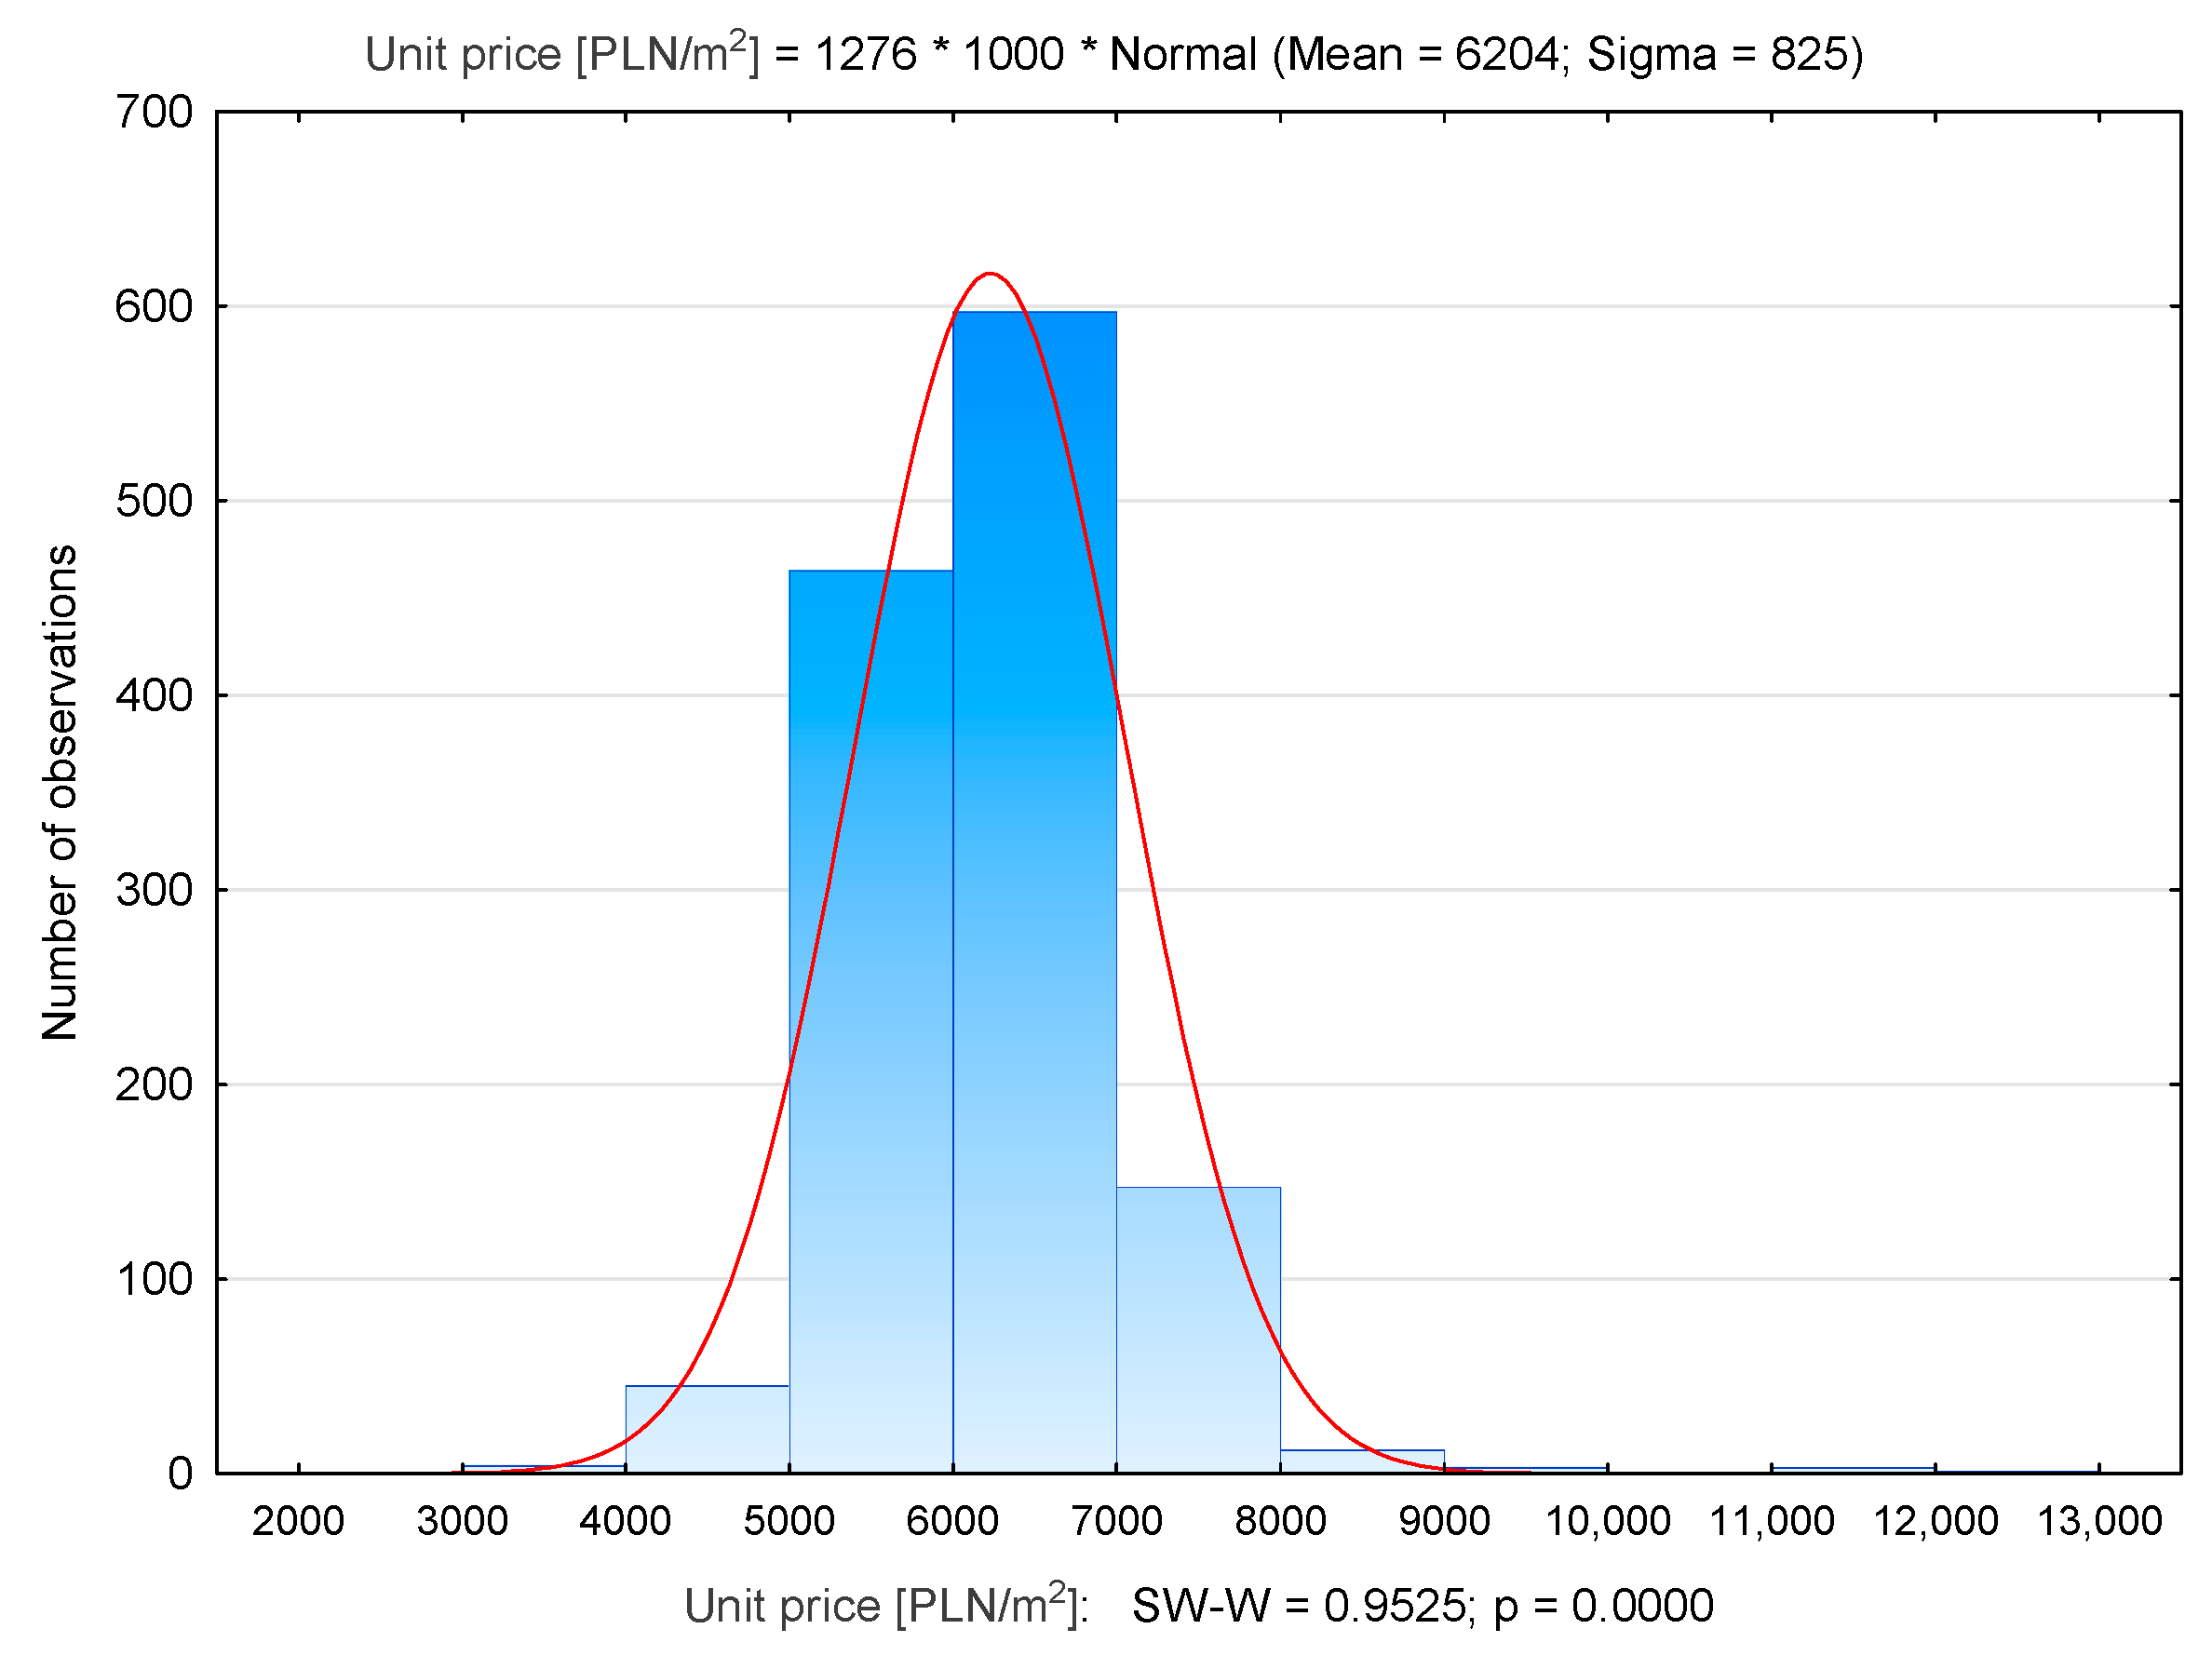
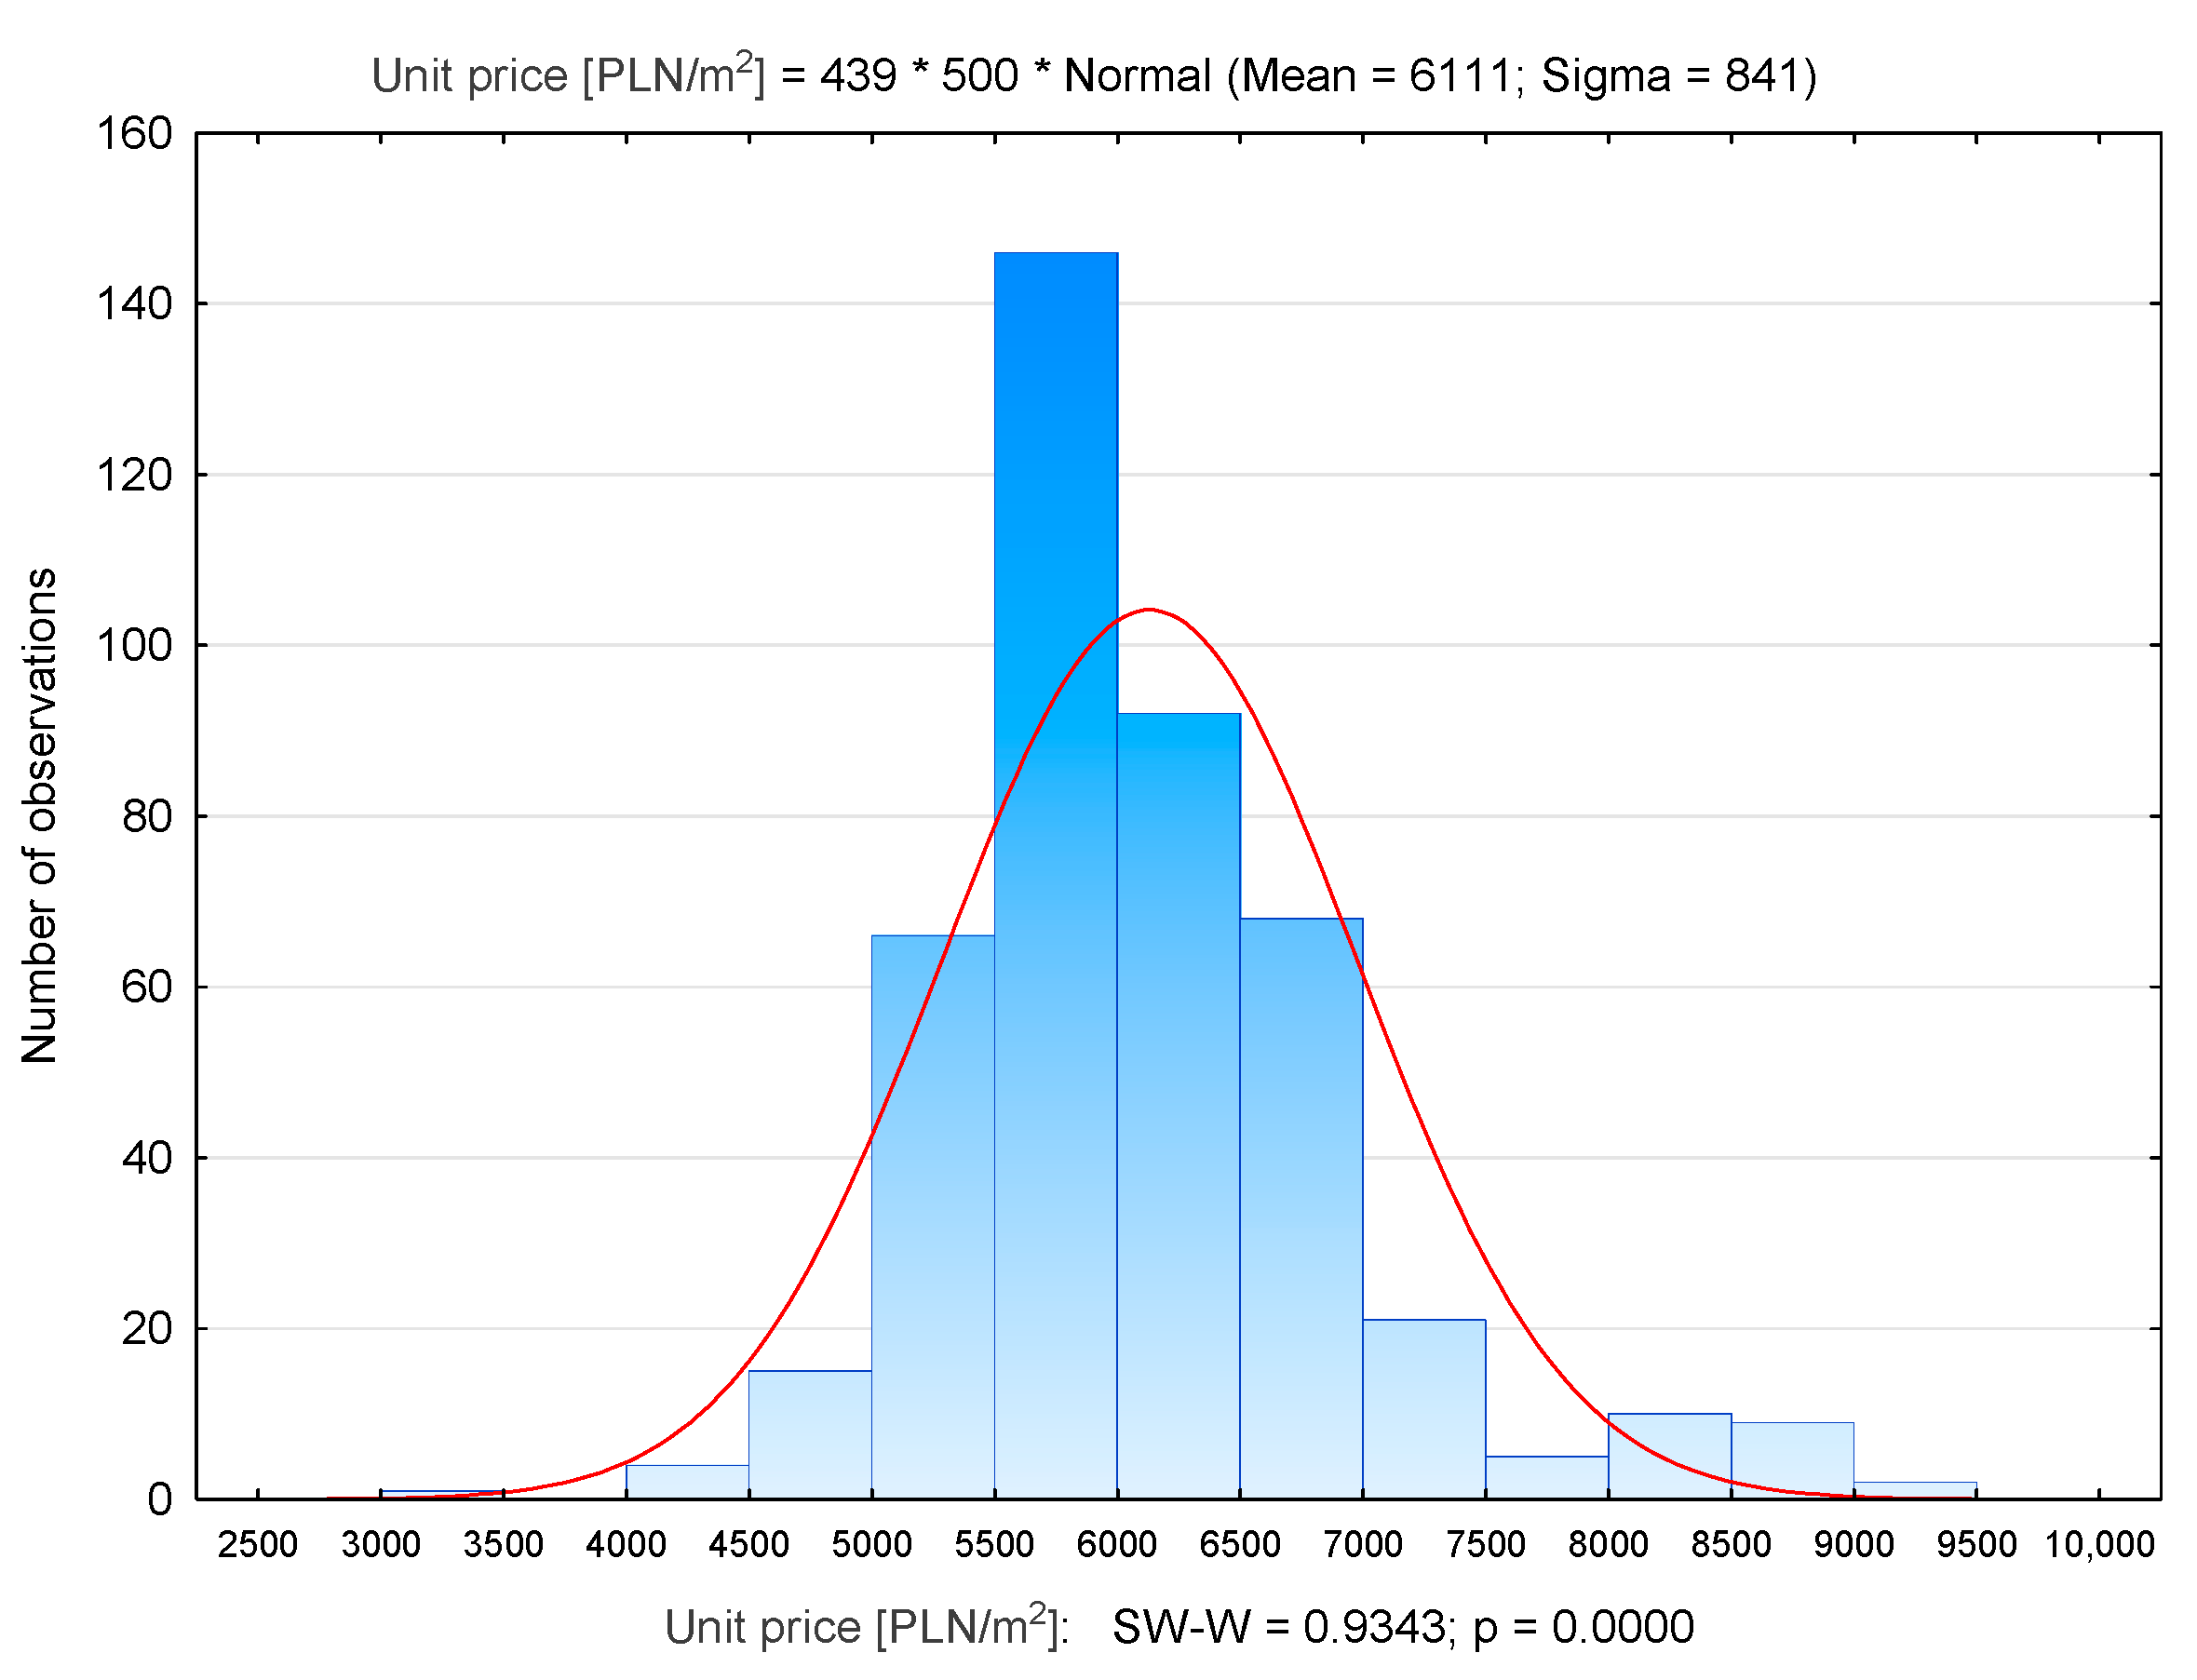
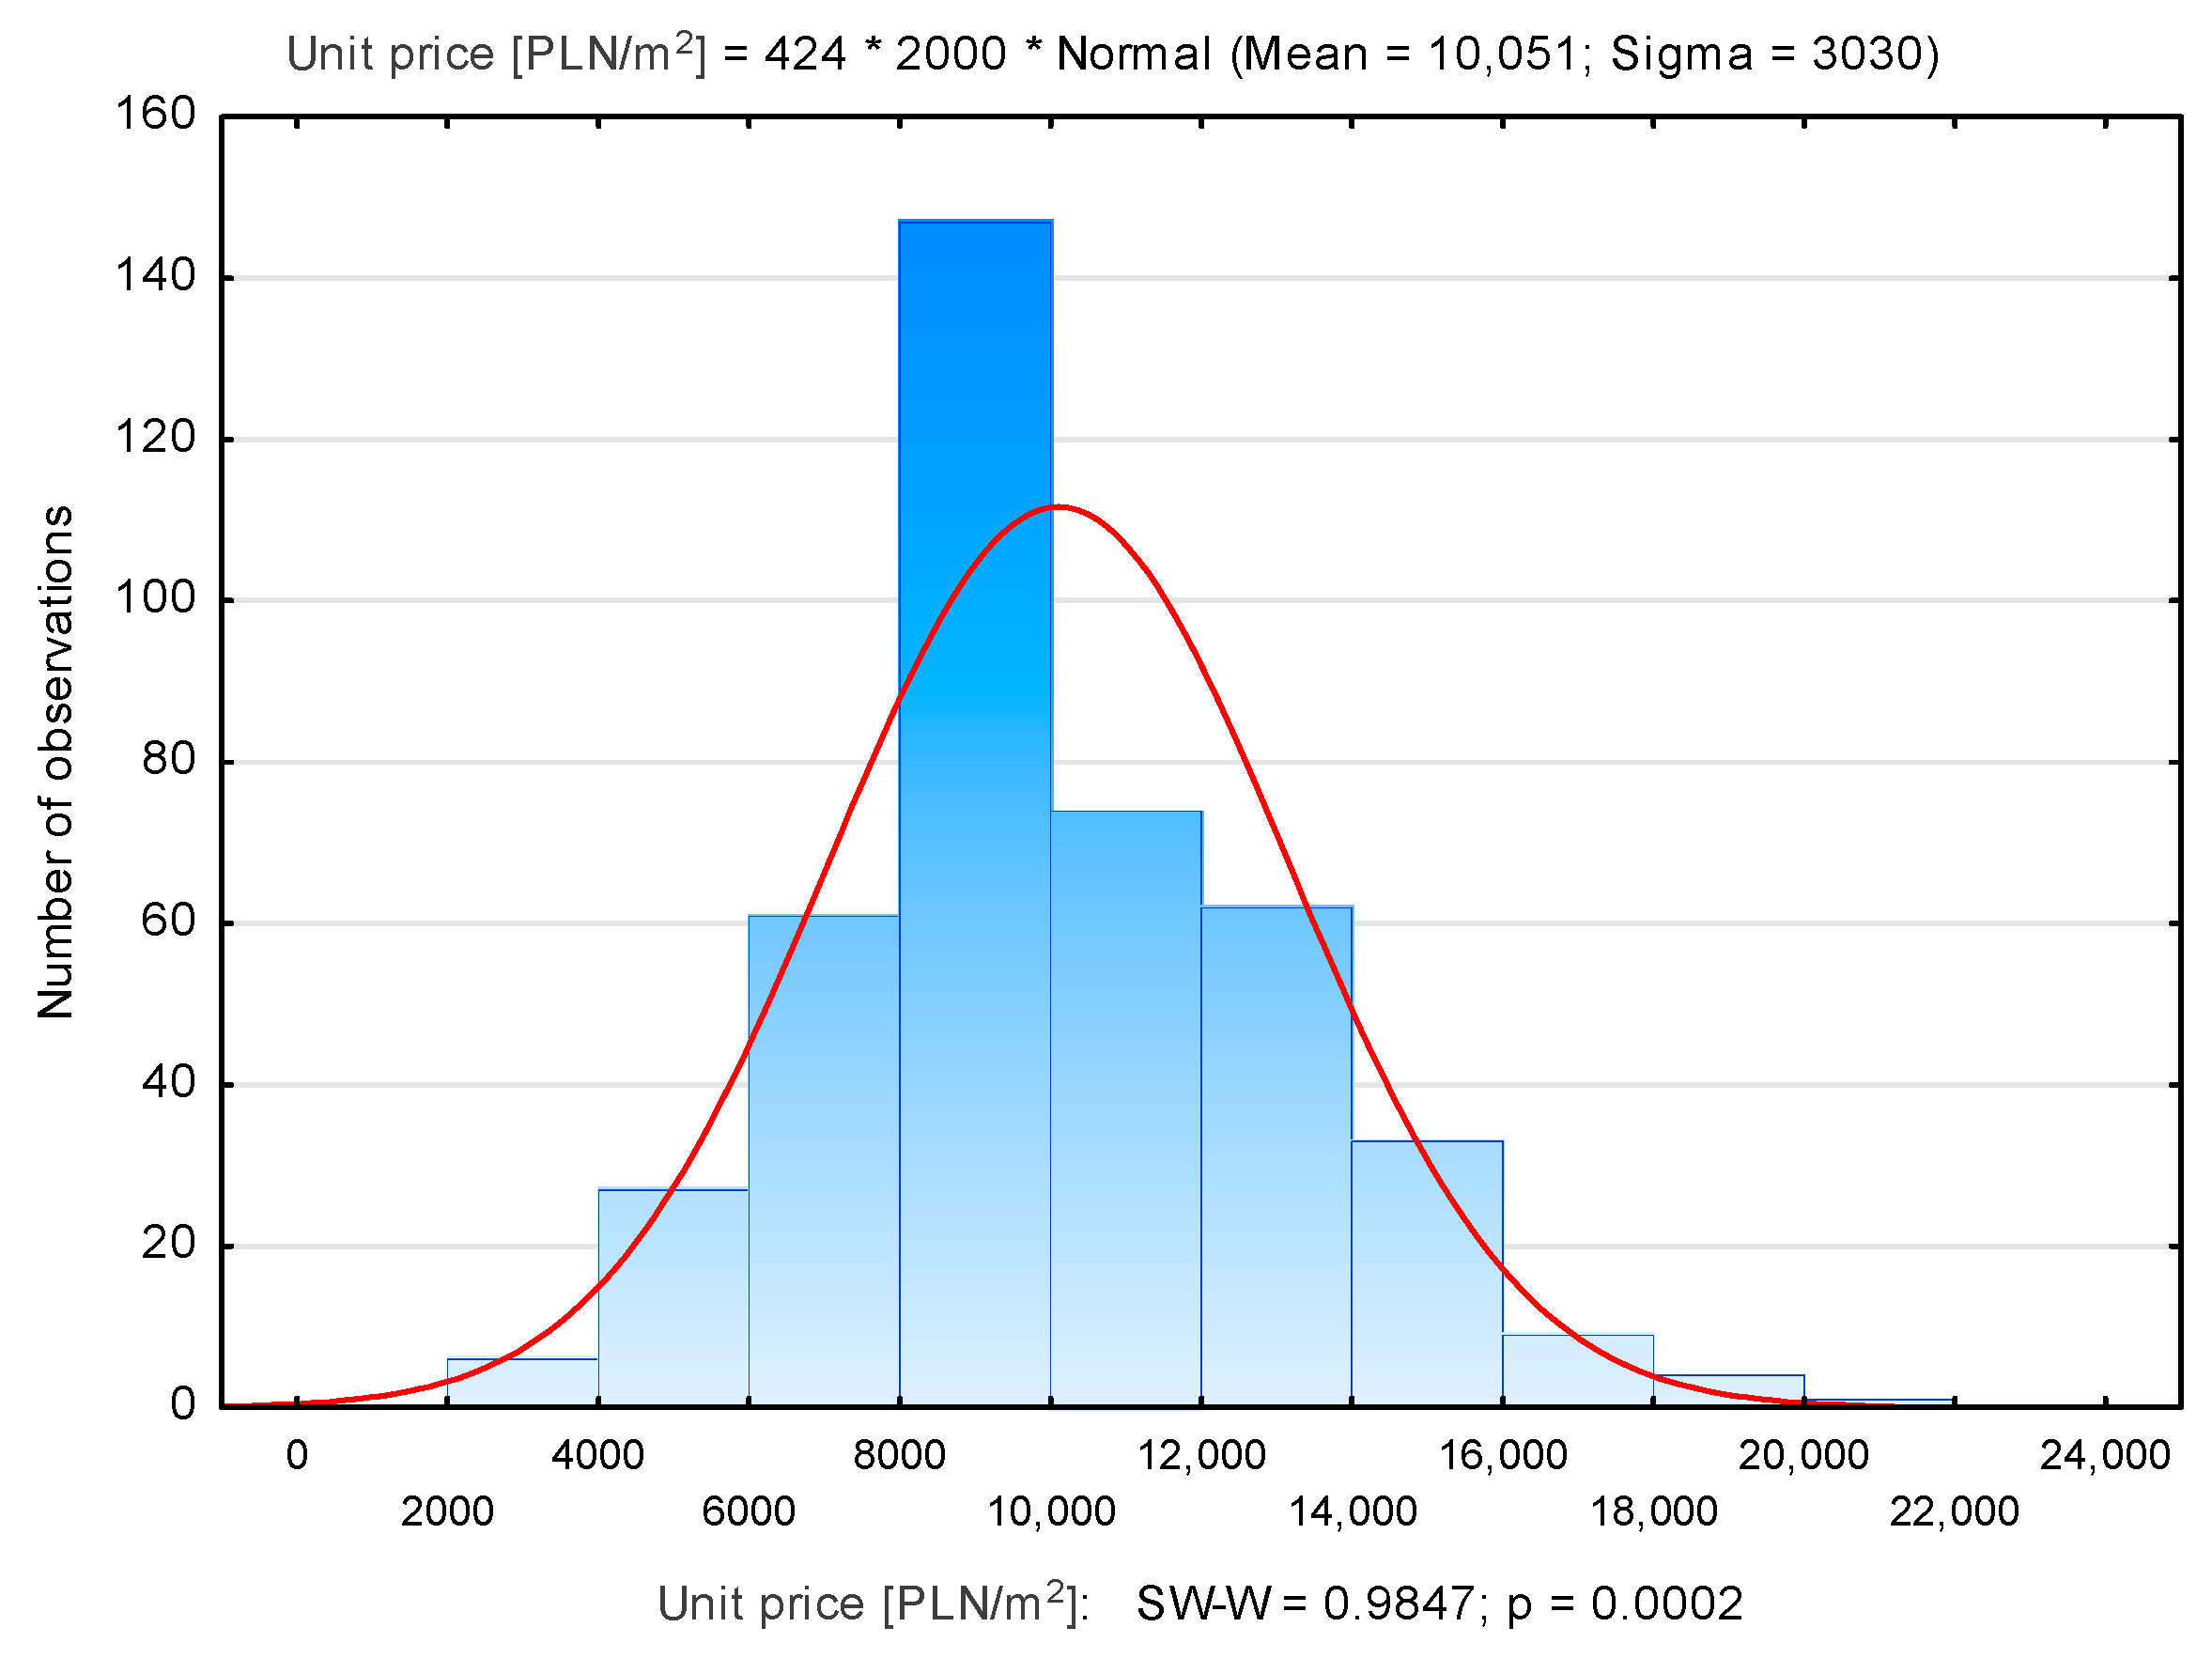
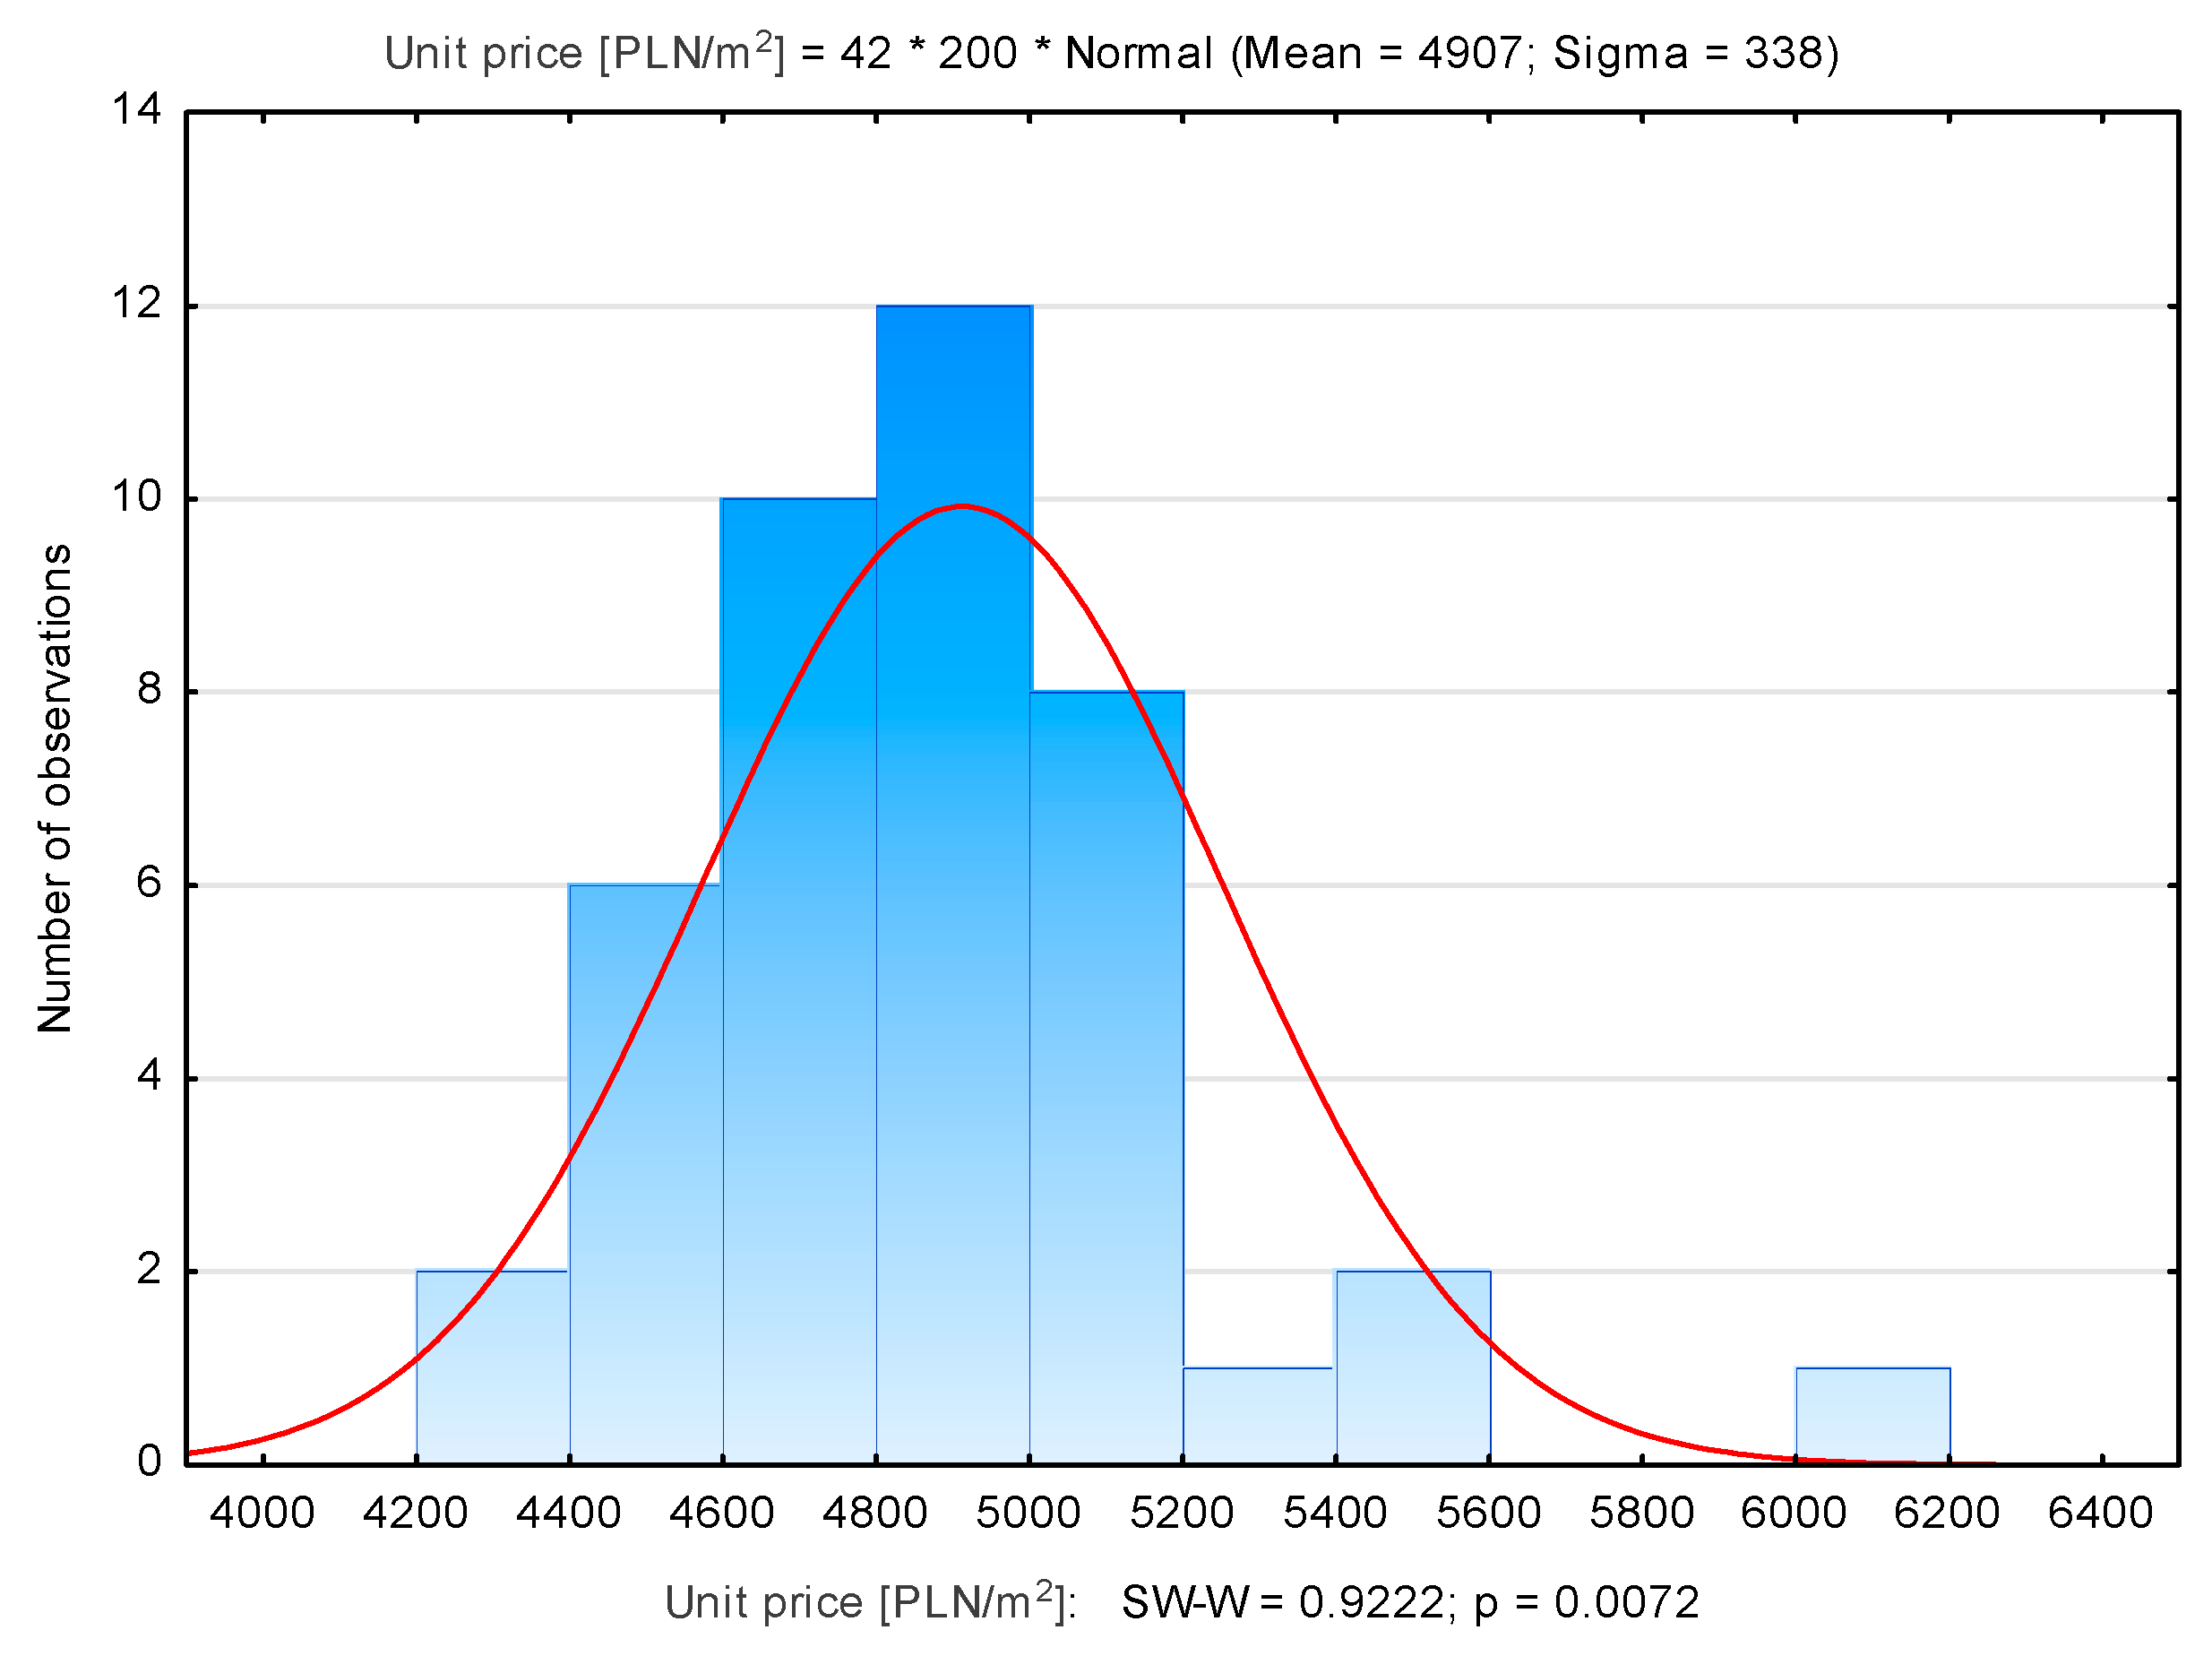
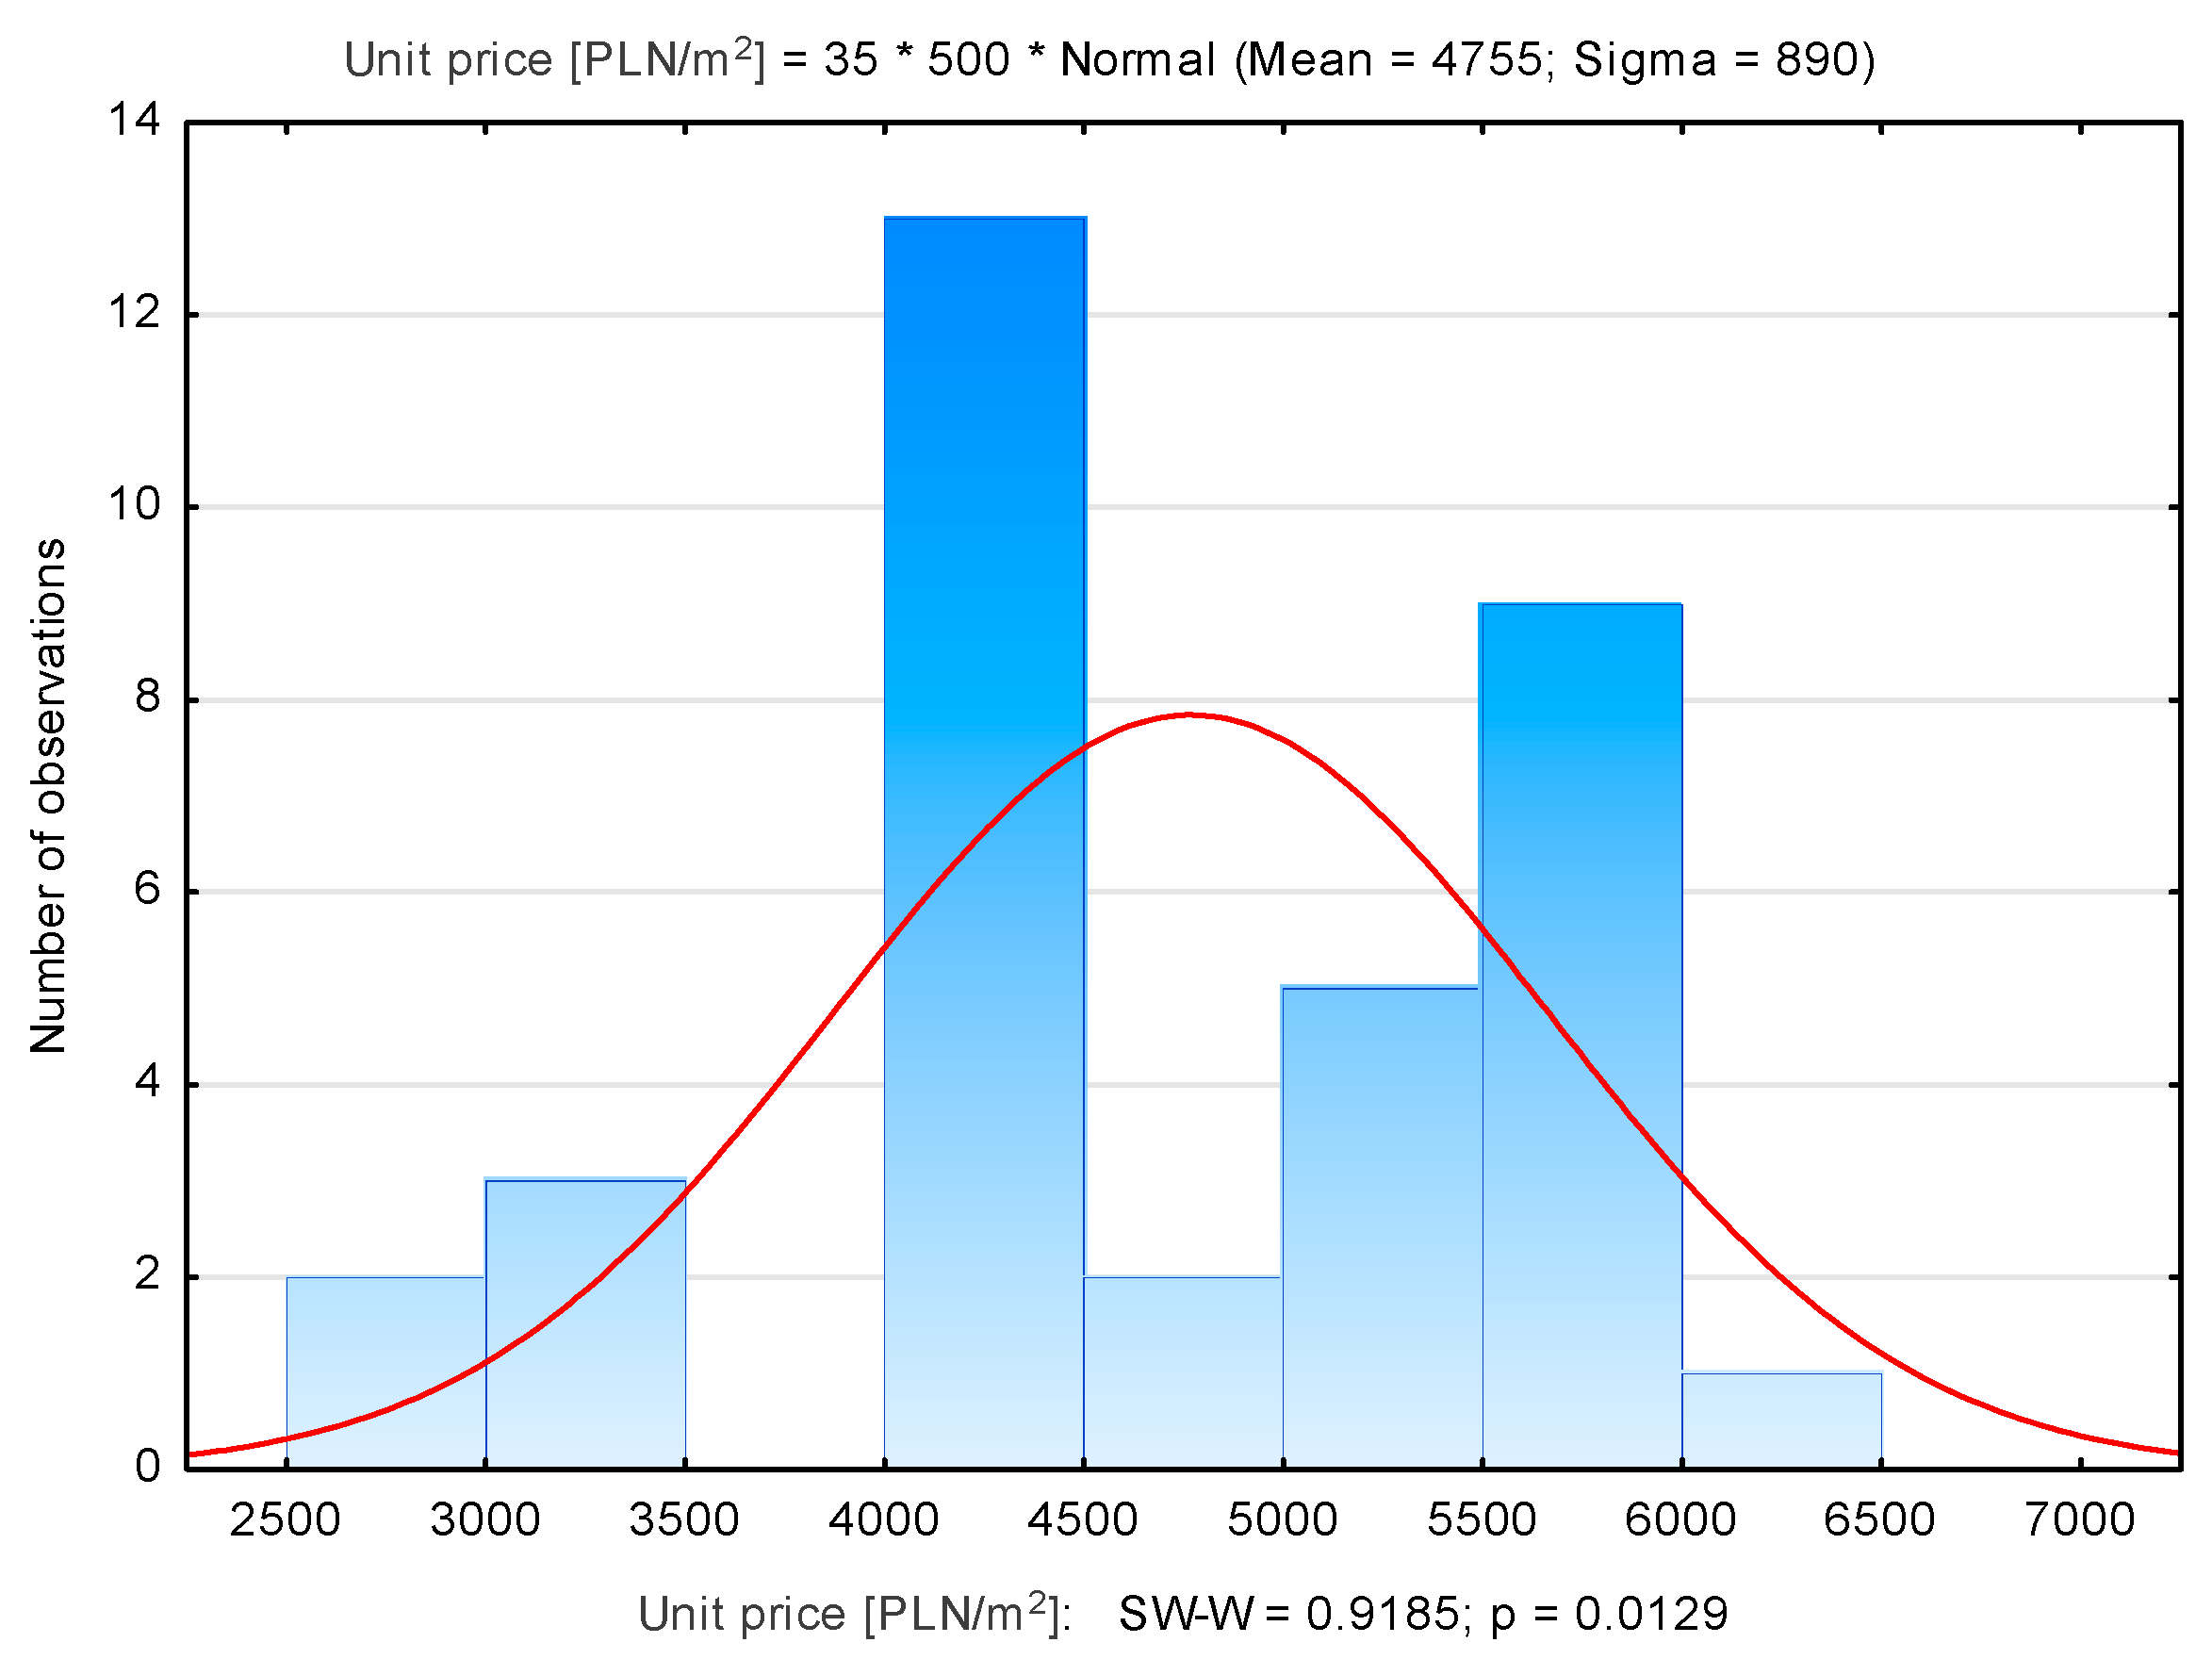
Extreme and outlier unit prices are noted. These values must be verified and removed from the database so that they do not interfere with the further modelling process. It should be noted, however, that these values may be due to the characteristics of the property in question, which are more or less favourable than the average characteristic. In the first place, it is necessary to verify the statistic distributions of property prices in the following specific districts. The authors verified the hypothesis of normal distribution using the Shapiro–Wilk (SW-W) test, because of its eminent power compared to other tests, low sensitivity to autocorrelation and variance of variance. The hypothesis was verified for the entire city and separately for individual districts. Selected results of the analyses are presented in Figure 3, Figure 4, Figure 5, Figure 6, Figure 7, Figure 8, Figure 9, Figure 10, Figure 11, Figure 12, Figure 13, Figure 14, Figure 15, Figure 16, Figure 17, Figure 18, Figure 19, Figure 20 and Figure 21.
The analysis of the results allows the conclusion that with the assumed significance level (P = 0.05) there are no grounds to reject the hypothesis of a normal distribution of unit prices only for the Zwierzyniec district. This proves the occurrence of outliers. The aim of further research is to eliminate observations outliers from the database.

2.2. Rule of Thumb

It is necessary to examine the characteristics of the set of data to take any further action based on inference. Even if the model does not have a co-linearity problem or a data problem (for example, data shortages), it is prudent to see which observations have a big impact on regression results. Impact observation diagnostics provide information on the reliability of conclusions drawn from an estimated model. To pre-detect influential observations in a property database, an R-projection matrix can be used, as follows:
R = X ( X X T ) 1 X T
where X is a matrix of coefficients of multiple regression model equations. Elements from the diagonal R matrix determine the effect of the i-th observation on model parameter estimates. The R matrix is idempotent, therefore these elements will always be contained in the range [0, 1]. The well-known ‘rule of thumb’ principle states that if R i , i > 0.5 is observed, it should be considered influential. Based on analyses of many lands and residential property bases [31,32], the authors conclude that to detect influential observations in property bases, the value should be R i , i reduced to around Ri,i > 0.07. This is because this parameter depends solely on the values of explanatory variables, the number of which is small relative to the number of observations obtained from the register. It should be emphasized that the matrix does not depend on the transaction prices of the property, therefore, it is possible to determine only which properties in terms of characteristics (attributes) have a significant impact on the regression model.

2.3. Mahalonobis Distance

Methods for identifying outliers based on Mahalonobis distances use the following criteria [14,33]:
M D i 2 = ( x i x ¯ ) Cov ( x ) 1 ( x i x ¯ ) T
  • M D i —Mahalonobis Distance,
  • x i —a vector containing the ith explanatory variables,
  • x ¯ —vector of the average explanatory variables,
  • Cov ( x ) —covariance matrix for explanatory variables.
The Mahalanobis distance can also be determined by means of levers (leverage) hand:
M D i 2 = ( n 1 ) ( h i 1 n )
where
  • n—number of observations,
  • h i —the value of leverage for the first observation.
This measures the distance of a given observation from the mean of the independent variables. In practice, it is difficult to determine the cut-off point for influential cases. In the literature, it is difficult to find a clear answer to the question of how this criterion should be determined. This approach also has the disadvantage that the value of the criteria itself (6) is very sensitive to the occurrence of outliers. To determine the cut-off point of influential observations, it should be noted that these criteria should depend on the number of model parameters and the number of observations. Based on the theory of square forms, it is concluded that Equation (6) has a distribution of o (nu) degrees of freedom, where u is the number of parameters of the model. Observations with high statistics, i.e., a square of the Mahalanobis distance compared to the critical values of the distribution, can be considered as influential observations. In this case, the data need to be checked and the appropriate limit value selected. In the case of a large number of degrees of freedom, the authors propose to set the cut-off criterion at:
k _ M D = n / u χ 2 ( n u , α )

2.4. Analysis of Standardized Model Residuals

If each residual is divided by its standard deviation, i.e., as follows:
R S i = v i σ i
then it will generate a statistic that points to the impact of observations. It is customary to consider that if the absolute value of t is greater than 2, then it is influential. However, this is an approximate criterion. In practical applications, it is worth applying stricter or milder conditions. This is because the model is exuded by the least-squares method, the residuals have a normal distribution and the statistics (8) of the Student’s t-distribution are o (nu) degrees of freedom, where n is the number of observations and the number of parameters of the model is estimated. By assuming any level of materiality α, the residuals can be considered to be inputs to the model and thus the observation may be considered as an outlier by comparing the statistic (8) with the Student’s t-distribution.
R S i > k _ R S i ;   k _ R S i = t S ( 1 α 2 , n u )
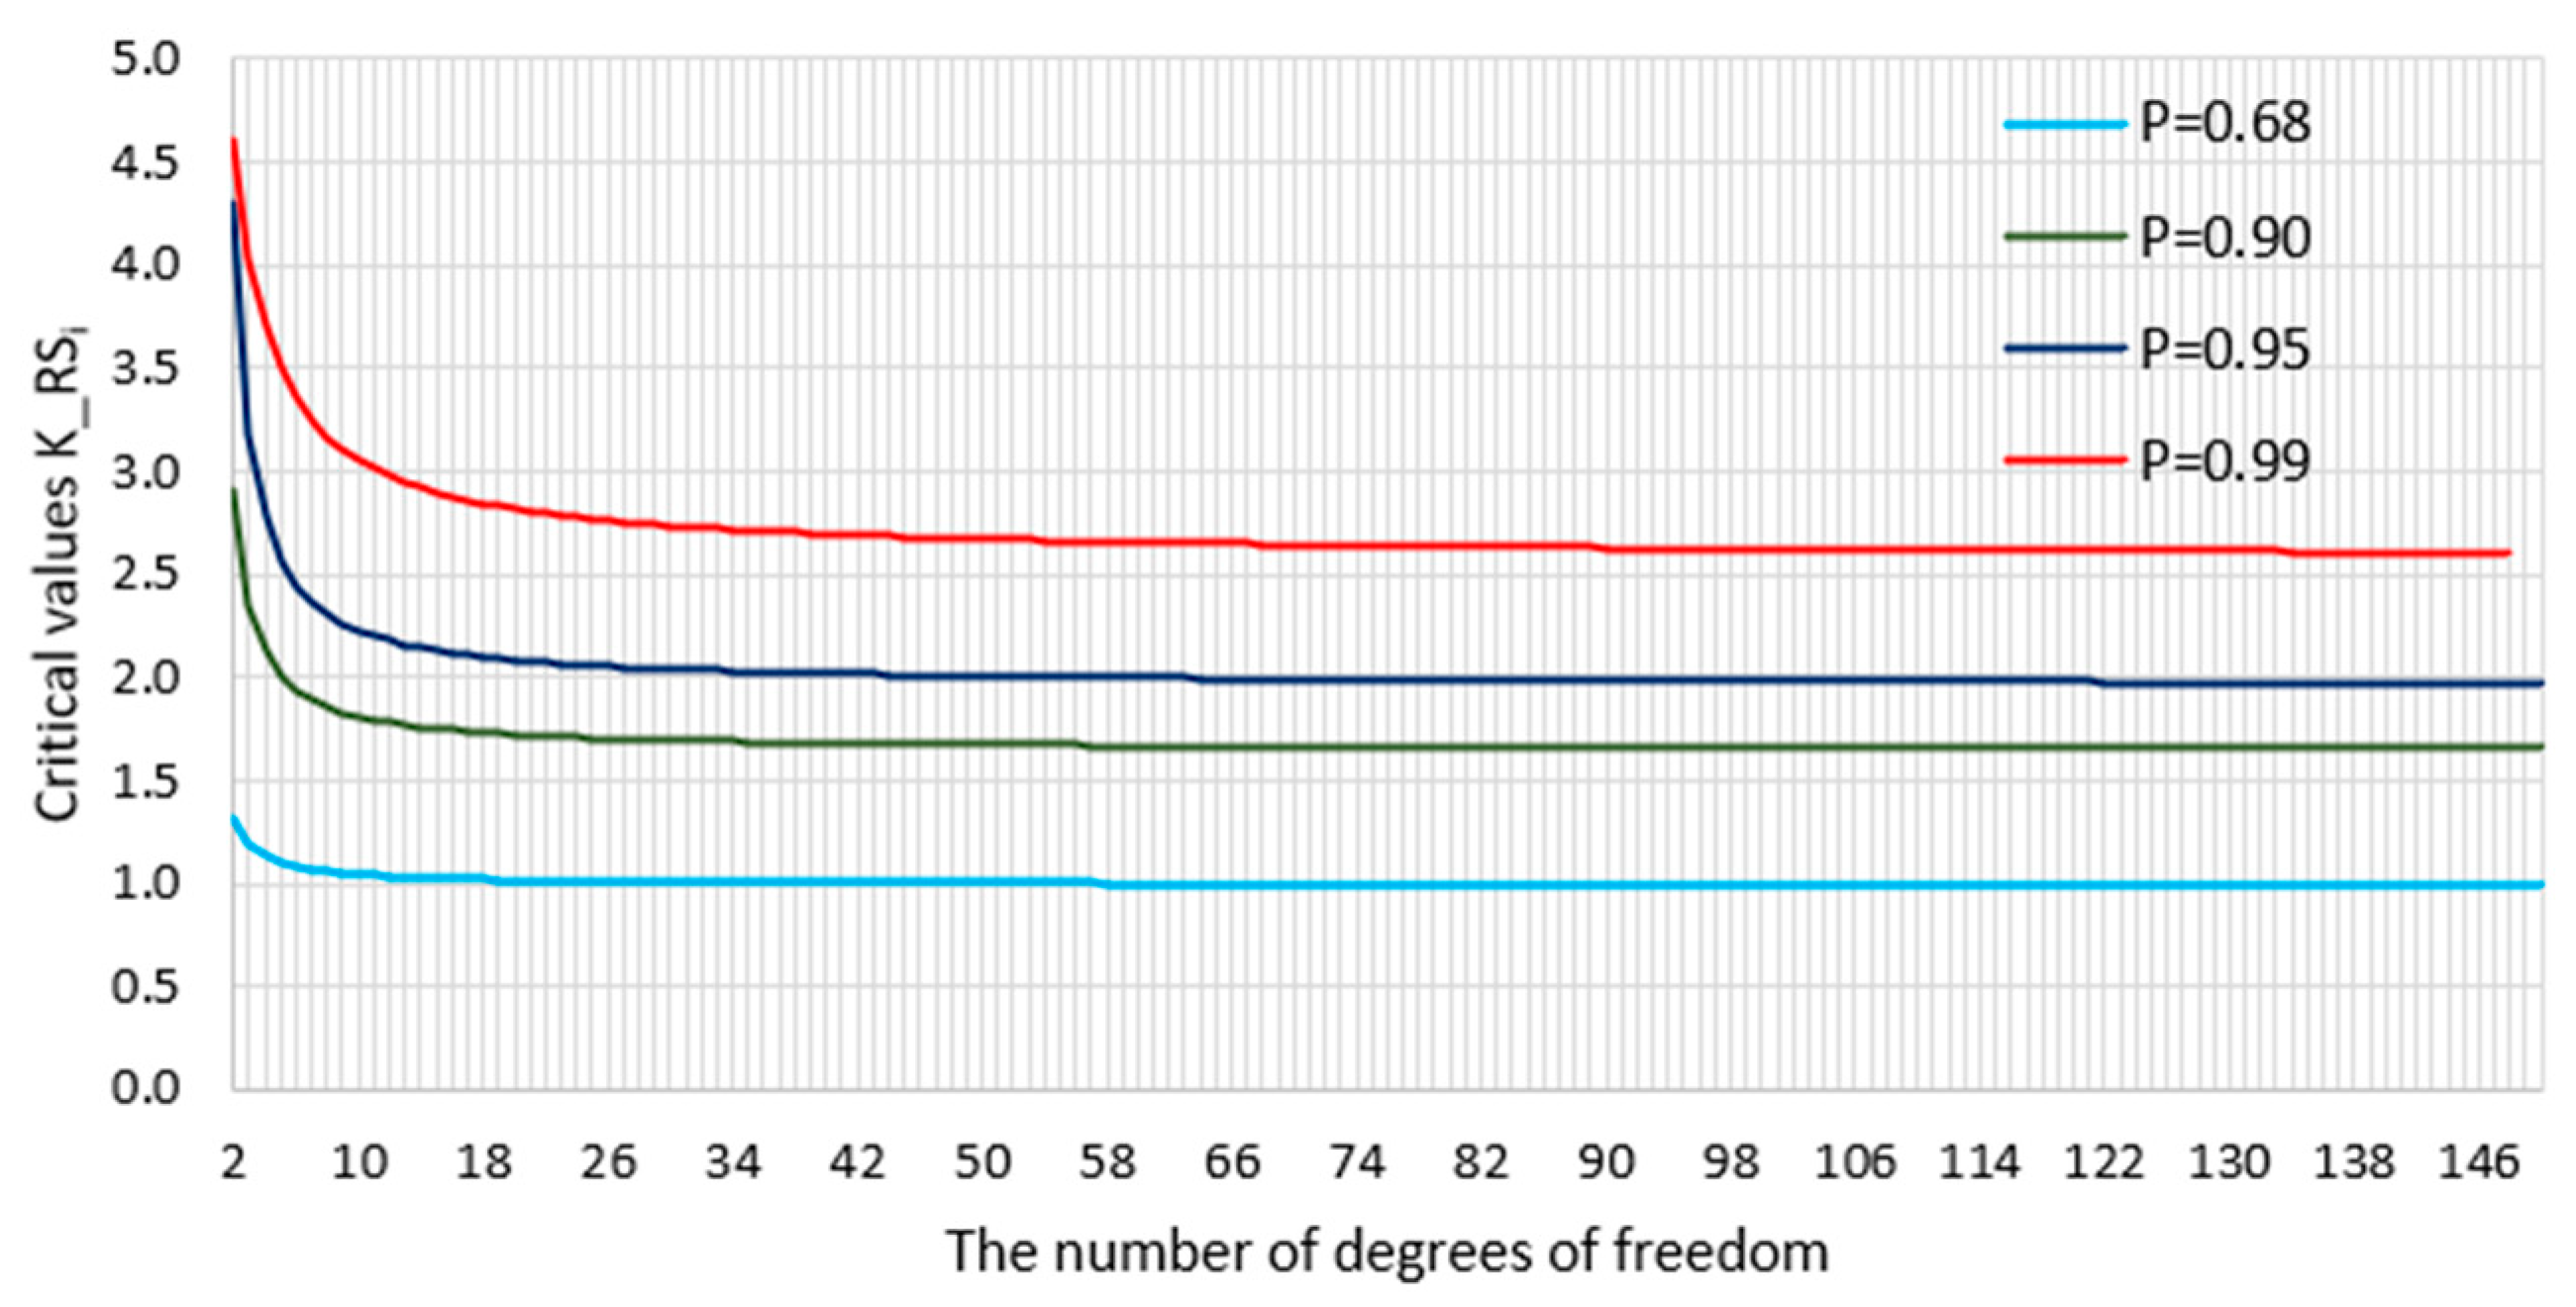
Figure 22 shows graphs of critical values for selected probability levels of value P, depending on the number of degrees of freedom.
It follows from the above statements that at the set probability level P = 0.95 it can be approximately assumed that observations for which standardized residuals exceed twice the quantum value of the Student’s t-distribution, but with at least 25 to 30 degrees of freedom, can be considered outliers from the model. For P = 0.99 and with degrees of freedom above 30, this value is on the order of 2.7–2.6. The exact value of the criterion can be calculated on a case-by-case basis according to the given algorithm. It should be noted that increasing the probability level results in fewer observations being detected as outliers, while a decrease in the probability level makes the criterion more stringent. Figure 22 indicates that for P = 0.68 outliers will be considered as observations whose residuals exceed the standard deviations directly determined by the least-squares method. Based on several experiments conducted by the authors, it is concluded that the elimination of observations from the model should be carried out individually, even if a larger group of outliers is detected in a given iteration. This is particularly important in the case of a more stringent criterion. This is because in a regression model even a single outlier can significantly change the form of the model and observations that did not match the primary model can meet the criteria of the second model after eliminating even one observation.

2.5. Cook’s Distance

Cook’s distance measures the change in regression coefficient values when a single observation is eliminated from the model. In the case of the Mahalanobis distance [33,34], the distance of the case from the centre of gravity determined by the independent variables is measured. Standardized tests determine the distance from the regression line. Cook’s distances combine these two distances and are a cumulative measure of the effect of individual observations on the regression line [16]. To determine whether the vector of independent variables x and for the ith observation is unusual against the background of the other x, the lever hand can be determined by the following form:
h i = δ i T X ( X T X ) 1 X T δ i = δ i T P X δ i = x i ( X T X ) 1 x i T
where
P X = X ( X T X ) 1 X T , . δ i = [ 0 , , 0 , 1 , 0 , 0 ]
There is a dependency for each model. Informal rules say that ‘if, then’ observations can be considered unusual. The fact that the observation is unusual does not yet indicate that it does not fit the model. However, if unusual observations, i.e., large levers, have high residual values at the same time, then this may indicate that they are outliers from the model. Since the variances have chi-squared distributions of (nu) and (nu − 1) degrees of freedom, respectively, the statistics are as follows:
0 h i 1 h i 2 u n σ ^ 2 , σ ^ i 2
C D i = 1 u σ ^ i 2 σ ^ 2 h i ( 1 h i )   ~   F ( 1 , n u )
where
  • C D i —Cook’s distance,
  • σ ^ 2 —variance estimator calculated based on all observations,
  • σ ^ i 2 —an estimator of variance calculated after elimination of the first observation,
  • n—number of observations,
  • u—number of model parameters.
In practice, Cook’s distance with modified residues is determined in the form of:
C D i = j = 1 n ( y ^ j ( i ) y ^ j ) 2 u σ ^ 2
where
  • y ^ j —the value predicted by the model for the jth observation determined in the full model,
  • y ^ j ( i ) —the value predicted by the model for the jth observation determined based on the model from which the ith observation was removed.
It is generally assumed that if CD ≥ 4/n then you should look at such observation because it can be an outlier observation. This approach is correct if the significance level is set at 0.05 and the number of observations is large. Based on (11), by employing the Fisher–Snedecor distribution, the critical value can be specified precisely. The authors propose that the criterion be determined based on dependencies:
k _ C D i = F ( α , 1 , n u ) n
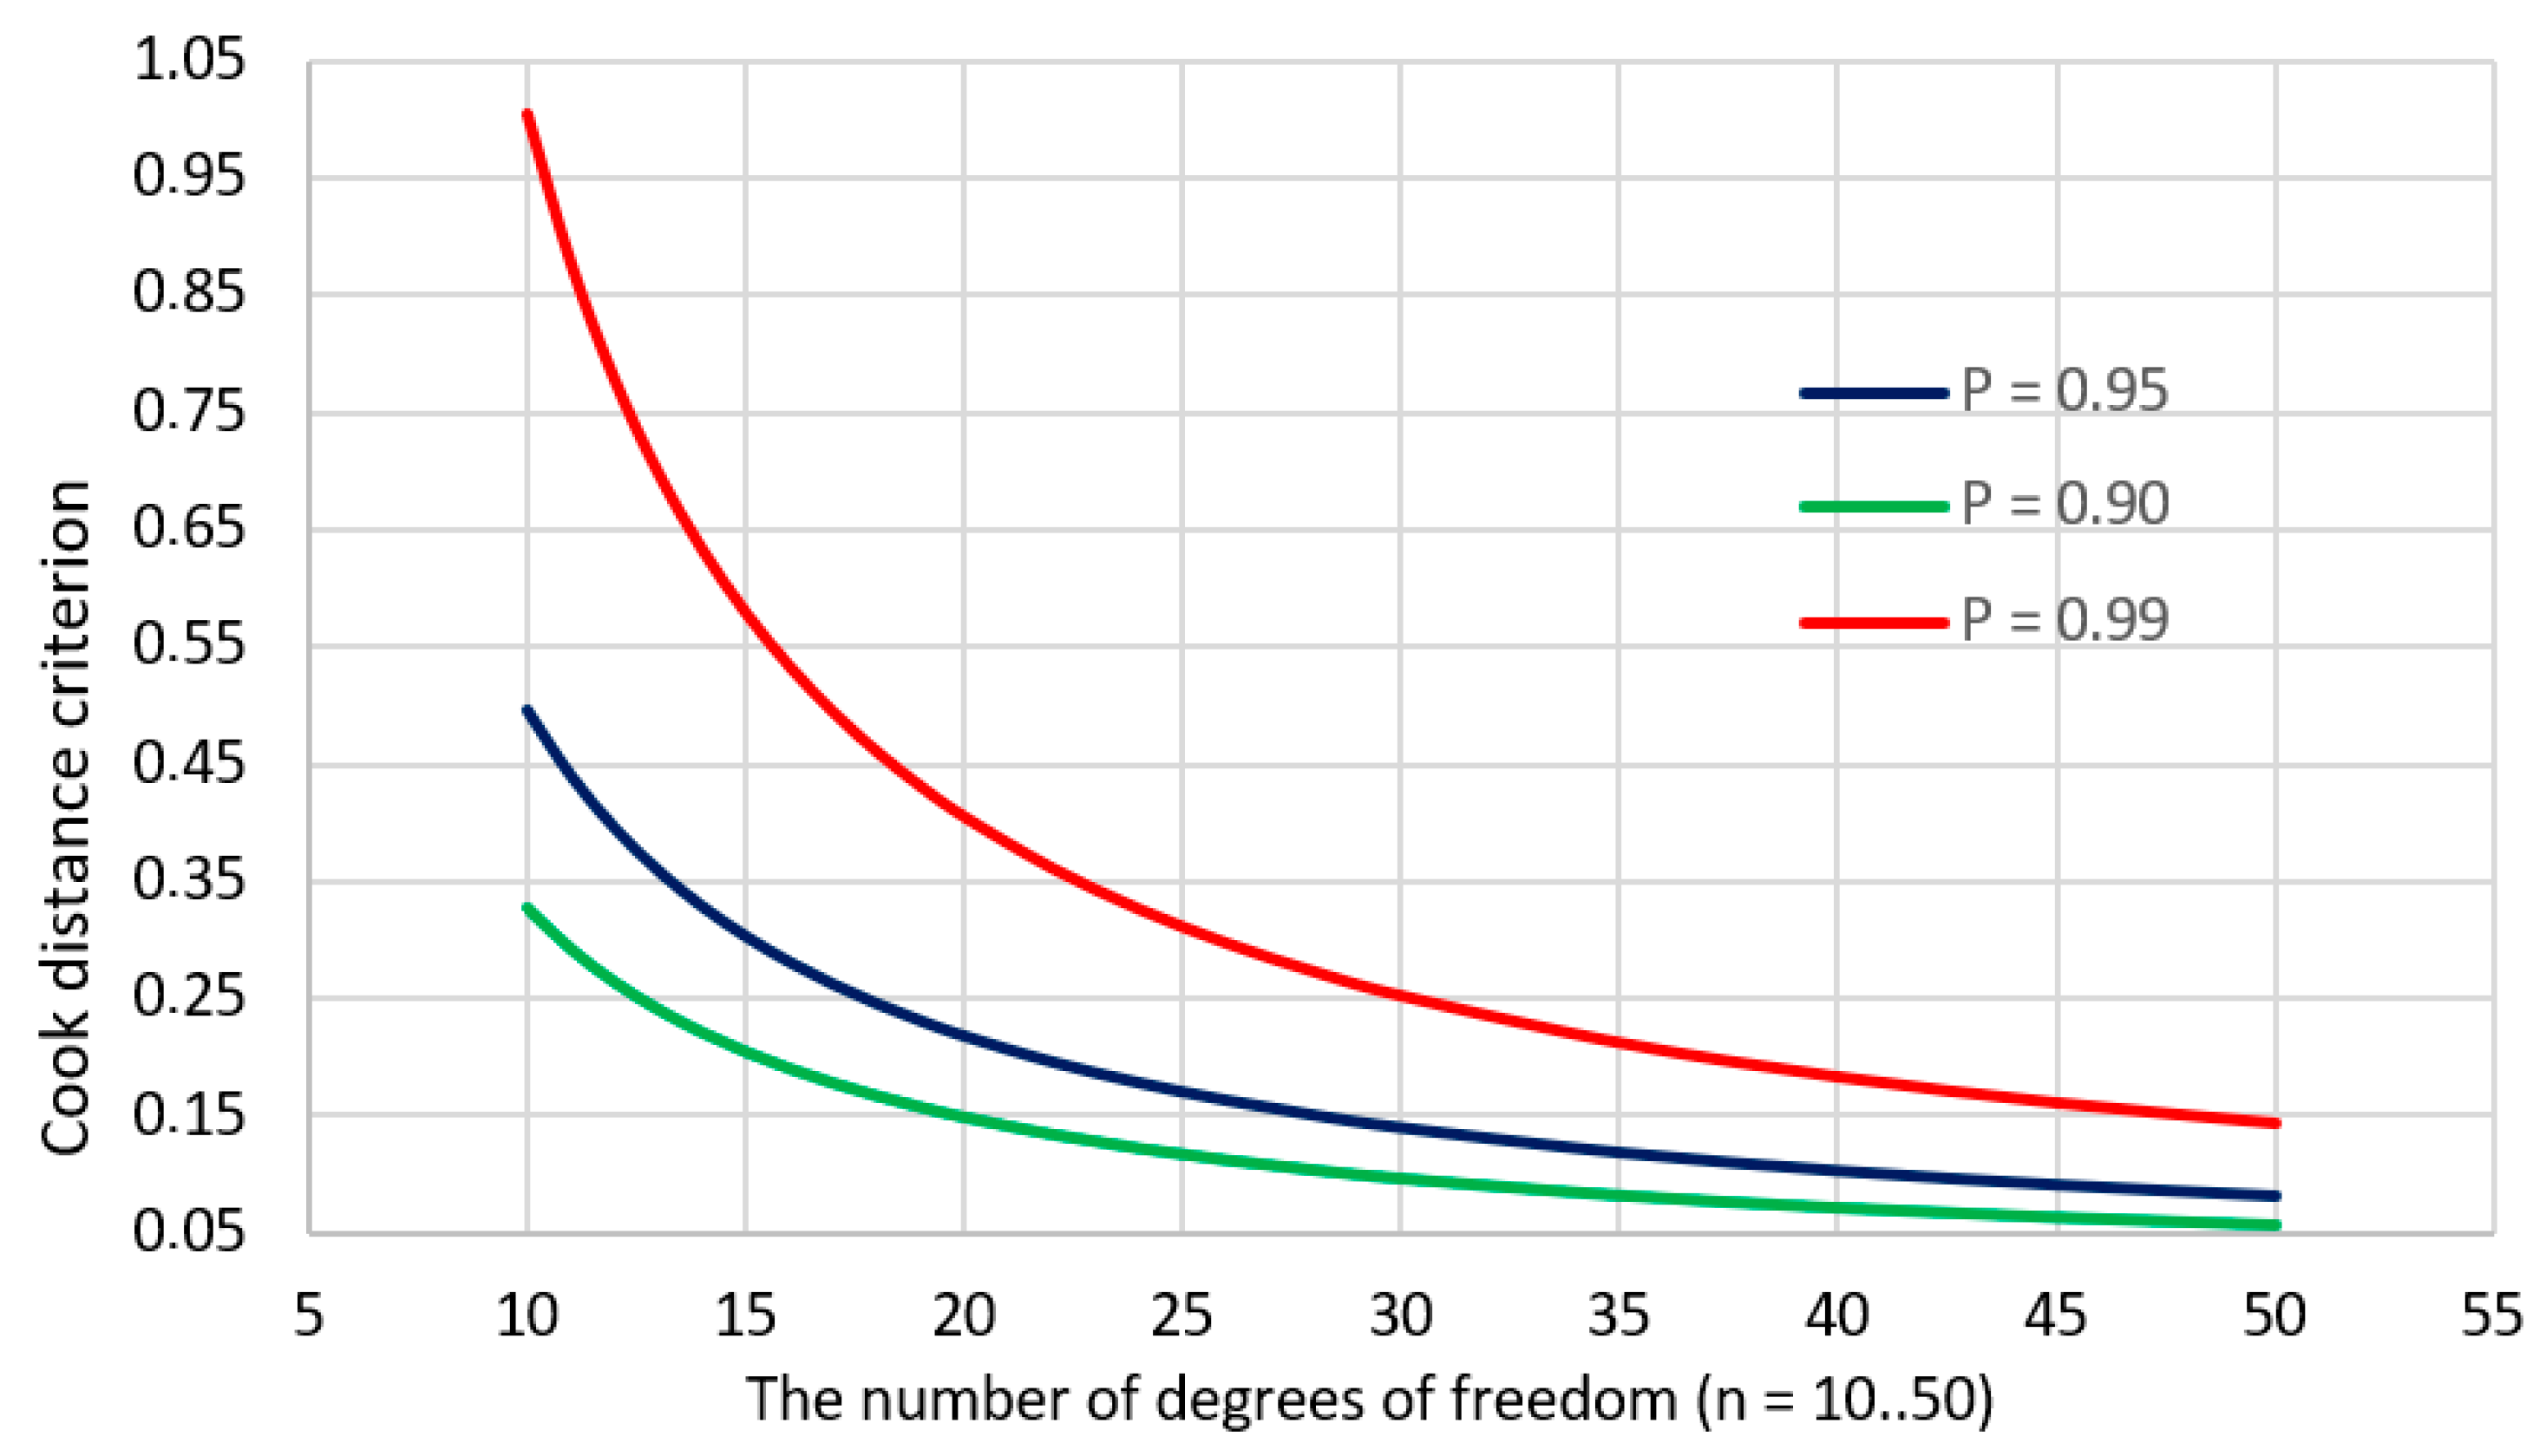
Figure 23 and Figure 24 show Cook’s distance values for three probability levels, depending on the number of observations and the number of degrees of freedom.

2.6. Classification and Regression Tree Models

Classification and Regression Tree (C&RT) models provide a significant solution to regression and classification problems. The method is described in detail elsewhere [35,36,37,38]. In the C&RT method, there are several basic steps:
  • Tree building: the process occurs through the recursive division of nodes,
  • Stopping the construction of the tree: at this stage, the tree is as extensive as possible, usually containing redundant information,
  • Pruning of the tree consists of removing redundant branches,
  • Choosing the right tree: some branches are restored to increase the effectiveness of the method.

3. Results

3.1. Identification of Influential and Outliers in the Kraków Database

The database of 8812 premises traded on the primary market in Kraków was analysed. Initially, based on correlation analysis, five characteristics were found that shaped property prices and at the same time represented variables explaining the multiple regression model. The regression model was determined by the least-squares method. Based on the original base, the following model parameters were obtained, drawn up for the entire city and separately for each district (presented in Table 2):
The statistically significant parameters are marked in red. The results of the analysis show that it is not possible to use a multiferroic regression model based on a raw database. The coefficients of determination R2 are unsatisfactory for each of the analysed districts of Kraków. Outliers should therefore be eliminated. To detect outliers, for the entire city and each district separately, the following indicators were set: projection matrix, Mahalanobis distance, standardized residuals of Ri and Cook’s distance (Table 3). Critical values are calculated based on Formulas (7), (9) and (13). The probability level of P = 0.95 is assumed. Table 4 highlights selected observations that have been identified as influential or outliers for the example district of Dębniki. This district has the highest number of outliers (Figure 2). The number of observations in the Dębniki district is 935. Based on Formula (7), the criterion for outliers determined by the Mahalanobis distance is k_MDand = 6.45. As proposed by (13), Cook’s distance criterion was set at
k C D i = F ( 0.05 ,   1930 ) 935 = 3006 935 = 0.00321
The number of detected influential observations in the analysed district varies, depending on the method used. For Cook’s distances it is 6.5%, the standardized residual of the model is 4.9% and Mahalanobis and ‘rule of thumb’ distances are about 6.2%. None of the 18 districts exceeded 8% of the total number of properties. The elimination of outliers was carried out based on Cook’s distance. The rule of thumb method and Mahalanobis distance should only be considered as supporting the decision to treat observations as an outlier. The standardized residual method overlaps approximately 90% with the Cook’s distance method. Figure 25 shows the plot box after eliminating outliers.

3.2. Multidimensional Regression Models for Kraków Databases

In the case of six districts where the value of R2 is statistically insignificant: Bieńczyce, Podgórze D., Prądnik Biały, Prądnik Czerwony, Swoszowice, Zwierzyniec (Table 4), the regression model is not suitable for predicting the market value of the property. In these cases, subsequent iterations should eliminate subsequent outliers resulting from the change in the regression model, or another predictive solution should be used.

3.3. C&RT Trees

When the C&RT tree schema is created, the following parameters are assumed [38,39]:
  • variable dependent—unit price,
  • quality predictors—district,
  • quantitative predictors—distance, area, floor, transaction date,
  • minimum number in the end node: 20.
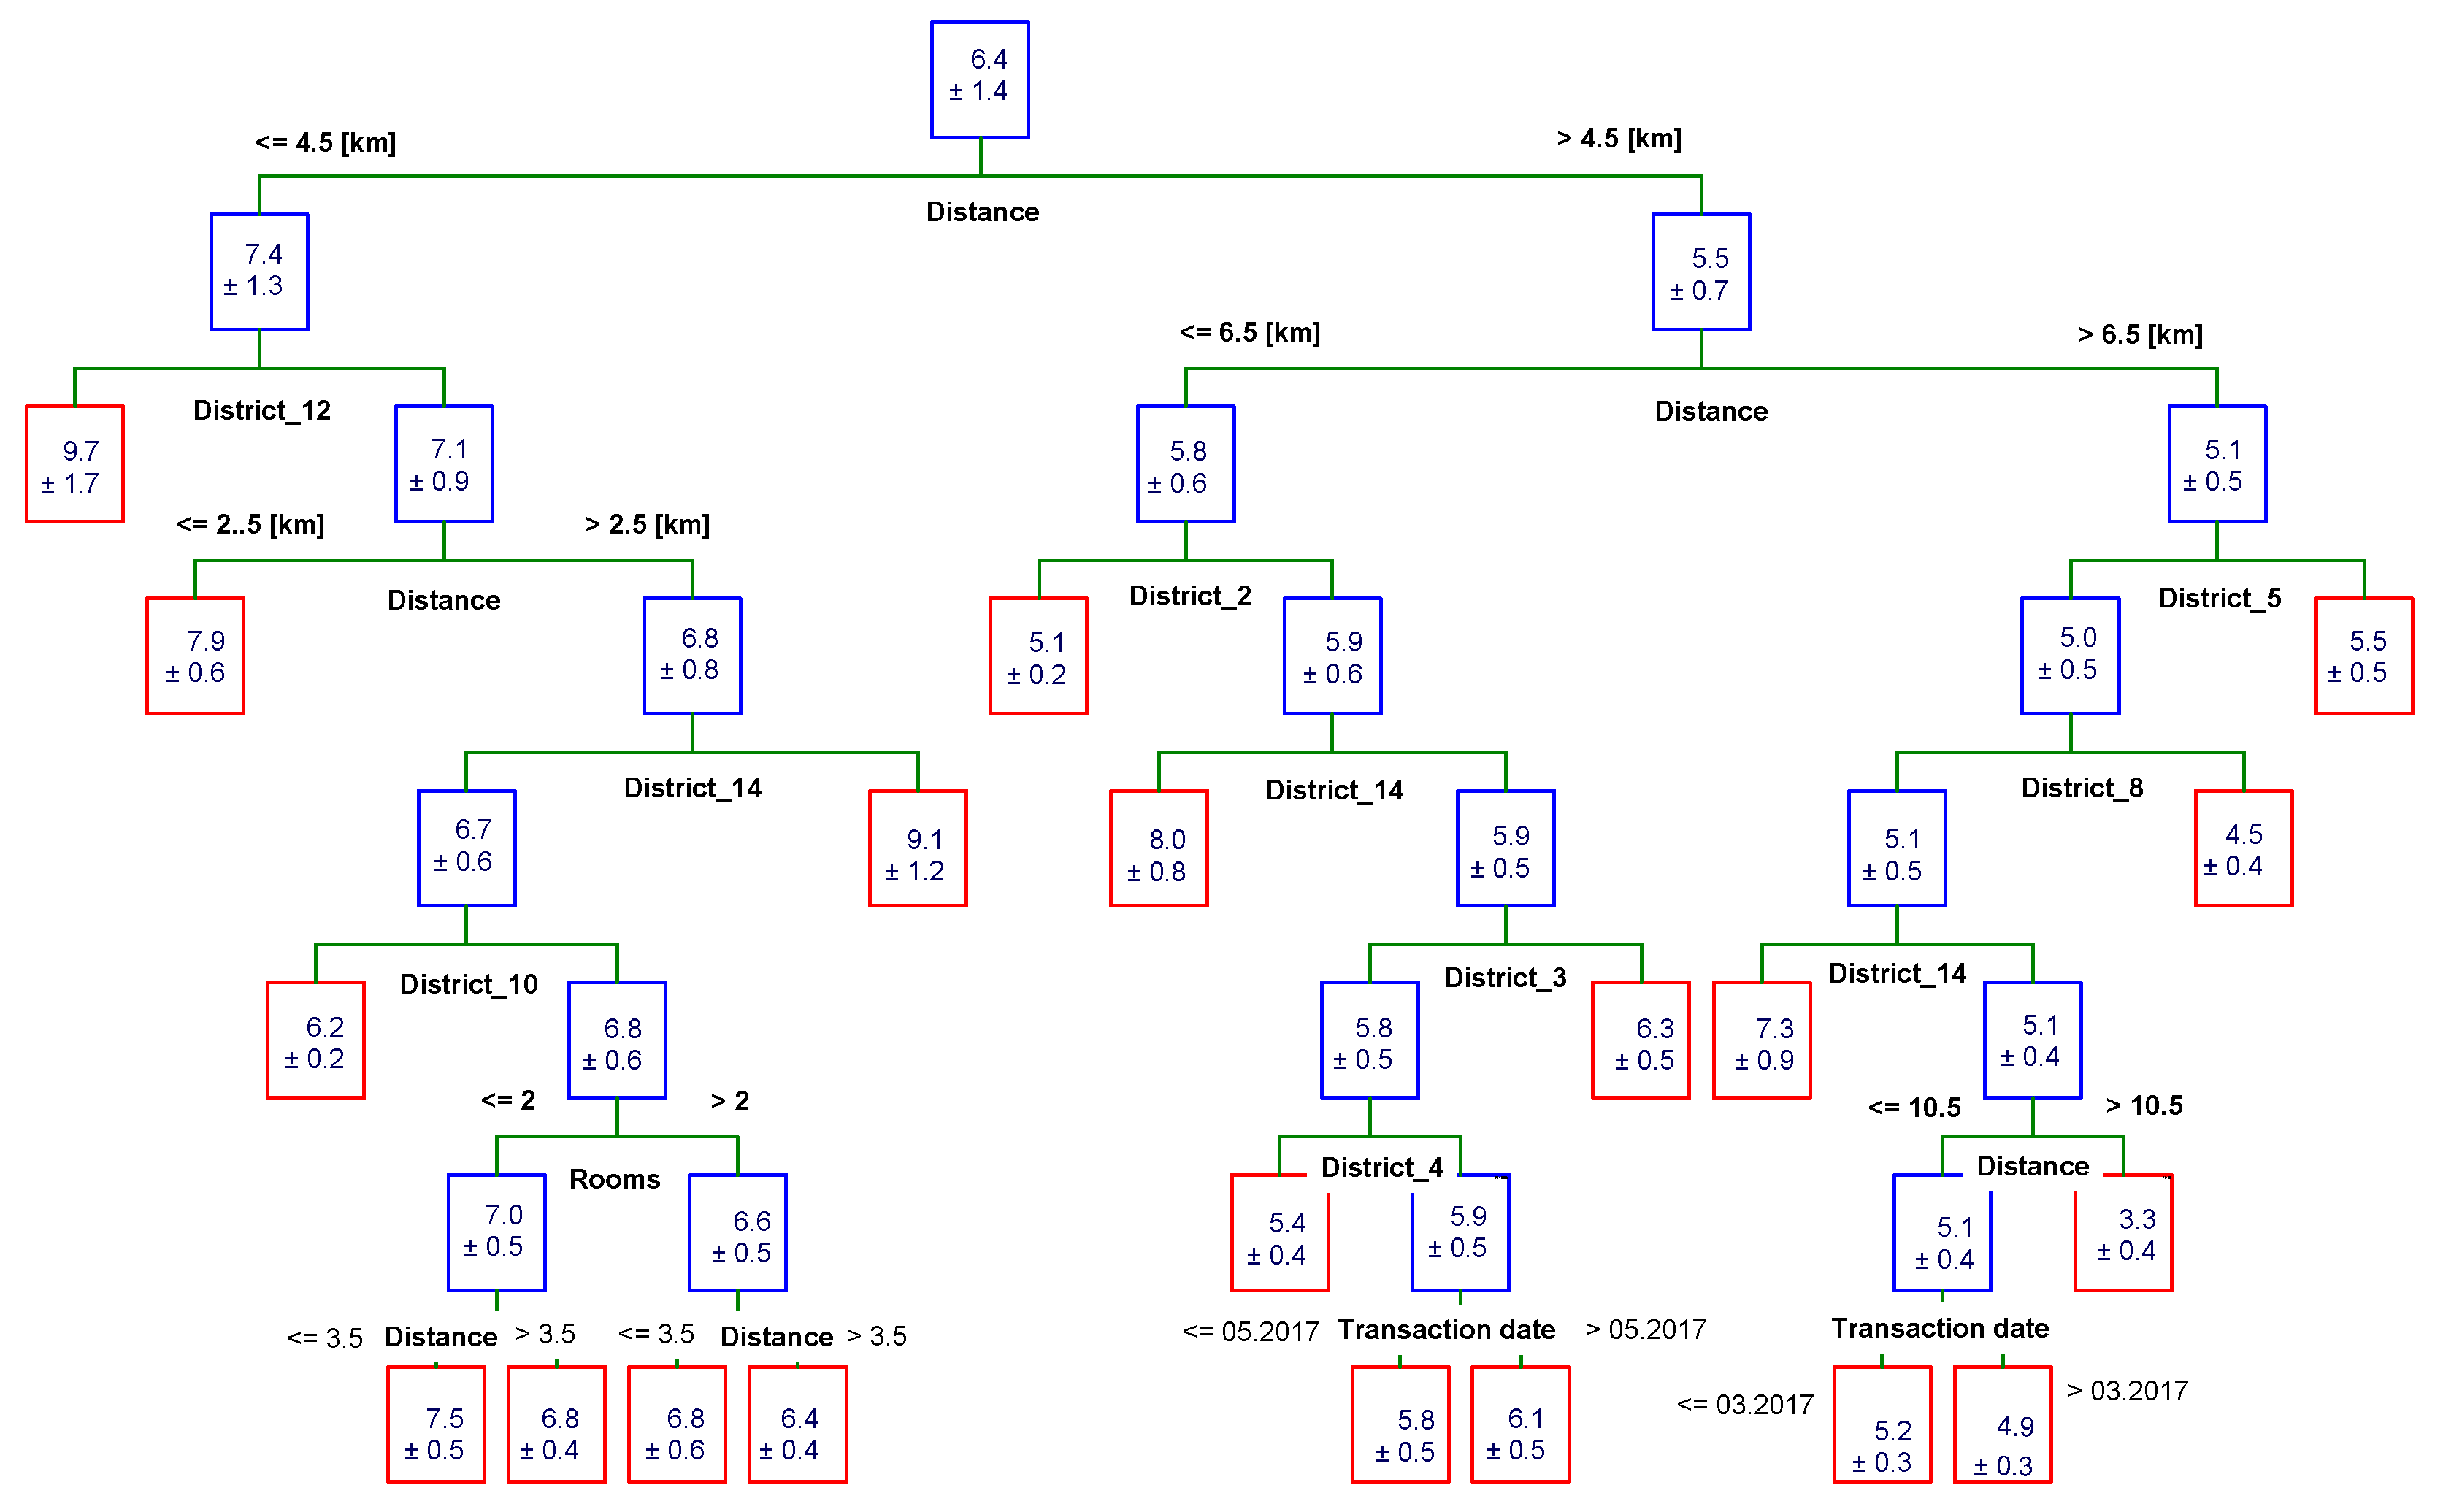
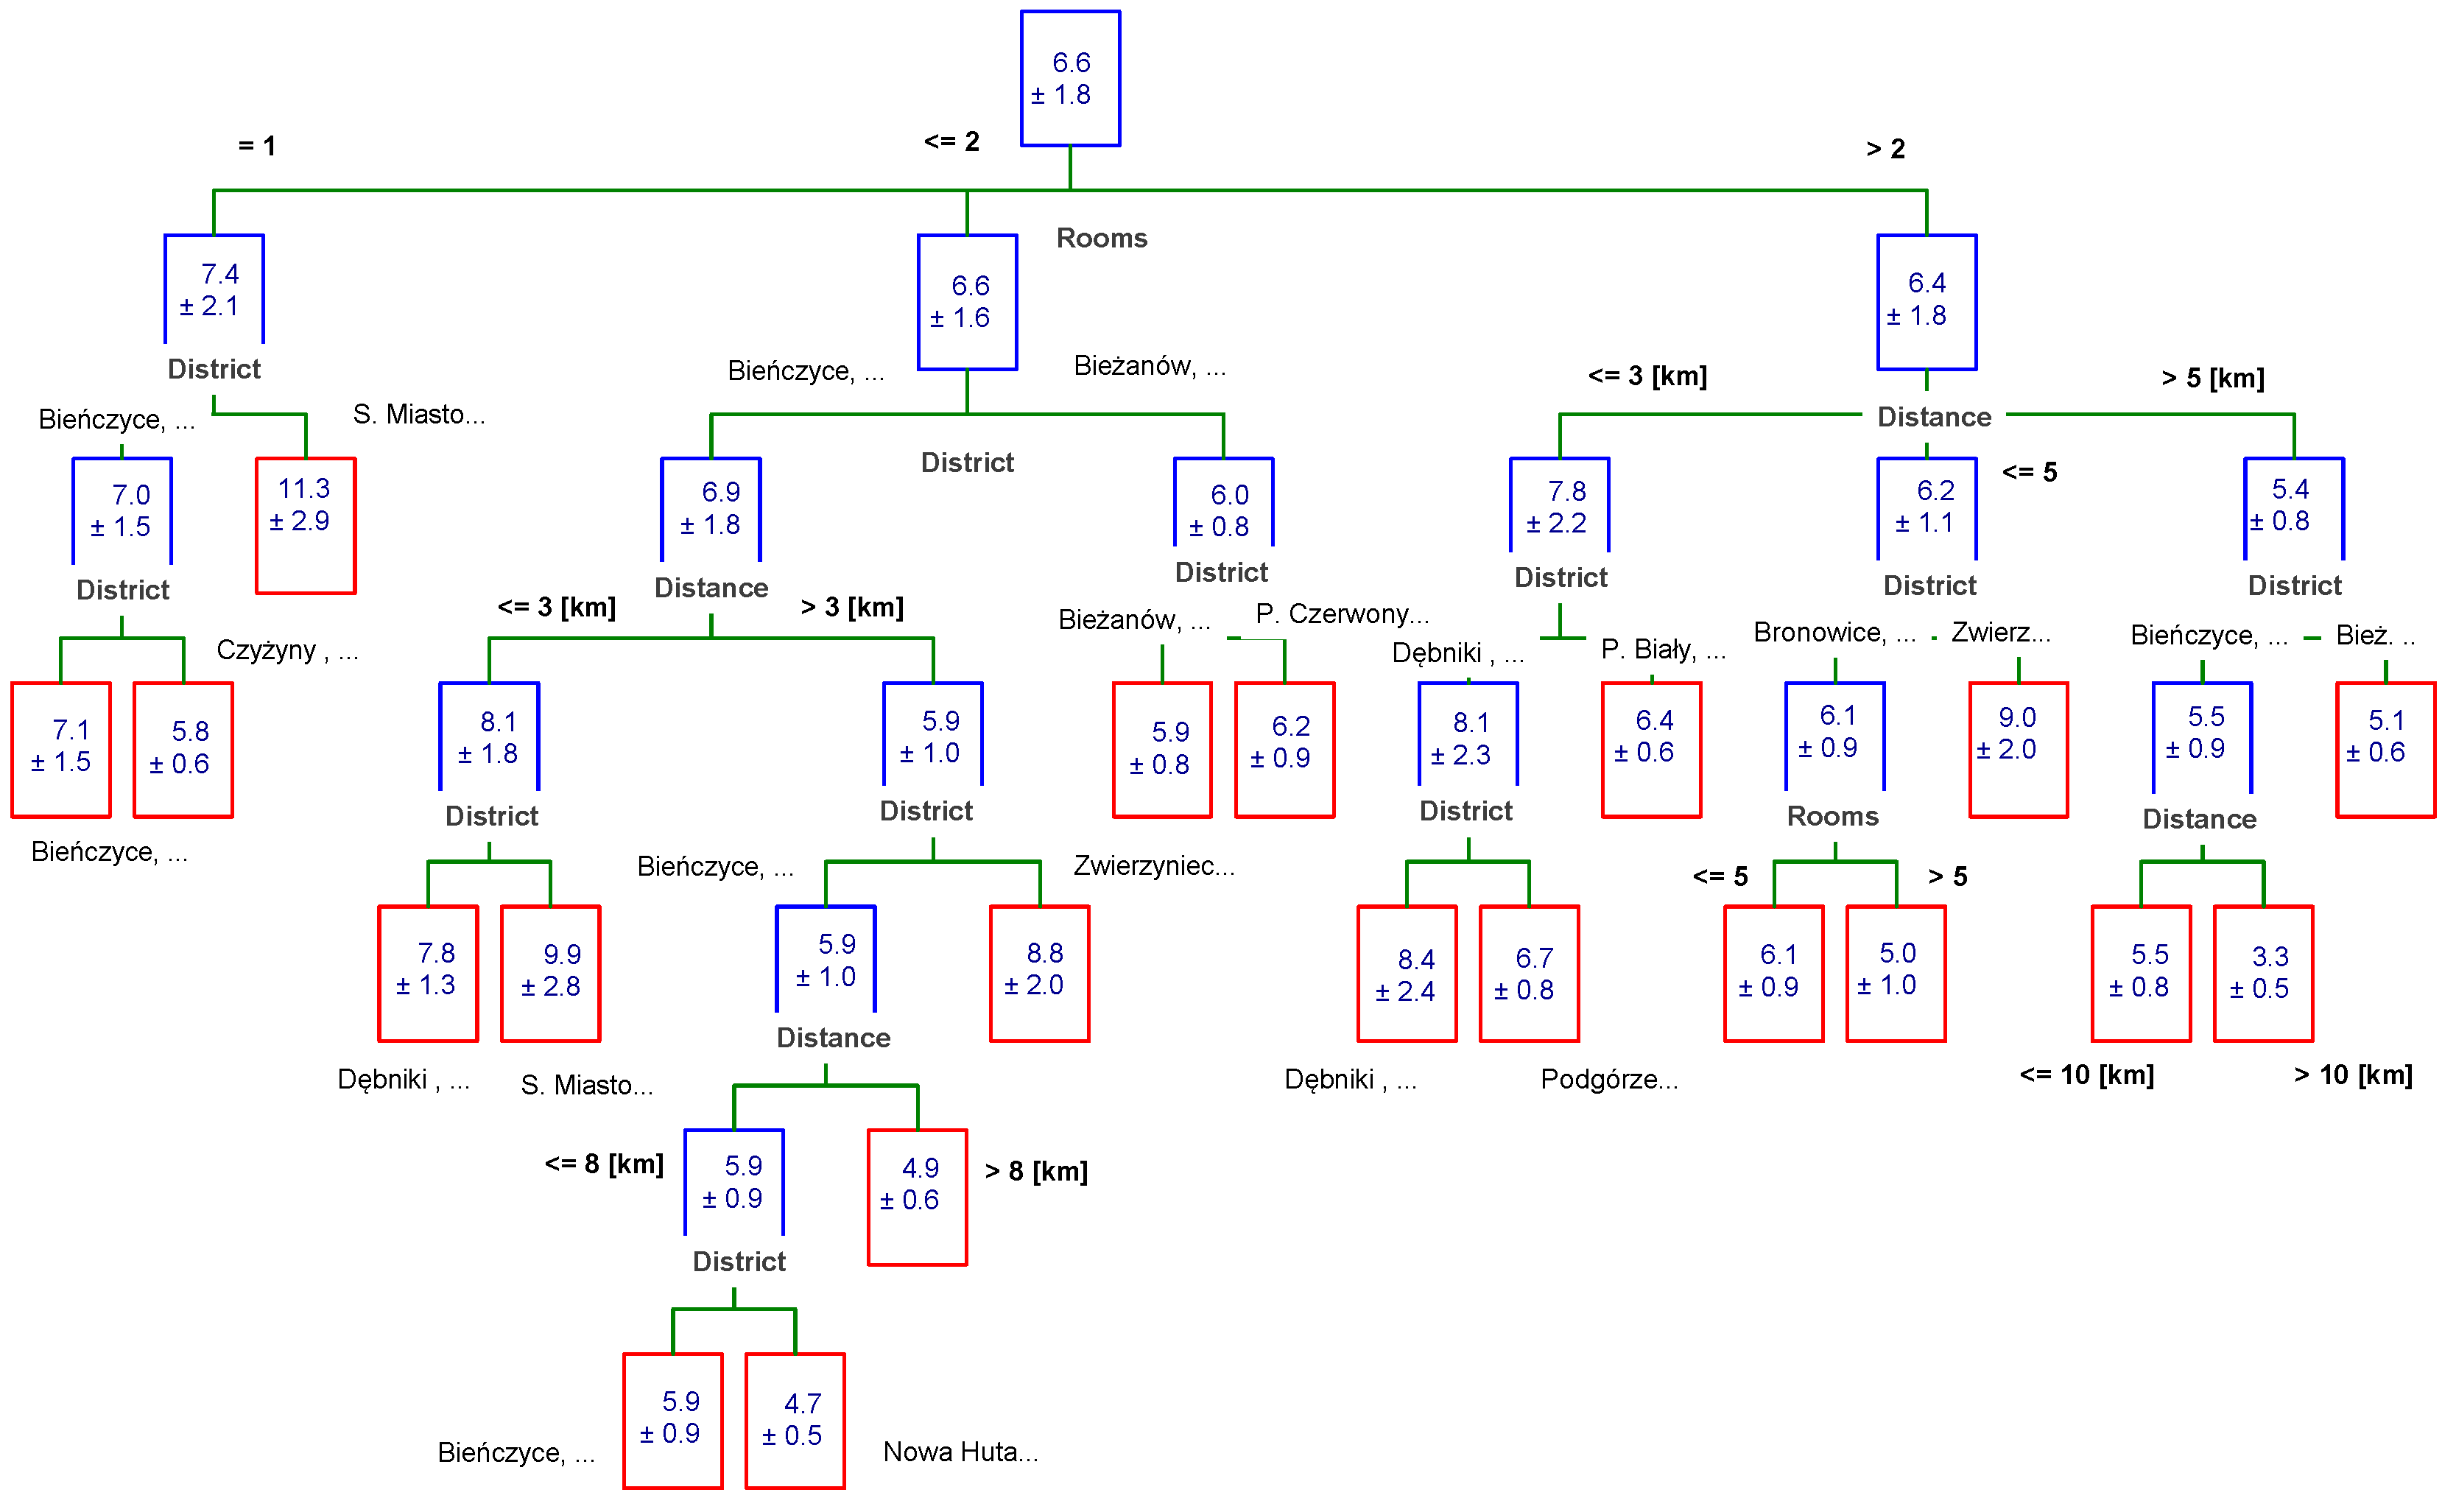
For the above parameters, considering the original database (8812 properties), more than 250 trees can be created. The characteristics of the selected sample tree are shown in Figure 26.
The average unit price at the first node is PLN 6625/m2 ± 1795 PLN/m2. Its number is equal to the number of the base, i.e., 8812 properties. The division of the first node was made based on the distance attribute, dividing the entire base into two subsets, above and below a distance of 3.5 km from the city centre. In the case of base analysis, after eliminating outliers by Cook’s distance, the corresponding tree is presented Figure 27.
In this case, it is worth noting a significant decrease in the value of variance. However, one of the most important factors determining the value of the property is still the distance from the city centre.

3.4. Chi-Square Automatic Interaction Detector (CHAID) Trees

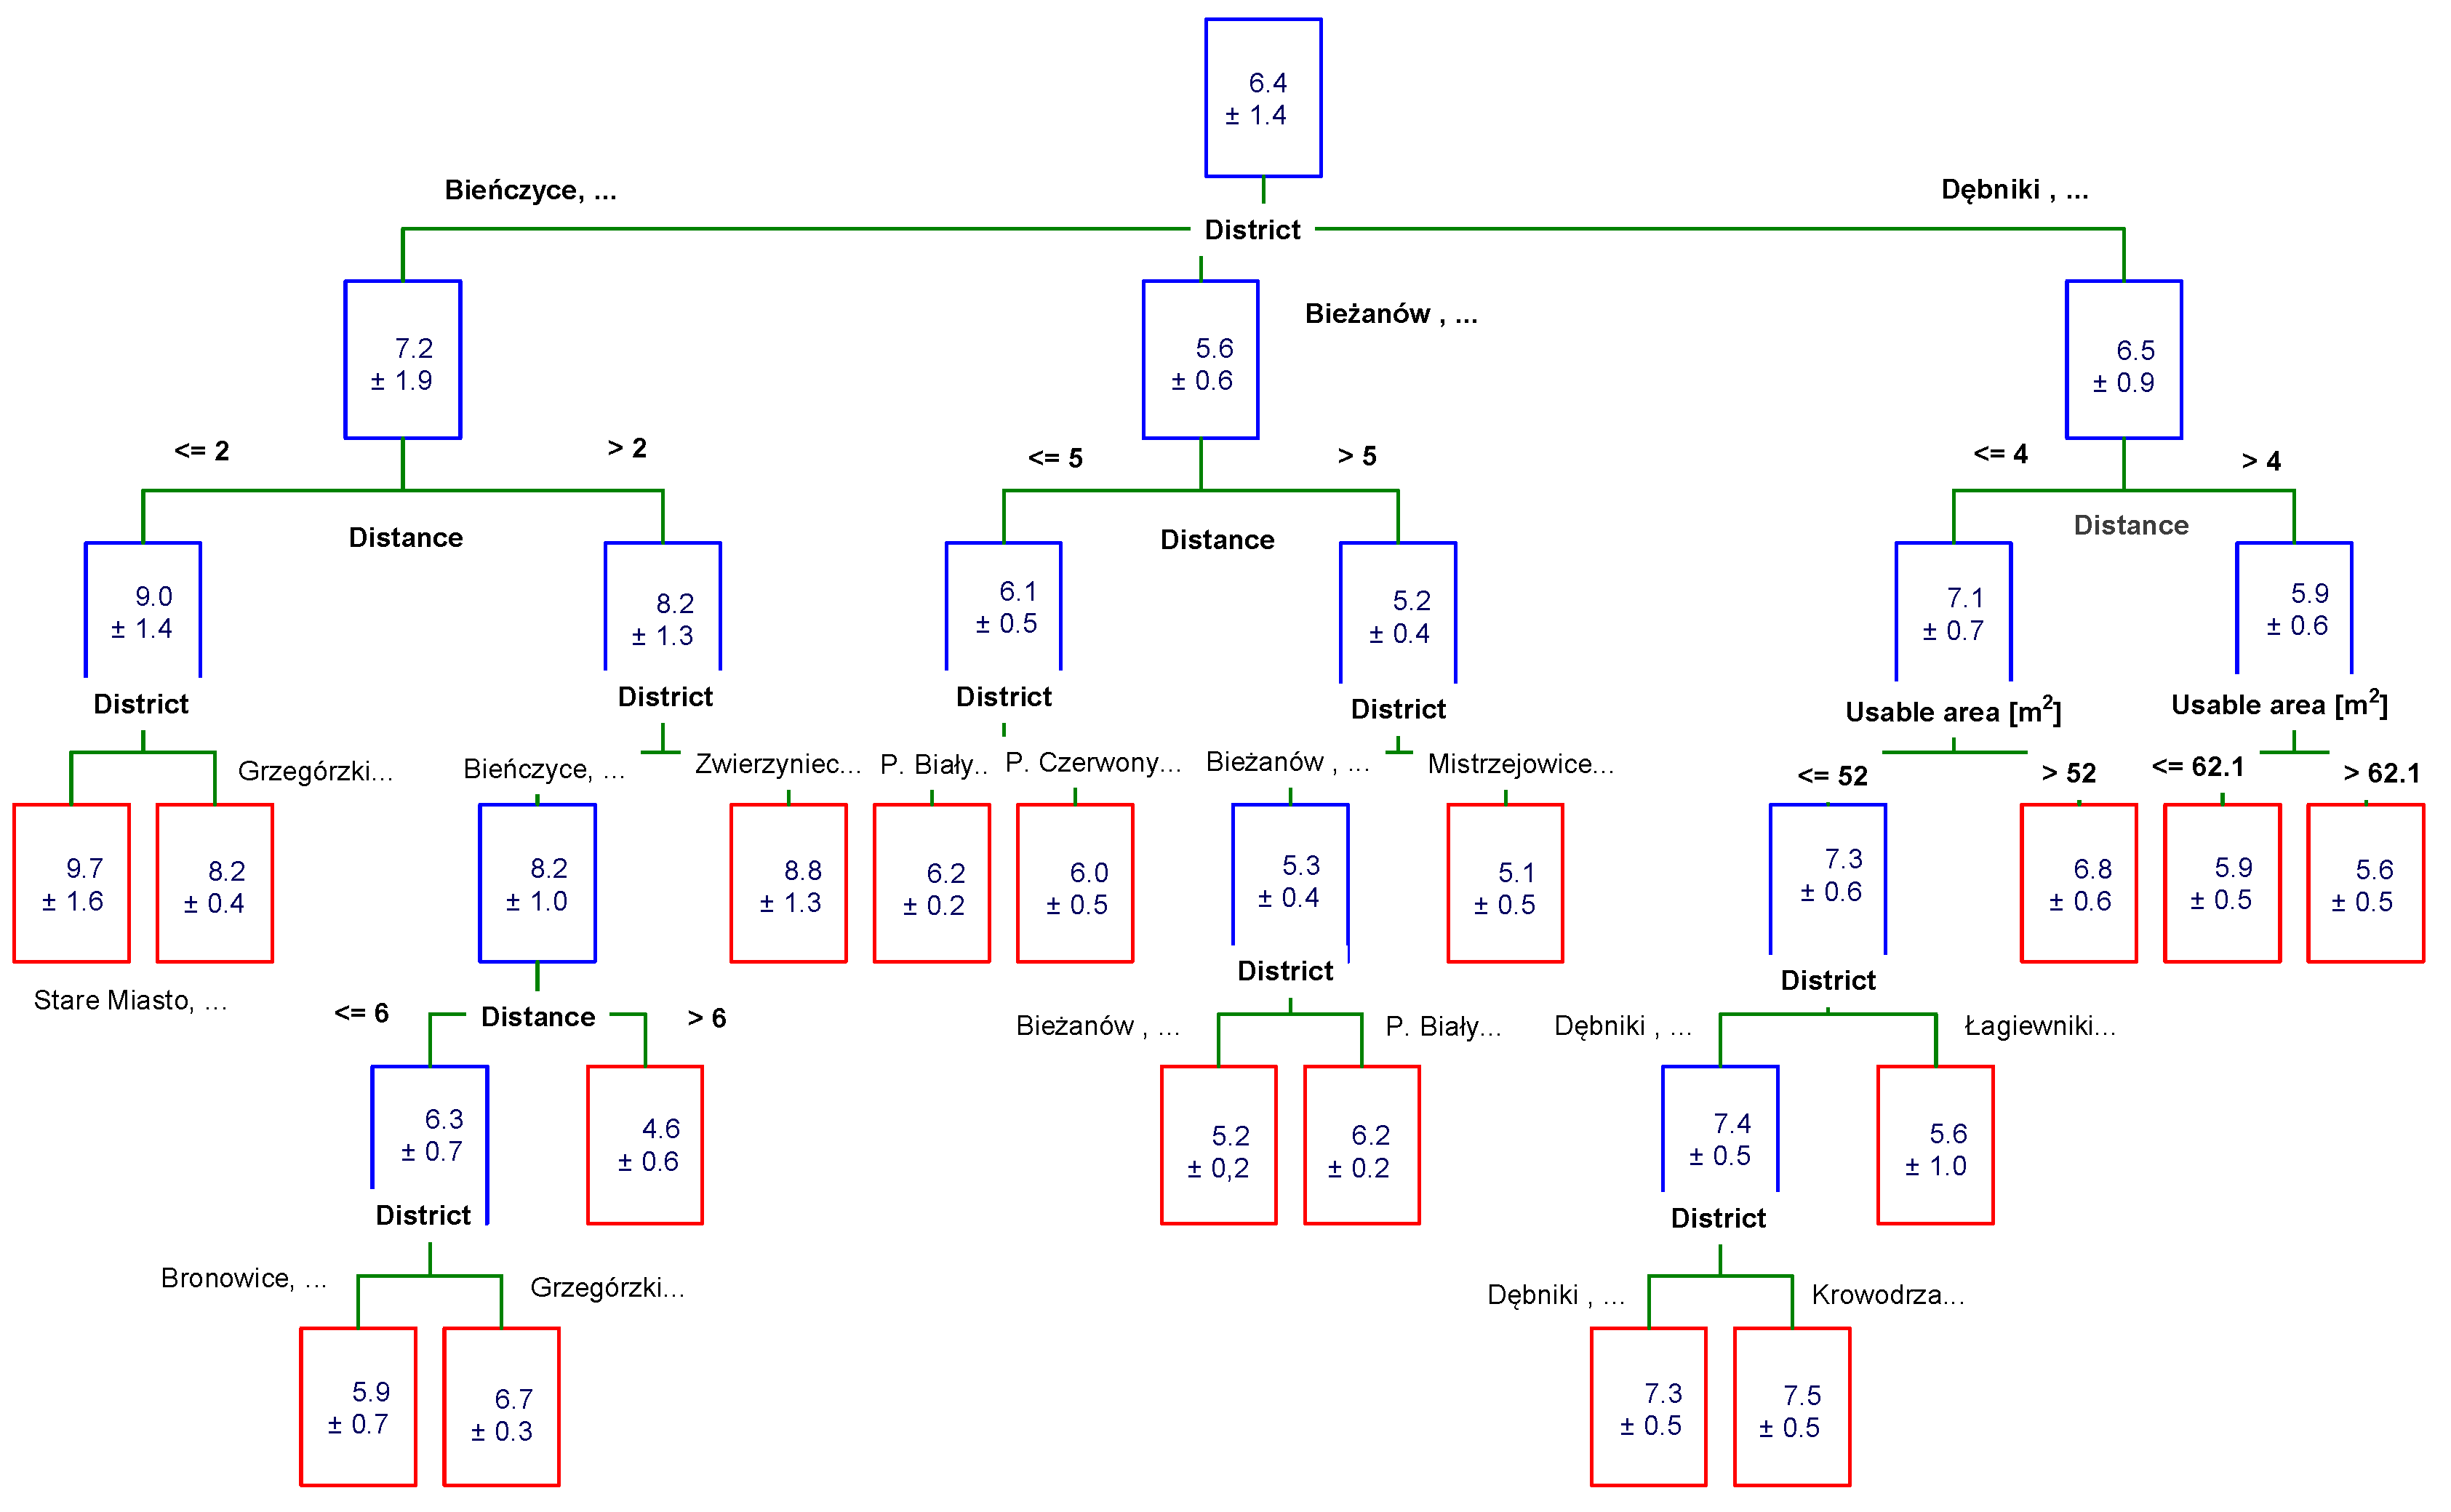
Figure 28 and Figure 29 show the CHAID decision tree model, which confirms the conclusions. The designated decision tree is a statistical classification procedure in this case. The nodes correspond to the statistical tests carried out on the values of property attributes, the branches are the potential results of the tests carried out and the leaves of these trees present the decision-making, that is, the dependent variable—in this case, the market value of the residential property in Kraków. Decision trees are straightforward to interpret and allow, among other things, estimation of the value of the property.
Division on nodes is most often done by a variable district, then by distance. It should be noted that these two predictors are interdependent. The relationship, based on the correlation of Spearman’s and Kendall’s ranks, is 0.70 and is statistically significant. The division only occurs twice because of the area of the apartment. The minimum unit prices of the property can be found in the end nodes. The maximum unit price is characterized by properties from the Old Town.

4. Conclusions

This study analysed a database of 8812 dwellings that were traded on the primary market in Kraków. The basic characteristics that shaped property prices were established, while at the same time providing variables explaining the regression model. Beta (bi) weights were designated for these variables. Regression models for individual districts of the city were determined by the least-squares method. The results show that it is not possible to use a multi regression model based on a raw database. The coefficients of determination R2 are unsatisfactory for each of the analysed districts of Kraków.
To detect outliers, the following indicators were set: projection matrix, Mahalanobis distances, standardized chi test, and Cook’s distances. Critical values were calculated based on the proposed Formulas (7), (9) and (13). The probability level of P = 0.95 was assumed. Mahalanobis distances only consider explanatory variables, so for the present issue, in which prices are the most common cause of outliers, they only provide information on influential observations. Similar regression models were obtained by eliminating outliers by standardized residuals and the Cook’s distance method. In the case of 12 districts of Kraków, the regression model can be considered satisfactory, while in six cases it cannot be used to predict the market value of the property because of the very low coefficient of determination. For these six districts, it is advisable to supplement the database with new observations and then re-eliminate outliers. Analysis of the results compiled in Table 2 shows that in most districts a negative correlation with the price per m2 has the attributes of distance from the centre and the number of rooms. The usable area affects property prices differently in different districts. On the other hand, a higher floor generally shows a positive correlation with the unit price.
The second part of the research was aimed at determining the suitability of C&RT trees to determine the effect of property attributes on their prices. Trees created using C&RT and CHAID have shown that the district attribute has a key influence on the unit price. The study was conducted for the entire database (8812 properties) and the database created after the outliers were eliminated by the Cook’s distance method. Regression and classification studies confirmed the results of analyses carried out by multiple regression. The market for residential real estate in Kraków is not uniform. The individual districts create separate price zones. The apartments with the highest unit price are located in the Old Town and Zwierzyniec districts, located at a distance of up to 1.5 km from the city centre and located on higher floors.
From all tables we present in the publication two of them show how useful the presented solution is: Table 2 and Table 4. Automating deleting outstanding data, based on clearly defined principles, significantly improves the accuracy parameters of the model describing the local real estate market. This relationship is especially beneficial when working on large data sets (several thousand). The lack of a precise definition of the criteria allowing for the recognition of real estate as an outlier is a significant obstacle here. This is especially true of Cook’s distance in real estate analysis. Based on the Fisher–Snedecor distribution, the authors precisely defined the Cook distance criterion for the analyzed data set. Further studies will include the separation of sub-zones in individual districts. The number of attributes will be expanded with features such as street, noise, distance from green areas, window exposure, bathroom area, balcony area and window view. Preliminary analyses carried out for individual districts of Kraków showed that these are important factors influencing the market value of the residential real estate.

Author Contributions

Conceptualization, E.J. and E.P.; methodology, E.J. and E.P.; software, E.P.; validation, E.J.; formal analysis, E.P. and E.J.; investigation, E.P. and E.J.; resources, E.P. and E.J.; data curation, E.J. and E.P.; writing—original draft preparation, E.P.; writing—review and editing, E.J.; visualization, E.P.; supervision, E.P.; project administration, E.P.; funding acquisition, E.J. Both authors have read and agreed to the published version of the manuscript.

Funding

This research received no external funding.

Institutional Review Board Statement

Not applicable.

Informed Consent Statement

Not applicable.

Data Availability Statement

The data that support the findings of this study are available on request from the corresponding author.

Acknowledgments

This paper was created as part of statutory research 16.16.150.545. The authors express sincere gratitude to the Journal Editor and the anonymous reviewers who spent their valued time to provide constructive comments and assistance to improve the quality of this paper.

Conflicts of Interest

The authors declare no conflict of interest.

References

  1. Marona, B.; Tomal, M. The COVID-19 pandemic impact upon housing brokers’ workflow and their clients’ attitude: Real estate market in Krakow. Entrep. Bus. Econ. Rev. 2020, 8, 221–232. [Google Scholar]
  2. Kowalczyk-Anioł, J.; Grochowicz, M.; Pawlusiński, R. How a Tourism City Responds to COVID-19: A CEE Perspective (Kraków Case Study). Sustainability 2021, 13, 7914. [Google Scholar] [CrossRef]
  3. Kilpatrick, J.A. The future of real estate information. Real Estate Issues 2001, 26, 7–14. [Google Scholar]
  4. Romańczyk, K. Krakow—The City Profile Revisited; Elsevier: New York, NY, USA, 2018; Volume 73. [Google Scholar]
  5. Available online: https://pl.wikipedia.org/wiki/Podzia%C5%82_administracyjny_Krakowa (accessed on 23 July 2021).
  6. Zyga, J. Evaluation of usefulness of real estate data contained in the register of prices and values of real estates. Infrastrukt. Ekol. Teren. Wiej. 2017. [Google Scholar] [CrossRef]
  7. Halik, Ł. Analysis of County Geoportals in Terms of Opportunities to Purchase Data of the Register of Real Estate Prices and Values Online. Real Estate Manag. Valuat. 2019, 27, 69–78. [Google Scholar] [CrossRef] [Green Version]
  8. Halik, Ł. Information and Communication Systems Used for Keeping the Register of Real Estate Prices and Values (Rrepv) in Poland. Real Estate Manag. Valuat. 2018, 26, 45–53. [Google Scholar] [CrossRef] [Green Version]
  9. Kannan, K.S.; Manoj, K. Outlier Detection in Multivariate Data. Appl. Math. Sci. 2015, 9, 2317–2324. [Google Scholar] [CrossRef]
  10. Preweda, E. Outlier detection in surveying networks. In Proceedings of the 14th International Multidisciplinary Scientific Geoconference (SGEM), Albena, Bulgaria, 17–26 June 2014; Volume 2, pp. 365–372. [Google Scholar]
  11. Crecente, R.; Alvarez, C.; Fra, U. Economic, social and environmental impact of land consolidation in Galicia. Land Use Policy 2002, 19, 135–147. [Google Scholar] [CrossRef]
  12. Wójcik-Leń, J.; Leń, P.; Mika, M.; Kryszk, H.; Kotlarz, P. Studies regarding correct selection of statistical methods for the needs of increasing the efficiency of identification of land for consolidation—A case study in Poland. Land Use Policy 2019, 87, 104064. [Google Scholar] [CrossRef]
  13. Greene, W.H. Econometric Analysis, 5th ed.; Prentice Hall: Upper Saddle River, NJ, USA, 2003. [Google Scholar]
  14. Mahalanobis, P.C. On the Generalised Distance in Statistics. Proc. Natl. Inst. Sci. India 1936, 2, 49–55. [Google Scholar]
  15. Ghorbani, H. Mahalanobis Distance and Its Application For Detecting Multivariate Outliers. Facta Univ. Ser. Math. Inform. 2019, 34, 583–595. [Google Scholar] [CrossRef]
  16. Cook, R.D. Detection of Influential Observations in Linear Regression. Technometrics 1977, 19, 15–18. [Google Scholar]
  17. Zhu, H.; Ibrahim, J.G.; Cho, H. Perturbation and scaled Cook’s distance. Ann. Stat. 2012, 40, 785–811. [Google Scholar] [CrossRef] [Green Version]
  18. Vukovic, O. Analysing bank real estate portfolio management by using impulse response function, Mahalanobis distance and financial turbulence. Procedia Econ. Financ. 2015, 30, 932–938. [Google Scholar] [CrossRef] [Green Version]
  19. Stöckl, S.; Hanke, M. Financial applications of the Mahalanobis distance. Appl. Econ. Financ. 2014, 1, 78–84. [Google Scholar] [CrossRef] [Green Version]
  20. Jung, E.; Yoon, H. Is Flood Risk Capitalized into Real Estate Market Value? A Mahalanobis-Metric Matching Approach to the Housing Market in Gyeonggi, South Korea. Sustainability 2018, 10, 4008. [Google Scholar] [CrossRef] [Green Version]
  21. Isakson, H.R. Valuation analysis of commercial real estate using the nearest neighbors appraisal technique. Growth Chang. 1988, 19, 11–24. [Google Scholar] [CrossRef]
  22. Chen, W.; Xie, X.; Wang, J.; Pradhan, B.; Hong, H.; Bui, D.T.; Duan, Z.; Ma, J. A comparative study of logistic model tree, random forest, and classification and regression tree models for spatial prediction of landslide susceptibility. Catena 2017, 151, 147–160. [Google Scholar] [CrossRef] [Green Version]
  23. Herath, S.; Maier, G. The Hedonic Price Method in Real Estate and Housing Market Research: A Review of the Literature; SRE-Discussion Papers, 2010/03; WU Vienna University of Economics and Business, Vienna, Austria, 31 March 2010. Available online: https://ideas.repec.org/p/wiw/wus009/588.html (accessed on 1 August 2021).
  24. Janssen, C.; Söderberg, B.; Zhou, J. Robust estimation of hedonic models of price and income for investment property. J. Prop. Invest. Financ. 2001, 19, 342–360. [Google Scholar] [CrossRef]
  25. Bourassa, S.C.; Cantoni, E.; Hoesli, M. Robust hedonic price indexes. Int. J. Hous. Mark. Anal. 2016, 9, 47–65. [Google Scholar] [CrossRef]
  26. Mok, H.M.K.; Chan, P.P.K.; Cho, Y.S. A hedonic price model for private properties in Hong Kong. J. Real Estate Financ. Econ. 1995, 10, 37–48. [Google Scholar] [CrossRef]
  27. Chau, K.W.; Chin, T.L. A Critical Review of Literature on the Hedonic Price Model (12 June 2002). Int. J. Hous. Sci. Appl. 2003, 27, 145–165. [Google Scholar]
  28. Scott, D.W. Partial Mixture Estimation and Outlier Detection in Data and Regression. In Theory and Applications of Recent Robust Methods; Birkhauser: Basel, Switzerland, 2014; pp. 297–306. [Google Scholar] [CrossRef] [Green Version]
  29. Rao, C.R.; Toutenburg, H. Linear models. In Linear Models; Springer: New York, NY, USA, 1995; pp. 3–18. [Google Scholar]
  30. Casson, R.J.; Farmer, L.D. Understanding and checking the assumptions of linear regression: A primer for medical researchers. Clin. Exp. Ophthalmol. 2014, 42, 590–596. [Google Scholar] [CrossRef] [PubMed]
  31. Frukacz, M.; Popieluch, M.; Preweda, E. Real Estate Price Adjustment Due to Time in the Case of Large Databases; Infrastructure and Ecology of Rural Areas; Committee on Technical Rural Infrastructure: Krakow, Poland, 2011; pp. 213–226. ISBN 1732-5587. [Google Scholar]
  32. Jasińska, E. Real estate due diligence on the example of the polish market. In Proceedings of the 14th International Multidisciplinary Scientific Geoconference (SGEM), Albena, Bulgaria, 17–26 June 2014; Volume 2, pp. 419–426. [Google Scholar]
  33. ScienceDirect Homepage. Available online: https://www.sciencedirect.com/topics/engineering/mahalanobis-distance (accessed on 20 November 2020).
  34. Algur, S.P.; Biradar, J.G. Cooks Distance and Mahanabolis Distance Outlier Detection Methods to identify Review Spam. Int. J. Eng. Comput. Sci. 2017, 6, 21638–21649. [Google Scholar] [CrossRef]
  35. Jasińska, E. Chosen Statistical Method in Real Estate Market Analysis; Wydawnictwa Akademii Górniczo-Hutniczej im; Stanisława Staszica w Krakowie: Krakow, Poland, 2012; ISBN 978-83-7464-471-6. [Google Scholar]
  36. Ho, W.K.O.; Tang, B.-S.; Wong, S.W. Predicting property prices with machine learning algorithms. J. Prop. Res. 2020, 38, 48–78. [Google Scholar] [CrossRef]
  37. Levantesi, S.; Piscopo, G. The Importance of Economic Variables on London Real Estate Market: A Random Forest Approach. Risks 2020, 8, 112. [Google Scholar] [CrossRef]
  38. Jasińska, E.; Preweda, E. The use of regression trees to the analysis of real estate market of housing. In Proceedings of the 13th International Multidisciplinary Scientific Geoconference (SGEM), Albena, Bulgaria, 16–22 June 2013; Volume 2, pp. 503–508. [Google Scholar]
  39. Buntine, W. Learning classification trees. Stat. Comput. 1992, 2, 63–73. [Google Scholar] [CrossRef] [Green Version]
Figure 1. District of Kraków [4].
Sustainability 13 09339 g001
Figure 2. Box plot of unit price grouped by district—8812 properties.
Sustainability 13 09339 g002
Figure 3. Histogram of unit price—Krakow, the whole city.
Sustainability 13 09339 g003
Figure 4. Histogram of unit price—district Bieńczyce.
Sustainability 13 09339 g004
Figure 5. Histogram of unit price—district Bieżanów.
Sustainability 13 09339 g005
Figure 6. Histogram of unit price—district Bronowice.
Sustainability 13 09339 g006
Figure 7. Histogram of unit price—district Czyżyny.
Sustainability 13 09339 g007
Figure 8. Histogram of unit price—district Dębniki.
Sustainability 13 09339 g008
Figure 9. Histogram of unit price—district Grzegórzki.
Sustainability 13 09339 g009
Figure 10. Histogram of unit price—district Krowodrza.
Sustainability 13 09339 g010
Figure 11. Histogram of unit price—district Łagiewniki.
Sustainability 13 09339 g011
Figure 12. Histogram of unit price—district Mistrzejowice.
Sustainability 13 09339 g012
Figure 13. Histogram of unit price—district Nowa Huta.
Sustainability 13 09339 g013
Figure 14. Histogram of unit price—district Podgórze.
Sustainability 13 09339 g014
Figure 15. Histogram of unit price—district Podgórze Duchackie.
Sustainability 13 09339 g015
Figure 16. Histogram of unit price—district Prądnik Biały.
Sustainability 13 09339 g016
Figure 17. Histogram of unit price—district Prądnik Czerwony.
Sustainability 13 09339 g017
Figure 18. Histogram of unit price—district Stare Miasto.
Sustainability 13 09339 g018
Figure 19. Histogram of unit price—district Swoszowice.
Sustainability 13 09339 g019
Figure 20. Histogram of unit price—district Wzgórza Krzesławickie.
Sustainability 13 09339 g020
Figure 21. Histogram of unit price—district Zwierzyniec.
Sustainability 13 09339 g021
Figure 22. Critical values K_RSand.
Sustainability 13 09339 g022
Figure 23. Cook distance criterion for 5 model parameters depending on the number of observations (n = 10 to 50) and the probability level.
Sustainability 13 09339 g023
Figure 24. Cook distance criterion for 5 model parameters depending on the number of observations (n = 50 to 1000) and a fixed level of probability.
Sustainability 13 09339 g024
Figure 25. Box plot of unit price grouped by District—8290 properties.
Sustainability 13 09339 g025
Figure 26. C&RT tree model, 20 end nodes. Database before elimination of outliers: 8812 properties.
Sustainability 13 09339 g026
Figure 27. C&RT tree model, 17 end nodes. Database after elimination of outliers: 8290 properties.
Sustainability 13 09339 g027
Figure 28. CHAID tree model, 20 end nodes. Database before elimination of outliers: 8812 properties.
Sustainability 13 09339 g028
Figure 29. CHAID tree model, 17 end nodes. Database after elimination of outliers: 8290 properties.
Sustainability 13 09339 g029
Table 1. Descriptive statistics of the database.
Number of PropertiesAverage Unit Price [PLN/m2]Median [PLN/m2]Min. Unit Price [PLN/m2]Max. Unit Price [PLN/m2]Standard Deviation [PLN/m2]
Bieńczyce704662453537336383474
Bieżanów7115273521034006805478
Bronowice1066606671850548321605
Czyżyny10295356531139998279813
Dębniki93765706173279018,0432107
Grzegórzki128176347395216615,6881459
Krowodrza46475277389473611,6291015
Łagiewniki996002624629907516992
Mistrzejowice3525116509639996799490
Nowa Huta944507446627355921432
Podgórze99667876712251011,9791302
P. Duchackie 3605855582633677511593
Prądnik Biały127662046221358512,006825
Prądnik Czerwony4396111596232769100841
Stare Miasto42410,0519473246720,4463030
Swoszowice424907495142986170338
Wzgórza K.354755449028536258890
Zwierzyniec9787098888310013,3931926
Table 2. Regression model parameters—base.
ObjectR2σDistanceUsable AreaStoreyRoomsTransaction Date
Bieńczyce0.04471-−0.090−0.550−0.120−0.330
Bieżanów0.114510.234−0.0300.279−0.160−0.180
Bronowice0.28522−0.4500.1500.150−0.3100.119
Czyżyny0.29612−0.3800.4570.061−0.680−0.160
Dębniki0.451577−0.5500.3870.071−0.1500.061
Grzegórzki0.321203−0.5100.0870.149−0.1900.055
Krowodrza0.18925−0.0500.406−0.020−0.690−0.030
Łagiewniki0.24885−0.0200.140−0.170−0.490−0.160
Mistrzejowice0.28417−0.4800.0340.172−0.270−0.310
Nowa Huta0.12414−0.0140.0130.043−0.2800.212
Podgórze0.361009−0.460−0.1700.155−0.2200.002
P. Duchackie0.19514−0.270−0.4200.1460.085−0.110
Prądnik Biały0.05804−0.010−0.0500.094−0.1400.118
Prądnik Cz.0.24736−0.4000.3450.147−0.3300.032
Stare Miasto0.272552−0.4200.2740.161−0.3300.214
Swoszowice0.03350−0.0100.295−0.080−0.3400.120
Wzgórza K.0.48685−0.150−0.0800.029−0.630−0.080
Zwierzyniec0.111863−0.140−0.4200.0860.321−0.300
Table 3. Influential properties identified by the Mahalanobis distance, projection matrix, standardized model rest and Cook distance.
CaseCook’s DistanceStandard ResidualMahalanobis DistanceRii
8730.134967−3.6540.450.14
5670.0983234.0424.660.11
5650.0797093.9920.520.10
8450.0644561.47104.040.09
5630.0574823.3720.660.14
3720.0563163.8415.60.12
5620.0552293.3320.410.10
5660.0446715.226.280.11
3710.0438083.9411.390.08
1650.0435953.8312.040.14
3520.0416622.4827.650.12
3730.0408565.086.020.08
….
8340.007834−2.196.270.08
8090.005884−2.144.710.10
1590.0043021.675.860.08
Table 4. Regression model parameters—database after removal of outlier observations.
ObjectR2σDistanceUsable AreaStoreyRoomsTransaction Date
Bieńczyce0.47317-−0.100−0.5500.914−0.330
Bieżanów0.82350−0.583−0.1100153−0.2800.210
Bronowice0.76493−0.440−0.0800.026−0.3900.135
Czyżyny0.791620.0260.911−0.010−1.3000.003
Dębniki0.92286−0.9600.4970.084−0.3200.017
Grzegórzki0.92226−0.8800.0630.028−0.2500.030
Krowodrza0.782200.0560.818−0.070−0.140−0.040
Łagiewniki0.724450.1270.203−0.260−0.800−0.050
Mistrzejowice0.78238−0.480−0.0500.191−0.2300.270
Nowa Huta0.74353−0.3900.006−0.0240.310−0.040
Podgórze0.84297−0.740−0.3000.206−0.3500.011
Podgórze D.0.47337−0.510−0.5800.1690.2440.120
Prądnik Biały0.56144−0.130−0.4400.298−0.2300.010
Prądnik Cz.0.49393−0.5400.3360.330−0.3800.065
Stare Miasto0.79781−0.7800.1750.318−0.2500.020
Swoszowice0.18228−0.270−0.5500.1600.6220.184
Wzgórza K.0.79492−0.580−0.2500.057−0.5900.211
Zwierzyniec0.43969−0.470−0.4100.0810.3970.123
Publisher’s Note: MDPI stays neutral with regard to jurisdictional claims in published maps and institutional affiliations.