
The Drivers-Pressures-State-Impact-Response Model to Structure Cause−Effect Relationships between Agriculture and Aquatic Ecosystems

 ,
,  and
and 
Abstract
:1. Introduction
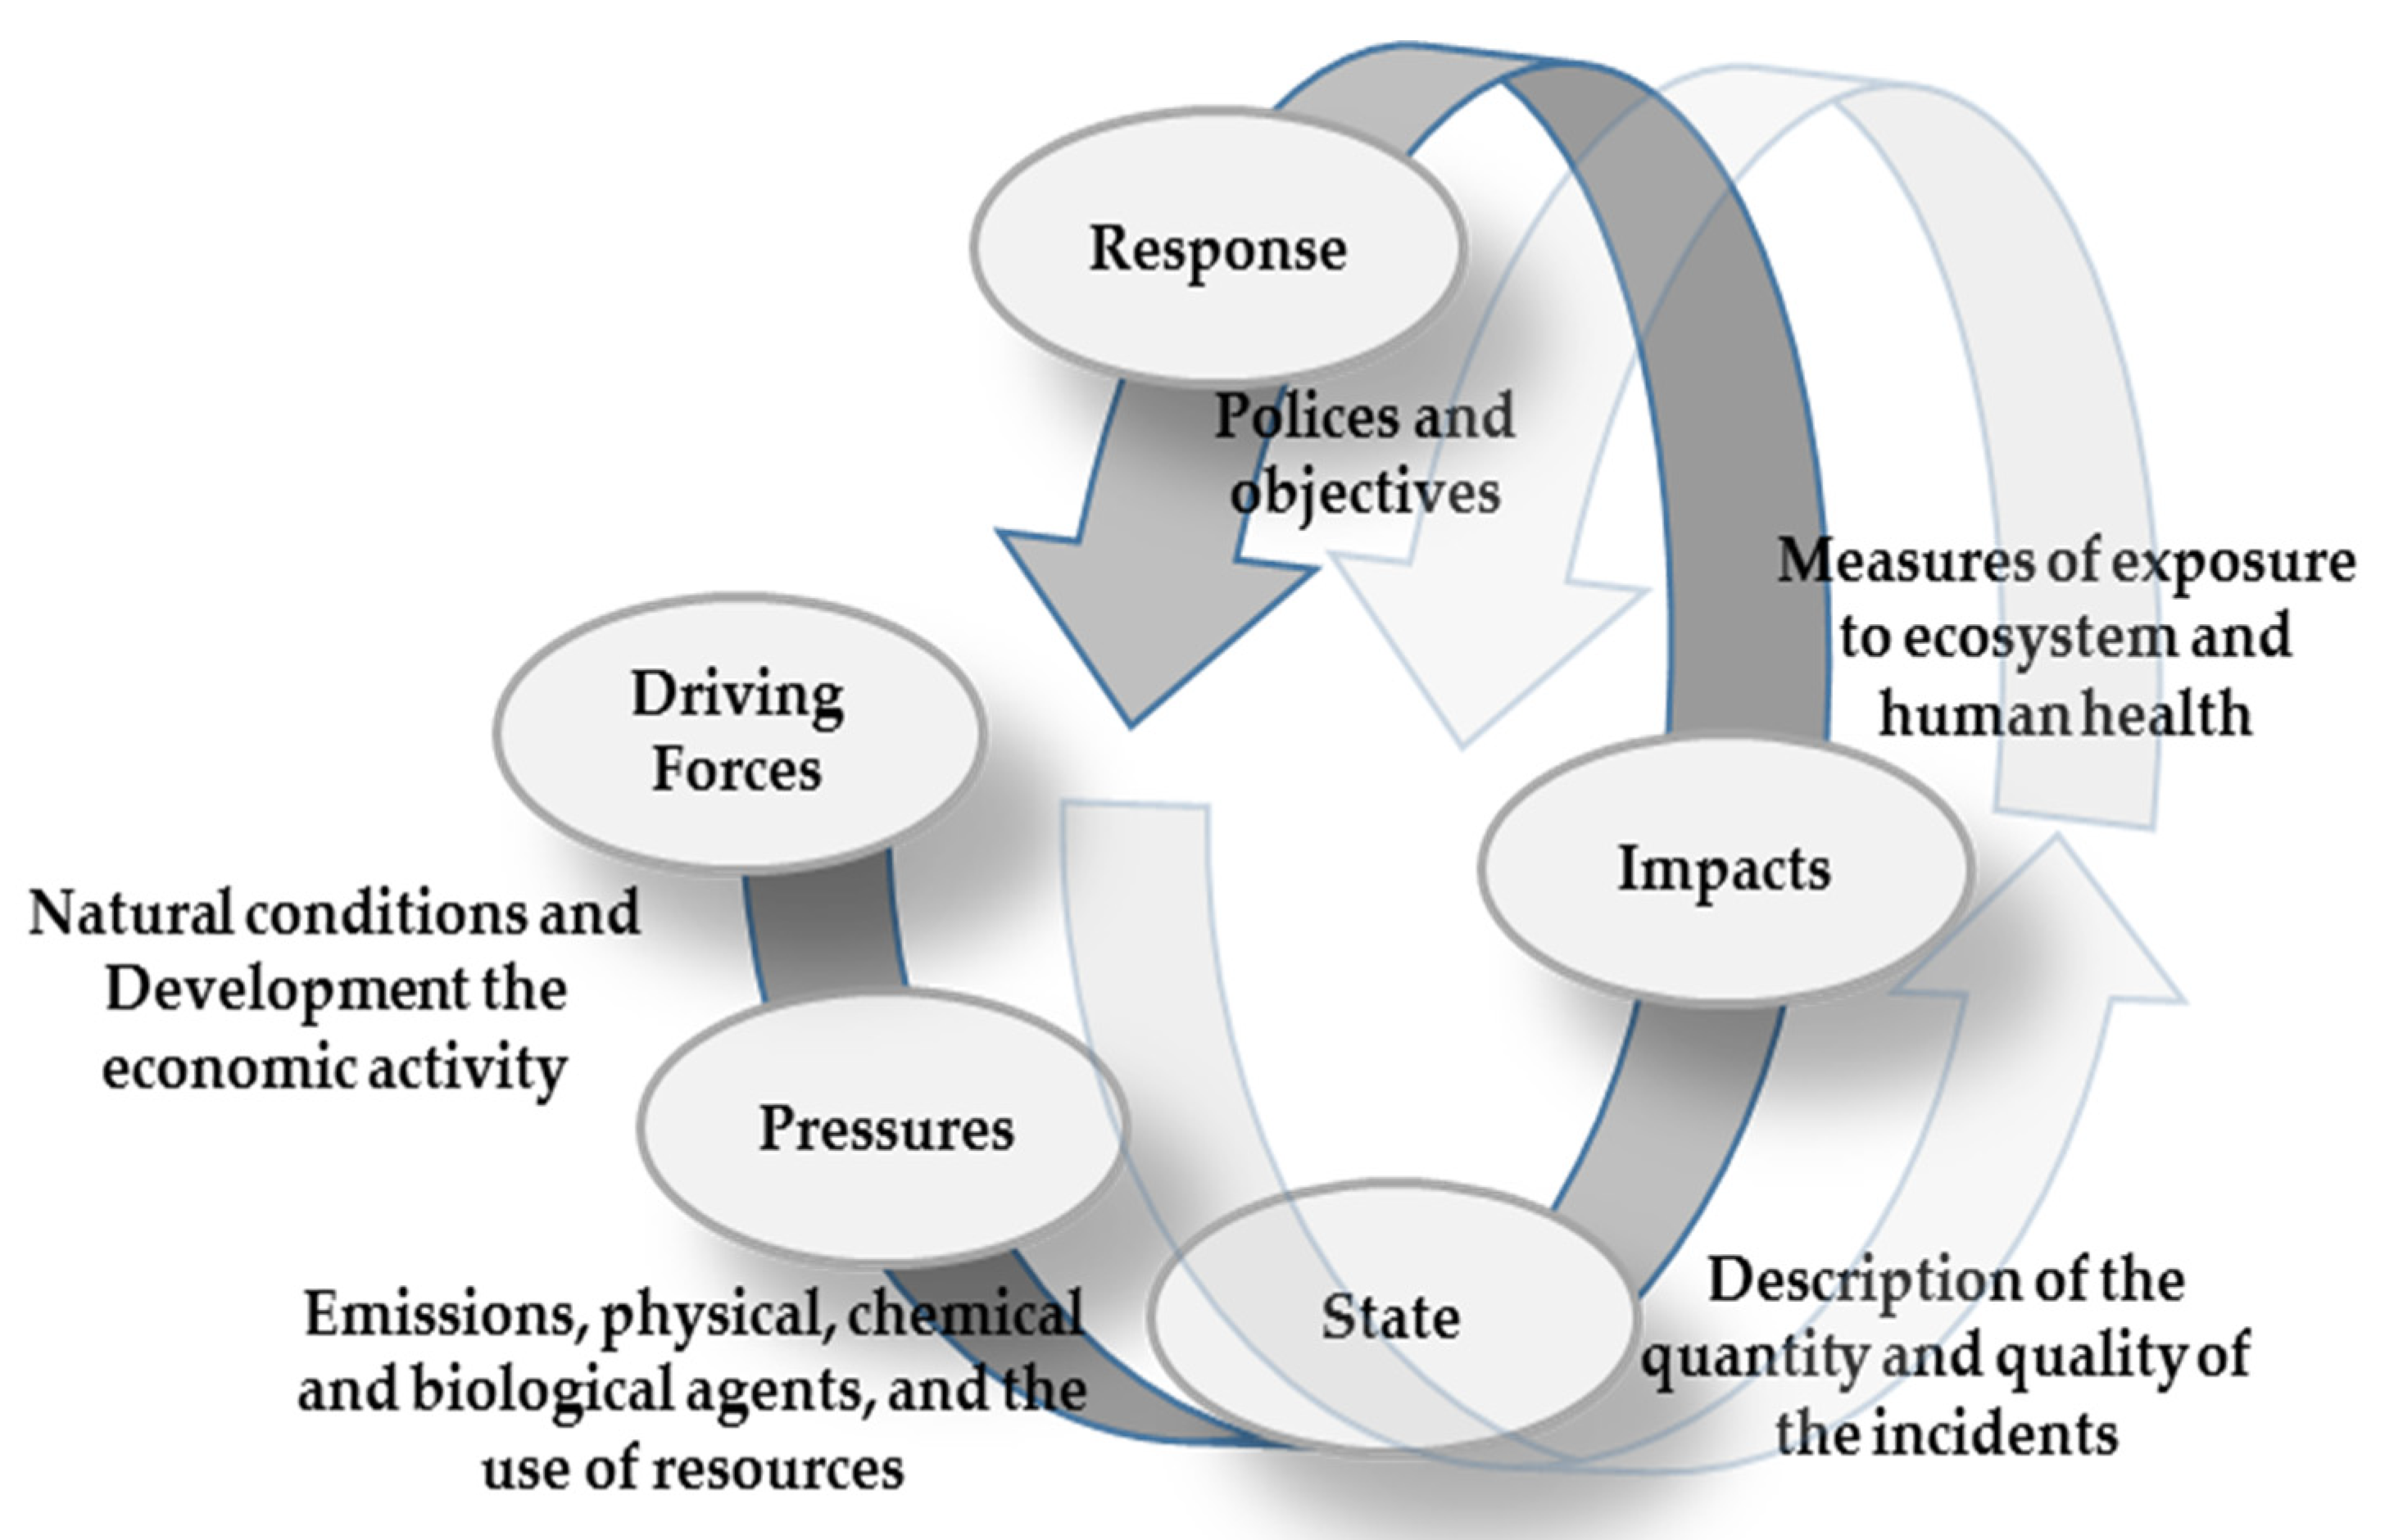
2. Brief Evolution of the DPSIR Structure
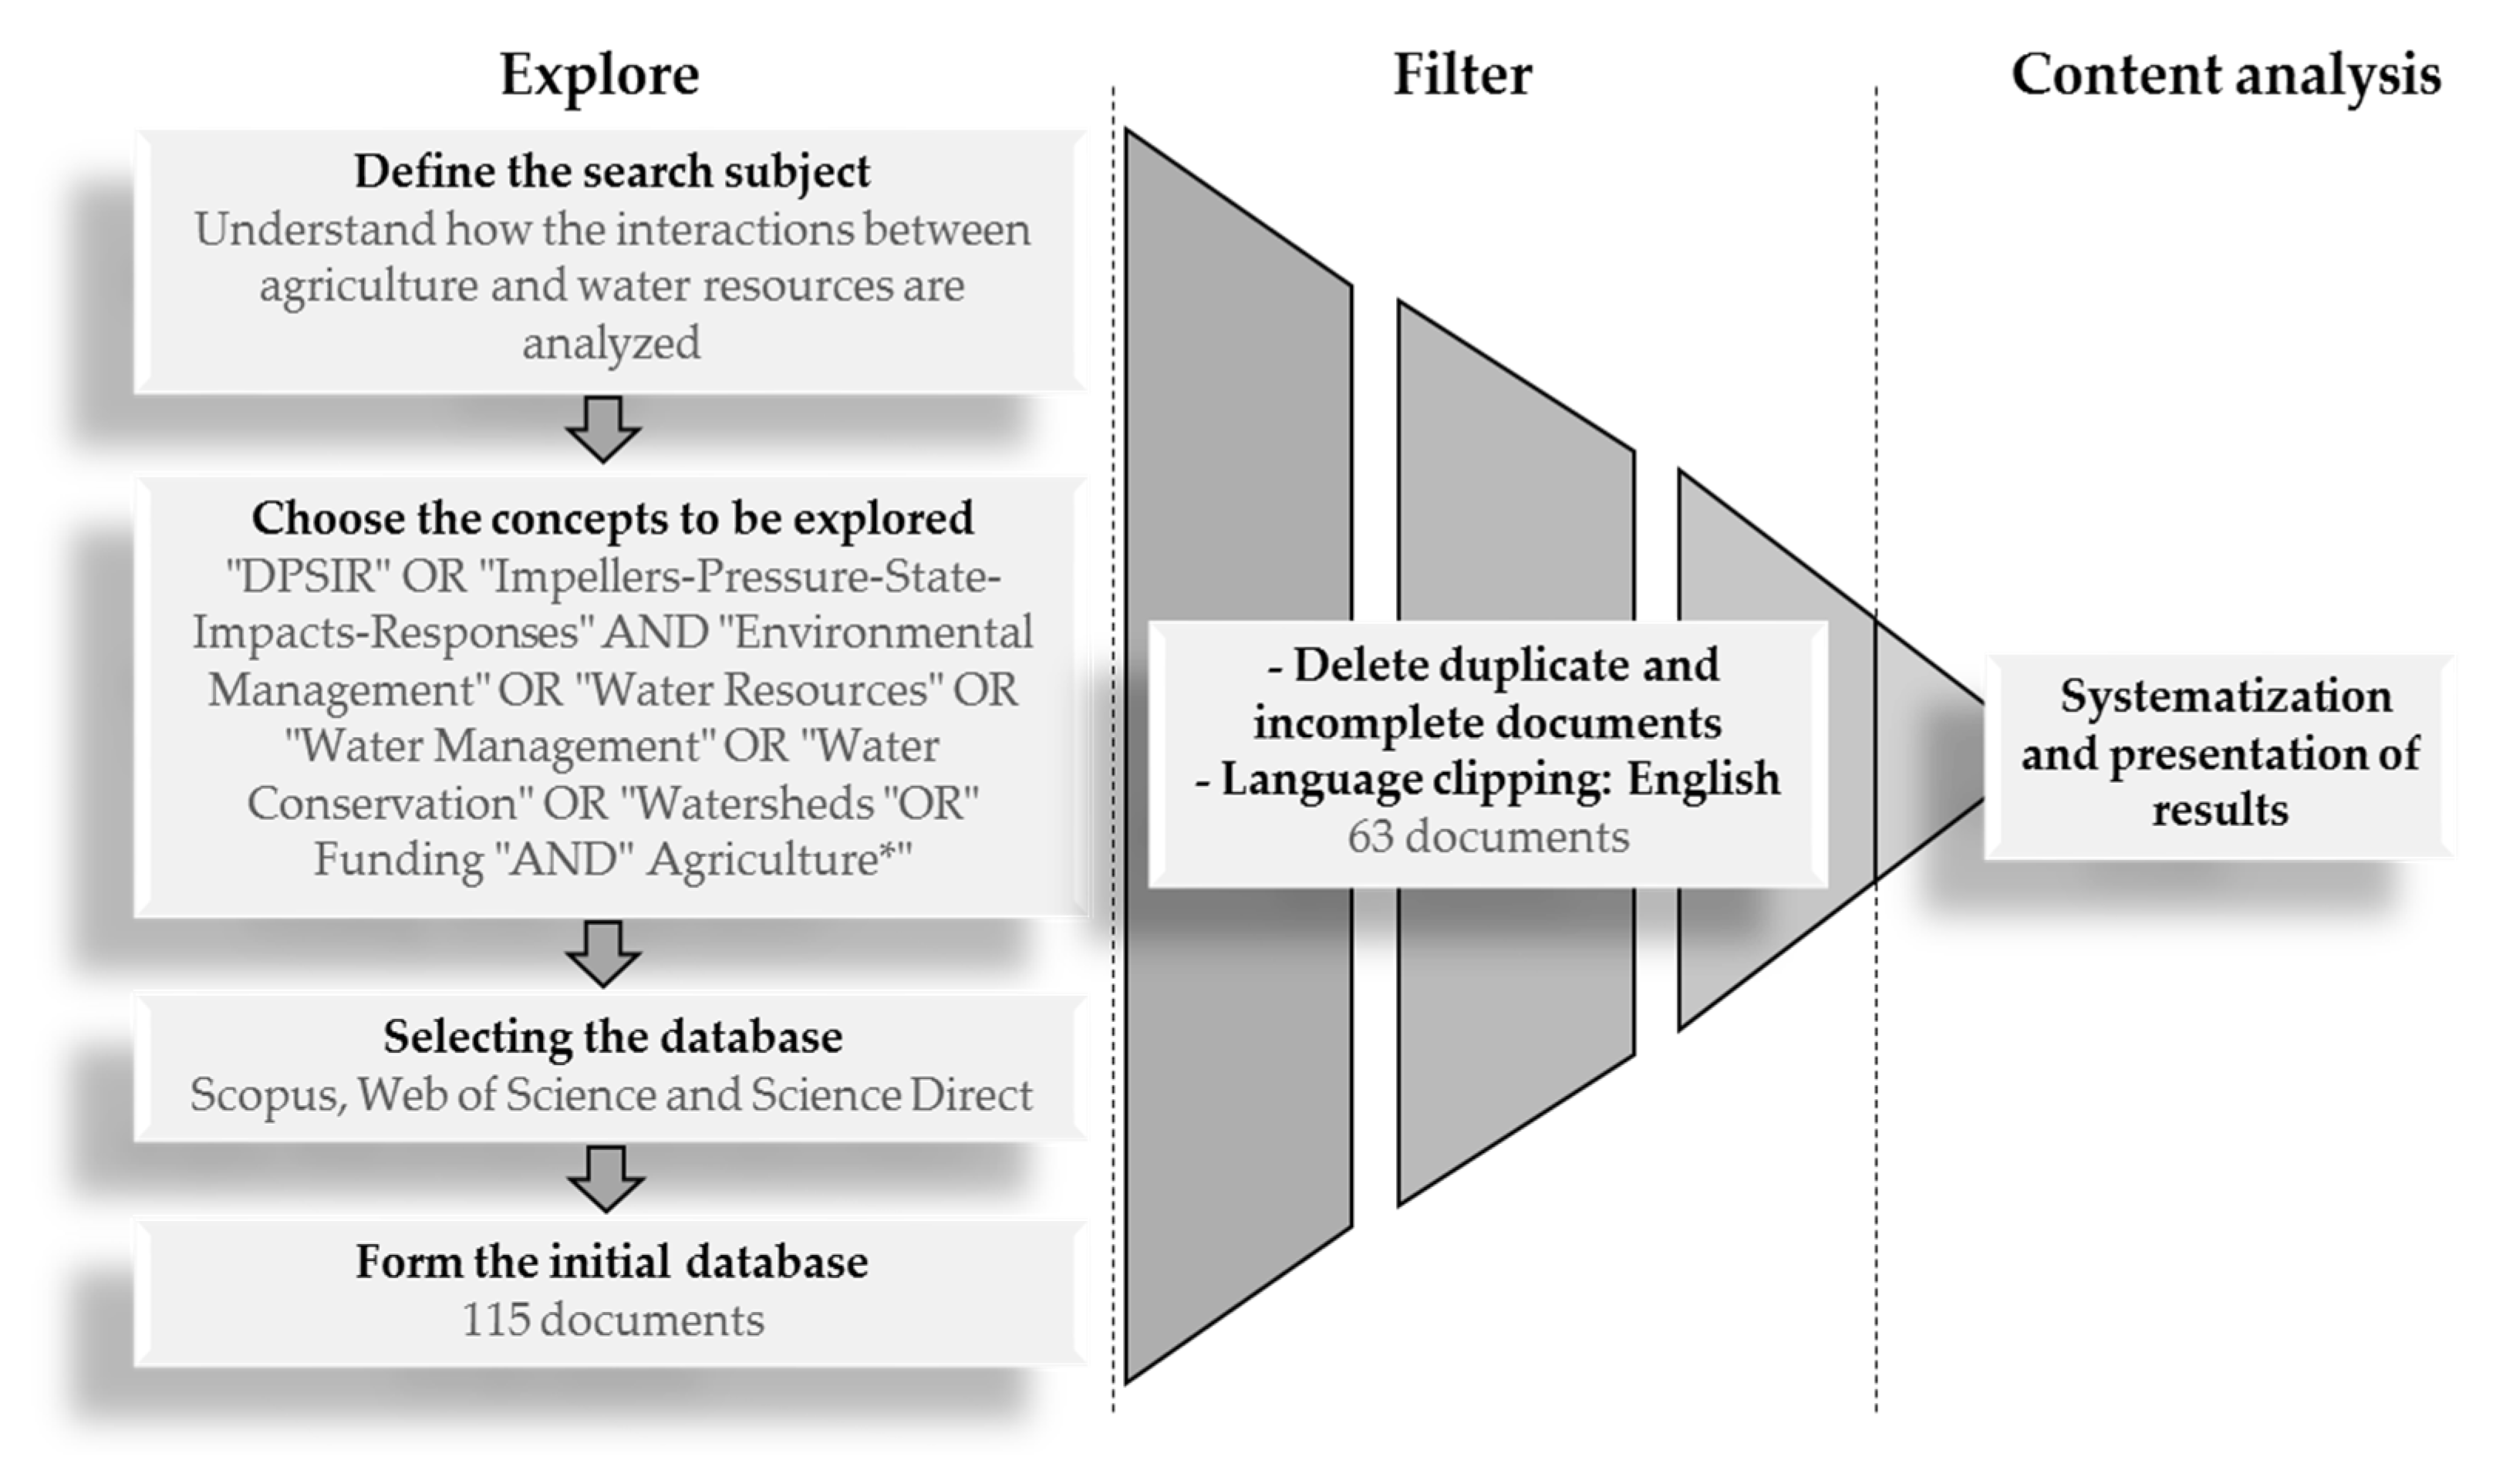
3. Materials and Methods
4. Results
4.1. Content Check
- Use of DPSIR—(A) single or (B) in conjunction with other methodologies;
- Predominant indicators in the analysis—(A) water quality, (B) water quantity, or (C) both attributes (quality and quantity);
- Source and use of information—(A) generate information from already prepared material and does not present a case study, (B) use secondary data in a specific case study, or (C) produce primary data and, together with secondary data, analyze a specific case study;
- Approach to the problem—(A) concern with indicators, (B) interest in the nature of the phenomena, or (C) balance between measuring and understanding the phenomena;
- Level of contribution of the analysis—(A) exploratory, (B) descriptive, or (C) explanatory;
- Collaboration for the development of research—(N) national or (I) international; and
- Participation of stakeholders—(S) participatory or non-participatory construction model.
4.2. DPSIR Structure Parameters and Components
5. Discussion
6. Conclusions
- The DPSIR framework demonstrates the capacity to organize and present causal relationships between agricultural activities and the environment related to ecological, social, or economic perspectives.
- DPSIR is a simple and generic application model; however, the interpretations of the variable components of pressures, state, and impact are not homogeneous. Thus, it is difficult to establish a standard of socioeconomic and agri-environmental indicators.
- In the documents analyzed here, the DPSIR model was not used to explain synergic situations between the environment and agricultural activities, that is, to present sustainable development scenarios. In contrast, they have been directed to illustrate situations where agricultural activities lead to environmental degradation.
- The stress factors of an anthropogenic origin that affect ecosystems are difficult to measure, and the available data are often limited.
Author Contributions
Funding
Data Availability Statement
Acknowledgments
Conflicts of Interest
References
- Lewison, R.L.; Rudd, M.A.; Al-Hayek, W.; Baldwin, C.; Beger, M.; Lieske, S.N.; Jones, C.; Satumanatpan, S.; Junchompoo, C.; Hines, E. How the DPSIR framework can be used for structuring problems and facilitating empirical research in coastal systems. Environ. Sci. Policy 2016, 56, 110–119. [Google Scholar] [CrossRef] [Green Version]
- Philippi, A., Jr.; Tucci, C.E.M.; Hogan, D.J.; Navegantes, R. Interdisciplinaridade em Ciências Ambientais; Signus: São Paulo, Brazil, 2000; p. 320. [Google Scholar]
- Schulze, I.; Colby, M.A. A Conceptual Framework to Support Development and Use of Environmental Information in Decision-Making; European Environment Agency: Washington, DC, USA, 1995; p. 51. [Google Scholar]
- Community Europea. Directiva 2000/60/CE Del Parlamento Europeo y Del Consejo, de 23 de Octubre de 2000, Por la Que se Establece un Marco Comunitario de Actuación en el Ámbito de la Política de Aguas. D.O.L. 327 de December 2000. Available online: https://www.boe.es/buscar/doc.php?id=DOUE-L-2000-82524 (accessed on 7 April 2021).
- Pirrone, N.; Trombino, G.; Cinnirella, S.; Algieri, A.; Bendoricchio, G.; Palmeri, L. The Driver-Pressure-State-Impact-Response (DPSIR) approach for integrated catchment-coastal zone management: Preliminary application to the Po catchment-Adriatic Sea coastal zone system. Reg. Environ. Chang. 2005, 5, 111–137. [Google Scholar] [CrossRef]
- Mimidis, K.; Andrikakou, P.; Kallioras, A.; Pliakas, F. The DPSIR approach to groundwater management for sustainable development in coastal areas: The case of Nea Peramos aquifer system, Kavala, Greece. Water Util. J. 2017, 16, 67–80. [Google Scholar]
- Haase, D.; Nuissl, H. Does urban sprawl drive changes in the water balance and policy?: The case of Leipzig (Germany) 1870–2003. Landsc. Urban Plan. 2007, 80, 1–13. [Google Scholar] [CrossRef]
- Kagalou, I.; Leonardos, I.; Anastasiadou, C.; Neofytou, C. The DPSIR Approach for an Integrated River Management Framework. A Preliminary Application on a Mediterranean Site (Kalamas River -NW Greece). Water Resour. Manag. 2012, 26, 1677–1692. [Google Scholar] [CrossRef]
- Borja, Á.; Galparsoro, I.; Solaun, O.; Muxika, I.; Tello, E.M.; Uriarte, A.; Valencia, V. The European Water Framework Directive and the DPSIR, a methodological approach to assess the risk of failing to achieve good ecological status. Estuar. Coast. Shelf Sci. 2006, 66, 84–96. [Google Scholar] [CrossRef]
- Expósito, A.; Berbel, J. Sustainability implications of deficit irrigation in a mature water economy: A case study in Southern Spain. Sustainability 2017, 9, 1144. [Google Scholar] [CrossRef] [Green Version]
- Giupponi, C.; Vladimirova, I. Ag-PIE: A GIS-based screening model for assessing agricultural pressures and impacts on water quality on a European scale. Sci. Total Environ. 2006, 359, 57–75. [Google Scholar] [CrossRef] [PubMed]
- Psomas, A.; Vryzidis, I.; Spyridakos, A.; Mimikou, M. MCDA approach for agricultural water management in the context of water–energy–land–food nexus. Oper. Res. 2018, 21, 689–723. [Google Scholar] [CrossRef]
- Holman, I.P.; Rounsevell, M.D.A.; Shackley, S.; Harrison, P.A.; Nicholls, R.J.; Berry, P.M.; Audsley, E. A regional, multi-sectoral and integrated assessment of the impacts of climate and socio-economic change in the UK: Part I. Methodology. Clim. Chang. 2005, 71, 9–41. [Google Scholar] [CrossRef]
- Bär, R.; Rouholahnedjad, E.; Rahman, K.; Abbaspour, K.C.C.; Lehmann, A.; Rouholahnejad, E.; Rahman, K.; Abbaspour, K.C.C.; Lehmann, A. Climate change and agricultural water resources: A vulnerability assessment of the Black Sea catchment. Environ. Sci. Policy 2015, 46, 57–69. [Google Scholar] [CrossRef]
- Carr, E.R.; Wingard, P.M.; Yorty, S.C.; Thompson, M.C.; Jensen, N.K.; Roberson, J. Applying DPSIR to sustainable development. Int. J. Sust. Dev. World 2017, 4, 543–555. [Google Scholar] [CrossRef]
- Tsai, H.-T.; Tzeng, S.-Y.; Fu, H.-H.; Wu, C.-T.J. Managing multinational sustainable development in the European Union based on the DPSIR framework. Afr. J. Bus. Manag. 2019, 3, 727–735. [Google Scholar] [CrossRef]
- Walmsley, J.J. Framework for measuring sustainable development in catchment systems. Environ. Manag. 2002, 29, 195–206. [Google Scholar] [CrossRef] [PubMed]
- Geng, Q.; Wu, P.; Zhao, X.; Wang, Y. A framework of indicator system for zoning of agricultural water and land resources utilization: A case study of Bayan Nur, Inner Mongolia. Ecol. Indic. 2014, 40, 43–50. [Google Scholar] [CrossRef]
- Sun, S.; Wang, Y.; Liu, J.; Cai, H.; Wu, P.; Geng, Q.; Xu, L. Sustainability assessment of regional water resources under the DPSIR framework. J. Hydrol. 2016, 532, 140–148. [Google Scholar] [CrossRef]
- WWAP. Programa Mundial de Evaluación de los Recursos Hídricos de la UNESCO; Informe Mundial de las Naciones Unidas sobre el Desarrollo de los Recursos Hídricos 2019: No dejar a nadie atrás; Unesco: París, Francia, 2019; pp. 1–213. Available online: https://www.unwater.org/ (accessed on 18 August 2021).
- Tiecher, T.; Minella, J.P.G.; Caner, L.; Zafar, M.; Capoane, V.; Evrard, O.; Le Gall, M.; Rheinheimer, D.S. Quantifying land use contributions to suspended sediment in a large cultivated catchment of Southern Brazil (Guaporé River, Rio Grande do Sul). Agric. Ecosyst. Environ. 2017, 237, 95–108. [Google Scholar] [CrossRef]
- Zafar, M.; Tiecher, T.; Capoane, V.; Troian, A.; Rheinheimer, D. Characteristics, lability and distribution of phosphorus in suspendedsediment from a subtropical catchment under diverse anthropicpressure in Southern Brazil. Ecol. Eng. 2017, 100, 28–45. [Google Scholar] [CrossRef]
- Bastos, M.C. Étude de la Contamination de L’environnement Par Les Médicaments à Usage Humain et Vétérinaire Dans le Sud du Brésil. Theoretical and/or Physical Chemistry. Université de Poitiers, 2017. Available online: https://tel.archives-ouvertes.fr/tel-01858332/document (accessed on 16 July 2021).
- Bastos, M.C.; Rheinheimer, D.S.; Aubertheau, É.; Castro Lima, J.A.M.; Le Guet, T.; Caner, L.; Mondamert, L.; Labanowski, J. Antibiotics and microbial resistance in Brazilian soils under manure application. Land. Degrad. Dev. 2018, 29, 2472–2484. [Google Scholar] [CrossRef]
- Castro Lima, J.A.M.; Labanowski, J.; Bastos, M.C.; Zanella, R.; Prestes, O.; Damian, M.L.; Granado, E.; Tiecher, T.; Zafar, M.; Troian, A.; et al. “Modern agriculture” transfers many pesticides molecules to watercourses: A case study of a representative rural catchment of southern Brazil. Environ. Sci. Pollut. Res. 2020, 27, 10581–10598. [Google Scholar] [CrossRef]
- Knott, J.; Mueller, M.; Pander, J.; Geist, J. Effectiveness of catchment erosion protection measures and scale-dependent response of stream biota. Hydrobiologia 2019, 830, 77–92. [Google Scholar] [CrossRef]
- Bierschenk, A.M.; Mueller, M.; Pander, J.; Geist, J. Impact of catchment land use on fish community composition in the headwater areas of Elbe, Danube and Main. Sci. Total Environ. 2019, 652, 66–74. [Google Scholar] [CrossRef]
- Geist, J.; Hawkins, S.J. Habitat recovery and restoration in aquatic ecosystems: Current progress and future challenges. Aquat. Conserv. Mar. Freshw. Ecosyst. 2016, 26, 942–962. [Google Scholar] [CrossRef]
- Rapport, D.; Friend, A. Towards a Comprehensive Framework for Environmental Statistics: A Stress-Response Approach, 1st ed.; Minister of Supply and Services Canada: Ottawa, ON, Canada, 1979; pp. 11–510. [Google Scholar]
- OECD. Core Set of INDICATORS for Environmental Performance Reviews; A Synthesis Report by the Group on the State of the Environment; OECD Publishing: Paris, France, 1993; pp. 1–37. [Google Scholar]
- Gabrielsen, P.; Bosch, P. Environmental Indicators: Typology and Overview; Technical Report n 25; European Environment Agency: Copenhagen, Denmark, 1999; pp. 1–19. Available online: https://doi.org/arXiv:1802.04810v3 (accessed on 19 August 2021).
- Berbel, J.; Expósito, A.; Gutiérrez-Martín, C.; Mateos, L. Effects of the Irrigation Modernization in Spain 2002–2015. Water Resour. Manag. 2019, 33, 1835–1849. [Google Scholar] [CrossRef]
- Troian, A. Análise Multidimensional Das Pressões Dos Sistemas de Produção Agrícola na Bacia Hidrográfica do Rio Guaporé_Brasil-RS. Universidade Federal de Pelotas, Pelotas-RS/BR, 2020. Available online: http://guaiaca.ufpel.edu.br/ (accessed on 16 July 2021).
- Stanners, D.; Bosch, P.; Dom, A.; Gabrielsen, P.; Gee, D.; Martin, J.; Rickard, L.; Weber, J.L. Frameworks for environmental assessment and indicators at the EEA. In Sustainability Indicators: A Scientific Assessment, 1st ed.; Hák, T., Moldan, B., Dahl, L.A., Eds.; Island Press: London, UK, 2007; pp. 125–144. [Google Scholar]
- Patrício, J.; Elliott, M.; Mazik, K.; Papadopoulou, K.; Smith, C.J. DPSIR—Two Decades of Trying to Develop a Unifying Framework for Marine Environmental Management? Front. Mar. Sci. 2016, 3, 177. [Google Scholar] [CrossRef]
- Turner, R.K.; Lorenzoni, I.; Beaumont, N.; Bateman, I.J.; Langford, I.H.; Mcdonald, A.L. Coastal Management for Sustainable Development: Analysing Environmental and Socio-Economic Changes on the UK Coast. Geogr. J. 1998, 3, 269–281. [Google Scholar] [CrossRef]
- Pritchard, A. Statistical bibliography or bibliometrics? J. Publ. 1969, 25, 348–349. [Google Scholar]
- Gari, S.R.; Ortiz Guerrero, C.E.; A-Uribe, B.; Icely, J.D.; Newton, A. A DPSIR-analysis of water uses and related water quality issues in the Colombian Alto and Medio Dagua Community Council. Water Sci. 2018, 32, 318–337. [Google Scholar] [CrossRef] [Green Version]
- Kubacka, M.; Bródka, S.; Macias, A. Selecting agri-environmental indicators for monitoring and assessment of environmental management in the example of landscape parks in Poland. Ecol. Indic. 2016, 71, 377–387. [Google Scholar] [CrossRef]
- Mehryar, S.; Sliuzas, R.; Sharifi, A.; Reckien, D.; Maarseveen, M. A structured participatory method to support policy option analysis in a social-ecological system. J. Environ. Manag. 2017, 197, 360–372. [Google Scholar] [CrossRef] [PubMed]
- Zieba, F.W.; Yengoh, G.T.; Tom, A. Seasonal Migration and Settlement around Lake Chad: Strategies for Control of Resources in an Increasingly Drying Lake. Resources 2017, 3, 41. [Google Scholar] [CrossRef] [Green Version]
- Al-Kalbani, M.S.; Price, M.F.; O’Higgins, T.; Ahmed, M.; Abahussain, A. Integrated environmental assessment to explore water resources management in Al Jabal Al Akhdar, Sultanate of Oman. Reg. Environ. Chang. 2015, 16, 1345–1361. [Google Scholar] [CrossRef]
- Wang, F.; Mu, X.; Li, R.; Fleskens, L.; Stringer, L.C.; Ritsema, C.J. Co-evolution of soil and water conservation policy and human–environment linkages in the Yellow River Basin since 1949. Sci. Total Environ. 2015, 508, 166–177. [Google Scholar] [CrossRef] [PubMed] [Green Version]
- Benqlilou, H.; Bensaid, S. Protection and performance of the ancestral water supply system “Khettara” as a sustainable alternative for arid regions. Water Supply 2013, 13, 1452–1462. [Google Scholar] [CrossRef]
- Mekki, I.; Jacob, F.; Marlet, S.; Ghazouani, W. Management of groundwater resources in relation to oasis sustainability: The case of the Nefzawa region in Tunisia. J. Environ. Manage. 2013, 21, 142–151. [Google Scholar] [CrossRef] [PubMed]
- Kim, Y.; Chung, E.-S.; Jun, S.-M.; Kim, S.U. Prioritizing the best sites for treated wastewater instream use in an urban watershed using fuzzy TOPSIS. Resour. Conserv. Recy. 2013, 73, 23–32. [Google Scholar] [CrossRef]
- Rasi Nezami, S.; Nazariha, M.; Moridi, A.; Baghvand, A. Environmentally sound water resources management in catchment level using DPSIR model and scenario analysis. Int. J. Environ. Res. 2013, 3, 569–580. [Google Scholar]
- Piirimäe, K.; Pachel, K.; Reihan, A. Adaptation of a method for involving environmental aspects in spatial planning of river basin management—A case study of the Narva River basin. Est. J. Ecol. 2010, 59, 302–320. [Google Scholar] [CrossRef] [Green Version]
- Karamouz, M.; Ahmadi, A.; Zahraie, B.; Moridi, A. Development of an algorithm for risk based strategic water supply planning: A case study. In Proceedings of the World Environmental and Water Resources Congress 2010: Challenges of Change, Providence, RI, USA, 16–20 May 2010; pp. 2285–2293. [Google Scholar] [CrossRef]
- Nobre, A.M. An Ecological and economic assessment methodology for coastal ecosystem management. Environ. Manag. 2009, 44, 185–204. [Google Scholar] [CrossRef]
- Zacharias, I.; Parasidoy, A.; Bergmeier, E.; Kehayias, G.; Dimitriou, E.; Dimopoulos, P. A “DPSIR” model for Mediterranean temporary ponds: European, national and local scale comparisons. Ann. Limnol-Int. J. Lim. 2009, 44, 253–266. [Google Scholar] [CrossRef]
- Fassio, A.; Giupponi, C.; Hiederer, R.; Simota, C. A decision support tool for simulating the effects of alternative policies affecting water resources: An application at the European scale. J. Hydrol. 2005, 304, 462–476. [Google Scholar] [CrossRef]
- Ramos, T.B.; Darouich, H.; Gonçalves, M.C.; Brito, B.; Branco, M.A.C.; Martins, J.C.; Fernandes, M.L.; Pires, F.P.; Morais, M.; Neves, R. An Integrated Analysis of the Eutrophication Process in the Enxoé Reservoir within the DPSIR Framework. Water 2018, 10, 1576. [Google Scholar] [CrossRef] [Green Version]
- Laspidou, C.S.; Samantzi, V. Identifying and quantifying nitrogen and phosphorus loadings from agriculture and livestock waste in the Penios River Basin District. Environ. Toxicol. Chem. 2015, 97, 90–102. [Google Scholar] [CrossRef]
- Windolf, J.; Blicher-Mathiesen, G.; Carstensen, J.; Kronvang, B. Changes in nitrogen loads to estuaries following implementation of governmental action plans in Denmark: A paired catchment and estuary approach for analysing regional responses. Environ. Sci. Policy 2012, 24, 24–33. [Google Scholar] [CrossRef]
- Meybeck, M.; Lestel, L.; Bonté, P.; Moilleron, R.; Colin, J.L.; Rousselot, O.; Hervé, D.; de Pontevès, C.; Grosbois, C.; Thévenot, D.R. Historical perspective of heavy metals contamination (Cd, Cr, Cu, Hg, Pb, Zn) in the Seine River basin (France) following a DPSIR approach (1950–2005). Sci. Total Environ. 2007, 375, 204–231. [Google Scholar] [CrossRef]
- Karageorgis, A.P.; Skourtos, M.S.; Kapsimalis, V.; Kontogianni, A.D.; Skoulikidis, N.T.; Pagou, K.; Nikolaidis, N.P.; Drakopoulou, P.; Zanou, B.; Karamanos, H.; et al. An integrated approach to watershed management within the DPSIR framework: Axios River catchment and Thermaikos Gulf. Reg. Environ. Chang. 2005, 5, 138–160. [Google Scholar] [CrossRef]
- Scheren, P.A.G.M.; Kroeze, C.; Janssen, F.J.J.G.; Hordijk, L.; Ptasinski, K.J.J. Integrated water pollution assessment of the Ebrié Lagoon, Ivory Coast, West Africa. J. Mar. Syst. 2004, 44, 1–17. [Google Scholar] [CrossRef]
- Volf, G.; Atanasova, N.; Škerjanec, M.; Ožanić, N. Hybrid modeling approach for the northern Adriatic watershed management. Sci. Total Environ. 2018, 635, 353–363. [Google Scholar] [CrossRef] [PubMed]
- Aghmashhadi, H. Environmental policy and management of freshwater resources in the Haraz-Ghareh Su Basin in comparison to other Caspian sub basins. Pollution 2015, 4, 387–402. [Google Scholar] [CrossRef]
- Lofrano, G.; Libralato, G.; Acanfora, F.G.; Pucci, L.; Carotenuto, M. Which lesson can be learnt from a historical contamination analysis of the most polluted river in Europe? Sci. Total Environ. 2015, 524, 246–259. [Google Scholar] [CrossRef]
- Skoulikidis, N.T. The environmental state of rivers in the Balkans-A review within the DPSIR framework. Sci. Total Environ. 2009, 407, 2501–2516. [Google Scholar] [CrossRef] [PubMed]
- Karageorgis, A.P.; Kapsimalis, V.; Kontogianni, A.; Skourtos, M.; Turner, K.R.; Salomons, W. Impact of 100-year human interventions on the deltaic coastal zone of the Inner Thermaikos Gulf (Greece): A DPSIR framework analysis. Environ. Manag. 2006, 38, 304–315. [Google Scholar] [CrossRef]
- Wong, A.W.M.; Wong, M.H. Recent socio-economic changes in relation to environmental quality of the Pearl River delta. Reg. Environ. Chang. 2004, 4, 28–38. [Google Scholar] [CrossRef]
- Borji, M.; Moghaddam Nia, A.; Malekian, A.; Salajegheh, A.; Khalighi, S. Comprehensive evaluation of groundwater resources based on DPSIR conceptual framework. Arab. J. Geosci. 2018, 11, 158. [Google Scholar] [CrossRef]
- Flint, N.; Rolfe, J.; Jones, C.E.; Sellens, C.; Johnston, N.D.; Ukkola, L. An Ecosystem Health Index for a large and variable river basin: Methodology, challenges and continuous improvement in Queensland’s Fitzroy Basin. Ecol. Indic. 2017, 73, 626–636. [Google Scholar] [CrossRef]
- Gaudino, S.; Goia, I.; Borreani, G.; Tabacco, E.; Sacco, D. Cropping system intensification grading using an agro-environmental indicator set in northern Italy. Ecol. Indic. 2014, 40, 76–89. [Google Scholar] [CrossRef]
- Alexakis, D.; Kagalou, I.; Tsakiris, G. Assessment of pressures and impacts on surface water bodies of the Mediterranean. Case study: Pamvotis Lake, Greece. Environ. Earth Sci. 2013, 70, 687–698. [Google Scholar] [CrossRef]
- Fu, Q.; Jiang, Q.; Wang, Z. Comprehensive evaluation of regional agricultural water and land resources carrying capacity based on DPSIR concept framework and PP model. In Computer and Computing Technologies in Agriculture; Li, D., Chen, Y., Eds.; IFIP Advances in Information and Communication Technology; Springer: Berlin, Germany, 2012; p. 370. [Google Scholar] [CrossRef] [Green Version]
- Zalidis, G.C.; Tsiafouli, M.A.; Takavakoglou, V.; Bilas, G.; Misopolinos, N. Selecting agri-environmental indicators to facilitate monitoring and assessment of EU agri-environmental measures effectiveness. J. Environ. Manag. 2004, 4, 315–321. [Google Scholar] [CrossRef]
- Pullanikkatil, D.; Palamuleni, L.; Ruhiiga, T. Assessment of land use change in Likangala River catchment, Malawi: A remote sensing and DPSIR approach. Appl. Geogr. 2016, 71, 9–23. [Google Scholar] [CrossRef]
- Teixeira, Z.; Teixeira, H.; Marques, J.C. Systematic processes of land use/land cover change to identify relevant driving forces: Implications on water quality. Sci. Total Environ. 2014, 470, 1320–1335. [Google Scholar] [CrossRef] [Green Version]
- Benini, L.; Bandini, V.; Marazza, D.; Contin, A. Assessment of land use changes through an indicator-based approach: A case study from the Lamone river basin in Northern Italy. Ecol. Indic. 2010, 10, 4–14. [Google Scholar] [CrossRef]
- Costantini, E.A.C.; Barbetti, R. Environmental and visual impact analysis of viticulture and olive tree cultivation in the province of Siena (Italy). Eur. J. Agron. 2008, 28, 412–426. [Google Scholar] [CrossRef]
- Tengberg, A.; Torheim, S.-I.B. The role of land degradation in the agriculture and environment nexus. In Climate and Land Degradation; Environmental Science and Engineering (Environmental Science); Sivakumar, M.V.K., Ndiang’ui, N., Eds.; Springer: Berlin, Germany, 2007; pp. 267–283. [Google Scholar] [CrossRef]
- Mander, Ü.; Kuuba, R. Changing landscapes in Northeastern Europe based on examples from the Baltic countries. In The New Dimensions of the European Landscapes; Jongman, R.H.G., Ed.; Springer: Dordrecht, The Netherlands, 2004; pp. 123–134. Available online: http://library.wur.nl/WebQuery/wurpubs/fulltext/119323 (accessed on 19 August 2021).
- Anandhi, A.; Kannan, N. Vulnerability assessment of water resources—Translating a theoretical concept to an operational framework using systems thinking approach in a changing climate: Case study in Ogallala Aquifer. J. Hydrol. 2018, 557, 460–474. [Google Scholar] [CrossRef]
- Mattas, C.; Voudouris, K.S.; Panagopoulos, A. Integrated groundwater resources management using the DPSIR approach in a GIS environment: A case study from the Gallikos River basin, North Greece. Water 2014, 6, 1043–1068. [Google Scholar] [CrossRef] [Green Version]
- Melecis, V.; Kiavins, M.; Laivins, M.; Rusiòa, S.; Spriòie, G.; Viksne, J.; Krisjane, Z.; Straíe, S. Conceptual model of the long-term socio-ecological research platform of Engure ecoregion, Latvia. Proc. Latvian Acad. Sci. 2014, 68, 1–19. [Google Scholar] [CrossRef] [Green Version]
- Langmead, O.; McQuatters-Gollop, A.; Mee, L.D.; Friedrich, J.; Gilbert, A.J.; Gomoiu, M.-T.; Jackson, E.L.; Knudsen, S.; Minicheva, G.; Todorova, V. Recovery or decline of the northwestern Black Sea: A societal choice revealed by socio-ecological modelling. Ecol. Model. 2009, 220, 2927–2939. [Google Scholar] [CrossRef]
- Holman, I.P.; Rounsevell, M.D.A.; Cojacaru, G.; Shackley, S.; McLachlan, C.; Audsley, E.; Berry, P.M.; Fontaine, C.; Harrison, P.A.; Henriques, C.; et al. The concepts and development of a participatory regional integrated assessment tool. Clim. Chang. 2008, 90, 5–30. [Google Scholar] [CrossRef] [Green Version]
- Hohenthal, J.; Owidi, E.; Minoia, P.; Pellikka, P. Local assessment of changes in water-related ecosystem services and their management: DPASER conceptual model and its application in Taita Hills, Kenya. Int. J. Biodivers. Sci. Ecosyst. Serv. Manag. 2015, 11, 225–238. [Google Scholar] [CrossRef] [Green Version]
- Xue, H.; Li, S.; Chang, J. Combining ecosystem service relationships and DPSIR framework to manage multiple ecosystem services. Environ. Monit. Assess. 2015, 187, 117. [Google Scholar] [CrossRef]
- Hou, Y.; Zhou, S.; Burkhard, B.; Müller, F. Socioeconomic influences on biodiversity, ecosystem services and human well-being: A quantitative application of the DPSIR model in Jiangsu, China. Sci. Total Environ. 2014, 490, 1012–1028. [Google Scholar] [CrossRef]
- Namaalwa, S.; Van dam, A.A.; Funk, A.; Ajie, G.S.; Kaggwa, R.C. A characterization of the drivers, pressures, ecosystem functions and services of Namatala wetland, Uganda. Environ. Sci. Policy 2013, 34, 44–57. [Google Scholar] [CrossRef]
- Pinto, R.; Conceição Cunha, M.; Roseta-Palma, C.; Marques, J.C. Mainstreaming Sustainable Decision-making for Ecosystems: Integrating Ecological and Socio-economic Targets within a Decision Support System. Environ. Process. 2014, 1, 7–19. [Google Scholar] [CrossRef] [Green Version]
- Barton, D.N.; Andersen, T.; Bergland, O.; Engebretsen, A.; Jannicke Moe, S.; Orderud, G.I.; Tominaga, K.; Romstad, E.; Vogt, R.D. Eutropia: Integrated valuation of lake eutrophication abatement decisions using a bayesian belief network, Handbook of Applied System Science. In Handbook of Applied Systems Science; Niel, Z.P., Ed.; Routledge: New York, NY, USA; London, UK, 2016; pp. 297–320. [Google Scholar] [CrossRef]
- Kolberg, S.; Berbel, J.; Dios-Palomares, R. The Closure of the Guadalquivir River Basin: A DPSIR Framework Approach. In Economics of Water Management in Agriculture, 1st ed.; Bournaris, T., Berbel, J., Manos, B., Viaggi, V., Eds.; CC Press: London, UK, 2014; pp. 1–32. [Google Scholar] [CrossRef]
- Lancelot, C.; Thieu, V.; Polard, A.; Garnier, J.; Billen, G.; Hecq, W.; Gypens, N. Cost assessment and ecological effectiveness of nutrient reduction options for mitigating Phaeocystis colony blooms in the Southern North Sea: An integrated modeling approach. Sci. Total Environ. 2011, 409, 2179–2191. [Google Scholar] [CrossRef] [PubMed]
- Odermatt, S. Evaluation of mountain case studies by means of sustainability variables: A DPSIR model as an evaluation tool in the context of the North-South discussion. Environ. Monit. Assess. 2014, 24, 336–341. [Google Scholar] [CrossRef] [Green Version]
- Gari, S.R.; Newton, A.; Icely, J.D. A review of the application and evolution of the DPSIR framework with an emphasis on coastal social-ecological systems. Ocean. Coast. Manag. 2015, 103, 63–77. [Google Scholar] [CrossRef] [Green Version]


| Criteria | Description |
|---|---|
| 1. Use of DPSIR | Single or in conjunction with other methodologies. |
| 2. The research approach | Interest in qualitative (analyzing attributes related to water quality), quantitative (collecting and quantifying data related to the quantity and availability of water), or mixed information (using data related to water quantity as well as in information related to water quality). |
| 3. The nature and use of the information generated | Documents that organized secondary data but did not conduct a case study, documents that used secondary data to present a case study, or documents that generated new data and information from empirical studies. |
| 4. Approach to the problem | Greater concern with the indicators, greater interest in the nature of the phenomena, or presents a balance between measuring and understanding phenomena. |
| 5. Contribution of the analysis | Exploratory (although it characterizes a problem, is more concerned with exploring and presenting the approach), descriptive (aims to describe the characteristics of a problem from the approach), and explanatory (seeks to determine the nature of the relationship between the causes and the doings of the analyzed problem). |
| 6. Collaborations between institutions for the development of research | National or international. |
| 7. Interaction with stakeholders for the development of the model | Nonparticipative analysis or with the participation of stakeholders in the problem. |
| Reference | Object of Analysis | 1 | 2 | 3 | 4 | 5 | 6 | 7 |
|---|---|---|---|---|---|---|---|---|
| [38] | Participatory approach to water quality problems | A | C | C | A | B | I | S |
| [12] | Combination of approaches for agricultural management | B | C | B | C | A | N | |
| [39] | Agricultural management and the environment | A | B | B | C | C | N | |
| [40] | Participatory policies for socio-ecological systems | B | C | C | A | C | N | S |
| [41] | Seasonal human migration in search of water | A | B | C | B | C | I | S |
| [42] | Sustainable water management | A | C | C | C | C | I | S |
| [43] | Soil and water conservation policy | A | C | B | C | C | N | |
| [44] | Cognitive engineering in the management of water resources | A | A | C | A | B | N | S |
| [45] | Groundwater management | A | C | C | C | C | I | |
| [46] | Criteria for the use of wastewater | B | C | C | B | B | N | S |
| [47] | Scenarios for management of environmental resources | B | C | B | A | B | N | |
| [7] | Integrated management of water resources | A | C | C | B | C | N | |
| [48] | Planning for large-scale water management | B | C | C | C | B | N | S |
| [49] | Strategic planning for risk management | B | C | C | C | B | N | S |
| [50] | Management of coastal zones | A | C | B | B | C | N | |
| [51] | Management strategies, conservation, and restoration | B | C | C | A | B | I | |
| [52] | Decision support under N pressure in agriculture | B | B | B | A | A | I | |
| [53] | Transfer of agricultural nutrients (P) to water | B | A | C | B | B | N | |
| [54] | Transfer of N and P from diffuse sources (agricultural) for water | A | A | B | B | B | N | |
| [55] | Agro-environmental indicators for agricultural N monitoring | A | A | B | B | B | N | |
| [56] | Water pollution by heavy metals | A | A | C | A | C | N | |
| [57] | Industrial and agricultural nutrients (P and N) in coastal areas | B | C | C | C | C | N | S |
| [5] | Socioeconomic analysis and transfer of pollutants for water | A | A | B | A | C | N | |
| [58] | Pollution of the ecosystem based on nutrients (N and P) | A | A | C | A | B | N | |
| [59] | Urban and agricultural pressures on water resources | B | C | B | B | B | I | |
| [19] | Hierarchy of socioeconomic indicators | B | C | B | B | C | N | |
| [60] | Pressure factors in water resources | B | A | C | C | B | N | S |
| [61] | Wastewater and agricultural pressures in river pollution | A | B | B | B | B | N | |
| [62] | Socioeconomic drivers and pressures on ecosystems | A | C | C | A | C | N | |
| [63] | Implications of the driving forces in coastal areas | A | C | B | A | B | I | |
| [64] | Influence of socioeconomic change on water quality | A | A | C | B | B | N | |
| [65] | Degradation of groundwater | A | C | B | B | C | N | |
| [66] | Ecosystem health index | A | A | B | B | C | N | |
| [67] | Agri-environmental indicators of agricultural intensification | A | C | C | C | B | N | S |
| [18] | Indicators for agricultural water and land resources | A | C | B | B | A | N | S |
| [68] | Ecological status of water | A | C | B | A | B | N | |
| [69] | Loading capacity of water and land resources | B | C | B | A | B | N | |
| [70] | Environmental status when implementing CAP measures | B | C | B | A | A | N | |
| [71] | Change in land use and ecosystem services | A | C | C | A | C | N | S |
| [72] | Changes in land use and pressures on water | A | B | B | A | C | N | |
| [73] | Environmental impacts from land use change | B | C | B | B | C | N | S |
| [74] | Change of land and the consequences on soil and water | A | C | B | A | B | N | |
| [75] | Change in land use, conflicts or synergies | B | A | A | A | C | I | S |
| [76] | Impact of land use change | A | C | B | A | A | N | |
| [77] | Conceptual model for water resources and climate change | B | C | B | C | C | N | |
| [78] | GIS to assess pressures on water resources | A | C | B | B | C | N | |
| [79] | Conceptual model for socio-ecological research | B | C | B | A | C | N | |
| [80] | Development scenarios in the marine environment | B | C | B | B | C | N | |
| [81] | Software to simulate impacts of climate change | B | C | B | A | C | I | |
| [82] | Model to detect agricultural diffuse pollution | B | C | B | B | B | N | |
| [83] | Changes in ecosystem services | B | A | C | A | C | I | S |
| [84] | Mechanisms of interaction in ecosystem services | A | A | C | C | C | N | |
| [85] | Socioeconomic influences on ecosystem services | A | C | B | B | C | N | |
| [86] | Compensations of ecosystem services | A | A | B | C | B | N | S |
| [85] | Ecosystem services and wetland changes | A | A | C | C | B | N | S |
| [10] | Agrarian economy in deficit irrigation | A | B | C | B | B | N | S |
| [87] | Cost-effectiveness analysis in the Water Framework Directive | B | B | B | B | C | N | |
| [88] | Agrarian economy in irrigation of mature basins | A | B | B | B | B | N | |
| [89] | Export costs of agricultural nutrients | A | A | C | B | B | I | |
| [14] | Impact of climate change on agriculture | B | B | B | B | B | N | |
| [13] | Regional climate change disturbances | B | C | C | C | C | N | S |
| [15] | Border of sustainable development with the DPSIR | A | A | A | C | C | N | |
| [90] | Sustainability in industrialized and developing countries | A | C | A | B | A | N |
| Coefficients | Procedures | Cases Identified% | |
|---|---|---|---|
| Use of DPSIR | Only | 36 | 57.1 |
| In conjunction with other methodologies | 27 | 42.9 | |
| Predominant indicators in the analysis | Water quality | 17 | 27.0 |
| Water amount | 9 | 14.3 | |
| Both attributes (quality and quantity) | 37 | 58.7 | |
| Source and use of information | Generate information from material already elaborated and do not present a case study | 3 | 4.8 |
| Use secondary data in a concrete case study | 34 | 54.0 | |
| Produce primary data and, in conjunction with secondary data, analyze a specific case study | 26 | 41.3 | |
| Focus on the problem | Greater concern with indicators | 22 | 34.9 |
| Greater interest in the nature of the phenomena | 25 | 39.7 | |
| Balance between measuring and understanding phenomena | 16 | 25.4 | |
| Contribution level of the analysis in the model DPSIR | Present a problem and relate it to the model (exploratory) | 8 | 12.7 |
| Describe the problem and relate it to the model (descriptive) | 27 | 42.9 | |
| Identify the factors that determine or contribute to the occurrence of the phenomena (explanatory) | 28 | 44.4 | |
| Reference | Factors | |||||||
|---|---|---|---|---|---|---|---|---|
| Agricultural | Livestock | Fertilizers | Change in Land Use | Water Extraction | Nutrients/ Contaminants | Amount/ Quality Water | Eutrophication | |
| [65] | D | P | P | S | ||||
| [12] | D | P | P | I | S | |||
| [53] | D | P | P | S | I | |||
| [38] | D | P | S | S | ||||
| [40] | P | D | S | |||||
| [41] | D | D | D | P | I | |||
| [10] | P | S | ||||||
| [71] | P | P | S | |||||
| [39] | P | P | S | |||||
| [19] | P | P | I | |||||
| [42] | D | D | I | P | S | S | ||
| [83] | D | P | S | |||||
| [43] | D | P | P | |||||
| [67] * | D | P | I/S | I/S | I/S | |||
| [82] | P | S | S | P | S | |||
| [60] | I | P | S | P | ||||
| [78] | D | P | S | I | ||||
| [88] | S | |||||||
| [85] | P | P | S | |||||
| [68] | D | D | P | P | S | I | I | |
| [47] | D | P | I | |||||
| [8] | D | P | P | P | S | I | I | |
| [44] * | D | D | P | P | S/P | |||
| [69] | I | S | ||||||
| [48] | I | P | S | |||||
| [73] | D | D | P | P | S | |||
| [81] | D | S | S | I | ||||
| [51] | D | D | P | P | P | S | S | I |
| [11] | D | P | ||||||
| [57] | D | P | P | S | I | |||
| [5] | D | D | P | I | S | S | ||
| [52] | D | D | P | S | I | I | ||
| [64] | D | P | P | I | ||||
| [76] | D | P | S | I | ||||
Publisher’s Note: MDPI stays neutral with regard to jurisdictional claims in published maps and institutional affiliations. |
© 2021 by the authors. Licensee MDPI, Basel, Switzerland. This article is an open access article distributed under the terms and conditions of the Creative Commons Attribution (CC BY) license (https://creativecommons.org/licenses/by/4.0/).
Share and Cite
Troian, A.; Gomes, M.C.; Tiecher, T.; Berbel, J.; Gutiérrez-Martín, C. The Drivers-Pressures-State-Impact-Response Model to Structure Cause−Effect Relationships between Agriculture and Aquatic Ecosystems. Sustainability 2021, 13, 9365. https://doi.org/10.3390/su13169365
Troian A, Gomes MC, Tiecher T, Berbel J, Gutiérrez-Martín C. The Drivers-Pressures-State-Impact-Response Model to Structure Cause−Effect Relationships between Agriculture and Aquatic Ecosystems. Sustainability. 2021; 13(16):9365. https://doi.org/10.3390/su13169365
Chicago/Turabian StyleTroian, Alexandre, Mário Conill Gomes, Tales Tiecher, Julio Berbel, and Carlos Gutiérrez-Martín. 2021. "The Drivers-Pressures-State-Impact-Response Model to Structure Cause−Effect Relationships between Agriculture and Aquatic Ecosystems" Sustainability 13, no. 16: 9365. https://doi.org/10.3390/su13169365
APA StyleTroian, A., Gomes, M. C., Tiecher, T., Berbel, J., & Gutiérrez-Martín, C. (2021). The Drivers-Pressures-State-Impact-Response Model to Structure Cause−Effect Relationships between Agriculture and Aquatic Ecosystems. Sustainability, 13(16), 9365. https://doi.org/10.3390/su13169365