Abstract
Within a context of beef feedlots and feed-crop production systems, we surveyed farmers to identify their perceived monetary value for the manure they used or could have used. Value is contextual with respect to a number of socio-economic, environmental, regulatory, and physical factors, which influence farmer’s inclinations about how they manage manure. The most desirable manure management strategies are likely practiced by those who perceive its value highest, and, conversely, the least desirable manure management strategies are likely practiced by those who assign the lowest value to it. This study considered factors that affect or relate to farmer perceptions of manure’s value. Using quantile regression, we observed variations in how farmers perceived the value of manure, considering farm and farmer characteristics, farming practices, select preferences, and whether or not they used manure on their own cropland. For example, we found that livestock producers who grow feed for their own cattle value manure differently compared to crop producers who do not manage cattle, most likely due to perceived need. Added years of experience in farming lowered the farmer’s perception of manure’s value. Additionally, extra tillage required when using manure was seen by farmers not as a burden but rather as a benefit.
1. Introduction—Perceiving the Value of Manure as an Agricultural Input
This special issue of Sustainability focuses heavily on technical means for using animal manure to enhance and maintain environmentally sustainable soil organic matter (SOM). Our contribution looks closely at the farmer’s perception of manure’s value as a key determinant in applying manure effectively without over-applying it.
1.1. Feedlot Manure, Farming, and Valuing Nutrients—Reviewing the Literature
For over half a century, concentrated animal feeding operations (CAFOs) in the United States have been consolidating and creating ever-larger concentrations of manure that threaten both water and air quality [1,2,3,4,5,6,7,8]. Farmers within close range of feedlots are in a position to disperse these mountains of manure, using it as fertilizer, to amend their soils, and, with proper application, to reduce nutrient loads into the local water sources. However, since it is costly to haul and apply, there is economic incentive to apply as much as possible in the shortest distance as possible, leading to reduced value as a fertilizer and to water quality concerns stemming from nutrients in excess of crop needs [6,7,9,10,11,12]. The incentive for producers of manure is to minimize the cost of its disposal, while, for crop farmers, the objective is to utilize the nutrients in manure to offset fertilizer costs.
We surveyed approximately 400 farming operations and conducted a dozen interviews in two major feedlot areas of northern Colorado. We explored a range of factors to determine how farmers perceive manure value. These findings add to the agricultural and the natural resource sociology literature by revealing more about how farmers value manure, thereby giving policy makers and advisors relevant information about how to increase farmers’ nutrient management efficiency and to reduce pollution from this important source.
1.2. Fertilizer Management
Agriculture was identified as a major contributor to numerous environmental problems, from water pollution to greenhouse gas generation and biodiversity loss [12,13,14,15]. The demonstrated potential for water pollution led to policies and regulations that are somewhat effective in containing point-source manure nutrients at the typical feedlot and in preventing most direct releases of manure into surface waters while minimizing groundwater infiltration [1,2,5]. However, disposal of manure through crop-field application is another story. Once the manure is transferred off the property of an originating feedlot, some of it becomes a non-point source (NPS) pollutant, which is relatively unregulated [5,12]. Feedlot manure is typically wet and heavy, and transporting it is expensive, thus over-application within a short radius of a feedlot is common. Over-application of manure increases nutrient loads in surface waters and groundwater, which wind up in streams and rivers. High nutrient levels in these waters support invasive species of flora and fauna, which often out-compete and effectively eliminate native species. An extreme form of this happens when algae blooms consume so much oxygen that fish-kills occur. Less obvious is the gradual reduction of species, wherein only a few non-native species come to dominate, and much biodiversity is lost. Understanding farmer decision-making and behavior patterns regarding fertilizer management is a key knowledge area for maintaining biodiversity and an acceptable quality of natural resources in the future.
Nutrient use efficiency (NUE) involves tightening up and carefully monitoring nitrogen cycles at many levels. This big picture analysis was identified and described by Tully and Ryals in their recent overview, “Nutrient cycling in agroecosystems: Balancing food and environmental objectives” [16]. Effective manure management (MM) on the part of farmers is one essential element in preventing degradation of environmental resources. Ultimately, avoiding or minimizing pollution from manure mismanagement is strongly linked to farmers viewing manure as a valuable resource and not merely as a waste byproduct to be externalized [1,17].
Additional support for attention to manure’s economic value was demonstrated in a recent analysis comparing yield and pollution resulting from different nutrient application schemes [18]. That study concluded that maximum economic rates of nitrogen fertilization (MERN) for most crops, including grain-corn, are distinctly lower than the application rates defined by corresponding nutrient management plans (NMPs), and that the reduction in yields under a MERN scheme is relatively small, while the reductions in production cost and in pollution are large [18]. In other words, if the farmer optimizes net income by minimizing fertilizer input cost (manure plus commercial fertilizer) and accepting a slightly lower yield per acre, both the financial and the environmental benefits are significant. A mental barrier may be a farmer’s conventional desire to maximize yield rather than net income, even though the latter path is more economically rational. Burton and Wilson [19] studied the identity psychology of farmers regarding conservation and concluded that: “… despite much talk of an increasing “conservationist” component to farming—farmers’ self-concepts are still dominated by production-oriented identities”. In a recent study of Montana wheat farmers regarding the importance of factors affecting nitrogen fertilizer application, the percentage saying that “maximizing yield” was important or very important was considerably higher (89%) than “minimizing cost” (73%) [20]. The similar level of importance for “matching crop yield goal” was identified by 79% of the same sample. These economically oriented preferences were all ranked higher among farmers than environmental goals such as “reduced risk of nitrate leaching” (66%) or “accounting for soil organic matter” (55%). We mention this to emphasize the notion that reducing nitrogen over-application is more likely to be achieved through financial considerations than environmental ones, at least given current agricultural thought modes.
2. Methods of Analysis and Research Focus
We hypothesize that farmer characteristics, including attitudes toward manure and MM, are partial determinants of manure’s perceived value, which in turn affects how efficiently and sustainably farmers choose to manage manure. Theoretically, the more highly they value manure, the more efficiently farmers tend to use it. Another way to interpret this valuation is to see economic value as the language through which farmers express preference, which in turn may or may not lead them to use manure efficiently.
Through a mailed questionnaire, we explored farmer attitudes toward MM and estimated how those attitudes affected adoption of manure use. A similar study, conducted with part of this study’s data, previously found that “pressures” such as owning cattle and “preferences”, both positive and negative ones, toward manure application affect a farmer’s choice in whether to adopt land application of manure [10,21]. Pressures to use manure can include both a high demand or need for crop-nutrients, as in the case of a feed-corn grower, and a large supply of manure, as in the case of the cattle feedlot operator. Preferences include positives such as the benefit of increased crop yield and negatives such as concern about neighbors’ objections to the smell of manure. Here, we considered factors affecting the monetary amounts indicating farmers’ “willingness to accept” (WTA) or “willingness to pay” (WTP) for manure, which can in turn represent their inclination toward efficient use of manure and thereby to manage manure’s nutrients sustainably.
Additionally, we conducted approximately one dozen in-person interviews with farmers, livestock operators, crop consultants, and manure haulers not known to have participated in the mail survey. Using the mail survey data, we examined the circumstances and the perceptions that contribute to how farmers value manure. Having a ready supply of manure, either in one’s own operation or nearby at a neighboring feedlot, for example, reduces the cost of acquiring manure, effectively raising its value. While sustainable farming may not be a farmer’s primary intended goal, it may nevertheless be a beneficial result of effective MM. The efficient farmer is motivated to consider NUE and to apply manure so as to deliver a maximum amount of nutrients to the plants while minimizing the excess nutrients going into groundwater or surface waters. On the other hand, having to dispose of a large amount of manure might lower the marginal value of additional tons for some farmers.
Here, we tried to understand what drives farmers’ perceptions of manure’s value. The research contribution of this manuscript is identification of some of the factors that lead a farmer to perceive manure as having a higher or a lower value. Perception of manure’s resource value represents one type of sustainable management factor. Nevertheless, as Carlisle [22] pointed out in her article on farmer adoption of soil health practices, factors that affect the adoption of conservation practices are highly varied and complex. Addressing this issue likely involves multiple aspects of farm management.
2.1. Managing Manure from Feedlots in Northeastern Colorado
As feedlot sizes grow yearly, there are increasingly concentrated aggregations of manure for dispersal from each operation [23,24,25]. Since land application is the commonly practiced method for disposing and recycling manure, these increasing concentrations need a broader land-base of surrounding farms for application of manure [11,25]. Accommodating the larger manure volume makes it increasingly difficult for farmers to apply it at rates low enough that their crops can use all the nutrients and prevent the residual nutrients from infiltrating the surrounding waterways and groundwater [18]. Increased adoption of sustainable MM by farmers could help reduce the potential pollution problem [25,26]. However, the convention of heavy land application is maintained, in part, by a loose regulatory structure as described below.
2.2. The Manure Ownership Loophole and the Value of Manure
NPS pollution is very difficult to regulate in the United States, especially in a “right-to-farm” state [27]. Although point sources such as CAFOs are regulated under the Clean Water Act (CWA), manure given away, such as to a farmer, is thereby externalized from the system and becomes invisible to regulation [5,12,28,29].
Cattle feeding is the largest agricultural industry in Colorado, and at the time of our study, according to Colorado Agricultural Statistics Service, there were typically a million cattle on feed in the state at any one time [30]. This northeast portion of the state had and still has one of the largest and densest populations of cattle and feedlots in the U.S., including several of the largest feedlots in the world [30,31]. The counties we studied produce approximately 1,150,000 head of cattle per year [30]. The corn used to feed most of the cattle in the areas we studied was produced on approximately 350,000 acres or 140,000 hectares. The typical feedlot cow or steer produces between 20 and 40 kg of manure per day.
CAFOs commonly dispose of their manure by passing it back to farmers with whom they have a feed purchase relationship. Farmers may apply that manure on crop fields lightly or heavily and frequently or seldom. The state of Colorado is currently reviewing and revising the regulatory environment of farming as part of the Water Quality Control Commission’s Regulation 85, a process addressing point sources of water pollution since 2012 and which is expected to establish limits on non-point source pollution if necessary beginning in the middle of 2022 [32].
Manure’s value as perceived by farmers presumably influences how they apply it, particularly because the competitive nature of livestock agriculture makes profitability essential to the sustainability of their operations [12,29]. Thus, the extent to which a farmer perceives manure as valuable can be expected to affect his or her likelihood of using it sparingly and thus sustainably.
2.3. Valuing Manure as an Agricultural Input
Most farmers are highly cost-conscious, as their livelihoods depend on minimizing expenses and maximizing yield. Where manure is available, it usually presents an opportunity to reduce fertilizer expense, and many farmers believe it provides soil enhancement benefits as well. For the farmer who sees it positively, manure is a resource to be spread “agronomically” or at a rate such that a crop can benefit from a large proportion of its nutrients [33,34,35]. Previous WTP research by Norwood, Luter, and Massey [36] found that most farmers would substitute manure for commercial fertilizer even if the monetary cost were only slightly lower than the cost of commercial fertilizer. That study also found, on the other hand, that approximately 25% of the farmers in their sample perceived manure negatively and would only accept manure applied on their fields if they were paid to do so. Dumping of manure for waste disposal has been characterized as undervaluation of manure’s nutrient value [6,37,38,39].
This analysis was unique because we looked at where the value comes from rather than directly at what affects BMP adoption, as was done in previous studies. This approach is useful because programs or policies could potentially be developed or adjusted to reward sustainable manure management patterns that are consistent with higher manure valuation. By treating the value of manure as a dependent variable, we identified several factors, both operation-related and personal, associated with perceiving the value of manure as higher or lower.
2.4. Methods and Measures—What Determines Manure’s Perceived Value?
To collect data, we used a mailed questionnaire, part of a survey of farmers supporting livestock production along the South Platte River in five northeastern Colorado counties [21], where there is a prevalence of large feedlots and numerous feed-crop producing operations. Various sections of this questionnaire provided information on farmers and their operations, largely in regard to their practices and beliefs around manure management as fertilizer, irrigation, and other farming practices. The questionnaire was sent to approximately 1700 farm operators listed with government-managed farm support agencies, around 300 of whom turned out to be no longer active. The effective response rate was approximately 31%.
One section of the questionnaire provided three possible blocks of questions based on the farmer’s manure source situation, wherein a subset of manure valuation questions was configured to be relevant for the logistics of their situation (see Table 1). The set of these questions asked in each block was designed to be appropriate for whichever of these three situations they identified:

Table 1.
Question response space for manure’s perceived value based on manure source situation (each respondent was to enter a value in only one of these six spaces).
- “Did not apply manure” (Block I);
- “Used manure mostly from my own livestock” (Block II);
- “Purchased or received manure from an outside source” (Block III).
Within each of these groupings, we asked our respondents to provide a per-ton monetary value for the manure they used or could have used. In each case, the value they wrote indicated either a positive or a negative dollar value per ton. Farmers were asked to write their perception of manure’s value in only one of the six boxes. The wordings of these six boxes are each depicted in condensed form in Table 1 below. Note that a negative monetary value is implied if the farmer indicates needing to be paid to accept manure or to have manure hauled away. Data collected in other parts of the questionnaire were used to model what variables might be related to farmers’ perceptions of manure’s value.
The rest of this section describes some of the factors that may affect a farmer’s perception of manure’s value and reasons we thought they might affect it. Later, in the “Results and Analysis” section below, we discuss the analytical tools and methods we used to quantify the relevance of these factors and some limitations resulting from this multi-tracked questionnaire format.
2.5. Perceptions—Potential Benefits of Applying Manure
We asked farmers to rate potential benefits on a Likert scale (1—“Does not matter to me” ←→5—“Real and significant to me”):
- “Inexpensive fertilizer”—manure as a substitute for commercial chemical fertilizers;
- “Source of organic matter”—manure used to enhance field-soils, especially through moisture-retention and improved soil texture;
- “Improves soil properties”—a more general description regarding the two previous items;
- “Increases yield”—manure provides a greater output volume of the crop;
- “A way to reduce wind erosion”—manure can be surface-applied to hold down topsoil;
- “A way to dispose livestock waste”—field application of manure is an accepted removal practice.
The first and the fourth of these responses represent the benefit of manure for its yield-increasing properties in the short term. The second and the third item, however, reflect a longer-term orientation toward the enhancement of soil properties, indicating some concern for using sustainable practices. Reducing wind erosion usually involves leaving manure on the surface rather than tilling it into the soil; thus, this benefit may likely provide a different environmental benefit from the other usages. Additionally, waste disposal as an objective, while providing an important function, can easily lead to over-application of manure.
2.6. Perceptions—Potential Problems of Applying Manure
Next (also using the Likert scale shown above), we asked each farmer to rate potential problems that might result from applying manure to their fields, including:
- “Causes more weeds”—weed seeds are often a component of fresh manure;
- “Damage to plants from salts”—manure can contain salts;
- “Soil compaction”—spreader trucks are heavy and compact the soils;
- “Unpredictable nutrient content”—manure’s nutrient contents are highly variable;
- “Doesn’t get spread evenly”—manure can be extremely “clumpy”;
- “Lower crop yields”—manure alone usually does not provide as much of a yield boost as commercial fertilizer;
- “Inconvenient to apply”—manure is typically very heavy and requires special spreading equipment;
- “Additional tillage required”—manure is more effective if incorporated into the soil;
- “Relationship with neighbors”—some neighbors are likely to complain about manure’s odor and possibly the increased presence of flies;
- “Possible water pollution”—excess nutrients can be a problem especially where the water table is high or where runoff flows into a natural waterway;
- “Regulatory concerns”—regulations concerning manure management are a point of stress for livestock producers.
The first three of these potential problems could be seen as longer-term issues, while the next three relate to the current year’s productivity. Additional tillage might have a mixed significance for the farmer, since it requires some extra resources, but it might also be seen as advantageous in helping provide a higher yield. The last three of these possible problems reflect concern for the opinions of others, either aesthetically or regarding the potential for water pollution and the possibility of punishment.
2.7. Knowledge Represented in Practices Relating to Manure and Its Application
We also considered whether knowledge about nitrogen fertilizer, horticultural principles, or experience with manure and fertilizer application affect the perceived value of manure, asking whether the farmer used any of the following practices or strategies (indicated by checking a box next to one of the bullets listed below):
- “Crop yield goal”—striving for a high yield seems as though it would correlate with trying to maximize the soil’s fertility for the crop being grown;
- “Past experience”—this reflects the farmer’s knowledge and experience with using manure and commercial fertilizer;
- “Plant tissue analysis”—this might represent the operator’s level of reliance on technical methods;
- “Irrigation water analysis”—did they account for nutrients in their irrigation water?
- “Manure credit”—did they rely on manure nutrients to cover the crop’s nutrient needs?
- “Legume credit”—did they use a cover crop to provide some crop nutrients?
- “Consultant”—did they use a consultant to help determine their nutrient application combination?
- “Field scouting for insects, diseases, etc.”—we thought this approach might possibly indicate how they approach specific field situations;
- “Irrigation management”—does water conservation correlate with higher manure valuation?
- “Conservation tillage”—is this practice seen as working well with efficient manure usage?
- “Water flow control practices”—does this match with irrigation management, or does it represent a different thought process and relationship with manure usage?
Most of these practices are considered “best management practices” (BMPs), and our intent was to see if using BMPs was associated with managing manure sustainably.
2.8. Demographics—Location of Operation and Personal History
We identified which of the two general regions farmers were operating, eastern or western. The eastern sample was more rural with larger acreages. We also asked about each individual farmer’s personal history, as follows:
- “How many years farming or ranching?” (number of years);
- “Highest level of education completed?” (highest level attended of five categories)
Regarding the operation, we also asked for the approximate level of gross sales in the previous year (<USD 50 K, USD 50–99 K, USD 100–249 K, USD 250–499 K, USD 500–1 M, >USD 1 M).
2.9. Data Analysis Methods
In examining the data for factors influencing farmers’ perceptions of manure’s value, we found that, probably because of the hypothetical nature of the questions, there were some unrealistically extreme values, both positive and negative. Because of these apparently unrealistic responses, the manure values and residuals were not normally distributed. Upon closer inspection of the data, we found that, while a few of these values were outliers, the median values were well aligned with the observed reality. We attribute the wide range of perceived manure values to a combination of phrasing and structure within the questionnaire, which apparently led to some extreme responses. We address this wording issue later in the “Discussion” section below.
To address this range of response data, we determined that it was appropriate to use a more robust form of multiple regression analysis than the typical ordinary least squares (OLS) method. We chose to use bootstrapped simultaneous quantile regression, which is more robust to extreme values and heteroscedasticity and which determines regression slope coefficients reliably for multiple quantile levels of the response variable. This was especially appropriate because of the choice to consider median values. The 50th quantile is the median level, and simultaneous quantile regression is a widely accepted approach used for “median regression” analysis. In addition to the median level, we settled on evaluating each of the factor variable relationships with the perceived value response variable at a low (25th percentile) and a high (75th percentile) level. More details of this are included in the “Results” section below, under the sub-heading “Modeling Value Factors”.
As discussed below, this method revealed that different ranges in the perception of manure’s value are affected differently by several factors. Before selecting factors for a model, we used Spearman correlation to identify appropriate possibilities among the ordinal variables collected on the Likert scaled items and a Wilcoxon rank-sum test to consider some binary variables relating use or non-use of certain farming practices and testing procedures, including some BMPs.
3. Results
We found that the three manure source groupings were clearly different in how they perceived manure’s value. A part of manure’s perceived value for operators who used manure mainly from their own livestock was apparently inflated by the proximity of their manure source. That is, their transportation fuel cost was much lower than that of other groups, because the transport distance was typically much shorter, reducing the inherent expense of transport and effectively increasing manure’s perceived value. It also became clear that the third manure source group consisted of two different situations, those who purchased manure and those who accepted it free or for credit. Separation of these two sub-groups is described below. Summary statistics for the variables discussed, excluding the source situation group variable, can be viewed in Table 2.
Table 2.
Summary statistics for variables modeled.
For the purposes of the current study, we considered manure’s value as a function of four variable types:
- Source situation (as represented in different source-related groupings);
- Perceptions of manure’s benefits and problems;
- Knowledge in practices relating to manure and its application; and
- Demographics of location and operator personal history.
There may be other types of variables involved, but these are the main categories of factor variables we found potentially to have some effect, as we describe briefly in the following paragraphs.
3.1. Manure Source Situation
The manure value questions in the questionnaire essentially separated farmers into three groups based on the source of the manure they used or could have used. For each of these groups, there were some operators who perceived a positive value to manure and a smaller number of operators who assigned it a negative value. In another part of the questionnaire, we asked what source of manure they used. Based on their manure source, we differentiated between those who purchased manure and those who accepted it free or for credit, typically from a feedlot. In this way, we arrived at four source categories.
The perceived manure values for these four groupings are presented in Table 3 below. Farmers who did not apply manure valued manure the least as a group. Generally, farmers in this group did not have livestock, they were located farther from a manure source at a median distance of 3 miles, and they valued manure at a median value of USD 1.00/ton.
Table 3.
Value of manure perceived by farmers—four manure source groupings. (Note: some cases are not included here because of missing data regarding source grouping, distance, or value).
Those who used manure primarily from their own livestock all valued manure positively and generally at a higher level than any of the other groups. The median distance from manure source to manured field for this group was only 1/3 of a mile, and they perceived it to have a median value of USD 3.75/ton. This might reflect the availability of manure and the absence of transfer costs such as transportation, negotiation, and accounting; essentially, this reflects the proverbial concept of “a bird in the hand”.
We focus here on the medians of perceived values and of the actual dollar amounts paid or received, because medians represent the most typically perceived dollar values and provide a more realistic measure of the amount actually paid for manure than the mean. This was verified by the actual values paid for manure as reported by those who purchased it, which ranged from 10 cents to around USD 3.00 per ton. While the mean of perceived manure values entered was considerably higher, that was likely an effect of the speculative nature of these questions. In the “Discussion” section of this paper, we address the limitations created by the question format and how we could have reduced the problem of outliers by presenting these questions differently. Some farmers entered exceptionally high numbers that apparently distorted the means and skewed the distribution, while most (approximately 75%) of the reported values were more realistic and much nearer the center of the range, which is reasonably well represented by the median. This was a prime reason for choosing quantile regression instead of OLS regression, in that the 50th quantile regression is essentially median regression. Because it uses least absolute deviations, quantile regression is not subject to the constraints of least squares regression and is considered to be more “robust”. Median values are appropriate in this context, because we seek to understand the most typical, most common, and most reality-based choices within each farm operator situation.
Within the third group, we were able to separate those who purchased manure from those who accepted it free or for credit. Those who purchased manure from an outside source typically transported it 4 miles and said they valued it at a median value of USD 2.25/ton. Those who accepted manure free or for credit, approximately one third of those who used manure, typically transported it 3 miles and said they valued it at a median of USD 1.50/ton. These results are depicted in the bottom two rows of Table 3. Note that those farmers who “accepted manure free or for credit” actually received a median amount of USD 0.95/ton, which is a negative amount in that they were paid to accept the manure. However, only around one fourth of these respondents actually perceived manure’s value as negative.
3.2. Perceptions of Value in Application of Manure
In addition to the differences among the source-based groupings, within two of the groups, there were major differences in the perception of manure’s value. Whereas all farmers who applied manure from their own livestock viewed manure’s monetary value positively, some farmers in each of the other groups perceived manure as having negative value. That is, they would want to be paid to accept manure. Among those who did not use manure, there were many who assigned a positive dollar value to manure and a smaller number who assigned it a negative value.
Farmers perceived manure in terms of its beneficial aspects and also in terms of various problems associated with using it. Some of these perceived characterizations can be described as follows:
- Inexpensive fertilizer, increasing crop yield while reducing commercial fertilizer expense;
- Soil amendment, enhancing soil properties by adding organic matter, aeration, and water retention capacity;
- Inconvenient waste material requiring disposal; or
- A combination of these three and other possible perceptions.
Most farmers who acquired manure from an outside source were willing to pay considerably for it. However, approximately one fifth of the purchasers valued it negatively but bought it anyway, apparently seeing it as a much cheaper alternative to commercial fertilizer. The “outside source” in most cases was a feedlot with whom the farmer had a regular arrangement to provide livestock feed, either in the form of corn silage or corn grain, according to several of our informants. The common arrangement, as farmers and manure haulers described it, is to take manure away from the feedlots in approximately the same volume as the amount of livestock feed delivered (but not at the same time). Sometimes, farmers receive the manure free; sometimes, the feedlot credits them a dollar or so per ton; and, sometimes, the farmers actually purchases the manure depending on the supply and demand situation of manure for that year. Some farmers who received manure may have been pressured to accept it even though they may not really have wanted it. This is reflected in the relatively low manure value assigned by those who “accepted manure free or for credit” (see Table 3, above).
3.3. Negative Factors Affecting the Perceived Value of Manure
The problems associated with manure application indicated an awareness of potential risks in using manure but not necessarily an unwillingness to do so. Higher ranking of the problems did not typically correspond to lower valuation of manure but often to a slightly higher valuation. One possible interpretation is that being realistic about the challenges of using manure arises from experience or from discussion with other growers, and this can help a farmer use manure more effectively.
3.4. Modeling Value Factors
Considering the demographic factors, the demand situation factors, the perceived advantages and disadvantages, and the knowledge factors around the issue of manure and crop management, we used quantile regression analysis to explore the relationships between these factors and the farmer’s perceived value of manure. We considered the expectations described above and used the answers reported by the mail survey respondents. Some of the expected factors were clearly more relevant than others. In several instances, there was considerable overlap in the implications of two or more variables, thus it became appropriate to choose one as more representative of the factor in question. In considering regression models for a range of quantiles, some factors presented a much different relevance at various perceived manure value levels. Here, we present a set of quantile regression models in Table 4 below and discuss their implications. As mentioned previously, a set of summary statistics for all the variables described above is included in Table 2.
Table 4.
Manure value factors model—simultaneous quantile regression.
As a procedure for model selection, we first considered several candidate factor variables—some ordinal ones using Spearman correlation and some binary variables using a Wilcoxon rank-sum test—to consider use or non-use of certain farming practices and testing procedures.
The models presented below at three quantile levels of the farmers’ perceived value of manure considered various farm and farmer characteristics, some of the practices they used, along with some preference factors while controlling for the farmer group categories regarding whether or not they used manure and, if so, how they obtained it.
The variables represented in Table 4 below at three quantiles of manure’s perceived value per ton, which was the response variable, indicated to what extent each of these manure aspects were seen by a farmer as important, either as a benefit of using manure or as a problem of using it, and to what extent it affected manure’s perceived value at each quantile shown:
- Inexpensive fertilizer (inexfert);
- Reduces wind erosion (winderod);
- More tillage needed (moretill);
- Past experience (pastexp);
- Legume nutrient credit (legmcrdt);
- Years in farming or ranching (yearfarm);
- Location in a more rural area (eastern);
- Situational grouping (four “blocks”):
- Did not use manure (Block_1, reference category, not shown in Table 4);
- Used manure mostly from own livestock (Block_2);
- Purchased manure (Block_3); or
Accepted manure free or for credit (Block_4).
4. Discussion
By way of interpreting the results, different perceived value levels showed distinctly different factors that influenced manure’s value perception. Unlike most factors we considered, the maintaining of livestock and hence having an immediate source of manure consistently added value to the individual’s perception of manure’s value.
It is worth noting that several of the non-included variables were conceptually similar to some of the included ones and that those included were the ones more consistently identified by the respondents. This may reflect variations in the vocabulary of the questionnaire and its familiarity to the population surveyed as well as the diverse range of priorities among farmers. One example is the preference of “inexpensive fertilizer”, which expresses much the same concept as “increases yield”. Farmers who valued manure higher consistently expressed the importance of the manure as inexpensive fertilizer more than the fact that it increases yield. Perhaps this reflects an acceptance of the MERN approach [18] or of EONR [40], wherein a focus on the bottom line allows for a slightly lower yield but a distinctly higher return on investment. Similarly, the terms “source of organic matter” and “improves soil properties” are seemingly good reasons to perceive manure’s value at a higher level, but neither of these were as clearly or consistently related to higher valuation of manure. The benefit “a way to dispose of livestock waste” is probably quite relevant to those who have livestock, but, possibly because livestock ownership is “controlled for” by the demand source groupings, it did not demonstrate a real effect at any of the modeled levels.
The two positive preference items that related to higher manure valuation were:
- “Inexpensive fertilizer”—thinking of manure as a substitute for commercial fertilizer was one of the only consistent factors at all or nearly all the quantiles evaluated. This effect was strong at every level and positively valued at all levels of manure valuations, including the median.
- “A way to reduce wind erosion”—farmers valued manure as a top-dressing to help hold topsoil in place during high wind events. However, even though this effect was high in the middle ranges from the 25th quantile to the 75th quantile, it was a little weaker at the median 50th quantile. This wind erosion prevention factor appeared to become overshadowed at the more extreme value levels by other factors. At the negative end of the manure value scale, past experience seemed to override it, while at the higher perceived value level, several other factors appeared to be much more important in a complicated way that we discuss below.
One negative preference item was related, but not necessarily as we expected:
- “Additional tillage required”—even though manure application requires extra tilling, this aspect was associated with higher manure value at the median and increasingly so toward the highest values. At the low manure value quantiles, extra tillage was associated with somewhat lowered values, but starting around the median, the extra tillage was linked with a relatively steep increase in value. Tillage, necessary to incorporate manure into the soil, may likely be seen as providing extra benefits; it loosens and aerates the soil. The need for extra tillage for those who value manure highly seemed to be perceived as providing multiple benefits. Apparently, using manure and plowing it into the soil are seen as complementary practices, such that a strong preference for tillage may accompany a propensity to incorporate manure into one’s farming practice or vice-versa. For some farmers, this may also be associated with the benefit of wind erosion control because, according to a hauler-spreader we interviewed, manure used to control erosion is often allowed to sit on the field surface until shortly before planting, at which time it is tilled into the soil. Used in this sequence, the manure provides a double benefit, but as mentioned above, the protection against wind erosion is not strongly or consistently valued.
Most other negative preference factors, such as concern about weeds, salts, soil compaction, neighbor issues, and fear of regulation, did show some downward effects on value, but these effects were inconsistent and not strong enough to be included in our model. Summary statistics for these factors are included in Table 2. To the extent that farmers often share among themselves technical information and beliefs about farming practices that work effectively for them in their operations, some of the terminology we used in our questionnaire may have been outside their familiarity, reducing the questionnaire’s ability to collect the desired information. There may have been other vocabulary or phrasings that would have better connected with their thinking processes. In future research, we would probably place additional emphasis on identifying farmer’s contemporary vocabulary in generating the questionnaire’s wording.
Some knowledge-related factors were represented in the form of practices or considerations that farmers indicated using:
- “Past experience”—a primary knowledge factor that surfaced as a practice related to manure’s value was using “past experience for determining nitrogen fertilizer or manure application rates”. Relying on past experience for fertilizer decisions was related to a somewhat lowered manure valuation, and this effect became large and consistent toward the high end of the manure value continuum. The large effect was mostly canceled out for two of the demand groups, those who used manure from their own livestock and those who purchased manure. Just as with the preference factors, several knowledge-oriented practices were apparently unrelated to the perceived value of manure. Here, again, our choice of phrasing or the practices themselves may not have been within the mainstream farmer’s normal word usage. In retrospect, it may have been better to ask about the use of these practices in determining application rates for nitrogen fertilizer and separately for manure.
- “Legume crediting”—for farmers at median and higher manure value quantiles, there was a slightly inverse relationship toward using legume crediting, which suggests that a farmer might see these two approaches as substitutable and might be using either a legume cover crop or manure but typically not both. Both practices can enhance a field’s soil properties and provide crop nutrients, and, in many countries, both approaches are effectively used in combination together. However, in our sample, it appeared that farmers who valued manure highly preferred using manure instead of cover crops. At the lower stated manure values, on the other hand, perceived values of manure were slightly increased for those who used legume crediting. This suggests that, for those who perceive manure’s value at a lower level, the two soil-enhancement approaches may be seen more as complementary to one another and are more likely to be used together, which concurs with the way they are viewed in most countries outside the U.S.
Some demographic factors also had differing effects at various quantiles:
- “Years in farming”—the number of years in farming was related to a slight reduction in the perceived value of manure up to the median, and this effect increased considerably toward the highest manure value quantiles. A possible explanation for this might be that, as a farmer ages, despite believing manure has a high value, the physical difficulty of applying manure may become a little more daunting each year. The alternative to manure, commercial fertilizer, is especially easy to use, since it is light and easily spreadable, and field-application is typically included as a part of the service. “Years in farming” may also reflect a preference to reduce the workload or to keep their operations as simple as possible, which could result from years of dealing with farming’s risks, uncertainties, and unanticipated conditions.
- ”Rurality”—the smaller sample was located in a considerably more rural area, and for all but the two lowest manure value quantiles, this more rural group perceived manure to have higher value than the metro area group. This could easily reflect a continuum of cultural bias to the extent that “country living” often includes the smell of livestock present, which diminishes as one moves closer to an urban area.
- The “Block” variable linked each response with one of four categories:
- Did not use manure
- Used manure from own livestock
- Purchased manure from outside source
- Accepted manure free or for credit.
These four categories are represented in the regression tables by the dummy variables Block 2 through Block 4; Block 1 is left out because it represents the base condition where none of these other three are indicated. At all quantile levels of manure valuation, those who had manure from their own livestock (Block 2) placed considerably higher value on manure than all the other groups. Those who purchased manure (Block 3) and valued it positively indicated a perception of manure’s value consistently higher than those who accepted it free or for credit. However, the few respondents who valued it negatively (the 10th quantile and below) but purchased manure anyway actually saw its value as lower than those who accepted it free or for credit (Block 4).
Figure 1 below depicts graphically the regression coefficients for each variable at the quantile levels modeled. Following that, in Table 5 below, we show a simplified presentation of the effects of factors modeled on manure’s perceived value, indicating the direction—positive, neutral, or negative—on perceived value. This renders Table 4 in a more useable form which could reasonably be applied in working with farmers and understanding their attitudes about the value of manure application in regard to their crop input management.
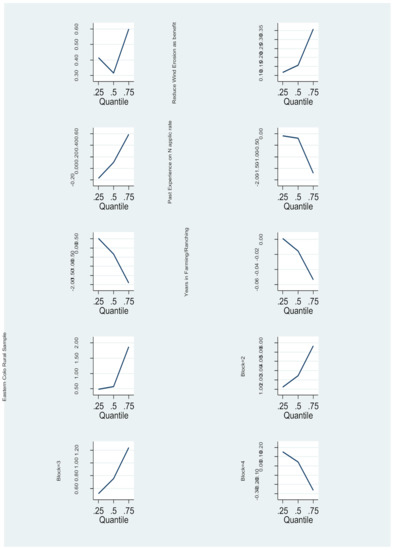
Figure 1.
Effects of each independent variable on M-value modeled at three quantile levels (.25, .50, and .75) of manure’s perceived value. (Note: The x-axis represents the quantile level of manure perceived value, and the y-axis shows effect of the specified variable on manure’s perceived value at the quantile indicated along the x-axis.).
Table 5.
Manure perceived value levels and factor effect directions.
Among the variables not included in this model were:
- “Concern regarding water pollution”, which distinctly reduced the perceived value of manure in the lowest quantile, 10%, where perceived value was around USD -1.20/ton, and also at the highest quantile, 90%, where the value was about USD 12.00/ton. However, effects in the median and the mid-ranges from 25% to 75% were inconsistent.
- “Consultant”, which showed some upward influence on manure’s perceived value in the low quantiles up to the median level but very little and very inconsistent pressure in the higher levels.
- “Field scouting”—using the practice of field scouting for insects, diseases, etc. was also related to a somewhat lower manure valuation throughout most of the quantile ranges, except at the extreme lowest and highest levels, where it was related to increased valuation of manure. None of these connections were reliable based on the data. This may indicate that, even while some farmers prefer to avoid possible contamination of their fields and see manure as potentially bringing in unwanted weed-seeds or pests, it nevertheless appears that field scouting is not a key factor in regard to the perceived value of manure.
Interpreting this information for more sustainable manure management involves understanding several aspects of farmers’ perception and views regarding manure application in crop production. Perceiving manure as cheap fertilizer and as a means to control wind erosion were both related with higher manure valuation. This finding is consistent with a study from Norwood, Luter, and Massey [36], who found that most farmers would substitute manure for commercial fertilizer even if the manure’s cost was only slightly lower than that of the equivalent commercial fertilizer. Perceptions of manure’s value were also moderated by the demographic group or the situation of the operation. More rural operators for the most part perceived manure’s value to be higher.
However, some of the results were not as we expected. The need for extra tilling when applying manure, which we anticipated might be inconvenient and a negative value factor, was related to a higher perceived value of manure, likely because these two practices work well in combination. Additional years of experience in farming were linked with a somewhat lowered value of manure. Perhaps this is related to aging and becoming less willing to take on the additional work of applying manure. Alternatively, it could mean that experience reduces the perceived value of manure.
Knowledge factors also appeared to be related to the perceived value of manure. Farmers who said they relied on “past experience” and on “legume crediting” for deciding about fertilizer application rates saw manure’s value to be substantially lower than others who did not indicate using those practices, except at the lowest perceived value level where legume crediting related positively with increasing manure’s perceived value. These factors may reflect the variability and the relative inconsistency of manure’s contents in that manure application can introduce unexpected or undesired side effects, requiring additional attention and new layers of decision-making. Farming is complex, and simplifying or standardizing the overall processes of daily farm operation might likely become especially desirable as a farmer ages and strives to streamline his or her work-life.
Recognizing the fertilizer value of applied manure to reduce selectively the quantity of commercial fertilizer applied on already highly fertile parts of a field could increase profitability while protecting resources from over-application of nutrients. Advances in “precision agriculture” provide an opportunity for adjusting nutrient levels to accommodate the variabilities inherent in soils of specific fields [41,42,43]. Rather than uniformly applying nutrients over an entire field, fertilizer application rates can be programmed to adjust as a tractor progresses through each row, using real-time data that show nutrient needs specific to each location within a field. This approach can tailor the application rate of commercial fertilizer, avoiding the excesses of blanket fertilizing where manure’s nutrients already provided a solid fertility base [40]. Far from being a simple solution, precision agriculture opens up a more complex set of decisions for the farmer. Additionally, at this time, precision agriculture is relatively expensive; nevertheless, a number of farms are using it, and as it becomes more prevalent and the cost goes down, it will eventually provide more economically efficient and more sustainable use of crop inputs, including manure.
Other important considerations not covered here but worthy of future research in regard to field application of manure, include: variation in the permeability of soils and variations in nutrient content of manure [44]; timeliness of manure application relative to wind conditions where volatilized nutrients such as excess nitrogen in the form of nitrate (NO3) and ammonia (NH3) are likely to be transported to and deposited in vulnerable areas [45,46,47]; and complexity of managing various, sometimes conflicting goals where the decisions required of farmers are already highly complex and uncertain. Disciplinary pressures exerted by a small number of large agricultural supply corporations may be a systemic underlying factor in the farmer’s over-application of nitrogen [15]. Additionally, from a cultural perspective, the knowledge base of stakeholder decision-making groups is highly relevant. The concept of “groundwater citizenship” raised by Ternes [48] is also worthy of exploration in regard to water quality concern levels of different groups, especially among the farming populations around feedlots.
5. Conclusions
An important goal of this project was to suggest ways of shaping policy so that farmers are more likely to manage manure sustainably, reducing nutrient impacts on the environment of which they are stewards. Policies that support and reward the optimally efficient use of manure as a valuable, low-cost fertilizer will almost certainly generate more success than simply recommending or advocating environmental sustainability measures, because farming is especially sensitive to the need for cost management. Such policies could include informational/educational outreach programs emphasizing the perceived values of manure in crop production combined with monetary or other incentives for relying on the nutrients of manure applied at sustainable rates and for minimizing the amounts of commercial fertilizer added in combination with manure. Implementation of any such programs could likely be more effective if they are designed to consider how specific farmers perceive the value of manure used in their operations, their types of operations, how they acquire their manure, how they view manure’s place in the operations, and their years of experience in the field.
In working with farmers to encourage moderation in nutrient application, especially where inexpensive manure is readily available from local feedlots, it will be useful to identify farmers’ perceived valuations of manure and their goals in using it prior to discussing or attempting to influence their manure management practices, adjusting the approach based on each farmer’s perception of manure’s value level. Clearly, better regulatory control is also needed in some regions, but we advocate also using manure’s perceived value as a means of connecting with farmers around sustainability awareness and of recognizing what can motivate them to apply manure more sustainably and thereby protect water resources and the biodiversity of their watersheds.
Author Contributions
Conceptualization, E.v.S. and D.L.K.H.; methodology, E.v.S. and D.L.K.H. All authors have read and agreed to the published version of the manuscript.
Funding
The data collection for this study was funded in part by the United States Department of Agriculture under SARE Grant #SW96-007. The principal investigator was Jessica G. Davis.
Institutional Review Board Statement
The IRB of Colorado State University reviewed the survey and determined that ethical review and approval were waived for this study because no individual identifying data was being acquired.
Informed Consent Statement
The questionnaire specified that response was completely voluntary, and it was made clear that no identifying individual information was being collected.
Data Availability Statement
The data presented in this study are available on request from the corresponding author, and have not been placed in a public repository.
Conflicts of Interest
The authors declare no conflict of interest.
References
- Asai, M.; Langer, V.; Frederiksen, P.; Jacobsen, B.H. Livestock farmer perceptions of successful collaborative arrangements for manure exchange: A study in Denmark. Agric. Syst. 2014, 128, 55–65. [Google Scholar] [CrossRef]
- Almasri, M.N. Nitrate contamination of groundwater: A conceptual management framework. Environ. Impact Assess. Rev. 2007, 27, 220–242. [Google Scholar] [CrossRef]
- Centner, T.J.; Wetzstein, M.E.; Mullen, J.D. Small livestock producers with diffuse water pollutants: Adopting a disincentive for unacceptable manure application practices. Desalination 2008, 226, 66–71. [Google Scholar] [CrossRef]
- Haque, S.E. How Effective are existing phosphorus management strategies in mitigating surface water quality problems in the U.S.? Sustainability 2021, 13, 6565. [Google Scholar] [CrossRef]
- Livingston, M.L.; Cory, D.C. Agricultural nitrate contamination of ground water: An evaluation of environmental policy. J. Am. Water Resour. Assoc. 1998, 34, 1311–1317. [Google Scholar] [CrossRef]
- Nunez, J.T.; McCann, L. Determinants of manure application by crop farmers. J. Soil Water Conserv. 2008, 63, 312–321. [Google Scholar] [CrossRef]
- Osmond, D.L.; Hoag, D.L.K.; Luloff, A.E.; Meals, D.W.; Neas, K. Farmers’ use of nutrient management: Lessons from watershed case studies. J. Environ. Qual. 2015, 44, 382–390. [Google Scholar] [CrossRef] [PubMed]
- Sampat, A.M.; Hicks, A.; Ruiz-Mercado, G.J.; Zavala, V.M. Valuing economic impact reductions of nutrient pollution from livestock waste. Resour. Conserv. Recycl. 2021, 164, 105199. [Google Scholar] [CrossRef] [PubMed]
- Fleming, R.A.; Babcock, B.A.; Wang, E. Resource or waste? The economics of swine manure storage and management. Rev. Agric. Econ. 1998, 20, 96–113. [Google Scholar] [CrossRef][Green Version]
- Hoag, D.L.; Lacy, M.G.; Davis, J. Pressures and preferences affecting willingness to apply beef manure on crops in the colorado high plains. J. Agric. Resour. Econ. 2004, 29, 461–480. [Google Scholar]
- Aillery, M.P.; Gollehon, N.R.; Johansson, R.C.; Kaplan, J.D.; Key, N.D.; Ribaudo, M. Managing Manure To Improve Air And Water Quality; Agricultural Economics Report 9; Economic Research Service: Washington, DC, USA, 2005. [Google Scholar]
- Ribaudo, M. The Limits of voluntary conservation programs. Choices 2015, 30, 1–5. [Google Scholar]
- Dudley, N.; Alexander, S. Agriculture and biodiversity: A review. Biodiversity 2017, 18, 45–49. [Google Scholar] [CrossRef]
- Ribaudo, M. Hypoxia in the gulf: Addressing agriculture’s contribution. Amber Waves 2006, 4, 37. [Google Scholar]
- Stuart, D.; Houser, M. Producing compliant polluters: Seed companies and nitrogen fertilizer application in U.S. corn agriculture. Rural Sociol. 2018, 83, 857–881. [Google Scholar] [CrossRef]
- Tully, K.; Ryals, R. Nutrient cycling in agroecosystems: Balancing food and environmental objectives. Agroecol. Sustain. Food Syst. 2017, 41, 761–798. [Google Scholar] [CrossRef]
- Hogberg, M.G.; Fales, S.L.; Kirschenmann, F.L.; Honeyman, M.S.; Miranowski, J.A.; Lasley, P. Interrelationships of animal agriculture, the environment, and rural communities. J. Anim. Sci. 2005, 83, E13–E17. [Google Scholar]
- Amon-Armah, F.; Yiridoe, E.K.; Jamieson, R.; Hebb, D. Comparison of crop yield and pollution production response to nitrogen fertilization models, accounting for crop rotation effect. Agroecol. Sustain. Food Syst. 2015, 39, 245–275. [Google Scholar] [CrossRef]
- Burton, R.J.F.; Wilson, G.A. Injecting social psychology theory into conceptualisations of agricultural agency: Towards a post-productivist farmer self-identity? J. Rural. Stud. 2006, 22, 95–115. [Google Scholar] [CrossRef]
- Jackson-Smith, D.; Ewing, S.; Jones, C.; Sigler, A.; Armstrong, A. The road less traveled: Assessing the impacts of farmer and stakeholder participation in groundwater nitrate pollution research. J. Soil Water Conserv. 2018, 73, 610–622. [Google Scholar] [CrossRef]
- Davis, J.G. Manure Management and Crop Production in Northeastern Colorado; Colorado State University: Fort Collins, CO, USA; USDA: Washington, DC, USA, 1999. [Google Scholar]
- Carlisle, L. Factors influencing farmer adoption of soil health practices in the United States: A narrative review. Agroecol. Sustain. Food Syst. 2016, 40, 583–613. [Google Scholar] [CrossRef]
- Galyean, M.L.; Ponce, C.; Schutz, J. The future of beef production in North America. Anim. Front. 2011, 1, 29–36. [Google Scholar] [CrossRef]
- Gollehon, N.R.; United States Department of Agriculture Economic Research Service. Confined Animal Production and Manure Nutrients; Agriculture information bulletin no. 771; US Department of Agriculture, Economic Research Service: Washington, DC, USA, 2001. [Google Scholar]
- Ribaudo, M.O.; Gollehon, N.R.; Agapoff, J. Land application of manure by animal feeding operations: Is more land needed? J. Soil Water Conserv. 2003, 58, 30–38. [Google Scholar]
- Von Keyserlingk, M.A.G.; Martin, N.P.; Kebreab, E.; Knowlton, K.F.; Grant, R.J.; Stephenson, M.; Sniffen, C.J.; Harner, J.P.; Wright, A.D.; Smith, S.I. Invited review: Sustainability of the US dairy industry. J. Dairy Sci. 2013, 96, 5405–5425. [Google Scholar] [CrossRef] [PubMed]
- Colorado Revised Statutes. Title 35—Agriculture Administration: Article 3.5—Nuisance Liability of Agricultural Operations. 2017. Available online: https://law.justia.com/codes/colorado/2017/title-35/administration/article-3.5/ (accessed on 17 April 2018).
- Heinzen, T.; Russ, A. Using emerging pollution tracking methods to address the downstream impacts of factory farm animal welfare abuse. Pace Environ. Law Rev. 2014, 31, 475. [Google Scholar]
- Shortle, J.S.; Abler, D.G. (Eds.) Environmental Policies for Agricultural Pollution Control; CABI: New York, NY, USA, 2001. [Google Scholar]
- Colorado Agricultural Statistics Service; Colorado Crop and Livestock Reporting Service; United States Department of Agriculture; Colorado State Planning Commission; Colorado Department of Agriculture. Colorado Agricultural Statistics; Colorado Crop and Livestock Reporting Service: Lakewood, CO, USA, 1935. Available online: https://www.nass.usda.gov/Statistics_by_State/Colorado/ (accessed on 5 November 2018).
- Davis, J.G.; Young, M.; Abnstedt, B. Soil characteristics of cropland fertilized with feedlot manure in the south platte river basin of Colorado. J. Soil Water Conserv. 1997, 52, 327–331. [Google Scholar]
- Colorado Dept of Health and Environment. Regulation No. 85—Nutrients Management Control Regulation. 2012. Available online: https://mhfd.org/wp-content/uploads/2019/12/Regulation-85-Data-Gap-Report_Final.pdf (accessed on 23 October 2019).
- Bauder, T.A. Nitrogen and Irrigation Management; Crop Series. Soil. Colorado State University: Fort Collins, CO, USA, 2011. [Google Scholar]
- Waskom, R.M. Best Management Practices for Manure Utilization; Bulletin 568A; Colorado State University Cooperative Extension: Fort Collins, CO, USA, 1999. [Google Scholar]
- Ali, S.; McCann, L.; Alspach, J. Manure transfers in the midwest and factors affecting adoption of manure testing. J. Agric. Appl. Econ. 2012, 44, 533–548. [Google Scholar] [CrossRef]
- Norwood, F.B.; Luter, R.L.; Massey, R.E. Asymmetric willingness-to-pay distributions for livestock manure. J. Agric. Resour. Econ. 2005, 30, 431–448. [Google Scholar]
- Hall, M.D. Simulation of Nitrates in a Regional Subsurface System: Linking Surface Management with Ground Water Quality. Ph.D. Thesis, Colorado State University, Fort Collins, CO, USA, 1996. [Google Scholar]
- Hatfield, J.L.; Sauer, T.J. Soil Management: Building a Stable Base for Agriculture; American Society of Agronomy: Madison, WI, USA, 2011. [Google Scholar]
- Nunez, J.; McCann, L. Crop farmers’ willingness to use manure. In Proceedings of the American Agricultural Economics Association Annual Meeting, Denver, CO, USA, 1–4 August 2004. [Google Scholar] [CrossRef]
- Scharf, P.C.; Kitchen, N.R.; Sudduth, K.A.; Davis, J.G.; Hubbard, V.C.; Lory, J.A. Field-scale variability in optimal nitrogen fertilizer rate for corn. Agron. J. 2005, 97, 452–461. [Google Scholar] [CrossRef]
- Delgado, J.A.; Khosla, R.; Mueller, T. Recent advances in precision (target) conservation. J. Soil Water Conserv. 2011, 66, 167A–170A. [Google Scholar] [CrossRef]
- Khosla, R.; Fleming, K.; Delgado, J.A.; Shaver, T.M.; Westfall, D.G. Use of site-specific management zones to improve nitrogen management for precision agriculture. J. Soil Water Conserv. 2002, 57, 513–518. [Google Scholar]
- Gardezi, M.; Bronson, K. Examining the social and biophysical determinants of u.s. midwestern corn farmers’ adoption of precision agriculture. Precis. Agric. 2020, 21, 549–568. [Google Scholar] [CrossRef]
- Shepard, R. Nitrogen and phosphorus management on Wisconsin farms: Lessons learned for agricultural water quality programs. J. Soil Water Conserv. 2000, 55, 63–68. [Google Scholar]
- Baron, J.S.; Rueth, H.M.; Wolfe, A.M.; Nydick, K.R.; Allstott, E.J.; Minear, J.T.; Moraska, B. Ecosystem responses to nitrogen deposition in the Colorado front range. Ecosystems 2000, 3, 352–368. [Google Scholar] [CrossRef]
- Fenn, M.E.; Haeuber, R.; Tonnesen, G.S.; Baron, J.S.; Grossman-Clarke, S.; Hope, D.; Jaffe, D.A.; Copeland, S.; Geiser, L.; Rueth, H.M.; et al. Nitrogen emissions, deposition, and monitoring in the Western United States. BioScience 2003, 53, 391–403. [Google Scholar] [CrossRef]
- Wolfe, A.P.; Van Gorp, A.C.; Baron, J.S. Recent ecological and biogeochemical changes in alpine lakes of Rocky Mountain National Park (Colorado, USA): A response to anthropogenic nitrogen deposition. Geobiology 2003, 1, 153–168. [Google Scholar] [CrossRef]
- Ternes, B. Groundwater citizenship and water supply awareness: Investigating water-related infrastructure and well ownership. Rural. Sociol. 2018, 83, 347–375. [Google Scholar] [CrossRef]

Publisher’s Note: MDPI stays neutral with regard to jurisdictional claims in published maps and institutional affiliations. |
© 2021 by the authors. Licensee MDPI, Basel, Switzerland. This article is an open access article distributed under the terms and conditions of the Creative Commons Attribution (CC BY) license (https://creativecommons.org/licenses/by/4.0/).