Article

Optimization of MgO-GGBS Cementitious Systems Using Thermo-Chemical Approaches

School of Engineering, Faculty of Computing, Engineering and Science, University of South Wales, Pontypridd CF37 1DL, UK
*
Author to whom correspondence should be addressed.
Sustainability 2021, 13(16), 9378; https://doi.org/10.3390/su13169378
Submission received: 3 August 2021 / Revised: 16 August 2021 / Accepted: 19 August 2021 / Published: 20 August 2021
(This article belongs to the Special Issue Green Engineering: Green Composite Material and Biodiesel from Wastes)

Abstract

:
The current study investigated the development of a sustainable thermo-chemical approach to effectively optimize MgO-waste activated GGBS formulations, using four types of magnesium oxide (MgO) waste materials with ground granulated blast-furnace slag (GGBS) to develop binary cementitious systems (MgO-GGBS). This stems from the expected complexity of cementitious binder optimization outcomes into a simpler analytic form, enhancing the rapid delivery of optimization results and contributing to the global awareness of sustainable approaches and use of industrial wastes. Three levels of Portland cement by weight (90, 80, and 70 wt.%) was replaced with MgO wastes including an industrial by-product (GGBS) to develop an experimental regime. Investigation was carried out by employing an experiment-based optimisation technique (thermo-chemical approach), which involved the design of an experimental regime and application of experimental tests (pH measurements, thermogravimetric and derivative thermogravimetric analysis—TG/DTG and isothermal calorimetry), establishment of design variable/parameters, measurement of the design performance of the identified design parameters, and review of the relationship between the independent (control) and dependent variables (MgO wastes and their compositions). The experimental test results successfully optimised the binder compositions, established the best performing binder system (MG1), and provided an in-depth insight into the thermal stability and hydration kinetics of the investigated binder systems.

1. Introduction

The production and application of new cementitious materials can be a cumbersome task in understanding and discovering an optimum mix composition. This is due to the virtually infinite number of possible binder compositions (different oxides stoichiometry) that could be investigated even if one is restricted to the main material oxides (Ca, MgO, SiO2, Al2O3, and H2O) to produce calcium silicate hydrate (C-S-H) and magnesium silicate hydrate (M-S-H) precipitate amongst other formations [1,2,3,4,5]. Abdolhosseini Qomi et al. [6] suggested that small differences in the structure and composition could significantly impact on the properties of the developing binder systems. This could be further complicated based on the impact of the thermodynamic conditions (pH, temperature, relative humidity, pressure, etc.) on the structure of the developed binders at varying compositions [7].
The traditional Edisonian technique for optimization constantly used by various researchers (i.e., adding varying/random fractions of SCMs to PC or MgO) based on a “trial-and-error” approach has been found to possess limited or inaccurate results, which will not likely result in further research discovery [8]. This necessitated the investigation and application of several systemic/theoretical optimisation techniques such as expert, algorithmic/mathematical (Tagushi, Maxwell, and PROMETHEE II method), and experiment-based optimisation techniques. The expert and algorithmic/mathematical (Tagushi, Maxwell, and PROMETHEE II method) technique has been reported to be often time-consuming, is critically reliant on the existence of large databases of reliable and consistent data that are presently lacking, and requires a step-by-step method for establishing the right mix composition and associated parameters to obtain the most effective blend system. However, the experiment-based optimisation technique could require a certain level of technical knowledge and expertise for its application [9,10,11,12,13,14]. The basic principle that underpins the experiment-based optimisation technique involves the design of an experimental regime and application of experimental tests (isothermal calorimetry, TG/DTG, and pH measurements), the identification and establishment the design variable/parameters with maximum and minimum limits, the measurement of the design performance of the identified design parameters (hydration kinetics etc.), and a review of the relationship between the independent (control) and dependent variables (MgO wastes and their compositions). Recent investigations into the sustainable application of MgO for cementitious systems have shown its potential to mitigate the negative environmental impacts of PC [2,15,16]. Yi et al. [17] compared the use of MgO and PC for developing cementitious binder systems and found 70–72% less energy consumption, a 65–79% CO2 emission reduction, and a 6–13% reduction in the cost of MgO production compared to PC.
Regarding the design parameters, it is worth noting that the performance of cementitious formulations has recently been found to be a key focal point of interest with respect to the monitoring of heat evolution during a hydration process. This stems from the hypothesis that the performance of cementitious systems could be predicted by monitoring the generated heat during hydration, which can be measured by a calorimeter [18]. Therefore, the heat of hydration, which is the integral of the heat production rate (thermal power) in a hydration process, is very essential for investigating hydration rates, variation in temperature changes within the cementitious binder composition, and classification of binder compositions based on their reactivity [19,20]. Some thermochemical approaches have been used to evaluate the hydration kinetics of Portland cement [18,21,22]. Nevertheless, the application of isothermal calorimetry, thermogravimetric and derivative thermogravimetric analysis (TG/DTG), and pH measurements for MgO-GGBS system have not been well-established in the existing literature for binder optimisation. Until now, most researchers have concentrated on the application of this experimental tool at a later stage of research for a predetermined mix composition, rather than the initial optimization of cementitious binder systems. Therefore, the laboratory tests will be employed as an optimization tool in the current study to further simplify the expected complexity of the optimisation of an emerging binder system (MgO-GGBS) into a simpler analytic form that can be examined from the laboratory tests.
The current study reports the outcome of a thermo-chemical optimisation approach, which was employed to establish the best performing MgO-waste:GGBS binder system developed from four (4) different types of MgO-waste material, upon inclusion with GGBS based on the aforementioned design parameters (intensity of heat of hydration, alkalinity levels, magnitude and duration of forming calorimetric peaks, type and magnitude of the formed hydration cementitious peaks, and overall thermal behaviour of the developed binder systems). The outcomes of this study were intended to provide further insight into the hydration kinetics of using MgO wastes and GGBS as an activator and precursor, respectively, in relation to binder optimization and improve on the sustainability impacts of applying this thermo-chemical approach. However, optimization as related to the chemical and thermal performance of the binder systems was only considered in the current study.

2. Materials and Methodology

2.1. Materials

Characterisation of materials employed in research is a key parameter of understanding the composition/structure of the investigated material and potential performance within a system developed prior to any optimization process. The materials used for this research were Portland cement—PC (CEM 1-42.5N), magnesium oxide wastes (MgO), ground granulated blast-furnace slag (GGBS), and de-ionized water. PC was manufactured in compliance with BS EN 197-1 [23] and supplied by Lafarge Cement UK. GGBS as a latent hydraulic material was supplied and used in accordance with BS EN 15,167-1 [24] by Civil and Marine Ltd., Llanwern, Newport, UK. The MgO specimens are waste products obtained as by-products from the mining activities of magnesite (MgCO3) by Magnesitas Navarras, Navarra, Spain. There are four (4) different types of MgO wastes, which are identified as MG1, MG2, MG3, and MG4 in the current study. XRD (X-ray diffraction) analysis was carried out on the raw binder samples under room temperature using a STOE Powder Diffraction System with operating conditions of CuKα sealed tube. This was operated at a radiation of 1.54060 nm with a measurement range from 10 to 80 2θ(0) at 0.0150 step in compliance with ASTM C1365–18 [21]. A qualitative phase analysis (QPA) was further carried out on the XRD patterns using a Match3! Analysis software to identify the crystalline cement phases [22].
Table 1 and Table 2 and Figure 1 shows the chemical composition, properties, and XRD plots for all the binder materials (CEM I, MG1, MG2, MG3, MG4, and GGBS). Some of the main identified crystalline phases are periclase (MgO) at 42.9, 62.3, 75.1, and 78.92θ(0), lime (CaO), quartz (SiO2), anhydrite (CaSO4), and alite (3CaO·SiO2). It was observed that calcium oxide (CaO), silicon dioxide (SiO2), magnesium oxide (MgO), and sulphur trioxide (SO3) are the dominant elements within the compositions of the identified magnesium oxide wastes. This was further substantiated by the XRD patterns indicating the crystallized forms (minor clinker and cement phases) of the identified elements as periclase (MgO) at 42.9, 62.3, 75.1, and 78.92θ(0), lime (CaO), quartz (SiO2), gypsum (Anhydrite—CaSO4), and alite (3CaO·SiO2).
The XRD patterns for GGBS indicated a rather glassy phase, while the particle size distribution shown in Figure 2 was performed using a Malvern Mastersizer 2000 equipment in accordance with BS EN ISO 17,892–4 [25], and it indicated that the d50 values for MG1, MG2, MG3, and MG4 as 16.24, 18.72, 62.74, and 6.52 µm, respectively. This shows that MG4 was the finest material, while MG3 was the least fine material among the four types of binders. Additionally, the reactivity values as shown in Table 2 indicate the level of reactivity for each MgO waste material. However, it should be noted that smaller values indicate high reactivity [26]. Therefore, in the order of reactivity, MG1 is more reactive than others while MG3 is the least reactive.

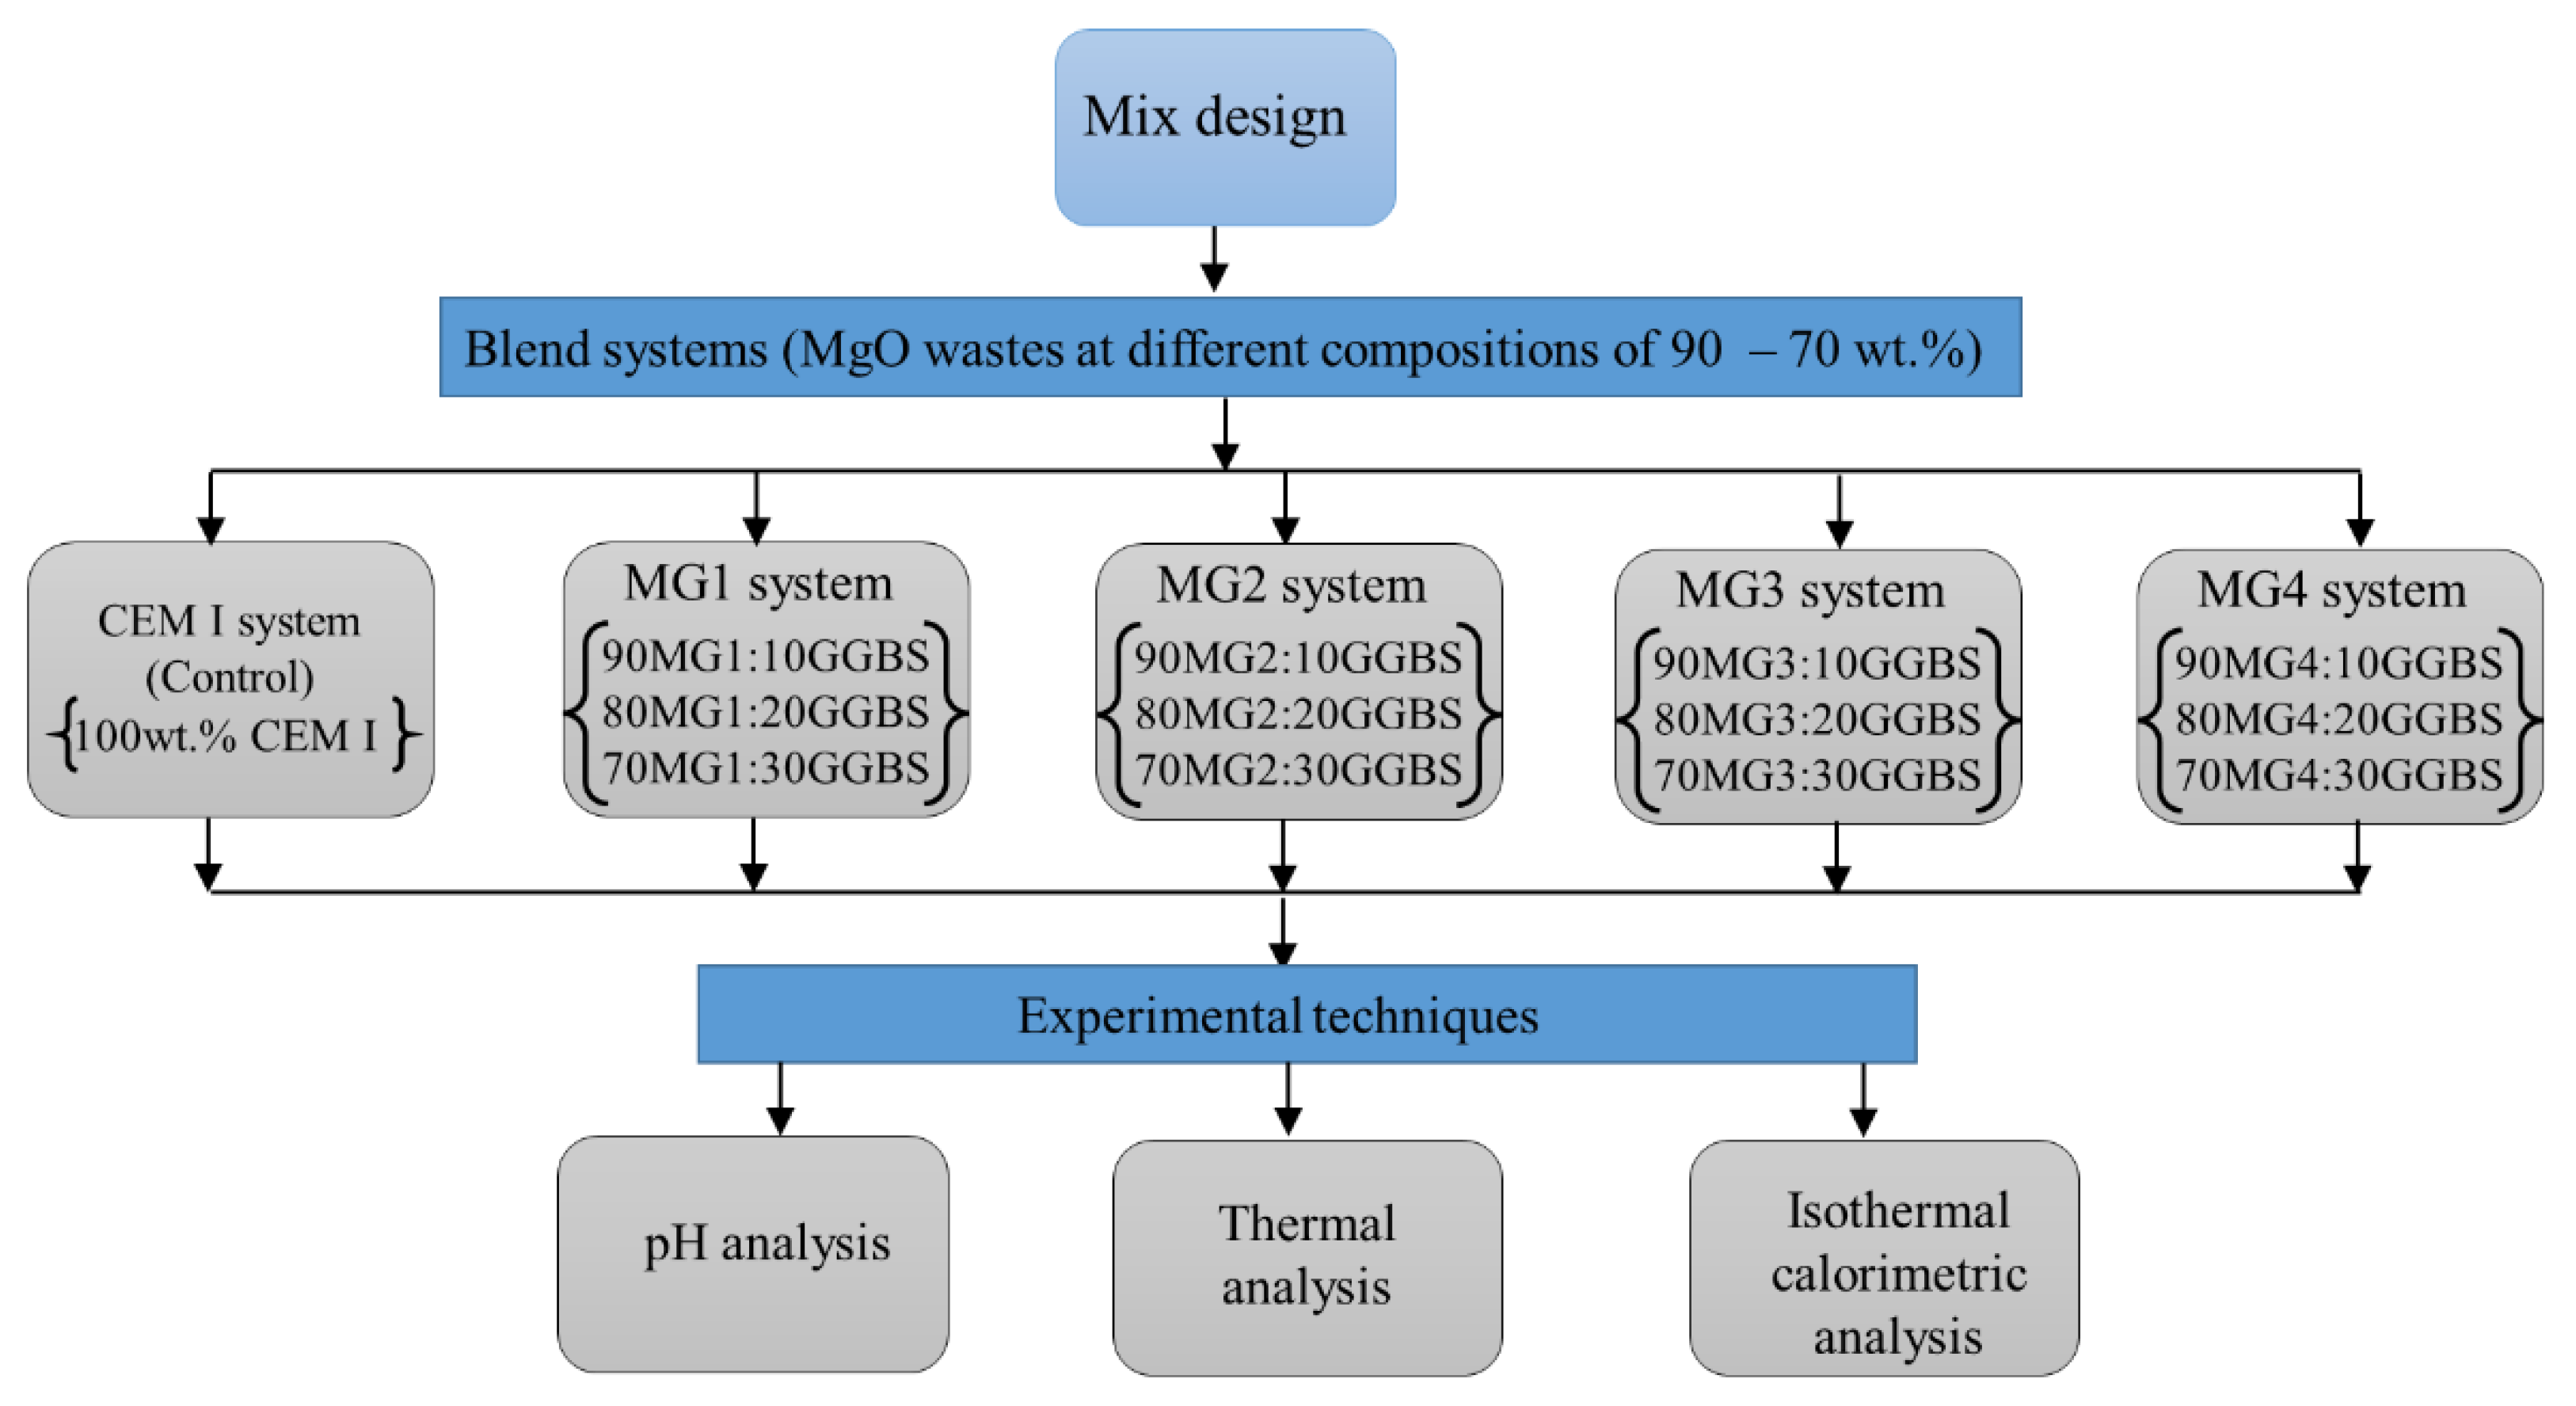
2.2. Mix Design and Sample Preparation

The dry MgO-waste-GGBS mixtures were designed with the mind-set of using MgO as a waste material (blend mixtures with a large amount of MgO-waste) to activate lower proportions of GGBS. This was found to be necessary due to the current trend of using MgO as an activator [2,3,5,27,28], instead of exploiting the overall expected sustainability potential and impact of using MgO in large quantities as a waste material within a mix design. Table 3 shows the mix design for seventeen (17) blend compositions for the dry sample mixtures. They were produced by using three (3) levels of MgO-waste proportions by weight (90, 80, and 70 wt.%) with GGBS to produce groups of four blend systems (MG1, MG2, MG3, and MG4), while the control mix was composed of 100 wt.%CEM I. The dry powders of MgO-waste with GGBS were measured to the predetermined quantities, placed in a mechanical mixer, and thoroughly mixed for 10 min. This was done to ensure the homogeneity of the mixtures, as it was established that the attainment of homogeneity for dry binder samples could be problematic due to the inherent lower shear force between the fine particles, even with increased blending time [20]. Additionally, ceramic balls were placed in the mechanical mixer to further improve on the homogeneity of the mixes. Afterwards, the blended mixes were stored in well-labelled flat tins and placed in a desiccator after the completion of the mixing regime. Figure 3 shows the schematic layout of the experimental mix design.

2.3. Experimental Techniques

The pH values for each binder composition were obtained in accordance with BS EN ISO 787-9 [29] using a Hanna HI-8314 water-resistant hand-held pH, mV/Temperature Meter with an HI-1217D pre-amplified pH electrode/internal temperature sensor at an accuracy of ±0.01. The test was carried out in triplicate and the average value evaluated and recorded. A suspension was developed using five grams (5 g) of the designed blend mixtures (Table 3) with 50 mL of deionized water in a 100 mL glass beaker and mixed vigorously using a magnetic stirrer. The suspension was allowed to stand for 5 min to allow the residue to settle. Afterwards, the electrode in the portable pH/mV/°C meter was then inserted in the solution and the pH value obtained. The thermal analysis (thermogravimetric and derivative thermogravimetric analyses (TG/DTG)) was investigated using a Hi-Res TGA55 TA Instrument thermal apparatus for the phases present in the hydration reaction of the blended compositions in compliance with ASTM E2550–17 [30]. The dry sample mixtures were initially placed in a desiccator at a low temperature of 400 °C containing silica gel for accelerated drying of samples to a constant weight. This was performed to remove any free water and to preserve the hydration products and any other combustible phases [31]. The dry sample mixtures were tested in alumina crucibles under an argon gas atmosphere at a heating rate of 100 °C/min up to 1000 °C. The weight loss (%) and derivative weight d(Weight)/d(D) (%/°C) data were logged, collated, and analysed using a TRIOS Thermal Analysis software.
Calorimetric analysis was carried out to investigate the hydration kinetics of the proposed experimental blend mixtures (binders) by directly measuring the rate of heat produced during the hydration process within a thermostated isothermal calorimetry chamber. The heat production rate (thermal power) was determined at a controlled temperature for a period of 72 h using a ToniCAL Isothermal Calorimeter from Toni Technik, Germany (Figure 4). Five grams (5 g) of the dry sample for the different types of MgO-GGBS compositions were placed in a calorimetry specimen tube [32]. The specimen tube was placed in the calorimetry chamber covered with a lid, and deionized water was introduced using a syringe after equilibrium had been achieved within the thermostated chamber to produce a paste using a w/b of 0.5. The heat produced during the hydration reaction was detected, stored, and analysed using a data acquisition system (ToniDCA Analysis software) in compliance with BS EN 196–11 [33].

3. Results

3.1. pH Analysis

Figure 5 presents an illustration of the pH levels for the various MgO-waste:GGBS mix compositions that were produced for each binder system. The results show the performance of the pH levels of binder compositions using three (3) high levels (90, 80, and 70 wt.%) of MgO wastes (MG1, MG2, MG3, and MG4) with GGBS and 100 wt.% CEM I (Control). It was observed that the mix compositions within the M4 binder system all produced significant pH values of 13 (90 wt.%), 13.1 (80 wt.%), and 13.1 (70 wt.%), which are all 5% lower than that of the control mix (100 wt.% CEM I) that produced a pH value of 13.9. An obvious reason for this trend could be due to the combined individual amount of Calcium (Ca) content from MG4 and GGBS present within the blend compositions for MG4 blend systems. However, the MG2, MG3, and MG1 binder systems all produced lower pH values within the range of 11.1–11.2, which was about 23–25% lower than that of the control mix. A possible justification for the lower pH values could be due to the lower combined amount of Ca present within the MgO:GGBS compositions within each binder system (MG2, MG3, and MG1). Generally, the results of the pH values indicate that all the mix compositions within each binder system are all alkaline (basic) in nature (11–14).

3.2. Thermal Analysis

Figure 6, Figure 7, Figure 8 and Figure 9 shows the TG/DTG plots for all the blend compositions within each MgO waste blend system. Generally, MgO wastes had a large impact on the hydration process as they can be seen to have influenced the pattern of the TG/DTG curves that were produced for all the blended mixtures compared with GGBS.
Four main endothermic peaks are evident at location points 1, 2, 3, and 4 for blend systems MG1, MG3, and MG4 with corresponding weight losses at varying temperature ranges. However, blend compositions in the MG2 blend system only achieved three endothermic peaks. The position of each endothermic peak depends mainly on the type of structure and the binding of the hydroxyls of the MgO wastes and GGBS, whereas their (endothermic peaks) shape and range depend more on the crystallinity or particle size distribution of the MgO wastes and GGBS [34]. The highest peak intensities were developed by MG3 type of MgO waste material at every location (1, 2, 3, and 4) followed by MG1, MG4, and MG2, respectively. This trend of peak intensity heights was also concurrent with the blend compositions (90, 80, and 70 wt.% MgO content) produced by the MgO wastes as they could have been largely influenced by the MgO waste material in each composition. It was also evident that all the blend compositions in each blend system exhibited the same pattern as the individual MgO material waste. This suggests that the MgO material had a major influence on the performance of the developing MgO:GGBS binder. However, this was not the case for the individual GGBS as it exhibited only an endothermic peak at 680 °C, which is the lowest peak intensity. For the MgO:GGBS systems, all the blend compositions with 90 wt.% MgO content produced the highest endothermic peak intensity for all the blend systems. Moreover, there was a gradual reduction in endothermic peak intensities for every gradual reduction in the quantity of MgO waste (90, 80, and 70 wt.%) in each blend system (MG1, MG2, MG3, and MG4).
Figure 10 shows the summary of total weight losses after the complete thermal analysis of all the blend compositions for each MgO waste blend system, which were obtained from the TG/DTG plots in Figure 6, Figure 7, Figure 8 and Figure 9. This is one of the optimization design criteria for choosing the best performing binder system. The largest weight loss was experienced by MG3 blend system with 90, 80, and 70 wt.% MgO content within the range of 24–31% while the lowest weight loss was experienced by the control (3.2%). However, blend compositions within the MG2 blend system produced the lowest weight losses within the range of 6–7%. With respect to each individual binder material (MG1, MG2, MG3, MG4, and GGBS), Figure 6, Figure 7, Figure 8 and Figure 9 shows that only GGBS was considerably stable (1.6%), while other material components experienced a significant individual weight loss of 7.7% (MG2), 13.8% (MG4), 20% (MG1), and 34% (MG3), respectively.

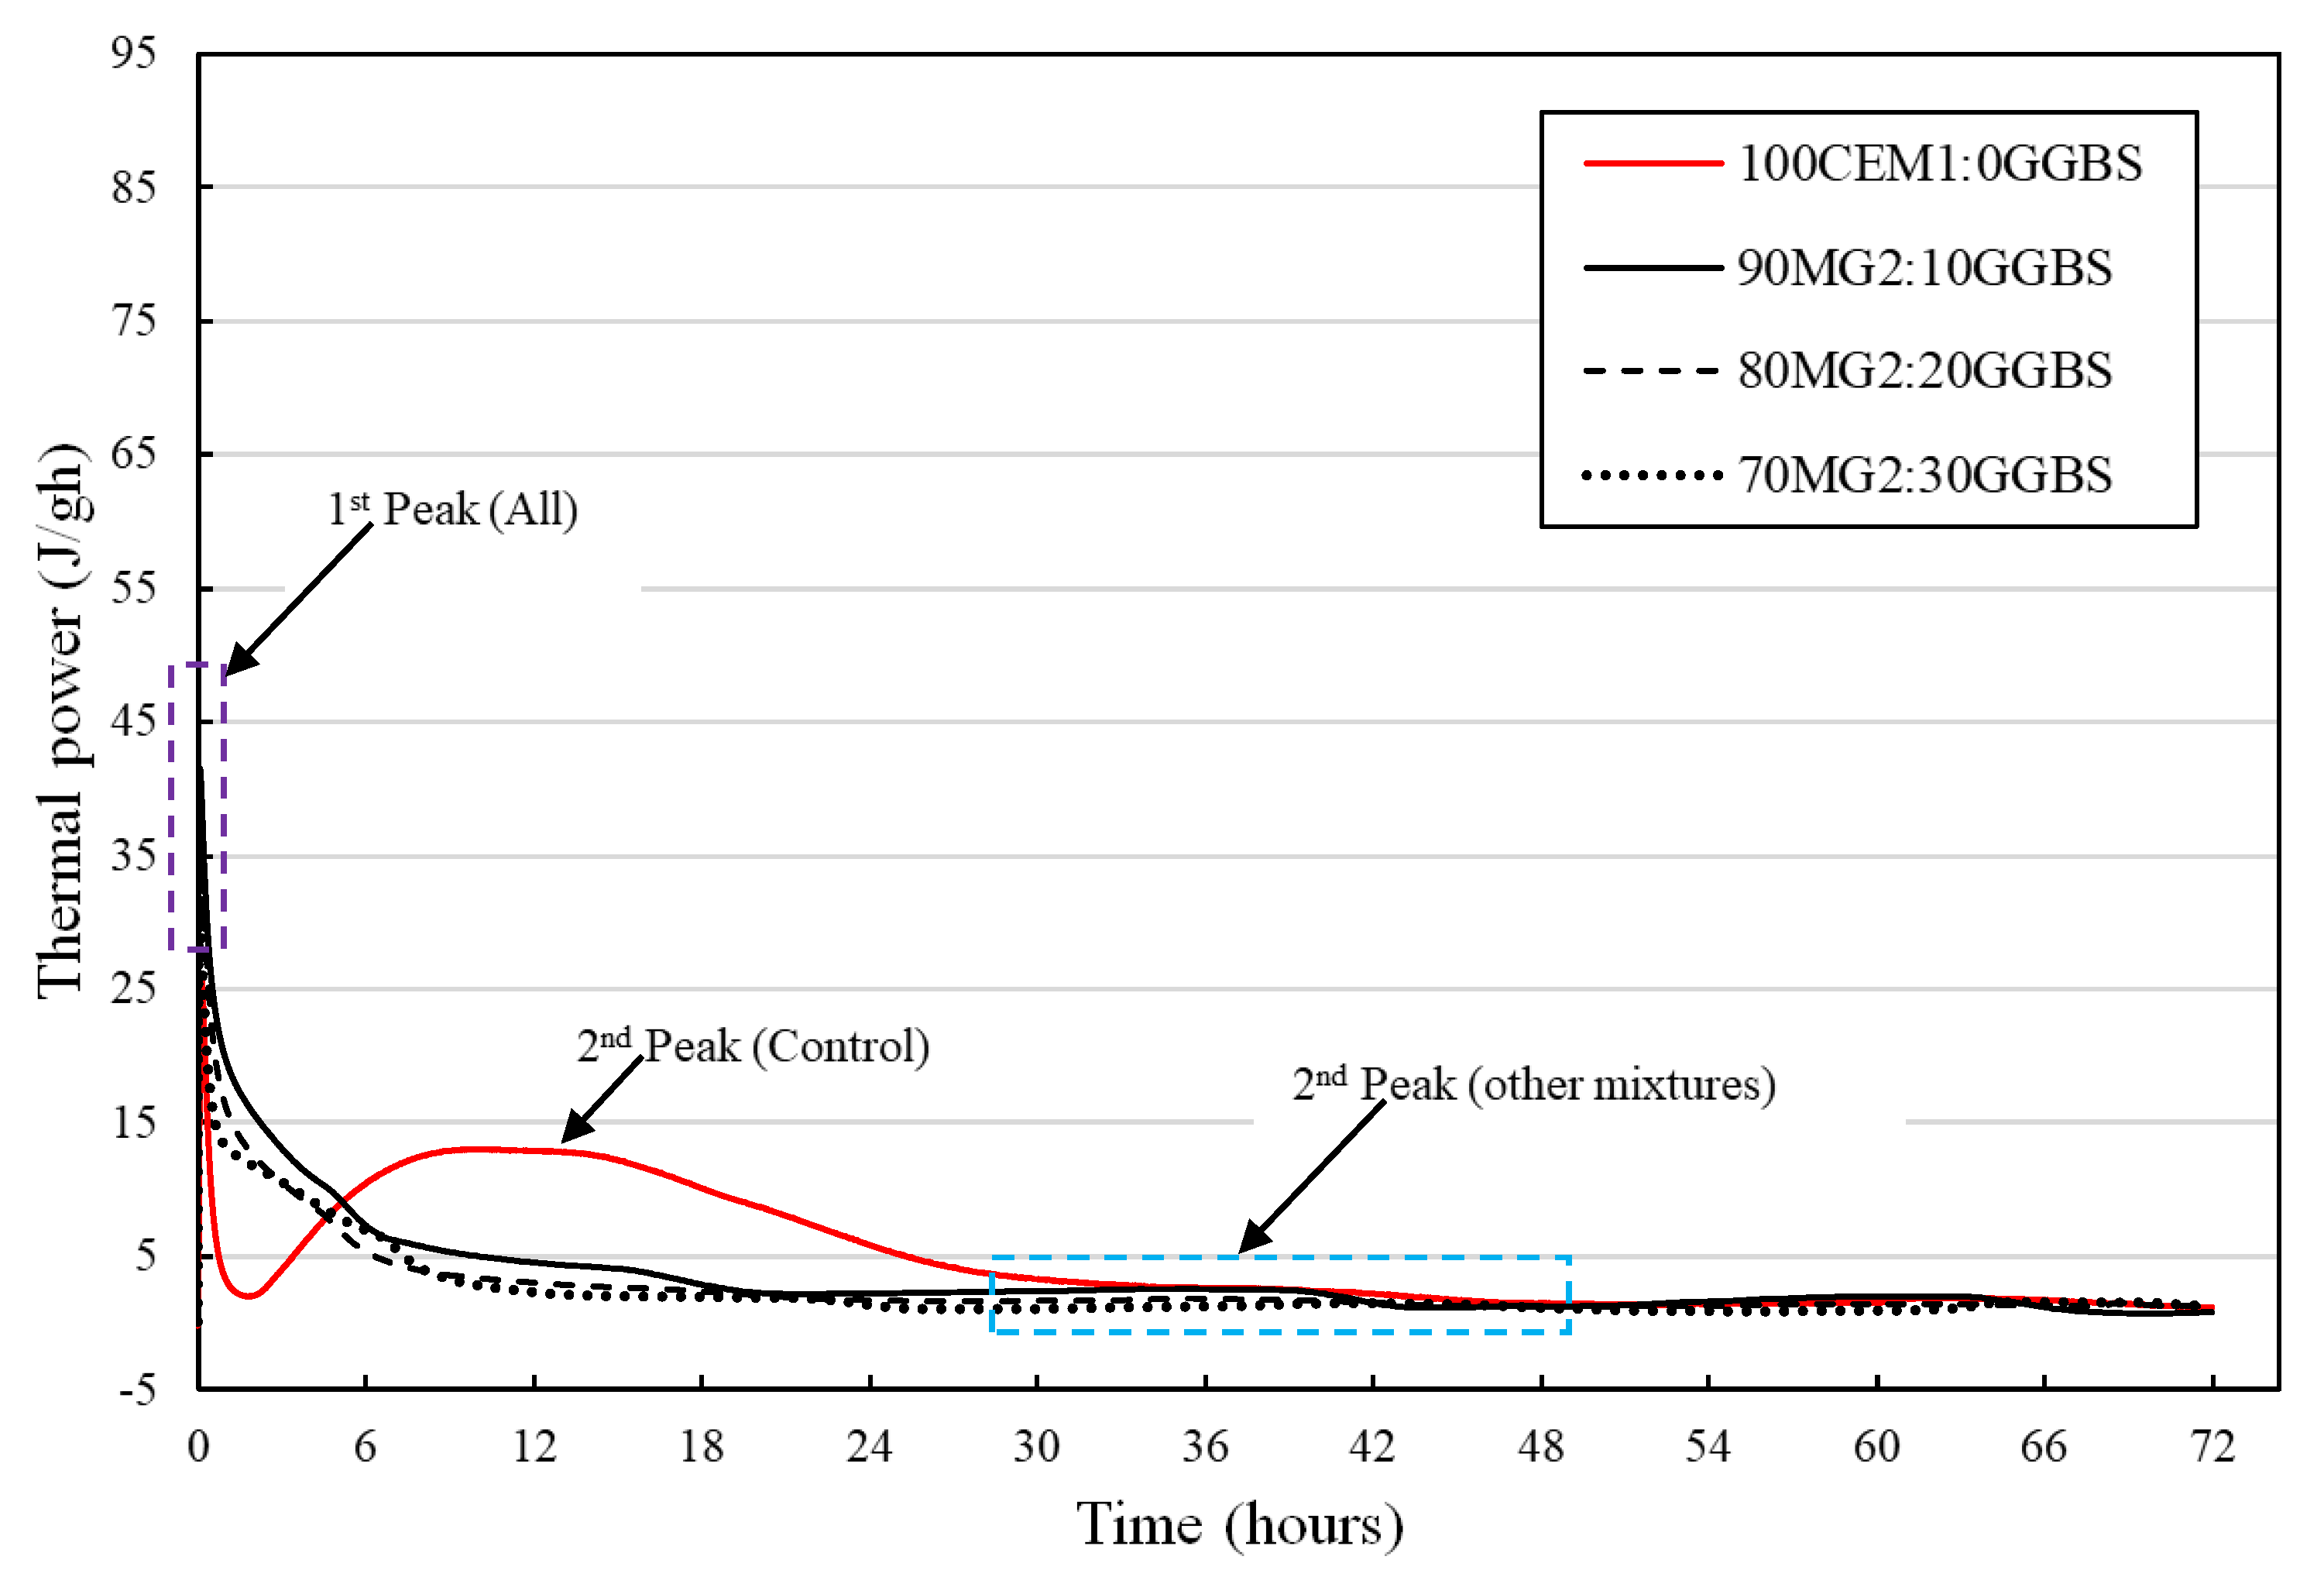
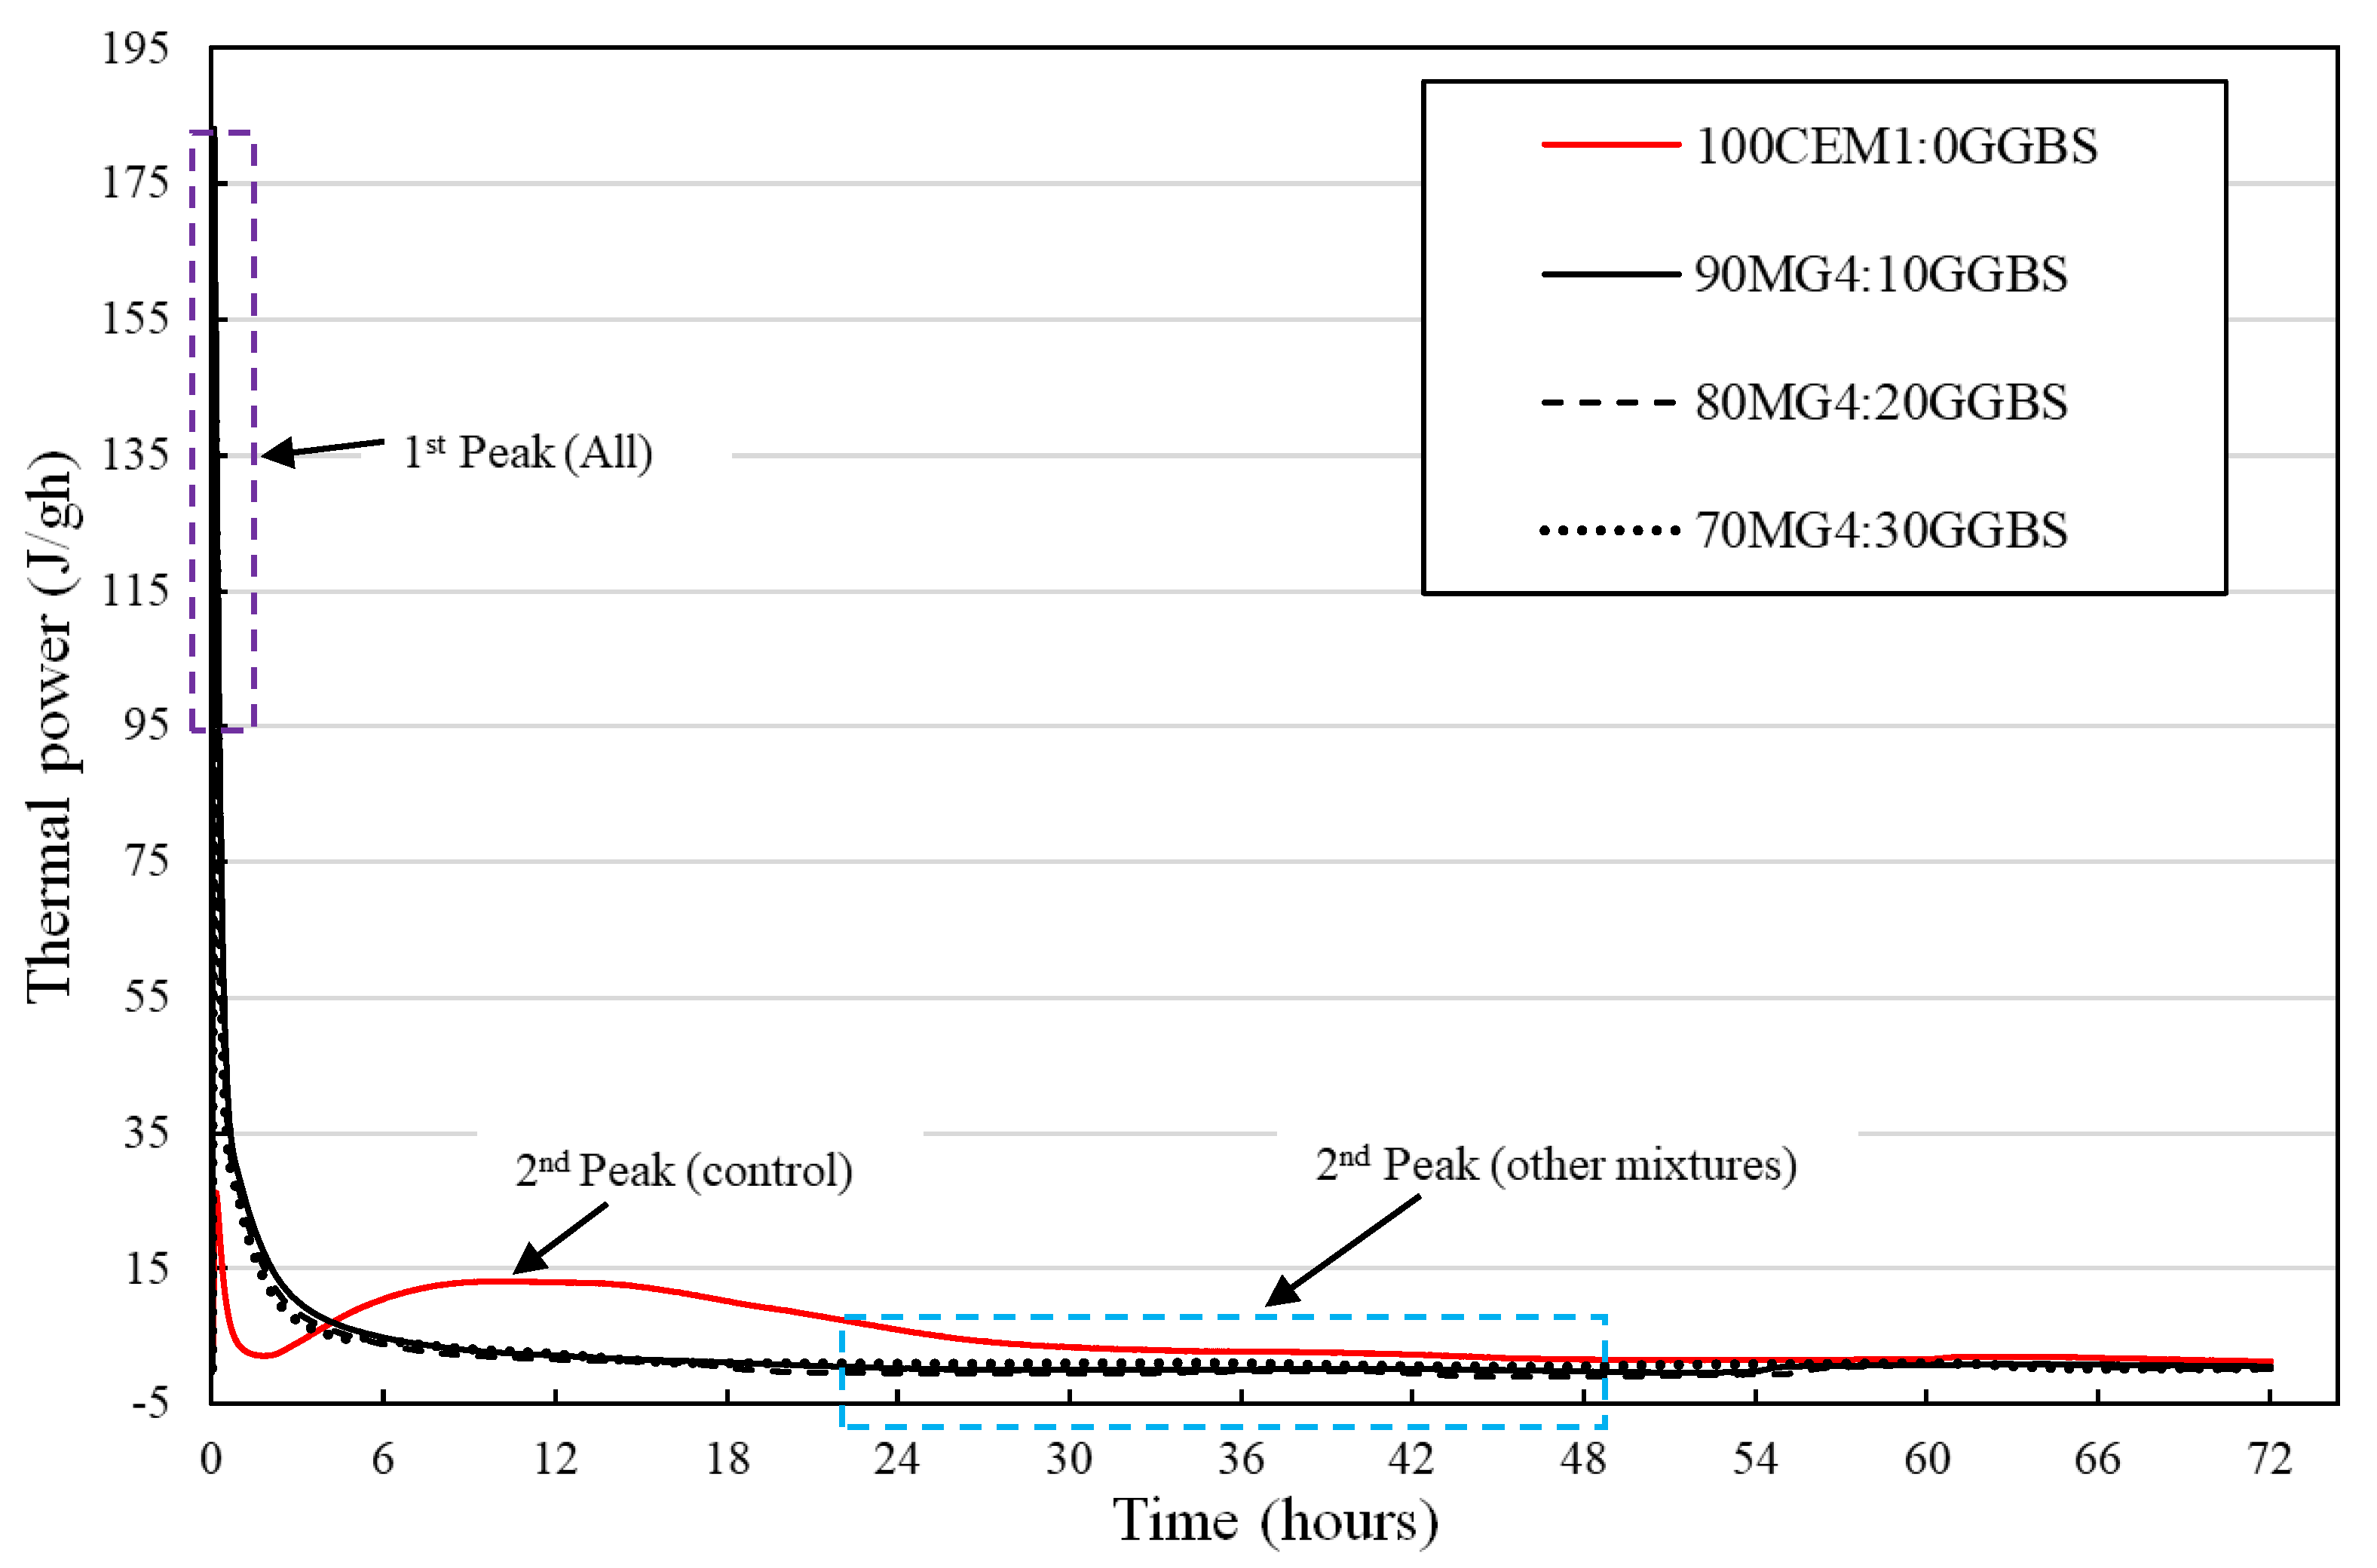
3.3. Isothermal Calorimetric Analysis

Figure 11 and Figure 12 show a summary of the evolution of the first and second thermal peaks that were obtained from the calorimetric plots in Figure 13, Figure 14, Figure 15 and Figure 16 for the various hydrated blend systems after 72 h at 25 °C. A significant evolution of thermal powers was evident in the first peak (18–184 J/gh) for all the investigated blend systems in comparison with thermal powers produced in the second peak (0–32 J/gh). The blend compositions within the MG4 blend system produced the largest intensity of first thermal powers within the range of 153–184 J/gh, while those from MG3 blend systems produced the lowest first thermal powers within the range of 18.2–21.8 J/gh. Another obvious observation was the gradual reduction in the production of thermal power for every percentage reduction in in the quantity of MgO content (90, 80, and 70 wt.%) for all the MgO waste materials (MG1, MG2, MG3, and MG4). The magnitude of thermal powers that were produced in the second peaks within the MG1 systems, were significantly higher and about 48–60% higher than the Control. The reverse was the case for the mix compositions produced from other blend systems (MG2, MG3, and MG4 systems), as their thermal powers were considerably lower (0–56%) than the control.
Figure 17 shows the calorimetric heat of hydration (HOH) peaks for the hydrated mix compositions, which were obtained from the calorimetric plots in Figure 18. Regarding the blend systems, the mix compositions that were produced from the MG1 systems produced the largest magnitude of HOH within the range of 191.2–255.3 J/g, while MG3 systems produced the lowest HOH of 42.1–64.6 J/g. A continuous trend of an increase in the production of calorimetric HOH was evident for all the hydrated mix blends. Although the control mix composition (100 wt.% CEM I) produced the maximum HOH value of 339.5 J/g, all other blend systems (MG1, MG2, MG3, and MG3) showed potential for more production of HOH.

4. Discussion

4.1. pH Investigation

pH or “potential for hydrogen” analysis is a vital parameter used within soil science to properly characterise and understand the activation levels of binder materials. It utilizes a quantitative analysis to measure the acidity or basicity/alkalinity of aqueous solutions, which essentially translates to the inherent amount of hydrogen ion/activity. The observed variation in pH for the blend compositions in MG1 blend system could be due to the low pH value of the individual MG1 waste materials, which influenced the overall pH value of each MgO:GGBS blend composition. The trend observed for MG2 and MG4 blend systems of no significant change in pH value could be attributed to the high individual pH for MG2 (12.04) and MG4 (12.95) compared with GGBS (10.20), which is suggested to have largely influenced the combined pH of each MgO:GGBS blend. Generally, the reduced pH value for the MgO waste blend systems shows a positive impact of its application as it could lead to low solubility of heavy metals within the waste materials (MgO wastes), which eliminates contamination of the environment through leaching of the cementitious binders within a stabilised product [35].
Generally, the low-pH values that were established for the MgO wastes (MG1, MG2, MG3, and MG4) compared with the control give an indication of a good binder/alkaline earth metals in acting as an activator to industrial by-products (GGBS). The alkalinity levels raised the pH of the initial hydration reaction, which is required to break the silicon dioxide bonds and facilitate a reaction to form a condensed structure [36]. In addition, this is a good attribute (low pH) for a binder system, to easily flocculate cations within the interlayer of a clay structure and improved overall binder–clay compatibility [37].

4.2. Thermal Investigation

The thermal performance of cement and cementitious systems is a key requirement for understanding their behaviour after undergoing a TG/DTG analysis, which primarily measures the change in weight (individual and total weight loss), identifies various hydration phases (endothermic peaks), and provides an indication to the thermal stability (dehydroxylation, decarbonation, dehydration, decomposition, melting of phase transition) of the investigated blend compositions [20]. A summary of the identified cementitious phases in the investigated un-hydrated MgO blend systems are shown in Table 4. This was based on the decomposition of the expected crystalline/amorphous hydration phases from the existing literature. Generally, the observed weight losses between temperature peaks of 0 and 600 °C are attributed to water loss, while those above 600 °C are primarily associated with the release of carbon dioxide or decarboxylation [20]. The cementitious phases at varying peak points (temperature) are suggested as brucite, gypsum (dihydrate and anhydrite phase), magnesium silicate hydrate (M-S-H) gel, calcium silicate hydrate (C-S-H) gel, calcium hydroxide, calcium carbonate (calcite), magnesite, and hydrotalcite [20,38,39].
The endothermic peak points 1 for blend systems MG1, MG2, and MG3 at 101–105 °C in this study is in line with the findings of Sonat and Unluer [7], who attributed the water loss to the dehydration of loose or poorly bound hydroxyl groups within the element structure. Klein and Hurlbut [40] reported that gypsum is composed of parallel layers of (SO4)2+ groups in its structure that are strongly bonded to (Ca2+) while the parallel layers are bound together by weak water molecules. This explains the decomposition of gypsum at different forms of calcium sulphate dihydrate (CaSO4·2H2O) to calcium sulphate anhydrite (CaSO4) between 85 to 400 °C [38,39,41], which is in line with the observed endothermic peaks at location 1 and 2 for MG4 blend system at 105 to 371 °C. The observed peak attributed to the formation of brucite (Mg(OH)2) was mainly due to the hydration of magnesium oxide and in the context of thermal analysis, and it occurs when there is the development of a peak within the temperature range of 300 to 450 °C [7]. Bernard et al. [35] attributed this peak as the dihydroxylation of magnesium hydroxyl groups (Mg-OH) present within the blend mixtures. The presence of brucite also gives a positive indication of the potential for the formation of cementitious hydrates (M-S-H gel or hydrotalcite) from the investigated alternative binder system [42,43]. With reference to other identified hydrated cementitious phases, calcium carbonate decomposed further at high temperatures between 642–782 °C for the analysed blended mixtures (Table 4). This is in line with the findings of Song et al. [44] and Collier [39] on the temperature ranges of 650–740, 600–800, and 650–900 °C, respectively, for a complete decomposition of calcium to form calcium carbonate (calcite). This later-stage decomposition can also be attributed to a carbonation effect with respect to the decomposition of calcite present within the blend compositions [45].
The weight loss that was observed is one of the vital parameters for the current binder optimisation process so that the successful binder system will not have a negative impact (shrinkage tendency) on the overall stability of the blend compositions and robustness of the stabilised product that it was applied to. A possible justification for this individual weight loss could be due to the high amount of loss of ignition of carbon compounds for each MgO waste material (L.O.I from XRF analysis detailing the material oxide compositions in Table 1). In addition, the reduction in the magnitude of endothermic peaks for the blend compositions in each blend system (Figure 10) could be attributed to the increased amount of GGBS content in each mix composition with every gradual reduction in the quantity of MgO waste (90, 80, and 70 wt.%), which possesses stronger crystalline bonds within its molecular structure compared with the binder materials (MgO). Another possible justification could also be attributed to the strength capacity of bonds between the structural layer and hydroxyl group of the hydrated cementitious compound in the blend composition (brucite) [35,44].

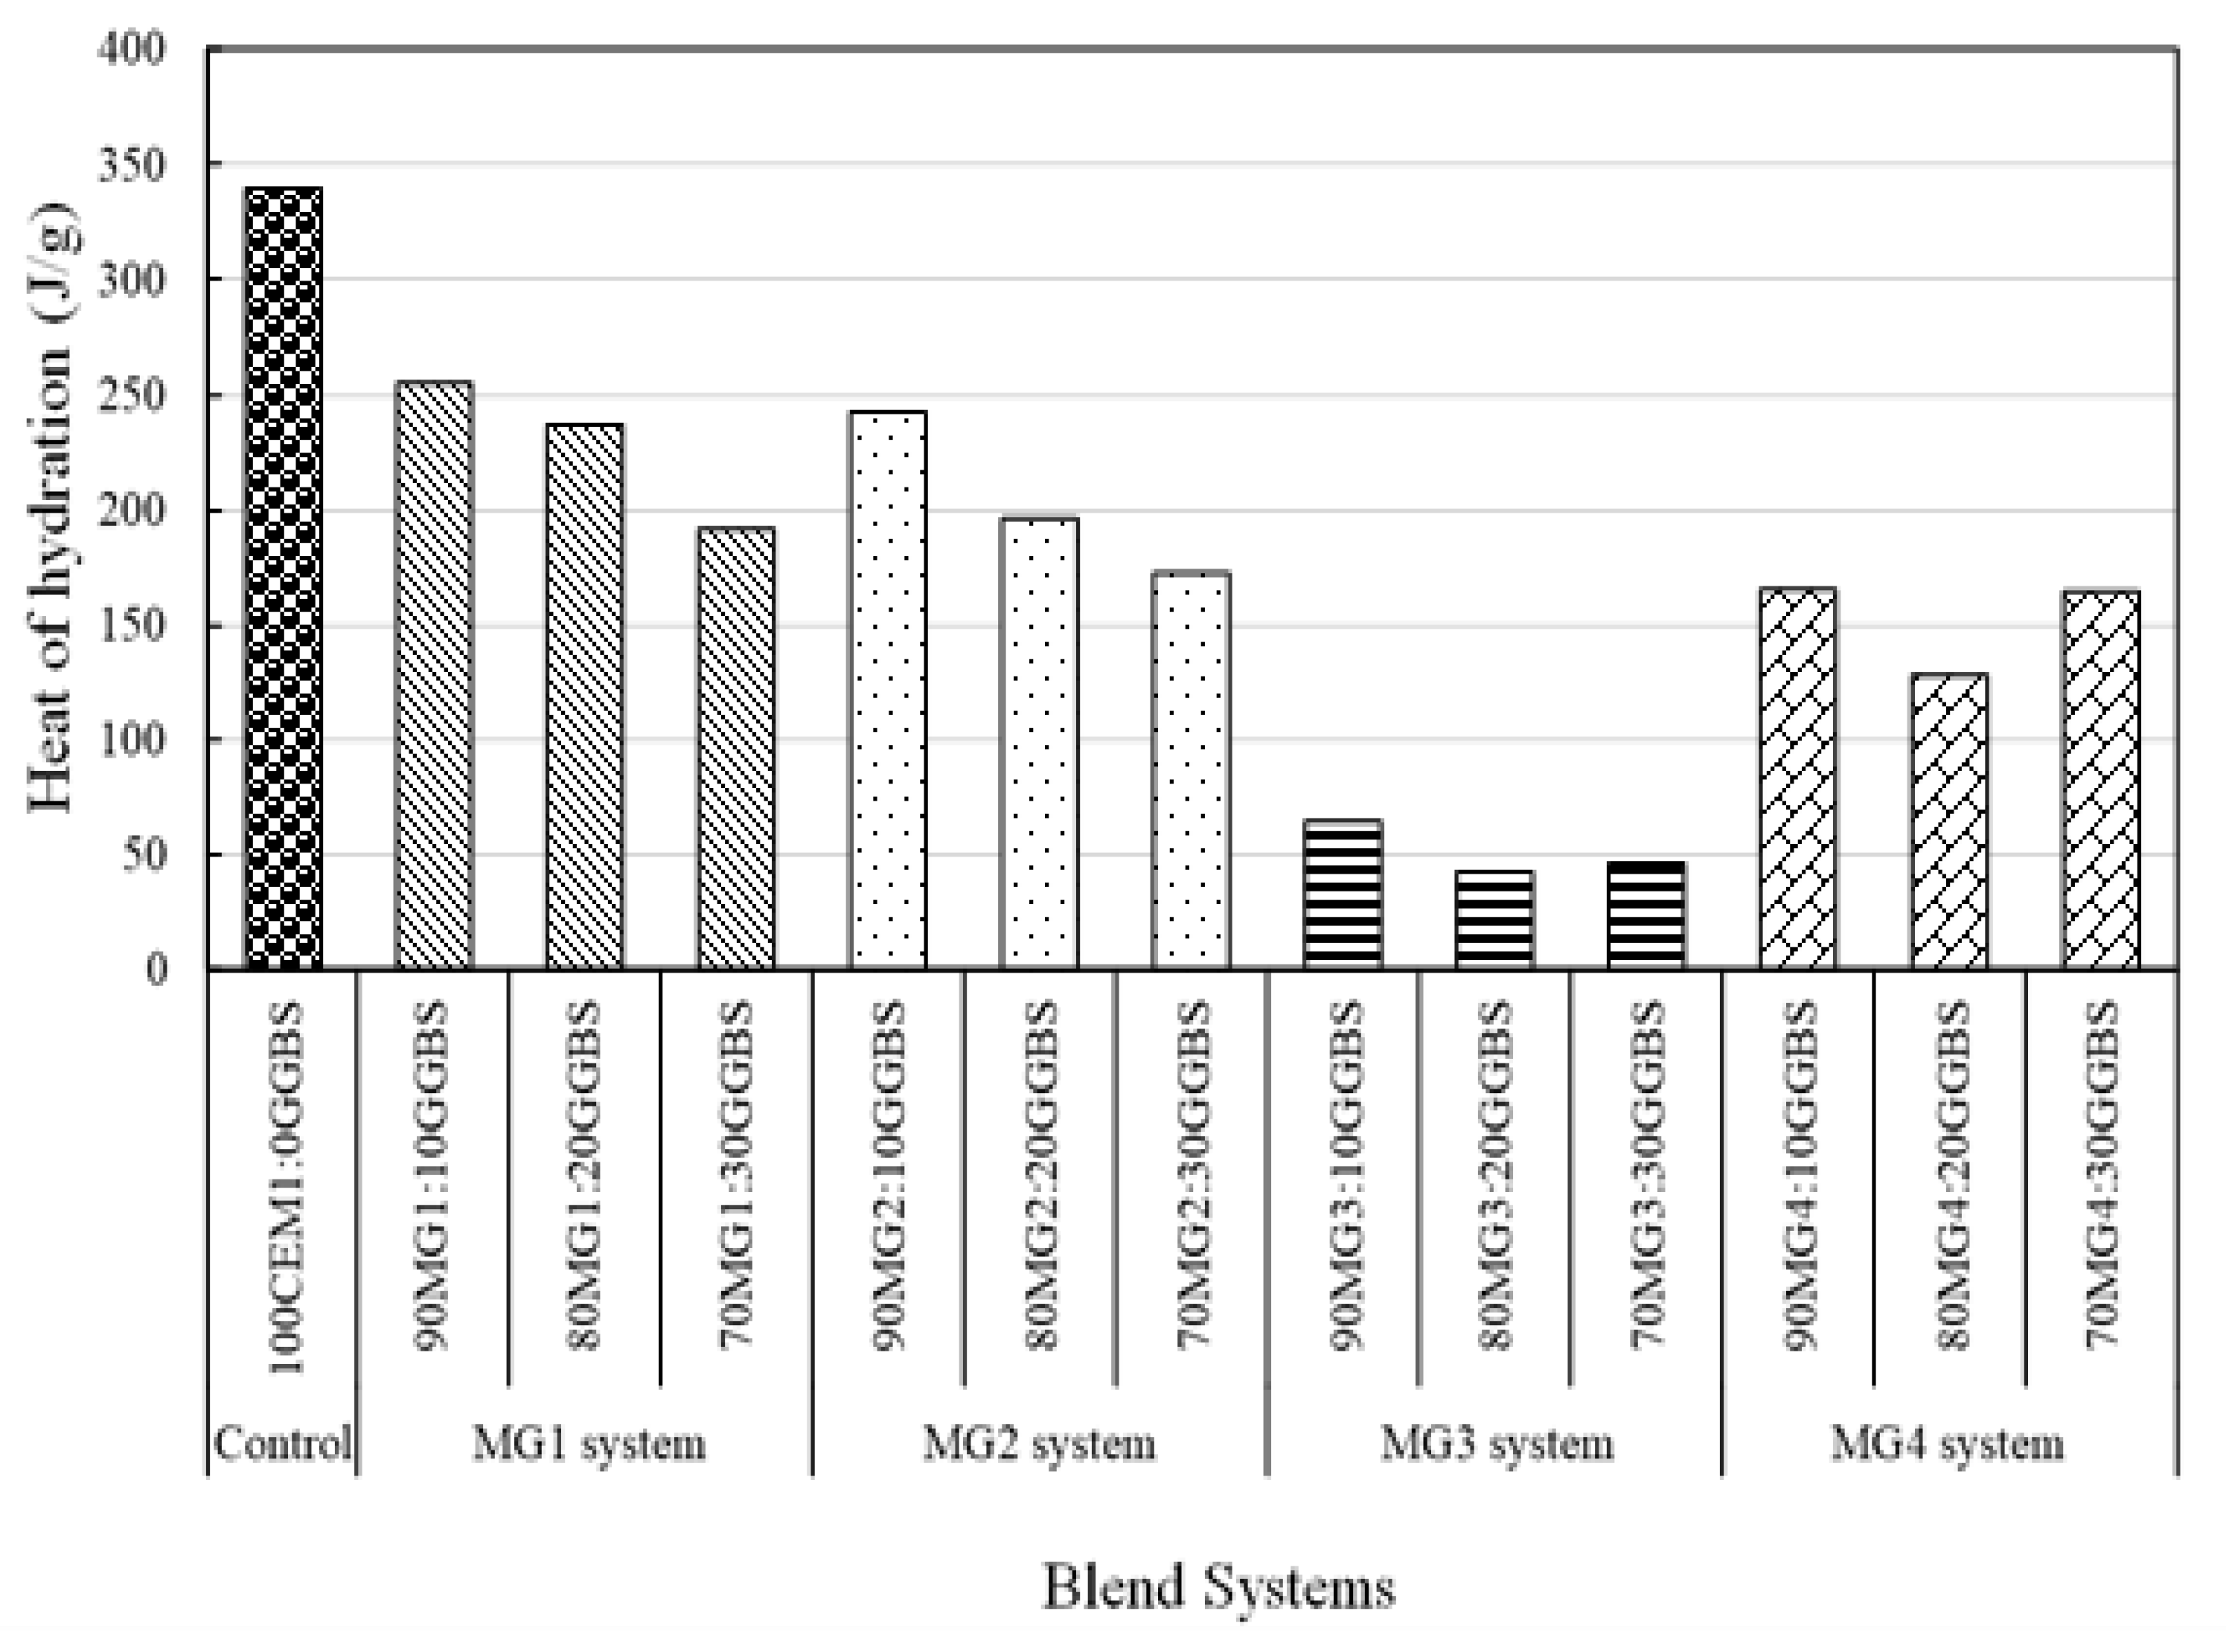
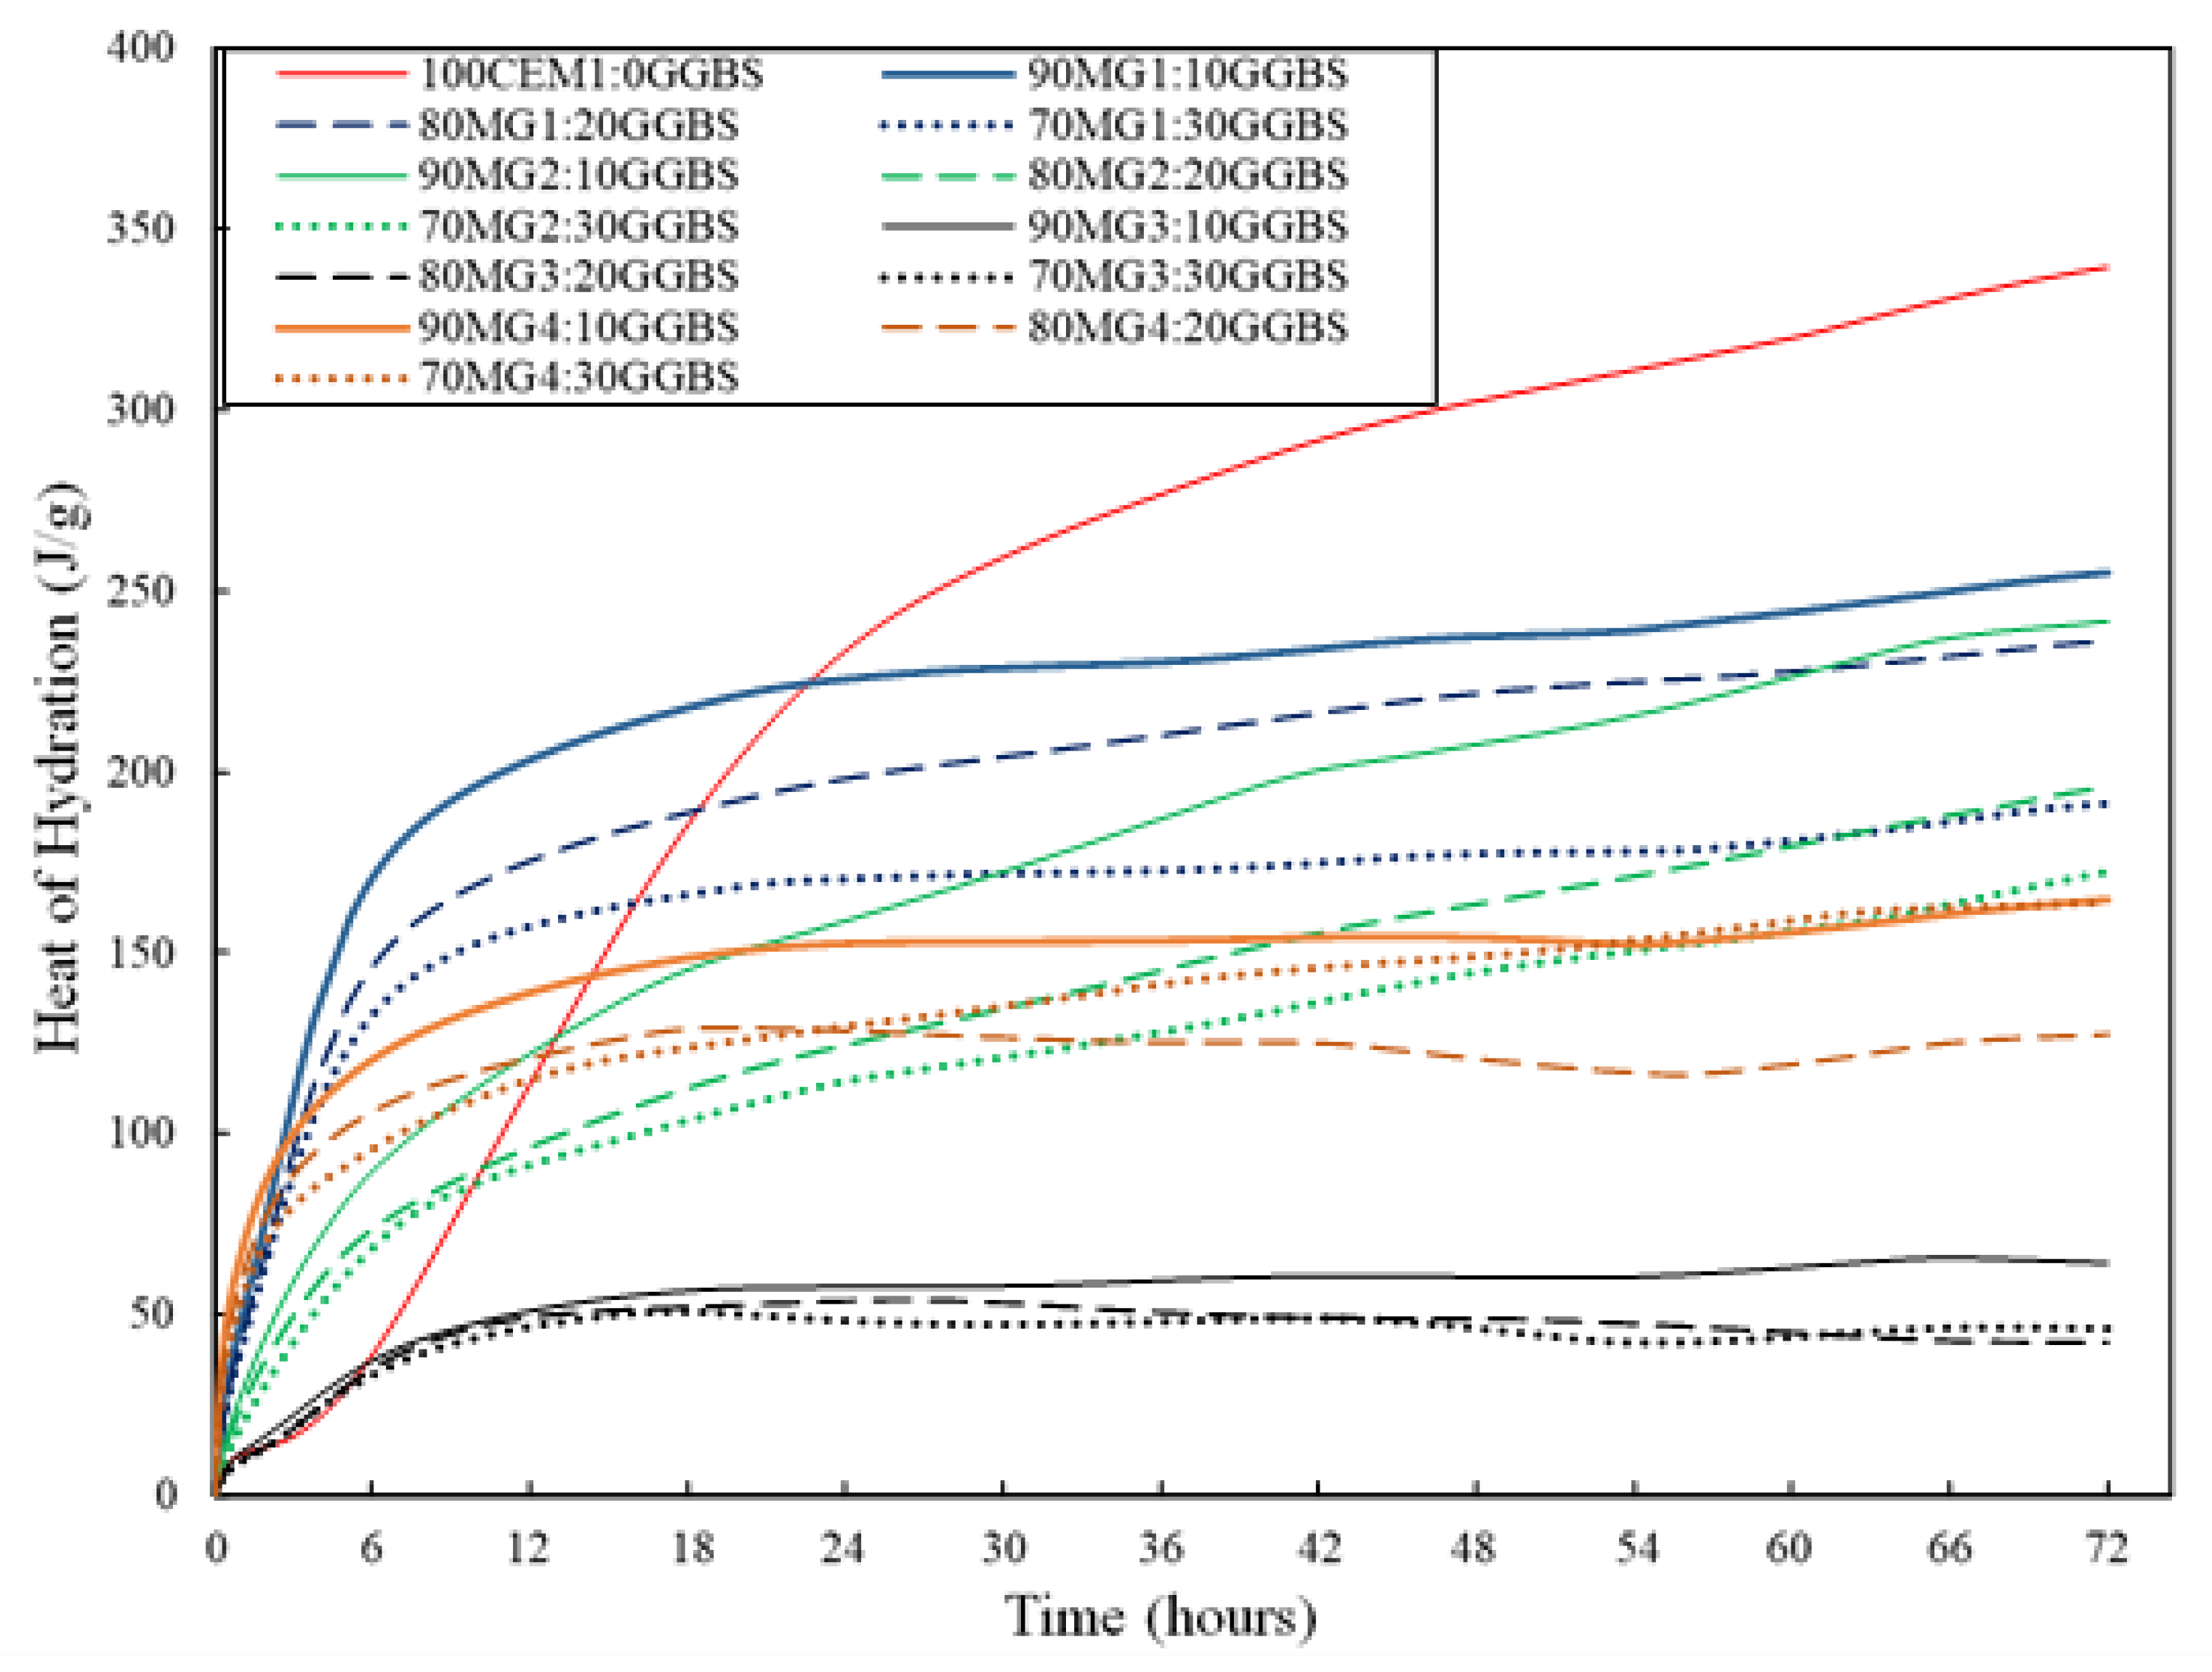
4.3. Isothermal Calorimetric Investigation

The hydration reaction for hydrated blended mixtures with MgO can be explained using the simple hydration kinetics reaction, as a function of the generated thermal power (J/gh) and heat of hydration (J/g) [18]. Generally, the activation process of GGBS by reactive MgO begins with an initial destruction of the bonds within the GGBS composition e.g., Mg–O, Ca–O, Si–O–Si, Al–O–Si, and Al–O–Al, which is subsequently followed by the development of a Si–Al inter-surface layer over the grains of the GGBS material. Thereafter, Mg2+ either reacts with Si–O or Al–O to produce a cementing hydrate mainly as C-S-H gel and M-S-H gel or hydrotalcite/magnesium aluminate hydrate—M-A-H [5,15,46]. Therefore, an overall hydration reaction for a MgO-waste-activated GGBS composition can be summarized in Equation (1).
MgO + ( CaO MgO Al 2 O 3 SiO 2 )   GGBS + H 2 O C S H + M S H + M A H ( Ht ) + C A S H
The rapid increase in thermal production (1st peak) at the initial reaction stages for all the analysed MgO-waste:GGBS blended mixtures can be attributed to the combined exothermic reaction experienced during the hydration of calcium oxide (CaO) and magnesium oxide (MgO) present within their individual composition. This is in line with the research by Amaral et al. [47], who suggested that Mg2+ cations and anions (Cl and SO42+) have an effect on the thermodynamics and kinetics of a hydration reaction. Therefore, the heat that was experienced with respect to MgO-waste blended mixtures results from the hydration of MgO (Equation (2)), which readily dissolves upon contact with water to mostly form brucite [48,49].
M g O + H 2 O M g ( O H ) 2 , Δ H = 81.02   kJ   mol 1
The extent of thermal power production in the MgO waste:GGBS and CEM I binder systems largely depends on the combined effects of heat production from the CaO and MgO with its associated CaO in the GGBS content. Therefore, the combined presence of CaO within MgO:GGBS composition gives rise to the presence of an increased amount of tricalcium aluminate (C3A), which is responsible for the initial reaction stage [21,50,51,52]. Some researchers also suggested that the initial sudden thermal power production can also be caused by ettringite formation, due to the hydration reaction that occurs during the complete decomposition of gypsum present within the developed blended mixtures from calcium sulphate hemihydrate (CaSO4·1/2H2O) to calcium sulphate dihydrate (CaSO4·2H2O) phase [53]. This phenomenon well explains the high initial thermal peak that was observed for blended mixtures with MG4, which is composed of high levels of sulfur trioxide (SO3) in comparison with the control and other MgO waste materials (see Table 1).
The gradual reduction in the first thermal peaks (thermal power generation) for every percentage increase in replacement levels of PC with MgO waste materials in all the blend systems could be attributed to the large replacement levels of PC (70, 80, and 90 wt.%), which is expected to increase the amount of CaO that is responsible for the initial exothermic reaction resulting in the formation of ettringite, cracks, false strength, and flash setting of the hydrated product [21]. This reduction phenomenon could also be attributed to the reduction in the amount of MgO present within the blended mixtures. This is in line with the research by Amaral et al. [47] who suggested that Mg2+ cations and anions (Cl and SO42+) have an effect on the thermodynamics and kinetics of a hydration reaction. All the blend mixtures experienced an induction period that is more pronounced in MG1 and MG3 binder systems (Figure 13, Figure 14, Figure 15 and Figure 16) in which the duration was largely dependent on each material of the blended mixture and binder system. Taylor et al. [54] attributed this occurrence that varies across the blended material as a period of slow hydration reaction with a low production of thermal power, where the protective layer that was developed over the particles of the tricalcium silicate (C3S) in the initial exothermic/hydration reaction was later destroyed by either phase formation, pH, amount of Ca2+, or ageing (Figure 19). Additionally, the duration of induction period varies across the blended material. It is worth knowing that the occurrence of the second exothermic peaks was mainly due to the further hydration reaction of the released C3S after the initial reaction and induction stage, resulting in the production of more exothermic thermal powers for increased hydration [21]. However, the produced peak and time for complete hydration is material-dependent.
A continuous period of slow reaction was observed after the second thermal power peak for all the blended mixtures (Figure 13, Figure 14, Figure 15 and Figure 16). This was where the produced thermal powers began to level off with further hydration reaction between MgO and the silica/alumina present within the blended mixture composition. The further hydration reaction was quite slow for all the blend systems and can be attributed to the high magnesium oxide content (Mg2+ cations and anions), which possesses a retarding effect on the thermodynamics and kinetics of the hydration reaction [47].
Generally, the continuous trend of increase in the production of calorimetric HOH for the MgO waste:GGBS blends as a result of increased hydration could be attributed to the presence of pozzolanic materials within their compositions, which is responsible for the generation of more HOH at later stages [18]. In addition, this phenomenon could be attributed to the fine particles of GGBS that are required for accelerated hydration reaction kinetics by MgO to create more heterogeneous nucleation sites and continuous production of the hydration compound—M-S-H gel [56]. The maximum HOH experienced by blended mixtures with MG1 could be a result of the high reactivity levels of MG1 (type of MgO) used compared to others. However, the fall in calorimetric HOH that was experienced by some of the blended mixtures could be the exhaustion of the activator present within the mixture for continuous hydration reaction process and the reduced amount of water present within the mix, resulting in delayed hydration reaction kinetics [57]. Hence, the mix compositions within the MG1 and MG2 binder system exhibited potential for increased generation of HOH due to the superior performance from other identified blend system (MG3 and MG4).

5. Conclusions

The current study investigated the application of a sustainable and economically viable thermo-chemical approach using a set of experimental regimes as a tool for binder system optimization. This approach enabled a quick determination of the best performing binder systems before any civil engineering application (soil stabilisation, mortar, concrete, etc.). Therefore, the following conclusions can be drawn based on the outcomes of the study:
1
The thermochemical optimisation approach revealed the potentials of MgO waste materials to effectively replace PC up to 90 wt.% within a MgO-GGBS cementitious system and can describe the chemical and thermal performance of the investigated MgO:GGBS compositions with a set design criteria well.
2
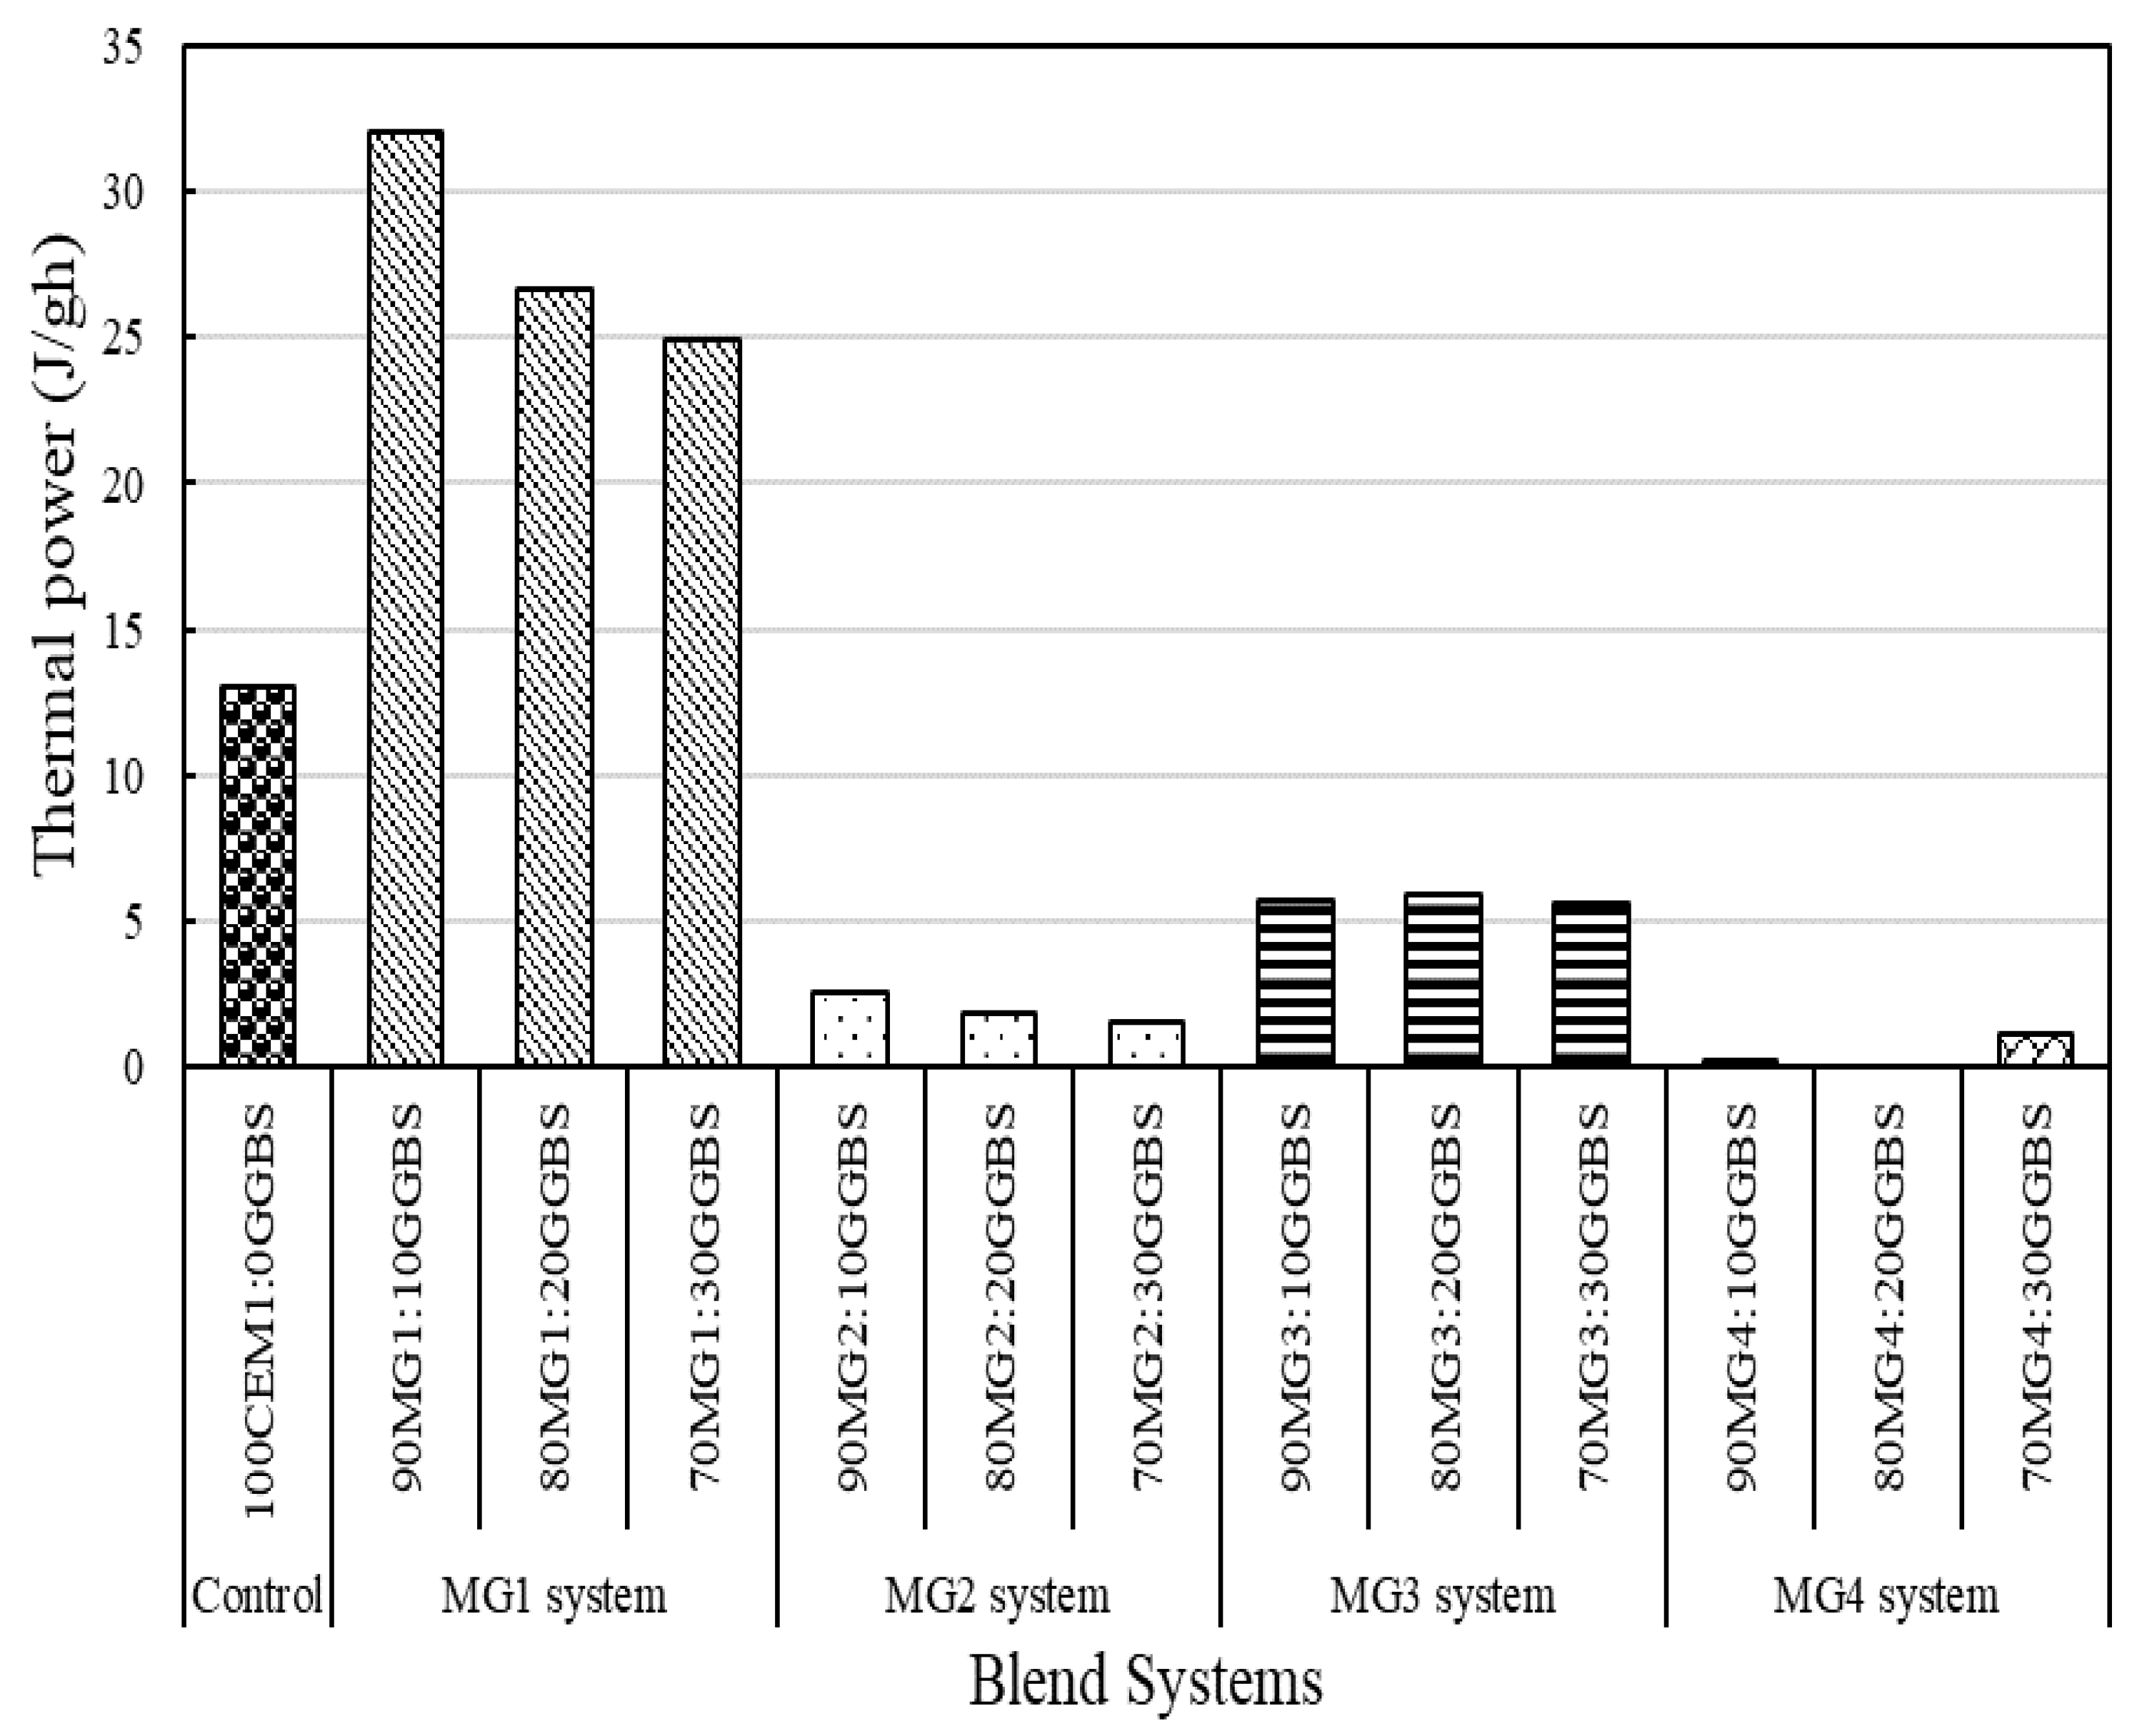
MG1 binder systems were established as the best-performing binder system based on the superior performance of its mix compositions with respect to the set criteria (low pH, increased levels of heat of hydration, and considerable thermal stability (weight loss) after thermal exposure).
3
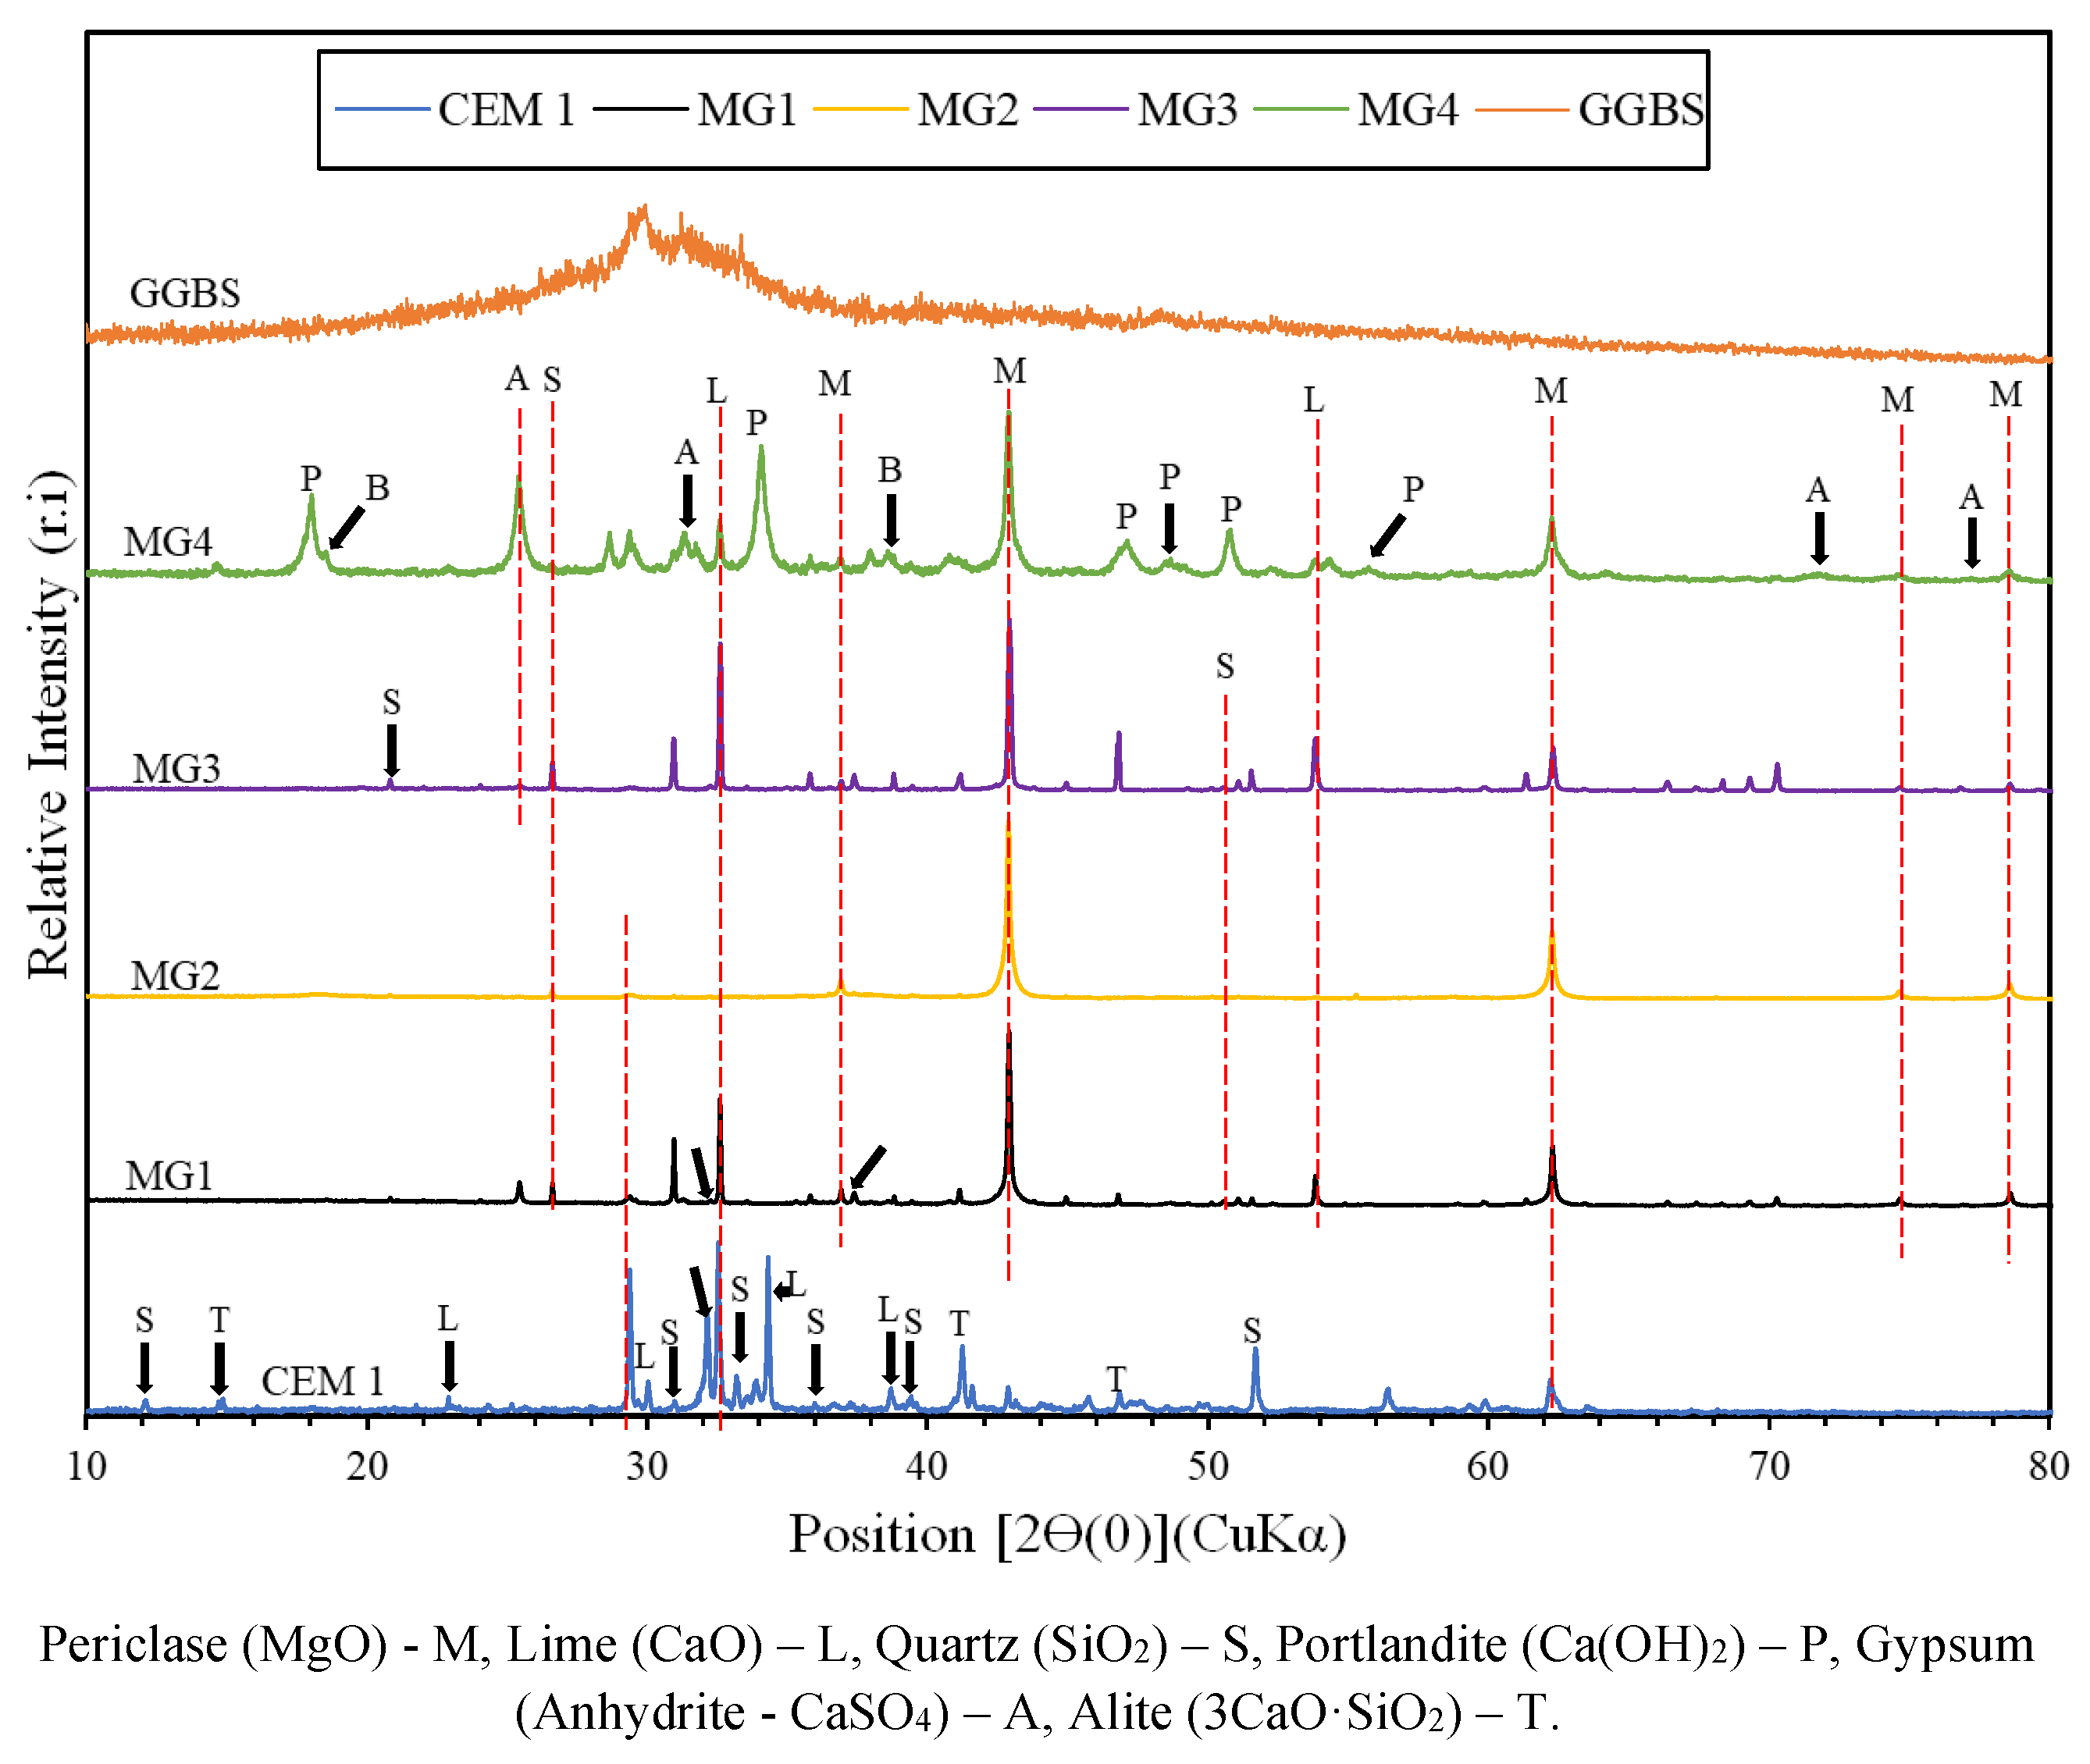
The thermal investigation (TG/DTG analysis) established that blend compositions within the MG1 binder system developed the necessary cementitious endothermic peaks (loose water, gypsum, brucite, magnesite, and calcite) and demonstrated satisfactory thermal stability that will be beneficial when employed for practical applications (pavement subgrade) in regions with high temperature.
4
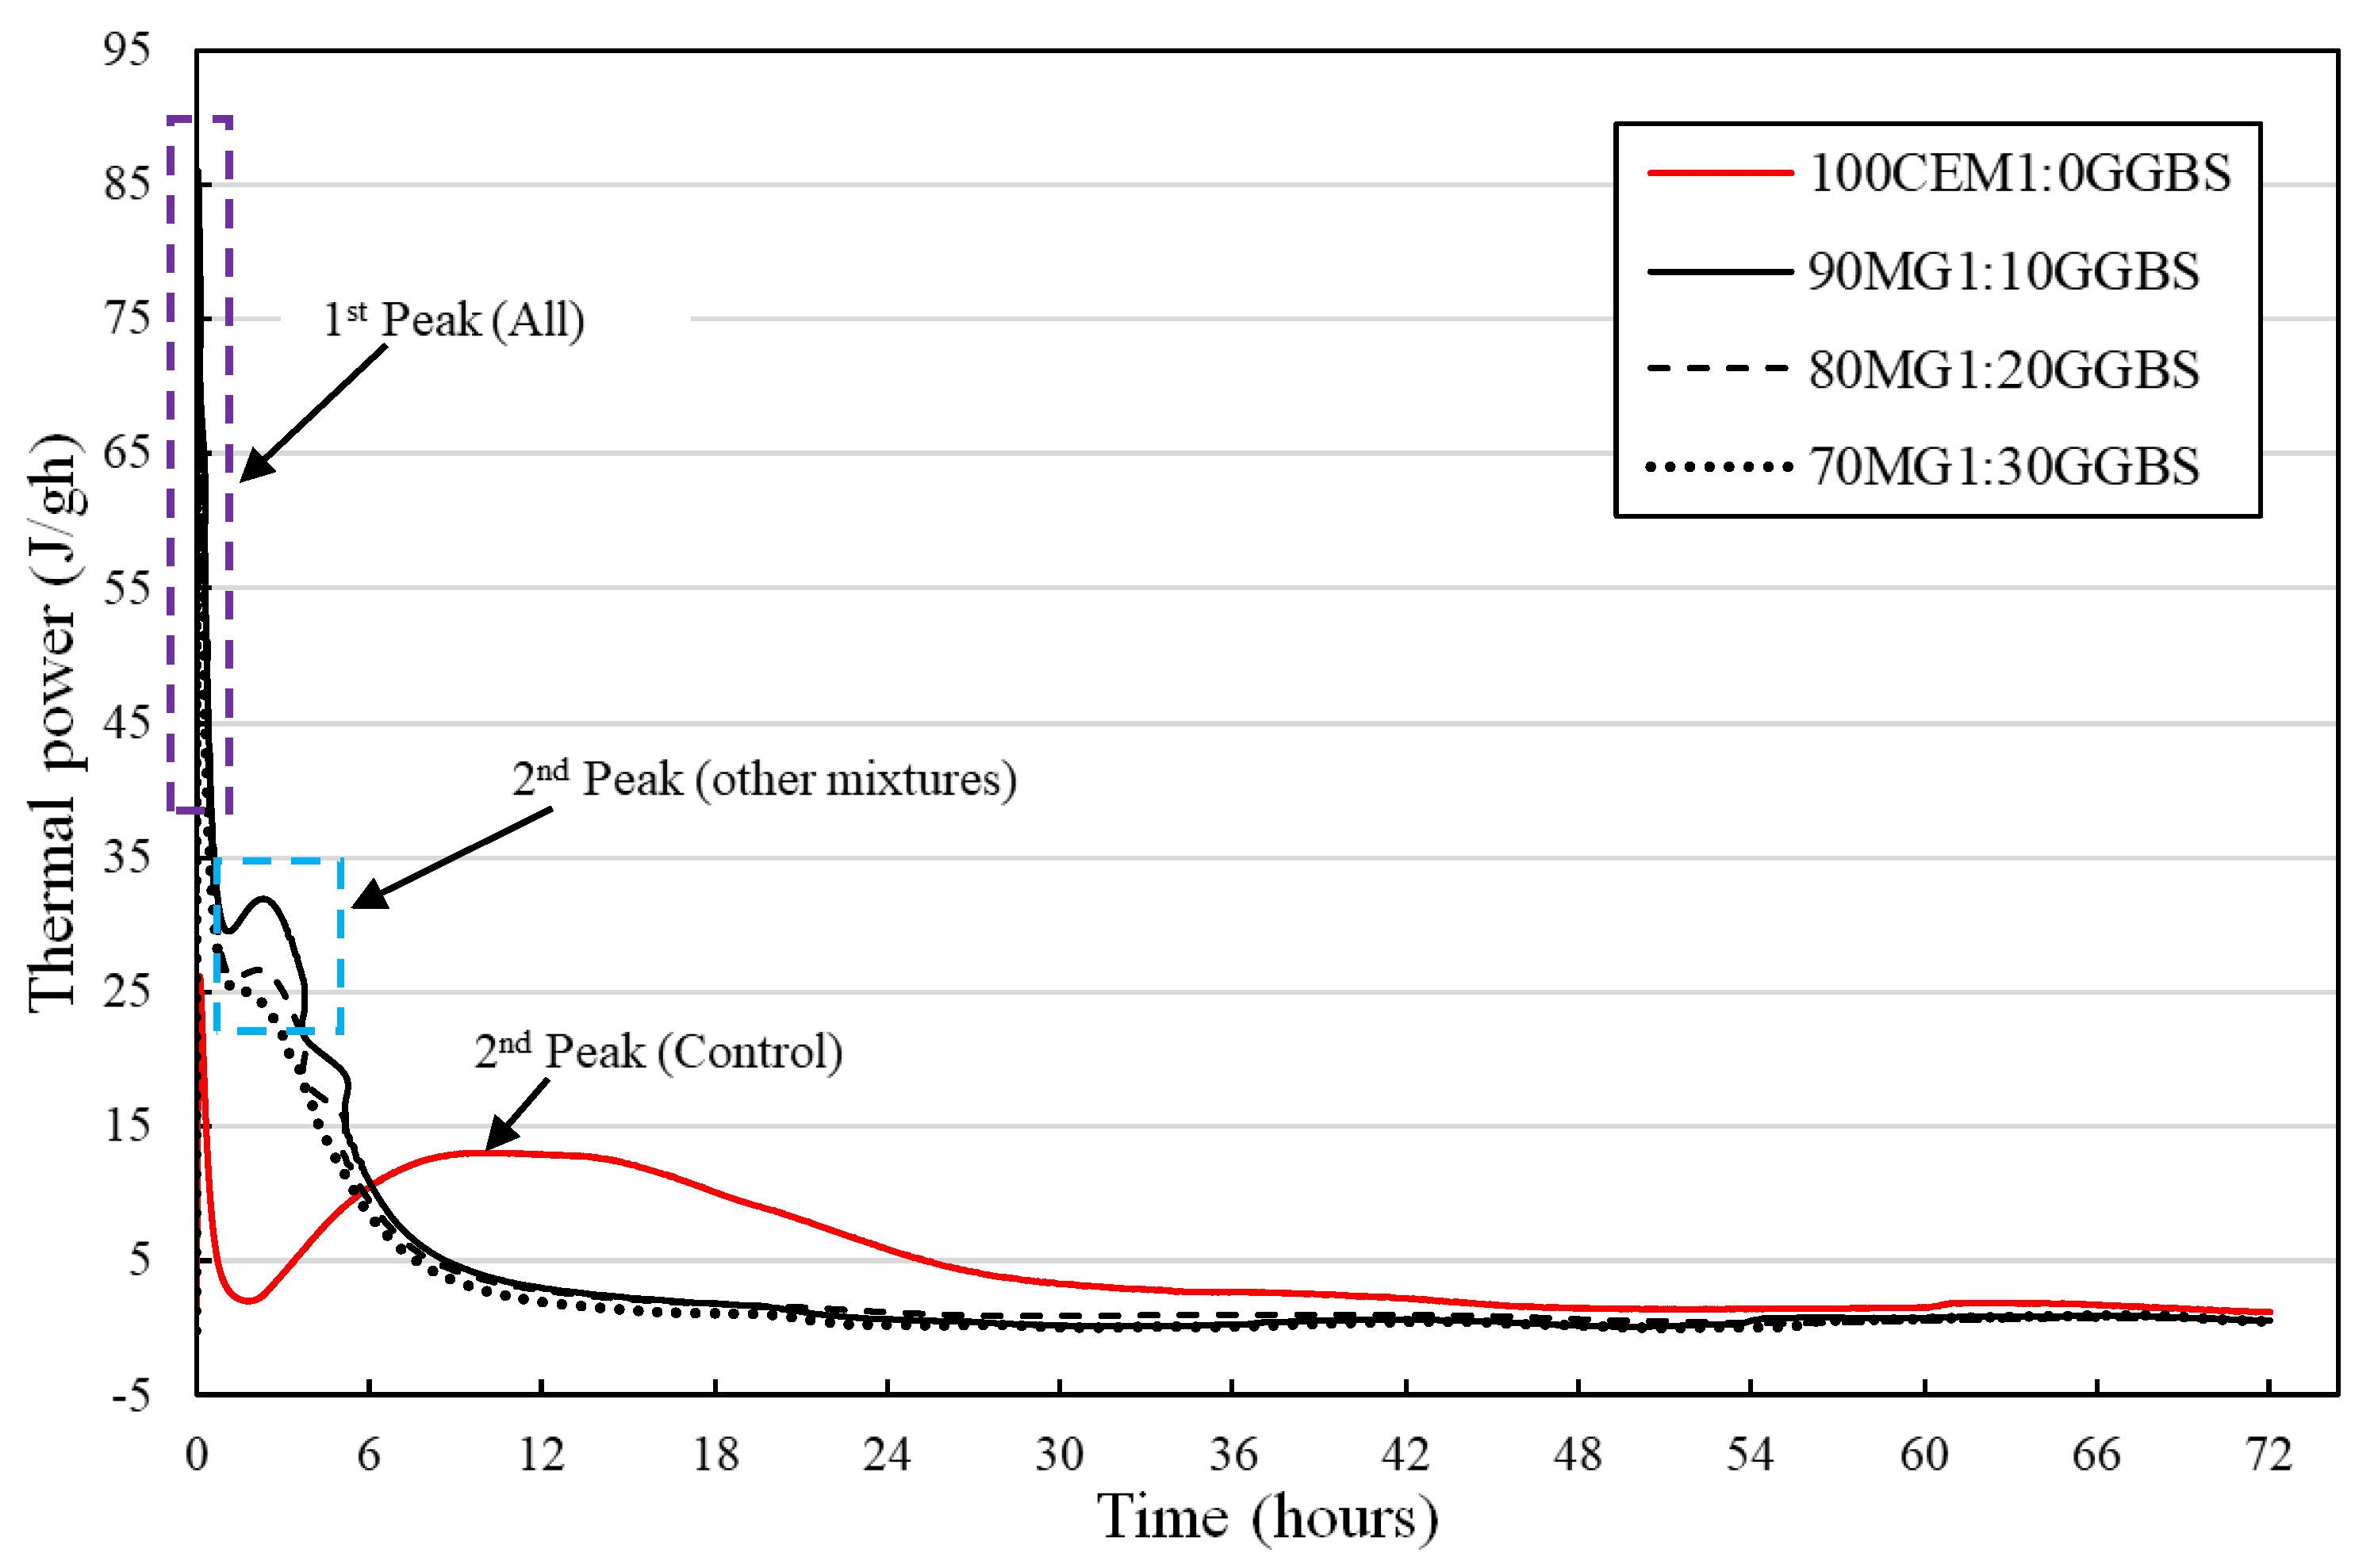
The reduction in the evolution of the first exothermic peak immediately after the commencement of the initial hydration reaction of the various MgO:GGBS formulations except MG4 blend systems shows their potential for the reduction of the production of initial ettringite formation, cracking, false strength, and flash setting of the hydrated blend system attributed to the first exothermic peak for in situ applications (mortar, concrete, soil stabilization, etc.).
5
The MgO:GGBS blends resulted in reduced pH levels compared with the control due to the reduced individual pH levels of the blend components (MgO and GGBS). However, MG4 with high sulphate contents and some levels of Ca could not be used in stabilising soils with sulphate contents due to the potential of forming the hydration compound (ettringite), which upon further hydration could result in swelling of the stabilised product.
Further experimental investigations are suggested for binder optimisation purposes, which could further reduce the scope of the experimental regime, give more insight into the chemical performance of the investigated material, and produce a rapid delivery of cementitious binder optimisation results. However, the main limitation to this thermochemical approach is largely due to human expertise at carrying out the various experimental tests and the surrounding temperature that could impact on the thermodynamics of the hydration reaction in the isothermal calorimetric analysis.

Author Contributions

Conceptualization, B.A., J.K. and J.O.; methodology, B.A.; validation, B.A., J.K. and J.O.; formal analysis, B.A.; investigation, B.A.; writing—original draft preparation, B.A.; writing—review and editing, J.K. and J.O.; visualization, B.A.; supervision, J.K. and J.O.; project administration, B.A. All authors have read and agreed to the published version of the manuscript.

Funding

This research received no external funding.

Institutional Review Board Statement

Not applicable.

Informed Consent Statement

Not applicable.

Data Availability Statement

Not applicable.

Conflicts of Interest

The authors declare no conflict of interest.

References

  1. Yi, Y.; Gu, L.; Liu, S. Microstructural and mechanical properties of marine soft clay stabilized by lime-activated ground granulated blastfurnace slag. Appl. Clay Sci. 2015, 103, 71–76. [Google Scholar] [CrossRef]
  2. Yi, Y.; Gu, L.; Liu, S.; Jin, F. Magnesia reactivity on activating efficacy for ground granulated blastfurnace slag for soft clay stabilisation. Appl. Clay Sci. 2016, 126, 57–62. [Google Scholar] [CrossRef]
  3. Seco, A.; Miqueleiz, L.; Prieto, E.; Marcelino-Sádaba, S.; García, B.; Urmeneta, P. Sulfate soils stabilization with magnesium-based binders. Appl. Clay Sci. 2017, 135, 457–464. [Google Scholar] [CrossRef]
  4. Li, W.; Ni, P.; Yi, Y. Comparison of reactive magnesia, quick lime, and ordinary Portland cement for stabilization/solidification of heavy metal-contaminated soils. Sci. Total. Environ. 2019, 671, 741–753. [Google Scholar] [CrossRef] [PubMed]
  5. Li, W.; Yi, Y.; Puppala, A.J. Suppressing Ettringite-Induced Swelling of Gypseous Soil by Using Magnesia-Activated Ground Granulated Blast-Furnace Slag. J. Geotech. Geoenviron. Eng. 2020, 146, 6020008. [Google Scholar] [CrossRef]
  6. Qomi, M.J.A.; Krakowiak, K.; Bauchy, M.; Stewart, K.; Shahsavari, R.; Jagannathan, D.; Brommer, D.; Baronnet, A.; Buehler, M.; Yip, S.; et al. Combinatorial molecular optimization of cement hydrates. Nat. Commun. 2014, 5, 4960. [Google Scholar] [CrossRef] [PubMed]
  7. Sonat, C.; Unluer, C. Investigation of the performance and thermal decomposition of MgO and MgO-SiO2 formulations. Thermochim. Acta 2017, 655, 251–261. [Google Scholar] [CrossRef]
  8. Liua, H.; Dua, T.; Krishnan, N.M.A.; Li, H.; Bauchy, M. Study on the optimization of some cement based mixing binders’ characteristics. Cem. Concr. Compos. 2019, 101, 5–14. [Google Scholar]
  9. Roy, R.; Hinduja, S.; Teti, R. Recent advances in engineering design optimisation: Challenges and future trends. CIRP Ann. 2008, 57, 697–715. [Google Scholar] [CrossRef]
  10. Peyronnard, O.; Benzaazoua, M. Alternative by-product based binders for cemented mine backfill: Recipes optimisation using Taguchi method. Miner. Eng. 2012, 29, 28–38. [Google Scholar] [CrossRef]
  11. Golchin, B.; Hamzah, M.O.; Hasan, M.R.M. Optimization in producing warm mix asphalt with polymer modified binder and surfactant-wax additive. Constr. Build. Mater. 2017, 141, 578–588. [Google Scholar] [CrossRef]
  12. Bayiha, B.N. Optimizing the Choice of Limestone Deposits for the Production of Portland Cement in Cameroon. Int. J. Mater. Sci. Appl. 2018, 7, 174. [Google Scholar] [CrossRef] [Green Version]
  13. Mahmoodi, O.; Siad, H.; Lachemi, M.; Dadsetan, S.; Sahmaran, M. Optimization of brick waste-based geopolymer binders at ambient temperature and pre-targeted chemical parameters. J. Clean. Prod. 2020, 268, 122285. [Google Scholar] [CrossRef]
  14. Mahmoodi, O.; Siad, H.; Lachemi, M.; Dadsetan, S.; Sahmaran, M. Development of optimized binary ceramic tile and concrete wastes geopolymer binders for in-situ applications. J. Build. Eng. 2021, 43, 102906. [Google Scholar] [CrossRef]
  15. Jin, F.; Gu, K.; Al-Tabbaa, A. Strength and hydration properties of reactive MgO-activated ground granulated blastfurnace slag paste. Cem. Concr. Compos. 2015, 57, 8–16. [Google Scholar] [CrossRef] [Green Version]
  16. Wang, F.; Jin, F.; Shen, Z.; Al-Tabbaa, A. Three-year performance of in-situ mass stabilised contaminated site soils using MgO-bearing binders. J. Hazard. Mater. 2016, 318, 302–307. [Google Scholar] [CrossRef] [PubMed]
  17. Yi, Y.; Zheng, X.; Liu, S.; Al-Tabbaa, A. Comparison of reactive magnesia- and carbide slag-activated ground granulated blastfurnace slag and Portland cement for stabilisation of a natural soil. Appl. Clay Sci. 2015, 111, 21–26. [Google Scholar] [CrossRef]
  18. Hu, J.; Ge, Z.; Wang, K. Influence of cement fineness and water-to-cement ratio on mortar early-age heat of hydration and set times. Constr. Build. Mater. 2014, 50, 657–663. [Google Scholar] [CrossRef]
  19. Sedaghat, A.; Zayed, A.; Sandberg, P. Measurement and Prediction of Heat of Hydration of Portland Cement Using Isothermal Conduction Calorimetry. J. Test. Eval. 2013, 41. [Google Scholar] [CrossRef] [Green Version]
  20. Scrivener, K.; Snellings, R.; Lothenbach, B. A Practical Guide to Microstructural Analysis of Cementitious Materials, 1st ed.; Taylor & Francis Group: Danvers, MA, USA, 2016. [Google Scholar]
  21. Mostafa, N.; Brown, P. Heat of hydration of high reactive pozzolans in blended cements: Isothermal conduction calorimetry. Thermochim. Acta 2005, 435, 162–167. [Google Scholar] [CrossRef]
  22. Schöler, A.; Lothenbach, B.; Winnefeld, F.; Ben Haha, M.; Zajac, M.; Ludwig, H.-M. Early hydration of SCM-blended Portland cements: A pore solution and isothermal calorimetry study. Cem. Concr. Res. 2017, 93, 71–82. [Google Scholar] [CrossRef]
  23. BS EN 197-1:2011; Cement, Part 1: Composition, Specifications and Conformity Criteria for Common Cements; British Standards Institution: London, UK, 2011.
  24. BS EN 15167-1:2006; Ground Granulated Blast Furnace Slag for Use in Concrete, Mortar and Grout. Part 1: Definitions, Specifications and Conformity Criteria; British Standards Institution: London, UK, 2006.
  25. BS EN ISO 17892-4:2016; Geotechnical Investigation and Testing—Laboratory Testing of Soil. Part 4: Determination of Particle Size Distribution (ISO 17892-4:2016); British Standards Institution: London, UK, 2016.
  26. Shand, M.A. The Chemistry and Technology of Magnesia; John Wiley & Sons, Inc.: New York, NY, USA, 2006. [Google Scholar]
  27. Seco, A.; Ramírez, F.; Miqueleiz, L.; García, B. Stabilization of expansive soils for use in construction. Appl. Clay Sci. 2011, 51, 348–352. [Google Scholar] [CrossRef]
  28. Espuelas, S.; Omer, J.; Marcelino-Sádaba, S.; Echeverría, A.M.; Seco, A. Magnesium oxide as alternative binder for unfired clay bricks manufacturing. Appl. Clay Sci. 2017, 146, 23–26. [Google Scholar] [CrossRef] [Green Version]
  29. BS EN ISO 787-9-2019; General Methods of Test for Pigments and Extenders. Part 9: Determination of pH Value of an Aqueous Suspension; British Standards Institution: London, UK, 2019.
  30. ASTM E2550-17; Standard test method for thermal stability by thermogravimetry. In Annual Book of ASTM Standards; ASTM International: West Conshohocken, PA, USA, 2017.
  31. Snelson, D.G.; Kinuthia, J.M. Resistance of mortar containing unprocessed pulverised fuel ash (PFA) to sulphate attack. Cem. Concr. Compos. 2010, 32, 523–531. [Google Scholar] [CrossRef]
  32. BS EN 196-7:2007; Methods of Testing Cement. Part 7: Methods of Taking and Preparing Samples of Cement; British Standards Institution: London, UK, 2007.
  33. BS EN 196-11:2018; Methods of Testing Cement. Part 11: Heat of Hydration—Isothermal Conduction Calorimetry Method; British Standards Institution: London, UK, 2018.
  34. Fernandez, R.; Martirena, F.; Scrivener, K. The origin of the pozzolanic activity of calcined clay minerals: A comparison between kaolinite, illite and montmorillonite. Cem. Concr. Res. 2011, 41, 113–122. [Google Scholar] [CrossRef]
  35. Bernard, E.; Lothenbach, B.; Chlique, C.; Wyrzykowski, M.; Dauzères, A.; Pochard, I.; Cau-Dit-Coumes, C. Characterization of magnesium silicate hydrate (M-S-H). Cem. Concr. Res. 2019, 116, 309–330. [Google Scholar] [CrossRef]
  36. Abdalqader, A.; Jin, F.; Al-Tabbaa, A. Characterisation of reactive magnesia and sodium carbonate-activated fly ash/slag paste blends. Constr. Build. Mater. 2015, 93, 506–513. [Google Scholar] [CrossRef] [Green Version]
  37. Walling, S.A.; Provis, J.L. Magnesia-Based Cements: A Journey of 150 Years, and Cements for the Future? Chem. Rev. 2016, 116, 4170–4204. [Google Scholar] [CrossRef]
  38. Borrachero, M.V.; Paya, J.; Bonilla, M.; Monzó, J. The use of thermogravimetric analysis technique for the characterization of construction materials. J. Therm. Anal. Calorim. 2008, 91, 503–509. [Google Scholar] [CrossRef]
  39. Collier, N. Transition and Decomposition Temperatures of Cement Phases—A Collection of Thermal Analysis Dat. Ceram. Silik. 2016, 338–343. [Google Scholar] [CrossRef] [Green Version]
  40. Klein, C.; Hurlbut, J.C. Manual of Minerology; John Wiley and Sons: New York, NY, USA, 1985; Volume 20. [Google Scholar]
  41. Engbrecht, D.; Hirschfeld, D. Thermal analysis of calcium sulfate dihydrate sources used to manufacture gypsum wallboard. Thermochim. Acta 2016, 639, 173–185. [Google Scholar] [CrossRef] [Green Version]
  42. Jin, F.; Al-Tabbaa, A. Thermogravimetric study on the hydration of reactive magnesia and silica mixture at room temperature. Thermochim. Acta 2013, 566, 162–168. [Google Scholar] [CrossRef]
  43. Gomes, C.M.; de Oliveira, A.D.S. Chemical phases and microstructural analysis of pastes based on magnesia cement. Constr. Build. Mater. 2018, 188, 615–620. [Google Scholar] [CrossRef]
  44. Song, H.; Jeong, Y.; Bae, S.; Jun, Y.; Yoon, S.; Oh, J.E. A study of thermal decomposition of phases in cementitious systems using HT-XRD and TG. Constr. Build. Mater. 2018, 169, 648–661. [Google Scholar] [CrossRef]
  45. Lanas, J.; Alvarez, J. Dolomitic lime: Thermal decomposition of nesquehonite. Thermochim. Acta 2004, 421, 123–132. [Google Scholar] [CrossRef]
  46. Darko, K.; Branislav, Z. Effects of dosage and modulus of water glass on early hydration of alkali–slag cements. Cem. Concr. Res. 2002, 32, 1181–1188. [Google Scholar]
  47. Amaral, L.; Oliveira, I.; Salomão, R.; Frollini, E.; Pandolfelli, V. Temperature and common-ion effect on magnesium oxide (MgO) hydration. Ceram. Int. 2010, 36, 1047–1054. [Google Scholar] [CrossRef]
  48. Kuenzel, C.; Zhang, F.; Ferrándiz-Mas, V.; Cheeseman, C.; Gartner, E. The mechanism of hydration of MgO-hydromagnesite blends. Cem. Concr. Res. 2018, 103, 123–129. [Google Scholar] [CrossRef]
  49. He, Y.; Lai, Z.; Yan, T.; He, X.; Lu, Z.; Lv, S.; Li, F.; Fan, X.; Zhang, H. Effect of Cd2+ on early hydration process of magnesium phosphate cement and its leaching toxicity properties. Constr. Build. Mater. 2019, 209, 32–40. [Google Scholar] [CrossRef]
  50. Snelson, D.G.; Wild, S.; O’Farrell, M. Heat of hydration of Portland Cement–Metakaolin–Fly ash (PC–MK–PFA) blends. Cem. Concr. Res. 2008, 38, 832–840. [Google Scholar] [CrossRef]
  51. Tydlitát, V.; Zákoutský, J.; Schmieder, M.; Černý, R. Application of large-volume calorimetry for monitoring the early-stage hydration heat development in cement-based composites as a function of w/c. Thermochim. Acta 2012, 546, 44–48. [Google Scholar] [CrossRef]
  52. Moghaddam, F.; Sirivivatnanon, V.; Vessalas, K. The effect of fly ash fineness on heat of hydration, microstructure, flow and compressive strength of blended cement pastes. Case Stud. Constr. Mater. 2019, 10, e00218. [Google Scholar] [CrossRef]
  53. Bensted, J. Seventh International Congress on the Chemistry of Cement; Editions Septima: Paris, France, 1980; Volume 2, Part II; pp. 1–6. [Google Scholar]
  54. Taylor, F.W.; Barret, P.; Brown, P.W.; Double, D.D.; Frohnsdorff, G.; Johansen, V.T. Materiaux et Constructions. Mater. Struct. 1984, 17, 457. [Google Scholar] [CrossRef]
  55. Thomas, J.J.; Biernacki, J.J.; Bullard, J.W.; Bishnoi, S.; Dolado, J.S.; Scherer, G.; Luttge, A. Modeling and simulation of cement hydration kinetics and microstructure development. Cem. Concr. Res. 2011, 41, 1257–1278. [Google Scholar] [CrossRef]
  56. Cyr, M.; Lawrence, P.; Ringot, E. Mineral admixtures in mortars and Quantification of the physical effects of inert materials on short-term hydration. Cem. Concr. Res. 2005, 35, 719–730. [Google Scholar]
  57. Deboucha, W.; Leklou, N.; Khelidj, A.; Oudjit, M.N. Hydration development of mineral additives blended cement using thermogravimetric analysis (TGA): Methodology of calculating the degree of hydration. Constr. Build. Mater. 2017, 146, 687–701. [Google Scholar] [CrossRef]
Figure 1. XRD plots for binder materials.
Sustainability 13 09378 g001
Figure 2. Particle size distribution curves for CEM I, MG1, MG2, MG3, and MG4 and GGBS.
Sustainability 13 09378 g002
Figure 3. A schematic representation of the experimental mix design.
Sustainability 13 09378 g003
Figure 4. A schematic representation of a ToniCAL Isothermal Calorimeter.
Sustainability 13 09378 g004
Figure 5. pH summary of mix blend systems.
Sustainability 13 09378 g005
Figure 6. TG and DTG analysis results for blended mixtures with MG2 waste.
Sustainability 13 09378 g006
Figure 7. TG and DTG analysis results for blended mixtures with MG2 waste.
Sustainability 13 09378 g007
Figure 8. TG and DTG analysis results for blended mixtures with MG3 waste.
Sustainability 13 09378 g008
Figure 9. TG and DTG analysis results for blended mixtures with MG4 waste.
Sustainability 13 09378 g009
Figure 10. Weight loss (%) due to thermal analysis for blended mixtures.
Sustainability 13 09378 g010
Figure 11. Calorimetric 1st thermal power for hydrated blended mixtures after 72 h at 25 °C.
Sustainability 13 09378 g011
Figure 12. Calorimetric 2nd thermal power for hydrated blended mixtures after 72 h at 25 °C.
Sustainability 13 09378 g012
Figure 13. Calorimetric curves for blended mixtures in MG1 blend system after hydration at 25 °C.
Sustainability 13 09378 g013
Figure 14. Calorimetric curves for blended mixtures in MG2 blend system after hydration at 25 °C.
Sustainability 13 09378 g014
Figure 15. Calorimetric curves for blended mixtures in MG3 blend system after hydration at 25 °C.
Sustainability 13 09378 g015
Figure 16. Calorimetric curves for blended mixtures in MG4 blend system after hydration at 25 °C.
Sustainability 13 09378 g016
Figure 17. Calorimetric heat of hydration peaks for hydrated blended mixtures after 72 h at 25 °C.
Sustainability 13 09378 g017
Figure 18. Calorimetric heat of hydration curves for hydrated blended mixtures after 72 h at 25 °C.
Sustainability 13 09378 g018
Figure 19. Schematic representation of a hydrating C3S (alite) grain [55].
Sustainability 13 09378 g019
Table 1. Chemical composition of blended materials.
OxideComposition (wt.%)
CEM IMG1MG2MG3MG4GGBS
CaO61.499.393.286.0232.4137.99
SiO218.842.513.334.901.2035.54
Al2O34.770.520.831.090.5211.46
MgO3.5456.2678.4445.6124.798.78
Fe2O32.872.132.822.431.050.42
Mn2O30.050.150.270.160.080.43
SO33.126.220.301.8517.831.54
TiO20.260.01<0.010.04<0.010.70
K2O0.570.180.100.100.230.43
Na2O0.020.090.030.060.130.37
P2O50.100.060.060.060.050.02
V2O50.060.10<0.010.100.070.04
BaO0.050.01<0.010.01<0.010.09
L.O.I4.3022.3010.7037.4021.802.00
Table 2. Properties of blended materials.
PropertiesBinders
CEM 1MG1MG2MG3MG4GGBS
Particle diameter
Median d50 (µm)18.8616.2418.7262.746.5213.69
Physical properties
ColourGreyLight-BrownVery pale brownGreyish brownPale brownOff-white
Bulk density (kg/m3)-----1200
Particle density/Specific gravity (Mg/m3)3.162.862.912.882.652.90
Others
pH value12.8610.7912.0411.0912.9510.20
Reactivity (m)-301.8>1440>1440-
Table 3. Experimental mix blends showing anhydrous blend mixes.
Mix SystemBlend CompositionComposition (wt.%)
CEM 1MG1MG2MG3MG4GGBS
CEM I system (Control)100CEM 1:0GGBS100-----
MG1 System90MG1:10GGBS-90---10
80MG1:20GGBS-80---20
70MG1:30GGBS-70---30
MG2 system90MG2:10GGBS--90--10
80MG2:20GGBS--80--20
70MG2:30GGBS--70--30
MG3 system90MG3:10GGBS---90-10
80MG3:20GGBS---80-20
70MG3:30GGBS---70-30
MG4 system90MG4:10GGBS----9010
80MG4:20GGBS----8020
70MG4:30GGBS----7030
Table 4. Identification and comparison of hydrated cementitious phases for blended mixtures.
Blend SystemsHydrated Cementitious Phases
Loose Water (H2O)Gypsum (CaSO4.2H2O-CaSO4)Brucite (Mg(OH)2)Magnesite (MgCO3)Calcium Carbonate (CaCO3)
Peak LocationTemp. (°C)Peak LocationTemp. (°C)Peak LocationTemp. (°C)Peak LocationTemp. (°C)Peak LocationTemp. (°C)
MG11105--237135374737
MG21103--2360--3709
MG31101--240136584782
MG4--1,2105–3713446--4703
Publisher’s Note: MDPI stays neutral with regard to jurisdictional claims in published maps and institutional affiliations.

