Article

Improvements and Evaluation on Bitter Orange Leaves (Citrus aurantium L.) Solar Drying in Humid Climates

by
Chan-González Jorge de Jesús
1,
Castillo Téllez Margarita
1,
Castillo-Téllez Beatriz
2,*,
Lezama-Zárraga Francisco Román
1,
Mejía-Pérez Gerardo Alberto
3 and
Vega-Gómez Carlos Jesahel
3
1
Facultad de Ingeniería, Universidad Autónoma de Campeche, Buenavista 24085, Mexico
2
Centro Universitario del Norte, Universidad de Guadalajara, Colotlán 46200, Mexico
3
Centro Universitario de Tonalá, Universidad de Guadalajara, Tonalá 45425, Mexico
*
Author to whom correspondence should be addressed.
Sustainability 2021, 13(16), 9393; https://doi.org/10.3390/su13169393
Submission received: 3 June 2021 / Revised: 5 August 2021 / Accepted: 17 August 2021 / Published: 21 August 2021
(This article belongs to the Special Issue Food Dehydration and Food Processing)

Abstract

:
Dried, bitter orange leaves are widely used because of their nutritious and medicinal applications. As a result, many technologies have been used to accomplish its drying process. However, drying needs a long time and high energy demand, especially in humid climates. In this paper, bitter orange leaf drying was carried out using thermal and photovoltaic solar energy (integrated system, IS), eliminating the high humidity inside of the drying chamber to improve this process. A regular solar dryer (RD) was also used to compare the kinetics, mathematical modeling, and colorimetry study (as a quality parameter), evaluating both systems’ performances. The drying leaves’ weights were stabilized after 330 min in the RD and after 240 min in the IS, with a maximum drying rate of 0.021 kg water/kg dry matter∙min, reaching a relative humidity of 7.9%. The Page and Modified Page models were the best fitting to experimental results with an Ra2 value of 0.9980. In addition, the colorimetric study showed a better-preserved color using the IS, with an ∆E of 9.12, while in the RD, the ∆E was 20.66. Thus, this system implementation can reduce agroindustry costs by reducing time and energy with a better-quality and sustainable product, avoiding 53.2 kg CO2 emissions to the environment.

1. Introduction

Bitter orange is a tree from 4 to 10 m high with soft thorns, bright white flowers, and a pleasant scent. Orange grows in warm, semi-warm, and temperate climates and is often cultivated in family gardens [1]. The peel, the flower, the leaf, and the fruit’s bark are used in traditional and modern medicines. The infusion prepared with the leaves is used to treat digestive disorders (colic, dyspepsia, inappetence, nausea); it is also used in respiratory conditions (bronchitis, cough, colds). In addition, its leaves are excellent natural anxiolytics and are beneficial for gastritis, colic, diarrhea, constipation, and intestinal pain [2]. Thus, it is widely cultivated and used in communities in Tabasco, Yucatán, and Campeche, Mexico, helping the well-being of many economically vulnerable communities.
Orange leaves are consumed mainly after a drying process, using different techniques. The drying process eliminates water from food, by usually passing dry, hot air through the product. The drying time depends mainly on the air-drying temperature, velocity, and humidity. When the difference between air and food humidity increases, the drying rate increases [3,4,5].
Drying has proven to be a reliable food preservation method. It reduces food weight, volume, packaging, and transportation costs, achieving an economical product with the required quality. Unfortunately, drying is an onerous energy process competing with distillation as the most energy-intensive operation [6,7].
Solar drying is an alternative to reduce the energy consumption in food dehydration without increasing the carbon footprint, which has become a global concern [8,9,10]. The development of energy-efficient technology is essential to solve these complex problems [11]. Many studies and dryer modifications have been designed to improve food quality, optimizing time and economic aspects to meet energy demand [12]. In addition, solar dryers eliminate food contamination due to the insects and rodents, rain, dust, and discoloration that traditional open sun drying promotes [13,14,15].
Solar dryer designs are continuously enhanced according to the food characteristics and environmental conditions: potato slice drying has been performed using a hybrid solar dryer with an electrical resistance using photovoltaic panels for safe storage conditions. Another design for mango waste drying, using a transparent polycarbonate roof (Wilkins et al., 2018), tried to solve the uncontrolled ambient conditions. Toĝrul and Pehlivan (2004) used a greenhouse solar dryer employing an air conditioned control system for red chili drying [16]. Şevik et al. (2019) tested an infrared-assisted double-pass solar air dryer in drying mint and apple to complement solar radiation when it is cloudy [12]. Another mixed solar dryer with forced convection and energy storage has been designed to analyze black turmeric [17]. Finally, Demissie et al. (2019) developed a hybrid solar dryer and its modeling [18].
Air conditions and their effects on drying performance have been continuously analyzed due to their significant influence on drying kinetics and the changes they cause in food properties.
The influence of forced convection has been studied recurrently, by groups such as Krokida et al., Putra and Ajiwiguna, and Salinas et al. [19,20,21]. They found that the increase in air velocity during drying enhances the drying rate at the same temperature. This improvement is because the air is responsible for transferring the heat and evaporating the water from the sample. Additionally, Salinas et al. demonstrate that higher air velocities improve color conservation. However, the air effect is less significant than temperature variations.
As is well-known, high air humidity is responsible for the deterioration of fruits and vegetables [22], but, in addition, it causes many problems during the drying process. The drying rate depends mainly on the moisture difference between the surrounding air, food, and its retention time [22]. High humid climates complicate the process due to long drying times [23], affecting the nutrients, flavor, or color [24]. The drying time can be increased by 44% due to high air humidity. Many studies have investigated the negative effect of high humidity on drying rates [25,26,27]. Nonetheless, a few studies aim to improve dryer design to reduce drying rates in high humidity climates, e.g., using an electric oven whit controlled conditions [28].
A hybrid solar drying system can reduce the drying time and the energy consumption, thus mitigating the carbon footprint. Photovoltaic systems have been successfully applied for this purpose [29,30,31], but these systems have been poorly used to improve drying in very humid climates. Sunlight falls on a photoelectric cell’s face in a photovoltaic system, producing a differential of electric potential between both faces, causing electrons to jump, thus generating an electric current. This sustainable electric energy can provide adequate drying conditions, elevating the temperature, air velocity or, as in this work, reducing humidity into the drying chamber.
In México, during the year 2018, a total of 277,928.224 Gigawatt hours (GWh) was consumed by the electric power industry. As a result, CO2 emissions have been released into the environment due to electricity generation variations using fuel or other energy sources. The Comisión Reglatoria de Energía and the Secretaría de Ambiente y Recursos Naturales estimate the National Electric System’s Emission Factor annually based on the 12th Article of the Energy Transition Law Regulation. The National Electric System’s Emission Factor is 0.582 kg of CO2/kWh [32].
It is necessary to estimate CO2 emissions to know the emissions due to the energy consumed during the drying and gas emissions from photovoltaic system energy production.
On the other hand, drying operation food behavior can be predicted during drying by applying mathematical modeling [33,34,35]. Moreover, mathematical modeling is a proper tool for optimizing the drying process, although thin layer models are the most used for dryer designs [36].
The objective of this paper is to evaluate the improvements in the solar drying of orange leaves using a sustainable dehumidifying air system powered by photovoltaic energy. The drying kinetics and moisture content have been analyzed. Moreover, a colorimetry study was used to determine the final quality of dried samples. Finally, the experimental results were fitted with mathematical models to predict bitter orange drying behavior and design and size solar dryers.

2. Materials and Methods

The experimental study has been carried out with two cabinet-type solar dryers. Each experiment was repeated in triplicate. In the regular dryer (RD), we used natural convection, whereas in the integrated system (IS), the RD was coupled with a dehumidification air system with forced convection. This system was powered by an autonomous photovoltaic system from 200 Wp at 12 VDC (Figure 1).

2.1. Raw Material

The bitter orange leaves (Citrus aurantium L.), cultivated in Campeche City, México, have been selected homogeneously, depending on their physical properties such as color, size, and maturity.

2.2. Instrumentation

The temperature, relative humidity, and weight loss measurements were recorded every 30 min. The weight operation requires the samples to be extracted from dryers and placed onto the balance to determine the weight loss (See Figure 2). The climatological parameters were obtained from the meteorological station at the Facultad de Ingeniería de la Universidad Autónoma de Campeche, the specifications of which can be seen in Table 1. In addition, the air velocity inside the IS cabinet was measured, finding an average of 2.9 m/s.
The water activity was determined with an activity meter, Rotronic HygroPalm (with an accuracy of ±0.01%), for fresh and dried leaves. For temperatures and humidity, a thermo-hygrometer Brannan (accuracy of ±1 °C and ±3%, respectively) was used while the sample weight was measured using a Boeco balance, model BPS40 plus (accuracy of ±0.0002 g). The color measurement tests were performed using the CIELAB color space with a Huanyu digital colorimeter, model SC-10, repeatability ≤ 0.03 ΔE * ab. Finally, the air velocity into the dryer was measured with an HD 300, EXTECH (accuracy of ±3.0%).

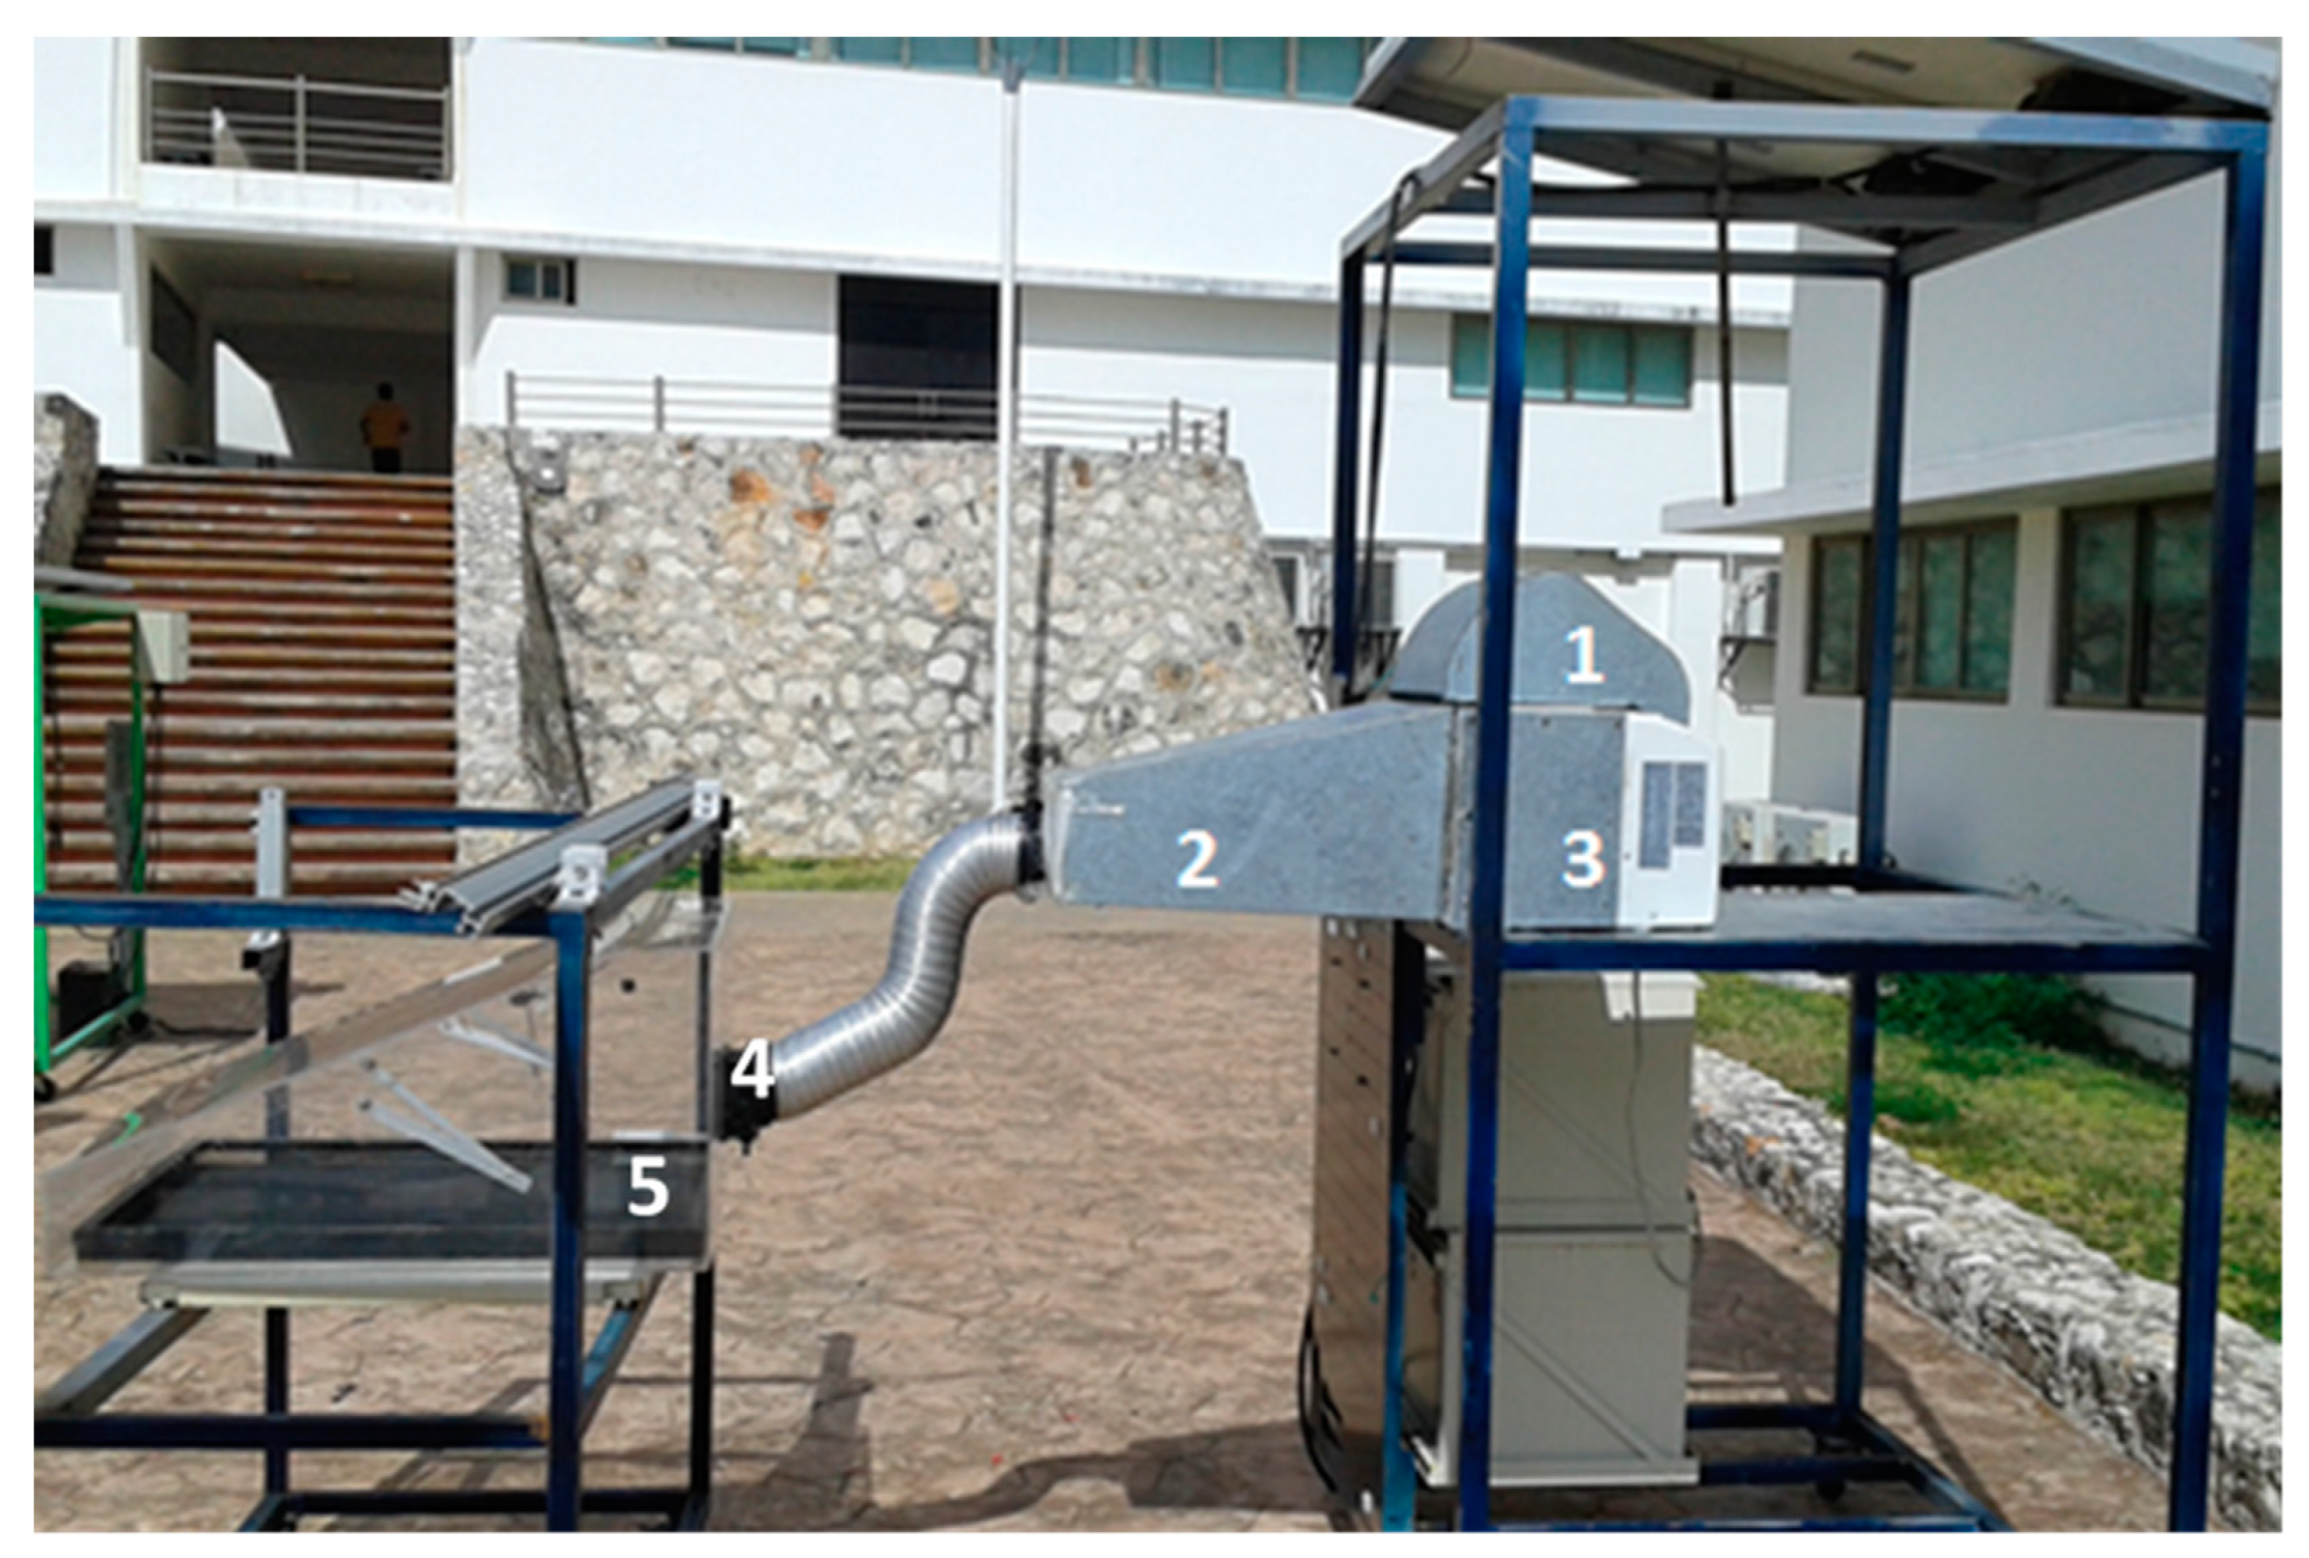
2.3. Direct Solar Drying

The solar dryers have a 0.5 m2 surface for raw food with perforation on all dryer sides, allowing for the entrance and extraction of hot and humid air. A fan at the dryer’s rear side introduces air at a maximum velocity of 3.4 m/s for the IS system. For both systems (RD and IS), the samples’ temperature, weight, size, solar irradiance, relative humidity, and air temperature were measured.
Integrated system (Thermal-photovoltaic solar energy hybridization)
The IS includes a 1.48 kW air conditioner, with a few modifications, as follows:
(a)
The humid air passes through the air conditioner’s evaporator; therefore, it is cooled and dehumidified.
(b)
The hot and humid air is cooled in the evaporator to a point below the dew temperature (for Campeche 22 °C); therefore, the excess moisture contained in the air condenses. After this process, we have cold and dry air. The air continues to cool until it reaches approximately 14 °C, the minimum evaporator temperature and the equipment cooling limit.
(c)
Then, this air is redirected through a duct (1) towards the condensation chamber: The air is forced to pass around the compressor and condenser, with an average temperature of 60 °C. The temperature increases only due to the gain of sensible heat since the absolute humidity remains constant, taking advantage of the sensible heat dissipated by the condenser.
(d)
The air extracted from the chamber passes through a trapezoidal duct (2). An outlet (2) is connected to a flexible tube (4) to facilitate coupling to a hole in the black solar dryer (5). See Figure 1 and Figure 3.
The IS uses two monocrystalline photovoltaic modules (100 Wp in each one) connected in parallel, a pure sine wave inverter (1200 Wp, THD < 3%), and two deep-cycle batteries (115 Ah each one). The photovoltaic system’s capacity can generate enough energy to store and satisfy the necessary power for two consecutive days in cloudy weather.

2.4. Sustainability of the IS

According to the Global Emissions Model for integrated Systems (GEMIS) organization, the emission factor is 0.135 kg of CO2/kWh [37]. Reich et al. (2007) suggest calculating using the emission range 0.030–0.317 kg of CO2/kWh [38].
It is necessary to validate if the photovoltaic system’s energy is sufficient to keep the prototype in operation during the drying process.
The energy produced E p r o d by the photovoltaic system in the 5.5 h of solar radiation in a day is given by the following:
E p r o d = W p e a k · h r r a d · n u m b e r P V m o d u l e
where W p e a k is the peak power of a photovoltaic module (watts), h r r a d is the solar radiation hours in a day (hrs), and n u m b e r P V m o d u l e is the number of modules included in the photovoltaic system.
The energy consumed, E c o n s , by the dehumidification air system with forced convection in one day is given by the following:
E c o n s = A h a i r   c o n d · V 1 · h r u s e d · p f
where A h a i r   c o n d is the nominal Ampere-hours of the air conditioner, V 1 is the monophasic voltage, h r u s e d is the number of hours that the air conditioner is in operation in one-day, and p f is the power factor [39].

2.5. Solar Drying Modeling Fitting

The mathematical modeling of direct solar drying with natural and forced convection has been studied to analyze the drying process’ behavior. The models presented in Table 2 are widely applied because they are easy to use and require few data compared to complex distributed models [40,41]. Furthermore, the models are named “thin-layer” because the sample is a layer of particles or slices [42], and the models are very appropriate in particular food because they can describe its behavior during drying [43].
The humidity ratio (MR), which depends on the drying time, is calculated as in the following Equation (3):
M R = M M e M o M e
where M is the moisture content, Me is the equilibrium moisture, and Mo is the initial humidity. The equilibrium moisture content Me was determined by the following Equation (4) [44]:
M e = W 1 M o + W f W 1 W 1 ( 1 M )
where Me is expressed in (kg water/kg dry matter), and W1 and M0 are the initial weight and the initial moisture of the samples. Wf is the weight of the sample at Me.
Table 2 shows the mathematical model evaluated for the experimental results of drying kinetics.
The adjusted coefficient of determination (Ra2) has been used as the main parameter to choose the appropriate model that fits the experimental data [53]. Additionally, reduced chi-square (χ2) and Root-Mean-Square Error (RMSE) complemented the model selection criterion. Values closer to zero of RMSE and χ2 provide less deviation from the experimental data. All models’ parameters and Ra2 analyses have been calculated using Data Fit software version 9.1 from Oakdale Engineering.
RMSE = 1 N i = 1 N ( M R p r e , i M R e x p , i ) 2
χ 2 = i = 1 N ( M R e x p , i M R p r e , i ) 2 N n
Equations (5) and (6) allow the root mean squared error and reduced chi-square (χ2) to be determined [54].
M R e x p , i is the moisture radio from experimental results, M R p r e , i represents the model’s humidity ratio predicted, n is the constant numbers in each model, and N is the observations’ number.

2.6. Colorimetric Study

To carry out the colorimetric study, we calculated the following: the luminosity values (L*), coordinates a* (red-green variation), the blue-yellow deviation (b*), saturation (C*), tone (H*), and the total color difference (ΔE). The color values are calculated according [55] as follows:
Δ E = ( Δ L * 2 + Δ a * 2 + Δ b * 2 ) 1 / 2
C * = ( a * ) 2 + ( b * ) 2
H * = a r c t g ( b * a * )

3. Results

The experimental investigation was carried out in the Laboratorio de Secado Solar in the Universidad Autónoma de Campeche, in February 2020.
Table 3 shows that the initial humidity was similar in both samples.

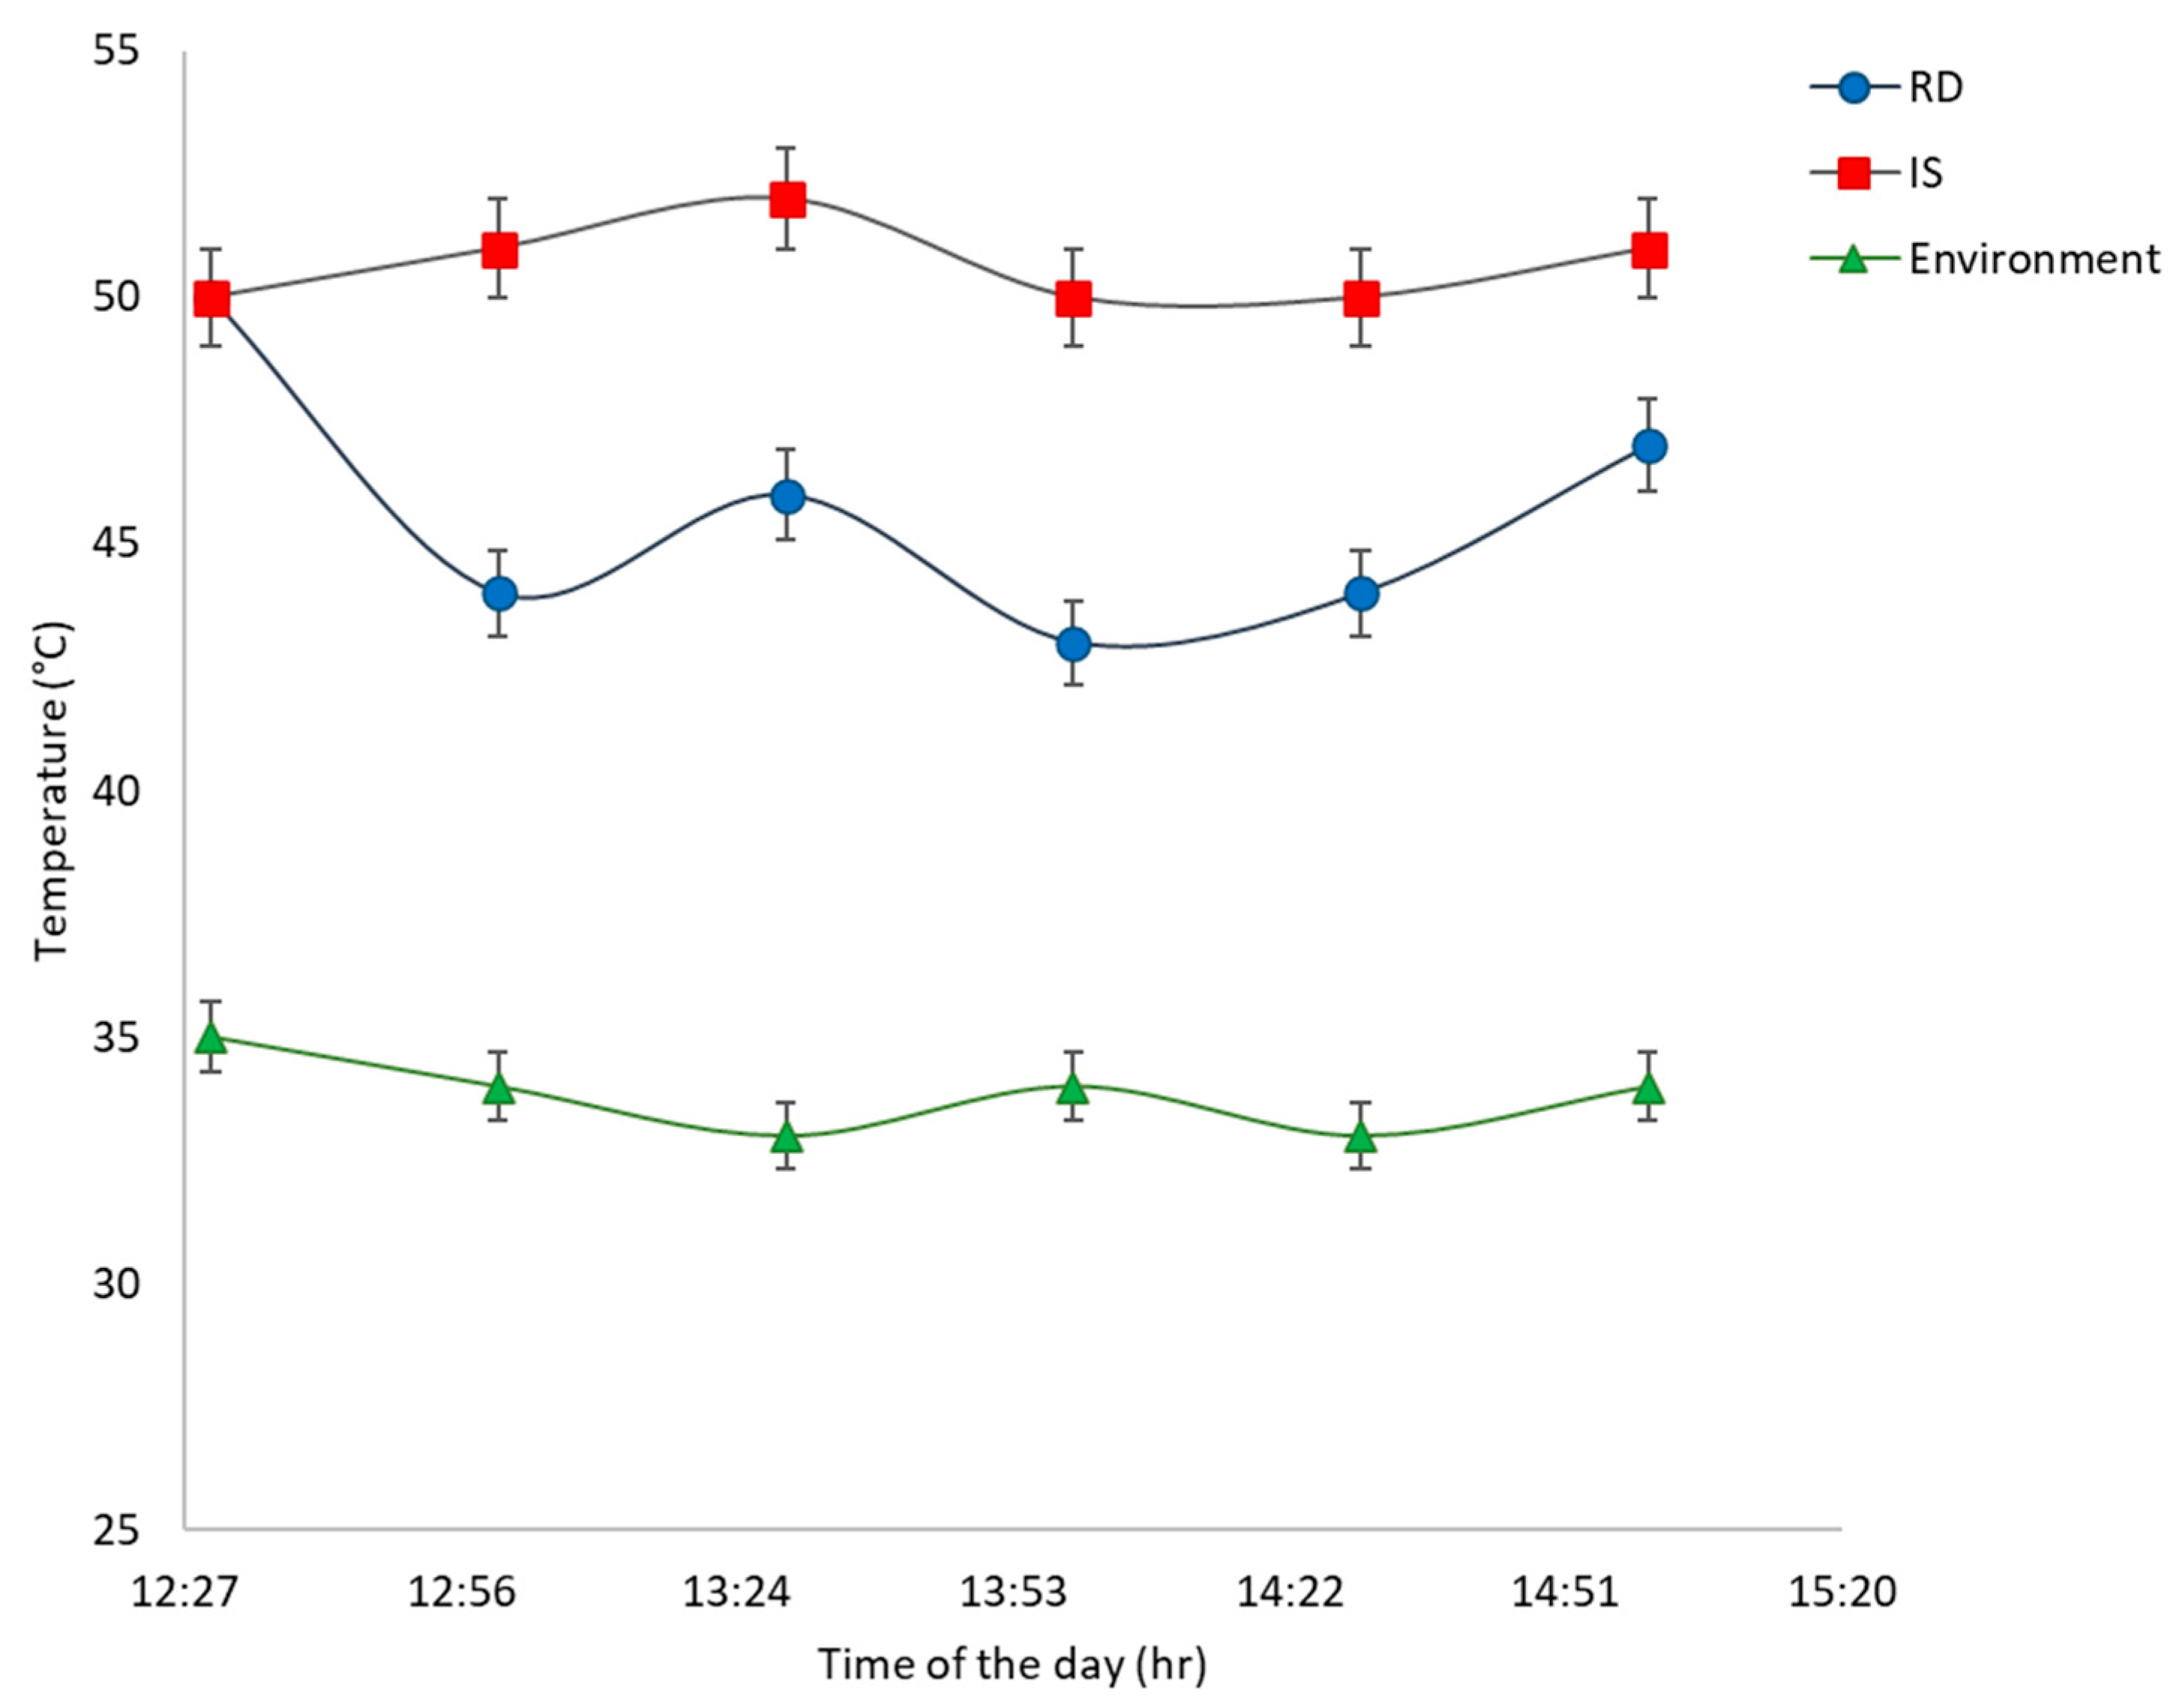
3.1. Climatological Parameters

During the test, the climatological parameters were as follows: maximum temperature, between 30.0 and 36.7 °C; average temperature, 33.4 °C; maximum global irradiance, 825.7 W/m2; maximum humidity, 80%.
For the RD, the chamber’s temperature was between 50 and 65 °C, with an average of 55 °C. The IS chamber registers an internal temperature between 50 and 61 °C, with an average of 58 °C. These conditions are shown in Figure 4.

3.2. Dehumidification Process

This design aims to reduce humidity inside the drying chamber to increase the difference between the air’s humidity and the bitter orange leaves without affecting the product quality.
The condenser had an average temperature of 60 °C. The operations begin with a loss of the sensible and latent heat of the ambient air until reaching the temperature below the dew point (at 22 °C), and the excess humidity is condensed. The air continues to cool until it reaches approximately 14 °C, the evaporator’s minimum temperature, and the equipment’s cooling limit.
Figure 5 shows the relative humidity (RH) during the experiments. The IS presents an average of 14.33, while the RD average is 27.27. Furthermore, the IS reaches a rapid convergence of RH in 1.2 h. In contrast, the RD achieves the same value after 2.4 h, while the ambient RH was 60% at this time.
Figure 6 presents cloudy and rainy-day conditions to compare the two dryers’ behavior. A lower constant relative humidity can be observed inside the IS chamber. The RH average was 75.33 ± 3.27%, 37.2 ± 4.53%, and 17 ± 0.49% for the ambient, RD, and IS.
Moreover, in Figure 7, the IS presents a higher and stable temperature (50 °C) than the RD. The temperature remains almost 10 °C higher throughout the process in the IS than in the RD.
The area under the temperature–time graph shown in Figure 8 was calculated using the trapezoidal algorithm [56], using the trapz function of MATLAB software. This area is related to the thermal input for each system. It was estimated that the area under the curve of the RD represents 88% of the IS area.

3.3. Estimation of CO2 Emissions

According to the IS, the energy produced using the photovoltaic system ( E prod ) is given by the following:
E prod = 150   W   ( 5.5   hr )   ( 2   modules ) = 1.65   kWh / day
Moreover, the energy consumed by the dehumidification air system ( E cons ) is given by the following:
E cons = 3.5   Ah   ( 120   V )   ( 4   hr )   ( 0.9 ) = 1.512   kWh / day
The obtained results prove that the IS is electrically sustainable.
The total energy consumed by the dehumidification system employed in the drying process for 81 days is given as follows:
E cons = 1.512 kWh day ( 81   days ) = 122.472   kWh
E prod = 1.65 kWh day ( 81   days ) = 133.65   kWh  
Then, the CO2 emissions ϵ avoided that are avoided to be sent to the environment are given by the following:
ϵ avoided = 0.582 kg   CO 2 kWh ( 122.472   kWh ) = 71.2787   kg   CO 2
Furthermore, the CO2 emissions ϵ produced caused by the production of energy with PV modules will be as follows:
ϵ produced = 0.135   kg   CO 2 kWh ( 133.65   kWh ) = 18.04275   kg   CO 2
Finally, the CO2 emissions net ( ϵ net ) that are avoided to be sent to the environment is the difference between ϵ avoided and ϵ produced , as follows:
ϵ net = 71.2787   kg   CO 2 18.04275   kg   CO 2 = 53.23595   kg   CO 2
The prototype used for the drying of orange leaves removed moisture from 20 g to 9.35 g in 210 min; therefore, the energy produced by the PVS and the energy consumed by the drying process in the IS during this experiment are 0.24057 kWh and 0.22044 kWh, respectively.
Then, the CO2 emissions avoided are 0.1283 kg CO2 and the CO2 emissions produced with PV modules is 0.0324 kg CO2.
Finally, the CO2 emissions net, ϵ net , that are avoided to be sent to the environment is the difference between ϵ avoided and ϵ produced = 0.0959   kg   CO 2 .
Where 0.582 CO2/kWh is the Emission Factor of the National Electric System calculated annually by the Energy Regulatory Commission and the Secretary of Environment and Natural Resources [32], and 0.135 CO2/kWh is the emission factor caused by the solar panels’ energy production according to the Global Emissions Model for integrated systems (GEMIS) [37].

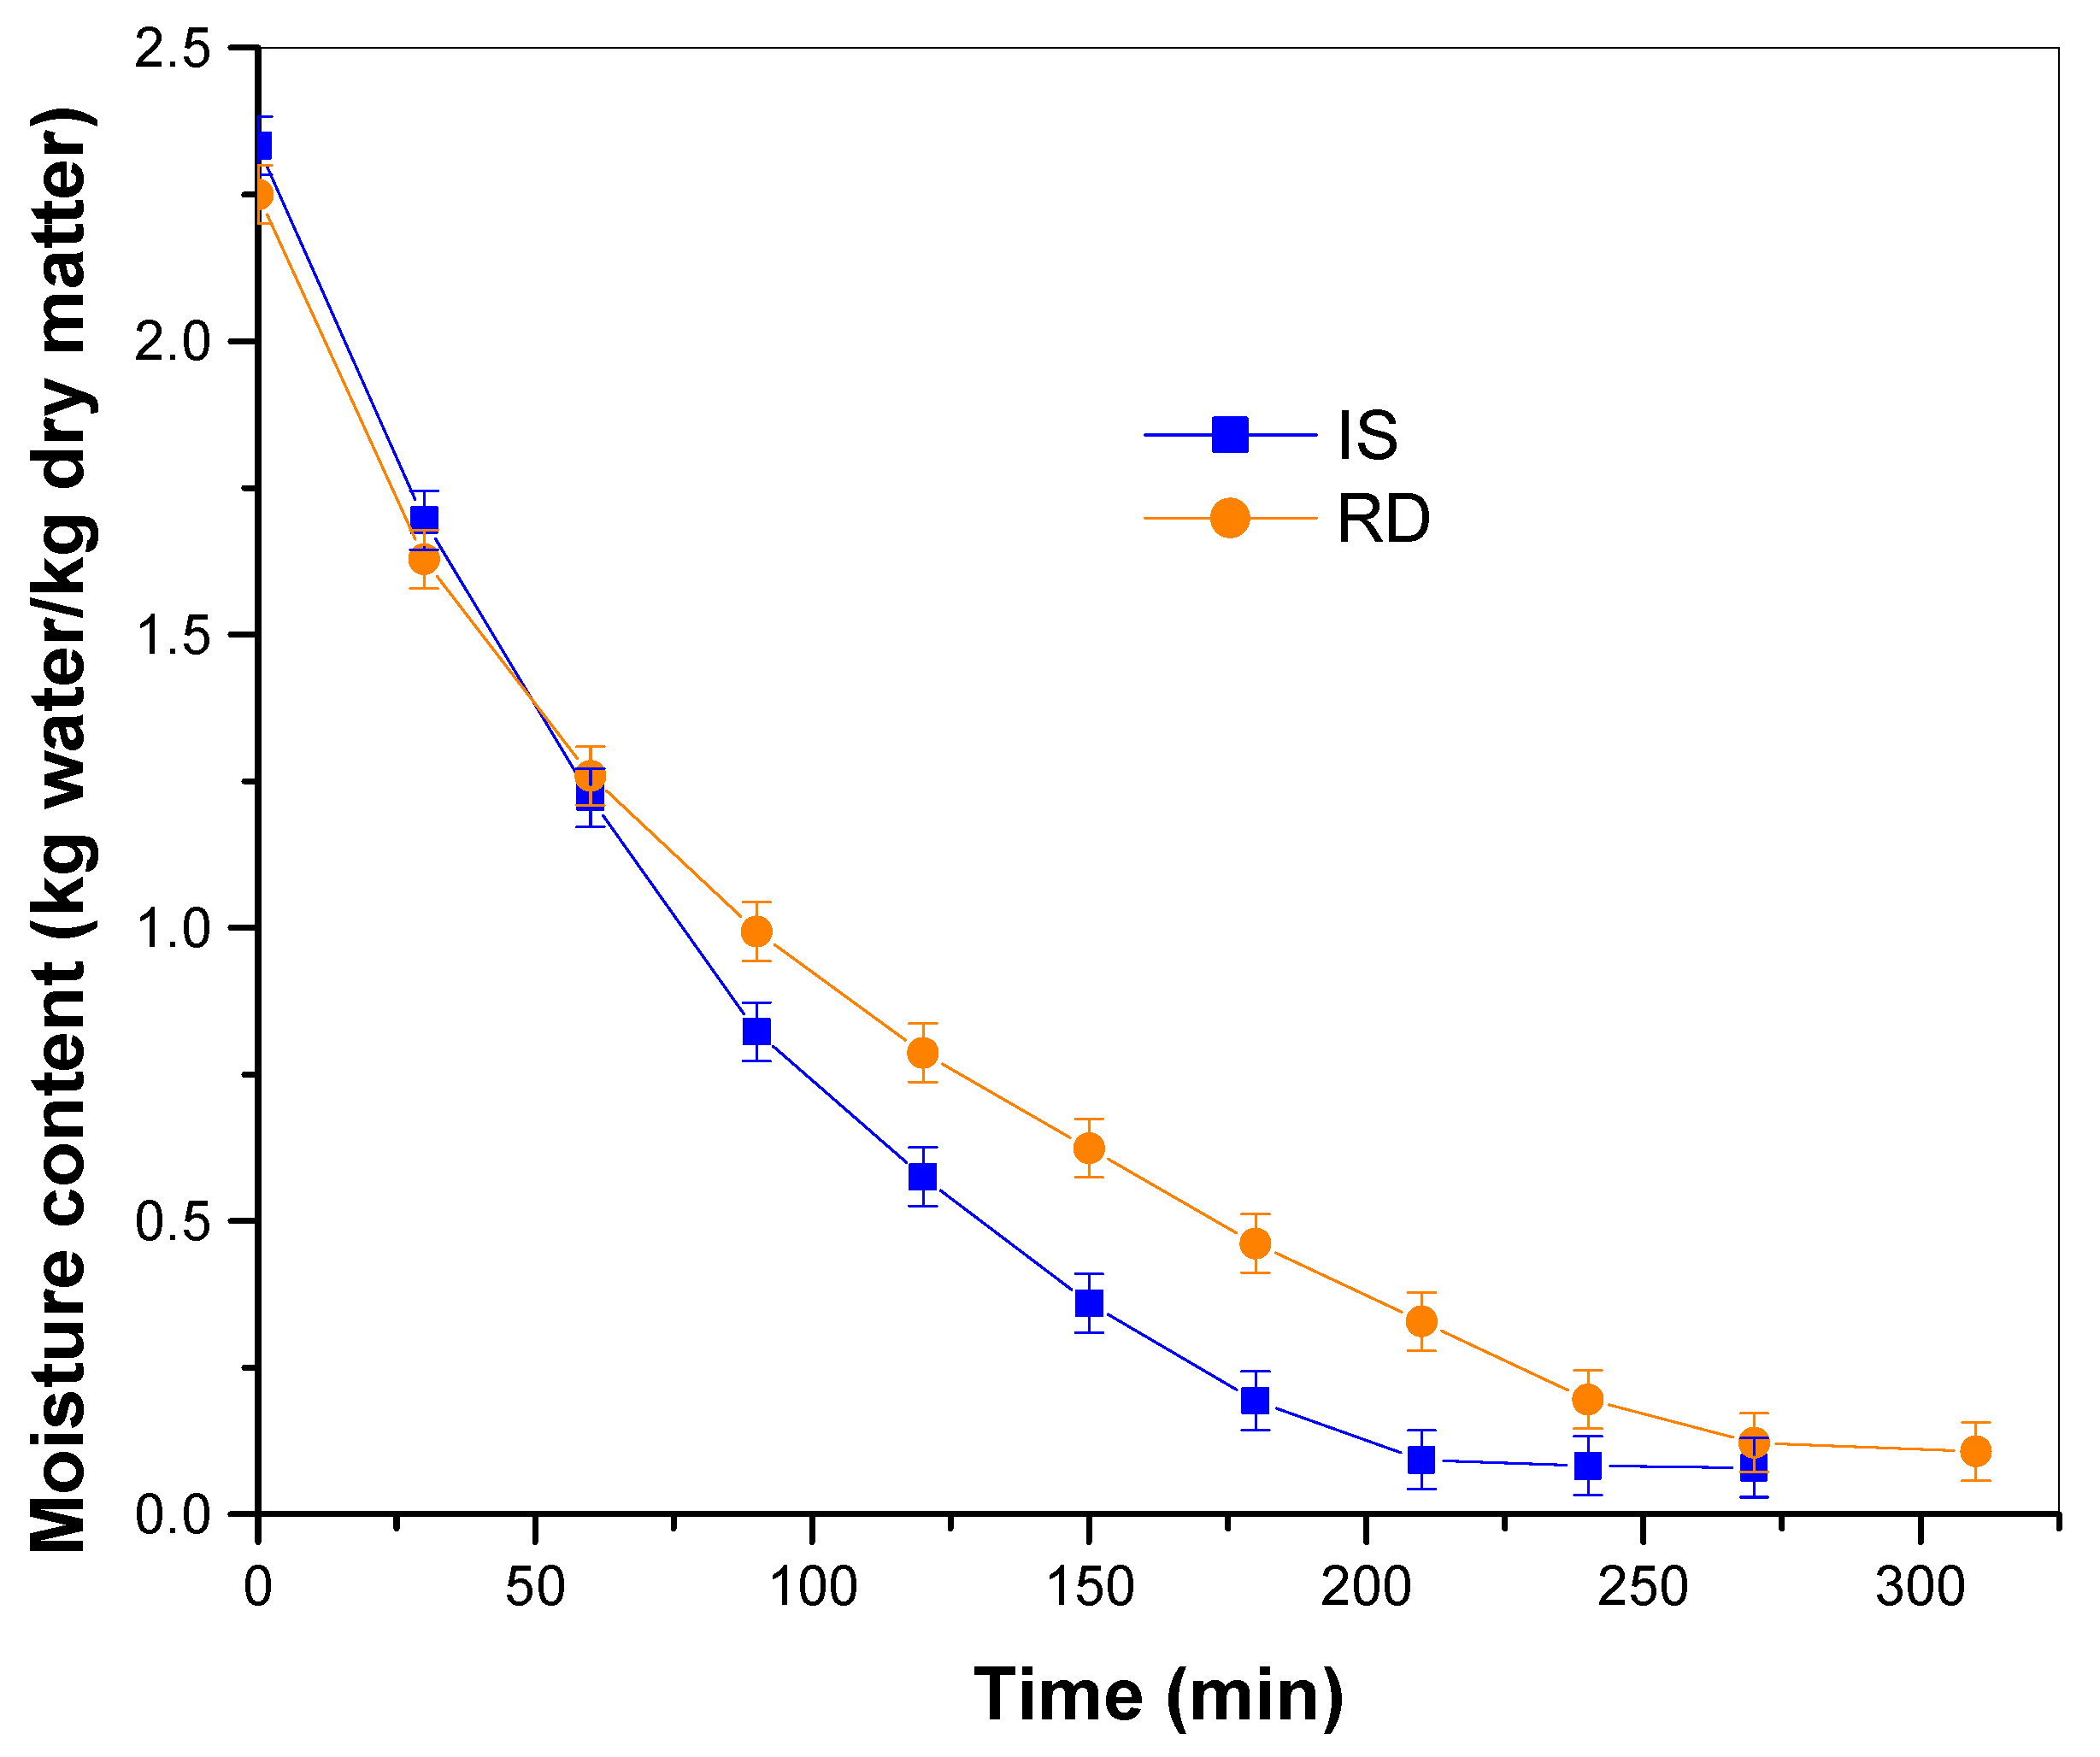
3.4. Solar Drying Kinetics

Figure 8 presents the moisture content in a dried basis of drying systems during an experimental day. The drying process finishes at 240 min in the IS, while the RD requires 330 min to stabilize the moisture of the orange leaves. As a result, the IS reaches a minimum moisture content of 0.079 ± 0.013 kg water/kg∙dry matter, while the RD reaches a 0.101 ± 0.015 kg water/kg∙dry matter.
Figure 9 illustrates the drying rates as a function of moisture content. The highest drying rate was achieved with the IS (0.021 g water/kg dry mater∙ min) at the beginning of the process.

3.5. Mathematical Modeling

Table 4 presents the experimental results and the coefficients and fit parameters of the mathematical models analyzed for the IS and RD. The Modified Page, Page, and Henderson and Pabis models show the best fit with experimental results for both dryers: for RD, R2 = 0.9980, 0.9980, and 0.9923, respectively, and for IS: R2 = 0.9974, 0.9974, and 0.9922. Thus, the moisture content at any time during the drying process can be reliably estimated. The graphical fitting can be seen in Figure 10.

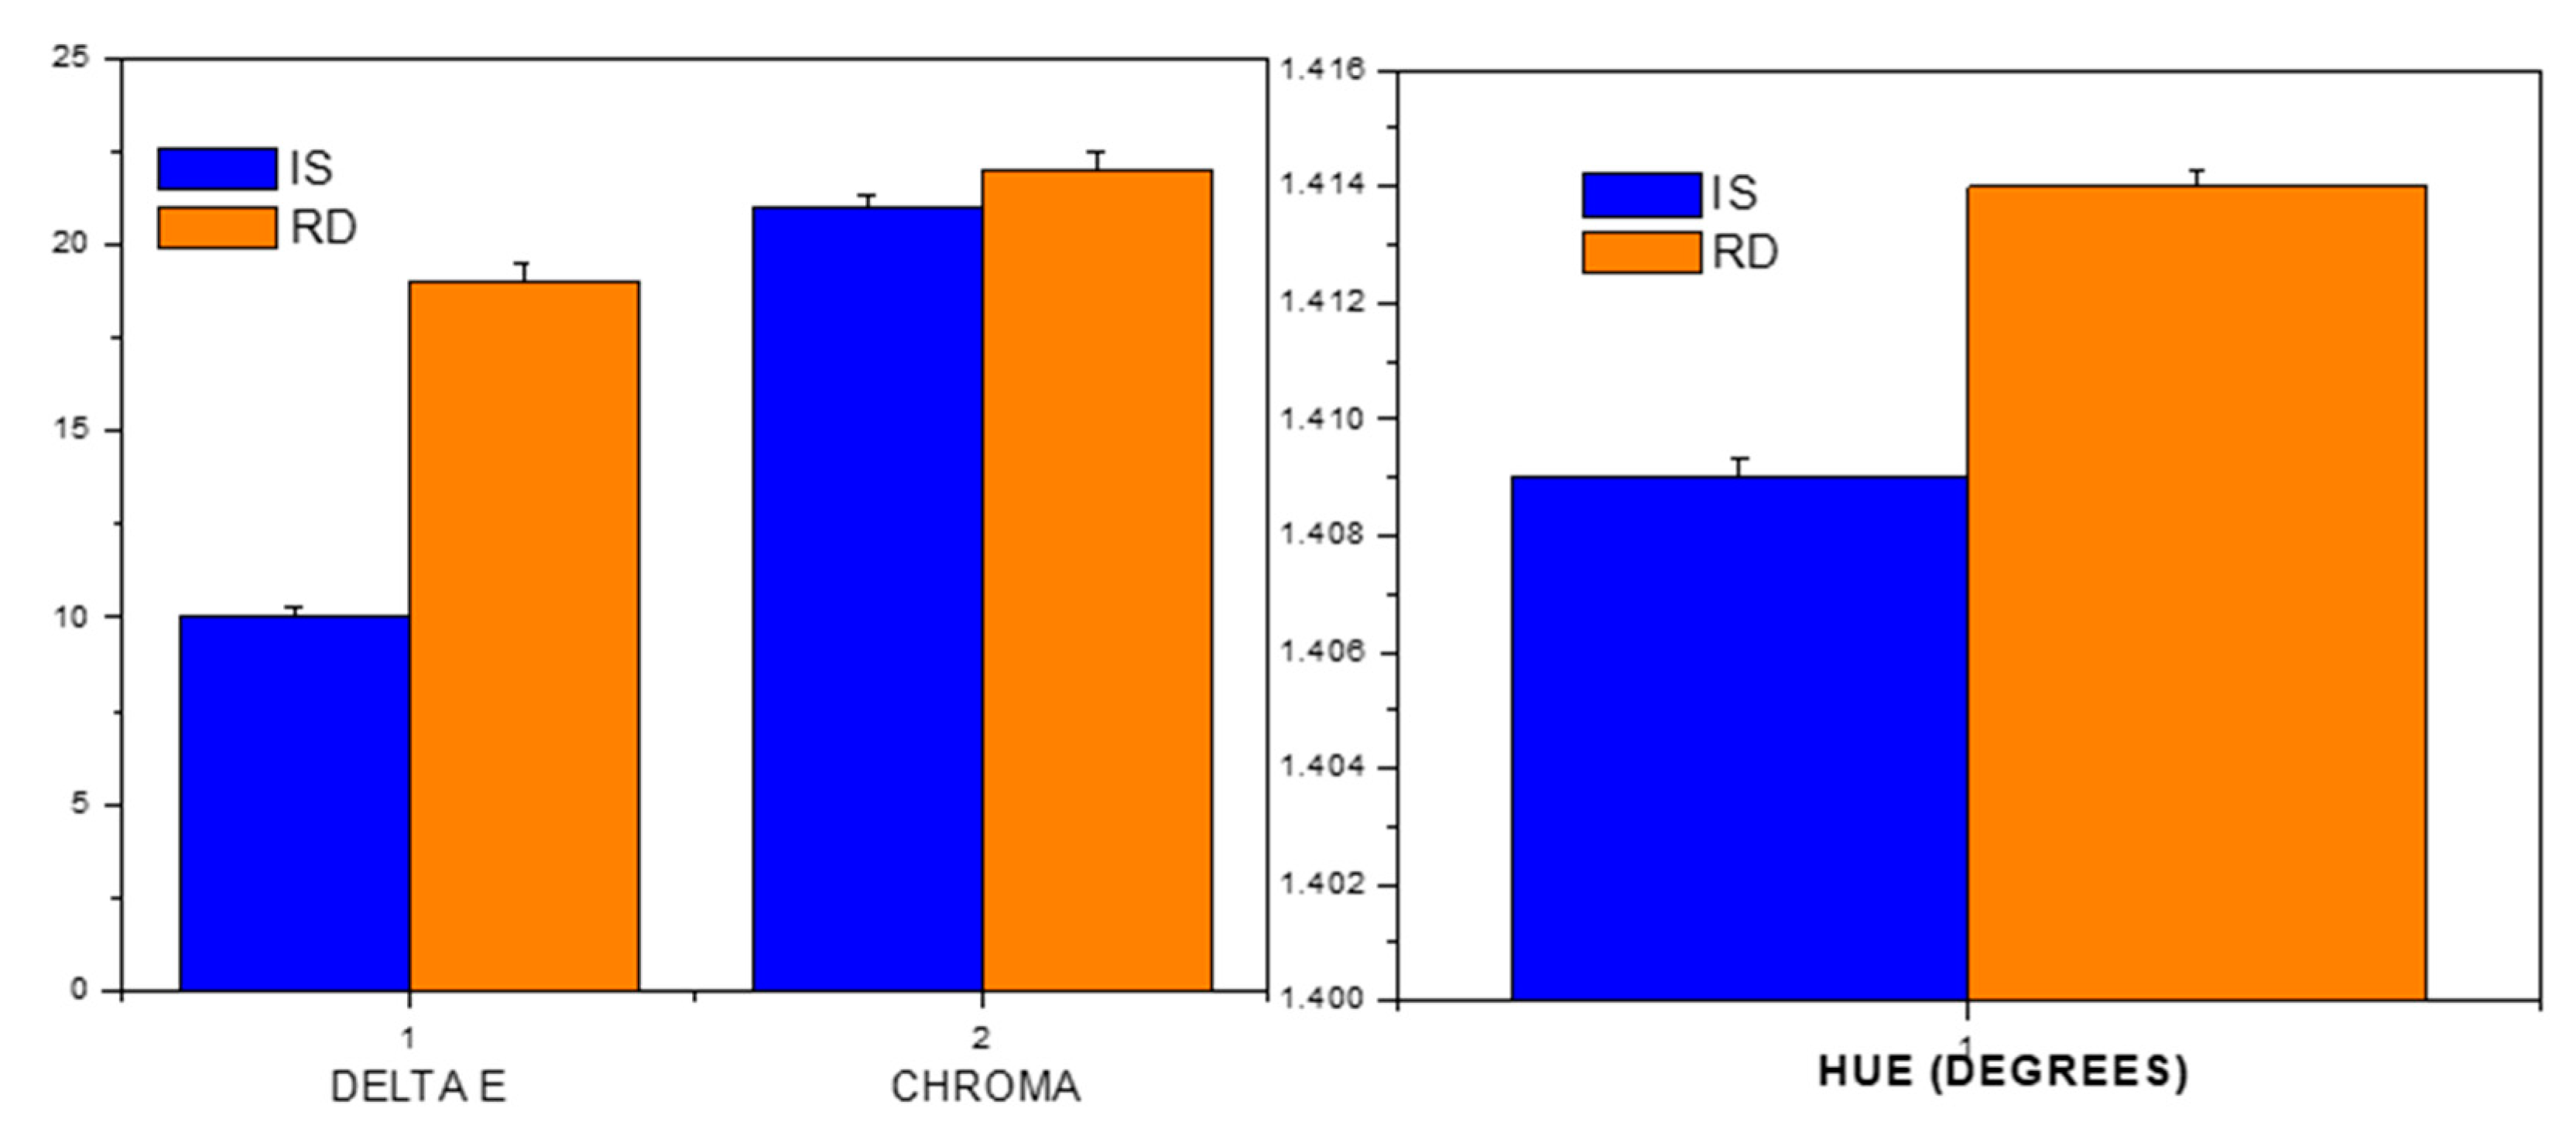
3.6. Colorimetric Study

The colorimetric analysis is reported in Table 5 with the measures before and after experimentation.
It can be observed that the a* and b* values augment with the leaves’ dehydration. Both the values of a* and b* are less affected in IS.
Figure 11 presents the values of C* and H* and ∆E. The values of H* are very close in the product in both dryers, and the color shifts toward red. Nevertheless, in the case of RD, the saturation is higher than that with the IS. Finally, the value of ΔE (total color change), based on Delta L*, C*, and H*, is higher using RD, indicating that the leaves’ green color is more protected with the IS.
The ΔE of the dried leaves with the IS (9.12) is lower than the RD (20.66).

4. Discussion

The initial and final humidity are similar in the two used technologies; however, the time required to reach moisture equilibrium was shorter in the IS.
According to Table 3, it can be seen that the final moisture was lower (9.7–7.37%) than those reported in commercial dehydrated products. The final water activity (aw = 0.49 for the RD and 0.40 for the IS) does not allow microbes’ growth in dry leaves [57,58].

4.1. Climatological Parameters

The RD system temperature is dependent on environmental factors. If the ambient temperature rises (or decreases), the chamber temperature rises (or decreases) as well. However, the IS system is more independent from environmental conditions.
Figure 4 shows that the IS chamber’s temperature remains more homogenous and independent of the received solar irradiance due to the dehumidifier system’s favorable temperature and humidity conditions.

4.2. Dehumidification Process

According to Figure 5, the IS system allows a reduction in the humidity of 90% in 1.2 h. This result constitutes a 50% reduction compared to the time that the RD needed to achieve this humidity.
Additionally, when the experiment was performed on a cloudy day (see Figure 6), the RD’s relative humidity exhibited fluctuations due to the time with an average of 36.6%. In contrast, the IS kept an almost constant value (17.4%), which represented a 47.5% reduction in RH. This result is relevant due to the IS’s independent performance in different weather conditions, enhancing the dried product’s quality.
The temperature and humidity conditions obtained in the IS are enhanced from those obtained in the RD. These conditions affect the drying kinetics, as well as the quality and final properties of the leaves.
The temperatures reached by the IS remained higher compared to the RD. This condition allows the IS to decrease the time to reach equilibrium moisture during drying because the temperature is essential to increase the drying rate (Figure 7).

4.3. Estimation of CO2 Emissions

According to the methodology used to calculate the emissions of the photovoltaic system, it is concluded that the IS is electrically sustainable and can avoid the emission of 266.04 kg of CO2 to the ambient every year.

4.4. Solar Drying Kinetics

As shown in Figure 8, the IS reached faster kinetics due to the high temperatures, achieving weight stability loss at 240 min, while the RD required 330 min. These temperatures are enough to obtain optimum drying in both cases compared with indirect solar drying technologies [59] and drying in an electric oven [60].
Figure 9 shows that constant-rate periods were not found in any of the cases, and the drying rates decrease continuously. As we can see, the drying rate is superior using the IS. The highest drying rate is 0.021 kg water/kg dry matter⋅min, with an initial and final moisture content of 2.333 and a 0.079 kg water/kg dry matter. The initial drying rate obtained using an RD is 0.0182 kg of water/kg of dry matter min with a final moisture content of 0.101 kg water/kg dry matter. In both cases, the drying chamber temperature oscillated between 50 and 65 degrees during the highest insolation hours. These results are in good agreement with [61], where the air’s velocity and humidity were changed.

4.5. Mathematical Modeling

Table 3 and Figure 10 show that there was a good agreement between experimental and predicted moisture ratios; thus, the moisture content at any time during the drying process can be reliably estimated with the selected mathematical models due to the high R2 obtained (between 0.9837 and 0.9982) and because X2 (0.00019–0.00154) and RMSE (between 0.0128 and 0.0379) were also low.
Newton’s model did not predict as well as the Page, Page modified, and Henderson and Pabis drying curves. The drying constant (k), which is a combination of drying transport properties, thermal conductivity, interface heat, and mass coefficients [40], increases typically when the drying temperature increases [45]; consequently, the k value is higher in the IS, due to the higher temperatures reached in its drying chamber.

4.6. Colorimetric Study

According to Table 4, the fresh green leaves’ color change from orange-red to yellow, indicating that the loss of chlorophyll was due to solar radiation exposure. From Figure 11, it can be seen that the value of ΔE (total color change), which is based on Delta L*, C*, and H*, is higher using the RD (20.66) than using the IS (9.12). Lower ΔE values indicate better color protection and are due to air convection into the IS and shorter exposure time to the solar irradiation (RD needed about 33% more time to reach weight loss stability), according to Salinas et al. [19].

5. Conclusions

In summary, we compared a regular solar dryer (RD) with a solar integrated dehumidifier system (IS) to analyze the humidity’s impact on the solar drying of orange leaves. The humidity reduction (from 85 to 10%) reduced the drying time from 5.5 h (with RD) to 4 h. Furthermore, the temperature was increased from 33.4 to 60 °C. In addition, the colorimetric study showed that the color was better preserved in the dried leaves using the IS due to the humidity reduction, where the ∆E value was 20.66 for the RD and 9.12 for the IS. Modified Page, Page and Henderson, and Pabis better represent the drying kinetics of bitter orange leaves (Citrus aurantium L.). It is found that the solar drying of bitter orange leaves can be performed in a humid climate with significant energy and processing time saving and obtaining good quality products by the IS used. The economic evaluation and how drying techniques influence the nutrient variation of bitter orange leaves should be analyzed to demonstrate the study’s applicability and the conservation of the bioactive components.

Author Contributions

Conceptualization, C.-G.J.d.J. and C.T.M.; Data curation: L.-Z.F.R. and V.-G.C.J.; Formal analysis, M.-P.G.A.; Investigation: C.T.M. and C.-T.B.; Methodology, C.-G.J.d.J., L.-Z.F.R. and V.-G.C.J.; Project administration: M.-P.G.A.; Validation, L.-Z.F.R.; Visualization: V.-G.C.J.; Writing—original draft, C.G.J.d.J. and C.T.M.; Writing—review & editing: C.-T.B. All authors have read and agreed to the published version of the manuscript.

Funding

This research received no external funding.

Institutional Review Board Statement

Not applicable.

Informed Consent Statement

Not applicable.

Acknowledgments

The authors would like to thank Megan van Dyke for providing writing assistance and proofreading the article.

Conflicts of Interest

The authors declare no conflict of interest.

References

  1. Mendoza, F.; Dejmek, P.; Aguilera, J.M. Calibrated color measurements of agricultural foods using image analysis. Postharvest Biol. Technol. 2006, 41, 285–295. [Google Scholar] [CrossRef]
  2. Tunde-Akintunde, T.Y.; Ogunlakin, G.O. Influence of drying conditions on the effective moisture diffusivity and energy requirements during the drying of pretreated and untreated pumpkin. Energy Convers. Manag. 2011, 52, 1107–1113. [Google Scholar] [CrossRef]
  3. Fudholi, A.; Othman, M.; Ruslan, M.H.; Yahya, M.; Zaharim, A.; Sopian, K. The effects of drying air temperature and humidity on the drying kinetics of seaweed. In Proceedings of the 4th WSEAS International Conference on Energy and Development- Environment- Bomedicine, Corfu Island, Greece, 14–16 July 2011; pp. 129–133. [Google Scholar]
  4. Allaf, T.; Allaf, K. (Eds.) Instant Controlled Pressure Drop (D.I.C.) in Food Processing, From Fundamental to Industrial Applications; Springer: La Rochelle, France, 2014; ISBN 9781461486688. [Google Scholar]
  5. Estrada, J.A.; Litchfield, J.B. High humidity drying of corn: Effect on drying rate and product quality. Dry. Technol. 1993, 11, 65–84. [Google Scholar] [CrossRef]
  6. Lim-Law, C.; Mujumdar, A.S. Energy Efficiency and Energy Saving in Drying. In Drying of Foods, Vegetables and Fruits; Jangam, S.V., Law, C.L., Mujumdar, A.S., Eds.; Singatur: Godalming, UK, 2010; pp. 147–154. ISBN 9789810867591. Available online: https://www.yumpu.com/en/document/read/31827931/drying-of-foods-vegetables-and-fruits-volume-3-national (accessed on 19 August 2021).
  7. Liu, H.; Yousaf, K.; Chen, K.; Fan, R.; Liu, J.; Soomro, S.A. Design and Thermal Analysis of an Air Source Heat Pump Dryer for Food Drying. Sustainability 2018, 10, 3216. [Google Scholar] [CrossRef] [Green Version]
  8. Muftah, A.F.; Alghoul, M.A.; Fudholi, A.; Abdul-Majeed, M.M.; Sopian, K. Factors affecting basin type solar still productivity: A detailed review. Renew. Sustain. Energy Rev. 2014, 32, 430–447. [Google Scholar] [CrossRef]
  9. Allaf, K. Transfer Phenomena and Industrial Applications, 1st ed.; Lebanese University, Faculty of Science: Hadath, Lebano, 1982. [Google Scholar]
  10. López-vidaña, E.C.; César-Munguía, A.L.; García-Valladares, O.; Pilatowsky Figueroa, I.; Brito Orosco, R. Thermal performance of a passive, mixed-type solar dryer for tomato slices (Solanum lycopersicum). Renew. Energy 2020, 147, 845–855. [Google Scholar] [CrossRef]
  11. Castillo-Téllez, B.; Pilatowsky Figueroa, I.; Castillo Téllez, M.; Marzoug, R.; Allaf, K. Experimental analysis of saline diffusion during saltwater freezing for desalination purposes. Water Environ. J. 2020, 34, 929–936. [Google Scholar] [CrossRef]
  12. Şevik, S.; Aktaş, M.; Dolgun, E.C.; Arslan, E.; Tuncer, A.D. Performance analysis of solar and solar-infrared dryer of mint and apple slices using energy-exergy methodology. Sol. Energy 2019, 180, 537–549. [Google Scholar] [CrossRef]
  13. FAO Dried Fruit. Available online: http://www.fao.org/3/au111e/au111e.pdf (accessed on 19 August 2021).
  14. Castillo-Téllez, M.; Pilatowsky-Figueroa, I.; López-Vidaña, E.C.; Sarracino-Martínez, O.; Hernández-Galvez, G. Dehydration of the red chilli (Capsicum annuum L., costeño) using an indirect-type forced convection solar dryer. Appl. Therm. Eng. 2017, 114, 1137–1144. [Google Scholar] [CrossRef]
  15. Prakash, O.; Kumar, A. Historical review and recent trends in solar drying systems. Int. J. Green Energy 2013, 10, 690–738. [Google Scholar] [CrossRef]
  16. Toĝrul, I.T.; Pehlivan, D. Modelling of thin layer drying kinetics of some fruits under open-air sun drying process. J. Food Eng. 2004, 65, 413–425. [Google Scholar] [CrossRef]
  17. Lakshmi, D.V.N.; Muthukumar, P.; Layek, A.; Nayak, P.K. Drying kinetics and quality analysis of black turmeric (Curcuma caesia) drying in a mixed mode forced convection solar dryer integrated with thermal energy storage. Renew. Energy 2018, 120, 23–34. [Google Scholar] [CrossRef]
  18. Demissie, P.; Hayelom, M.; Kassaye, A.; Hailesilassie, A.; Gebrehiwot, M.; Vanierschot, M. Design, development and CFD modeling of indirect solar food dryer. Energy Procedia 2019, 158, 1128–1134. [Google Scholar] [CrossRef]
  19. Salinas, J.G.; Alvarado, J.A.; Bergenståhl, B.; Tornberg, E. The influence of convection drying on the physicochemical properties of yacón (Smallanthus sonchifolius). Heat Mass Transf. und Stoffuebertragung 2018, 54, 2951–2961. [Google Scholar] [CrossRef] [Green Version]
  20. Krokida, M.K.; Karathanos, V.T.; Maroulis, Z.B.; Marinos-Kouris, D. Drying kinetics of some vegetables. J. Food Eng. 2003, 59, 391–403. [Google Scholar] [CrossRef]
  21. Putra, R.N.; Ajiwiguna, T.A. Influence of Air Temperature and Velocity for Drying Process. Procedia Eng. 2017, 170, 516–519. [Google Scholar] [CrossRef]
  22. Pu, H.; Li, Z.; Hui, J.; Raghavan, G.S.V. Effect of relative humidity on microwave drying of carrot. J. Food Eng. 2016, 190, 167–175. [Google Scholar] [CrossRef]
  23. Ju, H.-Y.; Zhao, S.-H.; Mujumdar, A.S.; Fang, X.-M.; Gao, Z.-J.; Zheng, Z.-A.; Xiao, H.-W. Energy efficient improvements in hot air drying by controlling relative humidity based on Weibull and Bi-Di models. Food Bioprod. Process. 2018, 111, 20–29. [Google Scholar] [CrossRef]
  24. Lee, S.J.; Boonsupthip, W. Mathematical Modeling of Browning Induction Period in Drying Onion as Influenced by Temperature, Equilibrium Relative Humidity, and Inhibitor. Dry. Technol. 2015, 33, 120–127. [Google Scholar] [CrossRef]
  25. Ju, H.-Y.; El-Mashad, H.M.; Fang, X.-M.; Pan, Z.; Xiao, H.-W.; Liu, Y.-H.; Gao, Z.-J. Drying characteristics and modeling of yam slices under different relative humidity conditions. Dry. Technol. 2016, 34, 296–306. [Google Scholar] [CrossRef]
  26. Li, X.; Liu, Y.; Gao, Z.; Xie, Y.; Wang, H. Computer vision online measurement of shiitake mushroom (Lentinus edodes) surface wrinkling and shrinkage during hot air drying with humidity control. J. Food Eng. 2021, 292, 110253. [Google Scholar] [CrossRef]
  27. Raju, R.; Heyes, J.; Archer, R.; Chen, Q. Drying behaviour of fermented Fijian Theobroma cacao using dehumidified air. AIP Conf. Proc. 2019, 2199, 20001. [Google Scholar] [CrossRef]
  28. Dai, J.W.; Rao, J.Q.; Wang, D.; Xie, L.; Xiao, H.W.; Liu, Y.H.; Gao, Z.J. Process-Based Drying Temperature and Humidity Integration Control Enhances Drying Kinetics of Apricot Halves. Dry. Technol. 2015, 33, 365–376. [Google Scholar] [CrossRef]
  29. Assoa, Y.B.; Sauzedde, F.; Boillot, B.; Boddaert, S. Development of a building integrated solar photovoltaic/thermal hybrid drying system. Energy 2017, 128, 755–767. [Google Scholar] [CrossRef]
  30. Ceylan, I.; Kaya, M.; Gürel, A.E.; Ergun, A. Energy Analysis of a New Design of a Photovoltaic Cell-Assisted Solar Dryer. Dry. Technol. 2013, 31, 1077–1082. [Google Scholar] [CrossRef]
  31. Ziaforoughi, A.; Esfahani, J.A. A salient reduction of energy consumption and drying time in a novel PV-solar collector-assisted intermittent infrared dryer. Sol. Energy 2016, 136, 428–436. [Google Scholar] [CrossRef]
  32. Cámara de Diputados Reglamento de la ley de Transición Energética; Diario Oficial de la Federación: Ciudad de México, Méxco, 2017; pp. 1–13.
  33. Castro, A.M.; Mayorga, E.Y.; Moreno, F.L. Mathematical modelling of convective drying of fruits: A review. J. Food Eng. 2018, 223, 152–167. [Google Scholar] [CrossRef]
  34. Kumar, D.; Tarafdar, A.; Kumar, Y.; Badgujar, P.C. Intelligent modeling and detailed analysis of drying, hydration, thermal, and spectral characteristics for convective drying of chicken breast slices. J. Food Process Eng. 2019, 42, 1–14. [Google Scholar] [CrossRef]
  35. López-Vidaña, E.C.; Castillo Téllez, M.; Pilatowsky Figueroa, I.; Santis Espinosa, L.F.; Castillo-Téllez, B. Moisture sorption isotherms, isosteric heat, and Gibbs free energy of stevia leaves. J. Food Process. Preserv. 2021, 45, 1–11. [Google Scholar] [CrossRef]
  36. Radhika, G.B.; Satyanarayana, S.V.; Rao, D.G. Mathematical model on thin layer drying of finger millet (Eluesine coracana). Adv. J. Food Sci. Technol. 2011, 3, 127–131. [Google Scholar]
  37. Greenhouse Gas Protocol Global Emission Model for Integrated Systems (GEMIS). Available online: https://ghgprotocol.org/Third-Party-Databases/GEMIS (accessed on 19 August 2021).
  38. Reich, N.H.; Alsema, E.A.; Van Sark, W.G.J.H.M.; Nieuwlaar, E. CO2 Emissions of PV in the perspective of a Renewable Energy Economy. In Proceedings of the 22nd European Photovoltaic Solar Energy Conference and Exhibition, Milan, Italy, 3–7 September 2007; pp. 3538–3542. [Google Scholar]
  39. Castrejón, A.; Santamaría, G. Instalaciones Solares Fotovoltaicas. 2010. Available online: https://www.todostuslibros.com/libros/instalaciones-solares-fotovoltaicas_978-84-9771-655-0 (accessed on 19 August 2021).
  40. Erbay, Z.; Icier, F. A review of thin layer drying of foods: Theory, modeling, and experimental results. Crit. Rev. Food Sci. Nutr. 2010, 50, 441–464. [Google Scholar] [CrossRef]
  41. Ozdemir, M.; Devres, Y.O. The thin layer drying characteristics of hazelnuts during roasting. Food Sci. Technol. Res. 2000, 42, 225–233. [Google Scholar] [CrossRef]
  42. Akpinar, E.K.; Bicer, Y. Modelling of thin layer drying kinetics of sour cherry in a solar dryer and under open Sun. J. Sci. Ind. Res. (India) 2007, 66, 764–771. [Google Scholar] [CrossRef]
  43. Madamba, P.S. Thin layer drying models for osmotically pre-dried young coconut. Dry. Technol. 2003, 21, 1759–1780. [Google Scholar] [CrossRef]
  44. Castro-Muñoz, R.; Nieves-Segura, N. Sorption isotherms and isosteric heat estimation of purple cactus pear (Opuntia stricta) juice embedded in gelatin–maltodextrin matrix. J. Food Process Eng. 2018, 41, 1–7. [Google Scholar] [CrossRef]
  45. Tunde-Akintunde, T.Y. Mathematical modeling of sun and solar drying of chilli pepper. Renew. Energy 2011, 36, 2139–2145. [Google Scholar] [CrossRef]
  46. Page, G.E. Factors influencing the maximum rates of air drying shelled corn in thin layers. Master’s. Thesis, Purdue University, West Lafayette, IN, USA, 1949. [Google Scholar]
  47. Diamante, L.M.; Munro, P.A. Mathematical modelling of the thin layer solar drying of sweet potato slices. Sol. Energy 1993, 51, 271–276. [Google Scholar] [CrossRef]
  48. Henderson, S.M.; Pabis, S. Grain drying theory II: Temperature effects on drying coefficients. J. Agric. Eng. Res. 1961, 6, 169–174. [Google Scholar]
  49. Togrul, I.T.; Pehlivan, D. Mathematical modelling of solar drying of apricots in thin layers. J. Food Eng. 2002, 55, 209–216. [Google Scholar] [CrossRef]
  50. Koua, K.B.; Fassinou, W.F.; Gbaha, P.; Toure, S. Mathematical modelling of the thin layer solar drying of banana, mango and cassava. Energy 2009, 34, 1594–1602. [Google Scholar] [CrossRef]
  51. Sharaf-Eldeen, Y.I.; Blaisdell, J.L.; Hamdy, M.Y. A Model for Ear Corn Drying. Trans. ASAE 1980, 23, 1261–1265. [Google Scholar] [CrossRef]
  52. Wang, C.Y.; Singh, R.P. A single layer drying equation for rough rice. Am. Soc. Agric. Eng. 1978, 3001. [Google Scholar] [CrossRef]
  53. Midilli, A.; Kucuk, H.; Yapar, Z. A new model for single-layer drying. Dry. Technol. 2002, 20, 1503–1513. [Google Scholar] [CrossRef]
  54. Kaleta, A.; Górnicki, K. Some remarks on evaluation of drying models of red beet particles. Energy Convers. Manag. 2010, 51, 2967–2978. [Google Scholar] [CrossRef]
  55. Guiné, R.P.F.; Barroca, M.J. Effect of drying treatments on texture and color of vegetables (pumpkin and green pepper). Food Bioprod. Process. 2012, 90, 58–63. [Google Scholar] [CrossRef]
  56. Muvunzi, R.; Dimitrov, D.; Matope, S.; Harms, T. Heat transfer in a hot stamping process: A review. R&D J. 2017, 33, 75–84. [Google Scholar]
  57. Jayendra Kumar, A.; Singh, R.R.B.; Patil, G.R.; Patel, A.A. Effect of temperature on moisture desorption isotherms of kheer. LWT- Food Sci. Technol. 2005, 38, 303–310. [Google Scholar] [CrossRef]
  58. Barbosa-Canovas, V.; Fontana, A.J.; Schidt, S.J.; Labuza, T.P. Water Activity in Foods. Fundamentals and Applications, 1st ed.; Blackwell Publishing: Ames, IA, USA, 2007; ISBN 9780813824086. [Google Scholar]
  59. Kaya, A.; Aydin, O. An experimental study on drying kinetics of some herbal leaves. Energy Convers. Manag. 2009, 50, 118–124. [Google Scholar] [CrossRef]
  60. Castillo Téllez, M.; Pilatowsky Figueroa, I.; Castillo Téllez, B.; López Vidaña, E.C.; López Ortiz, A. Solar drying of Stevia (Rebaudiana Bertoni) leaves using direct and indirect technologies. Sol. Energy 2018, 159, 898–907. [Google Scholar] [CrossRef]
  61. Mohamed, L.A.; Kouhila, M.; Jamali, A.; Lahsasni, S.; Kechaou, N.; Mahrouz, M. Single layer solar drying behaviour of citrus aurantium leaves under forced convection. Energy Convers. Manag. 2005, 46, 1473–1483. [Google Scholar] [CrossRef]
Figure 1. Experimental system of dehumidification and air heating.
Sustainability 13 09393 g001
Figure 2. Weighing process.
Sustainability 13 09393 g002
Figure 3. Schematic diagram of Dehumidification System.
Sustainability 13 09393 g003
Figure 4. Solar irradiance and temperatures in the dryers.
Sustainability 13 09393 g004
Figure 5. Relative humidity during the test.
Sustainability 13 09393 g005
Figure 6. Solar irradiance and relative humidity on a cloudy day.
Sustainability 13 09393 g006
Figure 7. Temperature evolution on dryers and environment on a cloudy day.
Sustainability 13 09393 g007
Figure 8. Drying kinetics of orange leaves on IS and RD.
Sustainability 13 09393 g008
Figure 9. Drying rate as a function of moisture content.
Sustainability 13 09393 g009
Figure 10. Moisture ratio versus drying time and fitting models with the RD (a) and IS (b).
Sustainability 13 09393 g010
Figure 11. Variation of ΔE, C* and H* indirect solar drying with and without dehumidification system.
Sustainability 13 09393 g011
Table 1. Weather station’s instruments specifications.
VARIABLEDESCRIPTIONMODELACCURACY
Global solar irradianceLI-COR PyranometerLI-200RAzimuth: <±1% on 360° to 45° of elevation
Relative humidityNRG SystemsRH-5X±3%
Ambient temperatureNRG Systems110S±1.1 °C
Wind velocity and directionNRG Systems
Wind sensor
Series #200P
P2546C-OPR
±3°
±0.3 m/s
Table 2. Mathematical models used.
ModelEquationReference
Newton M R = exp   ( k t ) [45]
Page M R = e x p ( k t n ) [46]
Modified page M R = e x p ( ( k t ) n ) [47]
Henderson and Pabis M R = a   e x p ( k t ) [48]
Logarithmic M R = a exp ( k t ) + c [49]
Two-term M R = a exp   ( k t ) + b   e x p   ( k 0 t ) [50]
Two-term exponential M R = a exp ( k t ) + ( 1 a )   e x p ( k a t ) [51]
Wang and Singh M R = 1 + a t + b t 2 [52]
Weibull M R = e x p ( ( t / b ) α ) [53]
Table 3. Initial and final humidity and water activity of orange leaves.
Drying Operation ModeRelative Humidity (%) Water Activity (aw)
InitialFinalInitialFinal
RD69.6 ± 1.59.7 ± 0.30.94 ± 0.020.49 ± 0.01
IS70.1 ± 1.47.37 ± 0.40.95 ± 0.020.40 ± 0.01
Table 4. Mathematical models coefficients and fit parameters for RD and IS drying.
Experiment ConditionModelParametersValueExperiment ConditionModelParametersValue
Regular DryerModified Page k0.8795Integrated systemModified Pagek1.2311
n1.4078n1.2522
Ra20.9980Ra20.9974
RMSE0.0128RMSE0.0135
χ22.039 × 10⁻⁴χ22.091 × 10⁻⁴
Pagek0.8346Pagek1.2974
n1.4078n1.2522
Ra20.9980Ra20.9974
RMSE0.0128RMSE0.0135
χ21.882 × 10⁻⁴χ22.091 × 10⁻⁴
Henderson and Pabisa1.0441Henderson and Pabisa1.0175
k0.966k1.317
Ra20.9844Ra20.9922
RMSE0.0358RMSE0.0234
χ21.478 × 10⁻³χ26.333 × 10⁻⁴
Newtonk0.9322Newtonk1.2989
Ra20.9825Ra20.9919
RMSE0.0379RMSE0.0239
χ20.00154χ20.00061
Table 5. Values obtained from L*, a*, b*, in fresh and dry orange leaves with regular dryer and integrated system.
Analyzed LeavesColor Parameter
L*a*b*
RD51.423.4221.64
IS36.053.0918.92
Raw material33.96−3.7213.21
Publisher’s Note: MDPI stays neutral with regard to jurisdictional claims in published maps and institutional affiliations.

