Article

Subsidy as An Economic Instrument for Environmental Protection: A Case of Global Fertilizer Use

by
Mathy Sane
1,*,
Miroslav Hajek
1,
Chukwudi Nwaogu
2,3 and
Ratna Chrismiari Purwestri
1
1
Faculty of Forestry and Wood Sciences, Czech University of Life Sciences Prague, Kamýcká 129, 16 500 Praha-Suchdol, Czech Republic
2
Department of Environmental Management, School of Environmental Sciences, Federal University of Technology, Owerri, P.M.B. 1526, Owerri 460114, Nigeria
3
Department of Forest Protection and Entomology, Czech University of Life Sciences Prague, Kamýcká 129, 16 500 Praha-Suchdol, Czech Republic
*
Author to whom correspondence should be addressed.
Sustainability 2021, 13(16), 9408; https://doi.org/10.3390/su13169408
Submission received: 22 June 2021 / Revised: 14 August 2021 / Accepted: 15 August 2021 / Published: 22 August 2021

Abstract

:
Fertilizer subsidies may constitute a key economic tool with which to provide food for the growing population. Therefore, this work aimed to (i) assess the effectiveness of subsidized chemical (NPK) fertilizer use in food production by comparing the crop output between developed and developing regions and (ii) examine the benefits of organic fertilizer and the need for its use in developing regions such as Africa. Secondary data from 2000 to 2019 on global subsidized fertilizer use, crop production, income, and other agro-environmental parameters, such as climate and soil, were collected from the international databases of the World Bank, Food and Agriculture Organization (FAO), Forest Resources Assessment (FRA), National Aeronautics and Space Administration (NASA), and World Income Inequalities Database (WID), as well as countries’ national statistics. Data were analyzed using qualitative, quantitative, and geospatial software and techniques, such as SPSS, averages, multivariate analysis, and spatial analytical Geographic Information System (GIS) tools. The results reveal that the total global fertilizer use continuously increased from 79 million tonnes in 2000 to 125 million tonnes in 2019. Subsidized fertilizer use and crop production increased with countries’ economic status. For example, countries or regions with more economic resources tended to have higher fertilizer subsidies. More than 95% of North American and European countries recorded the highest total chemical fertilizer use, ranging from 855,160 to 18,224,035 kg ha−1. In terms of organic fertilizer production, the percentage contribution in Africa relative to global production was only 2%, which was about 932,538 million tonnes below the production yield in North America. More organic fertilizer and less inorganic fertilizer should be encouraged instead of the total eradication of chemical fertilizers. This is especially applicable to developing countries, where food production is low due to poor soil and high food demand owing to a harsh environment and rapid population growth.

1. Introduction

Economic instruments for environmental protection are policy mechanisms that aim to improve and promote the sustainability or efficient use of environmental resources, affecting their allocation through price mechanisms [1]. Organization of Economic Cooperation and Development (OECD) countries have adopted many economic instruments for environmental regulation, which can be categorized as Charges (such as effluent charges, user charges, product charges, administrative charges, and tax differentiation), Subsidies (including tax credits and government subsidies), Deposit–Refund Systems (PET bottle deposit system and others), Market Creation (viz. transferable emission permit system and liability insurance), and Enforcement Incentives (including fines and rewards) [2]. It has been reported that Europe, North America, and most countries in Asia and Oceania have adopted these economic instruments to protect their environments [3,4,5,6,7,8,9,10,11,12,13,14,15,16,17]. These economic tools have been implemented more extensively in the developed world than in the developing world, even though developing countries need them the most because of their socioeconomic and environmental challenges [18]. Though economic instruments are essential in the management of the environment, they vary according to the specific area(s) of land use [19]. In this work, more attention is focused on agricultural or agro-environmental subsidies. Many programs have been developed by different governments to compensate farmers for embracing environmentally sustainable farming methods. Methods include specifications on the use (or refraining from the use) of fertilizers or pesticides, the use of specific seasonal crops, and the increased use of conservative agriculture [20]. The relative environmental advantage of an individual method is debatable. For example, while conventional agriculture, such as zero tillage, reduces soil erosion, it requires the intensive use of herbicides to control weeds. Similarly, refraining from the use of fertilizers or pesticides will, in the long run, favor the environment. However, farmers’ output and income might decrease, leading to poverty, shortages of food, or the cultivation of more land to compensate for these losses. On the other hand, an agricultural subsidy that supports farmers with fertilizer also has advantages and disadvantages.
Agricultural subsidies and policies can have economic and environmental impacts, including effects on agricultural production and farmers’ income [21,22]. Other authors have reported that agricultural subsidies can determine agricultural production by changing cropping areas [9]. On the other hand, a different group of researchers revealed that agricultural subsidies might prompt further agricultural specialization and improve agrarian output [23,24]. Some agricultural subsidies directly affect farmers’ income, whereas this income can be enhanced through agricultural productivity from subsidies [25,26]. It is essential to mention that studies on agricultural subsidies have placed greater focus on developed regions, especially countries that are members of the OECD, than developing regions [27]. In developed regions, agrarian support programs were first introduced and have been reasonably adopted and implemented on a large scale [28]. The benefits of agricultural subsidies, including fertilizer in developed countries, are evident in the corresponding crop output. For example, in 2014, about 40% of the European Union’s budget was spent on the agricultural sector, as this sector contributes to the gross domestic product (GDP) of the European Union. The actual agreement emanated from a key reform of the Common Agriculture Policy (CAP) in 2013. There are diverse social and environmental reasons for these subsidies, such as increasing and sustaining food security, boosting farmers’ income, and promoting the conservation and protection of land, soil, and water.
However, agricultural subsidies have been criticized as being a medium for wealth transfer to wealthy farmers and as providing inadequate support to poor farmers [26,29]. Though there is no reliable estimate on the subsidy rate that has harmful impacts on the environment [12,28,30,31], the broad range is approximated to be between USD 500 billion and 2000 billion per year [32,33]. These values also include non-agricultural subsidies, such as support for coal and fishing [33]. Quantifying data on environmental risks associated with agricultural subsidies such as fertilizer is cumbersome but not unattainable. Van Beers and de Moor [34] reported a remarkably valid estimate for the late 1990s. These authors reported that subsidies of USD 300 billion per year to agriculture were harmful to the environment. Furthermore, another study revealed that in the 15-year period after the government of New Zealand eradicated agricultural subsidies in the 1980s, the use of fertilizers and pesticides declined [16]. Similarly, by applying a general equilibrium approach, other authors were of the view that, in an open economy, abolishing agricultural subsidies and imposing nitrogen reduction subsidies can effectively improve farmers’ welfare and reduce nitrogen pollution [17]. The World Summit on Environmental Sustainability and Development called for many policy implementations and reforms, especially in the agricultural sector [35]. This meeting focused on the removal of subsidies that were deemed to have adverse effects on the sustainability of the environment. Since the summit, there has been increasing global awareness of the environmental harm that could arise from agricultural subsidies, including fertilizer [36]. To ameliorate these effects, many countries have pledged to reform subsidies that may threaten sustainable development. Based on this widely increasing range of international willingness to lower subsidies, one might rationally expect to see countries implementing these commitments and even pushing to eradicate subsidies with immediate effect. However, globally, the progress has been quite slow. This, however, is not surprising because, for socioeconomic and political reasons, once subsidies are in place, they are typically difficult to abolish. Indeed, according to the OECD [32], international experience has proved the difficulty of reforming subsidies.
In support of agricultural subsidies, many studies and reports have revealed that subsidies can be a reliable tool for sustainable development in agriculture [3,5,6,9,14,15,31]. Thus, some countries and regions have provided this sector with reasonable financial support. For example, available data from the OECD reveal that, in 2016, the European Union (EU28) spent at least USD 100 billion on the promotion and maintenance of agriculture, while the Chinese government provided a total of USD 223 billion to support the country’s agriculture [7]. Furthermore, between 2015 and 2017, South Korea, Japan, and the USA spent approximately USD 21 billion, USD 82 billion, and USD 46 billion, respectively, in support of the agricultural sector [7]. Fortunately, these financial commitments on the part of the government yielded positive results. For example, in China, total cereal production was reported to have increased rapidly from 286 Mt in 1981 to 573 Mt in 2015 [37]. This development was prompted by changes in farming systems and the application of fertilizers, as well as other inputs. Similarly, chemical fertilizer use in China (including N, K2O, and P2O5) increased 3.35-fold, from 15.27 Mt in 1981 to 51.12 Mt in 2015 [3,38]. A summary report from FAOSTAT confirmed that a global increase in crop production was mediated by a rise in the use of NPK fertilizers [39], and [40] revealed that N fertilizer in Europe increased from 4.37 Mt to 12.63 Mt. Similarly, crop production increased from 17.13 to 23.62 (GJ·ha−1·y−1) from 1961 to 2014, respectively. In addition, North America reported an increase from 3.16 Mt (in 1961) to 15.26 Mt (in 2014), while crop production rose from 16.90 to 42.55 GJ·ha−1·y−1. This information covers all continents, and it is comprehensively presented in Tables S1 and S2.
To close the global crop yield gaps and meet the United Nations sustainable development goal 2 on ‘eradicating hunger,’ developing nations need to follow developed countries by considering soil nutrient enrichment through subsidized fertilizer. One report showed that more than 11% of the world population is presently undernourished still, with at least 95% of this rate occurring in developing countries [41]. A worrisome but likely prospect is that this figure will be substantially exacerbated because, in developing nations, the population is rapidly growing in the context of increasing poverty, soil degradation, and low crop production [41].
It is known that any method adopted to improve food security, including increasing yields, will have to consider resource limitations and ecosystem sensitivity to changes, especially those related to essential nutrients [42,43]. Therefore, sustainable approaches, such as rapidly increasing the use of organic fertilizer and decreasing the use of inorganic fertilizer, must be well developed [44,45,46]. The integration of organic manure and inorganic fertilizer will enhance crop production and environmental sustainability [47,48,49]. This will promote access to essential nutrients, mainly NPK, since their low availability causes yield gaps [50,51]. Without regular fertilizer inputs, especially in the tropical soils of Africa, where continuous cultivation prevails, crops quickly exhaust soil nutrient stocks, leading to low yields [52]. In addition to cultivating in an unfavorable environment, most farmers in developing countries are poor and lack access to adequate organic and inorganic fertilizers [53,54]. For example, soil degradation in Africa has been largely attributed to the low use of nutrients, poor soil management, harsh climatic conditions, lack of consistent information about fertilizer price and use, high cost of fertilizer, inadequate use of organic manure, and inconsistent and unfavorable policies [55,56]. Studies have shown that the total quantity of NPK fertilizer use in Africa, excluding South Africa, has been less than 9 kg ha−1 [57]. This was also reflected in the total crop output per hectare when compared with regions where higher NPK fertilizer was applied [53,54,58]. Against this background, this work was developed with the aims of (i) assessing the effectiveness of subsidized chemical fertilizer use in food production by comparing the crop outputs between developed and developing regions and (ii) examining the benefits of organic fertilizer and the need for its use in developing regions such as Africa, where there is high demand for food coupled with an extreme environment and poor soil. The objectives of this work were addressed by answering the following questions: (i) Has subsidized NPK fertilizer increased crop production globally? (ii) Does crop production differ between developed and developing regions? (iii) What are the benefits of using organic fertilizer in developing regions such as Africa?

2. Materials and Methods

2.1. Data Collection

On a global scale, this study used secondary data from 2000 to 2019 on the most relevant parameters to investigate fertilizer subsidy as an economic instrument for preventing further deforestation and food shortage. Historically robust data were downloaded from the databases of FAO [56,57,58], International Fertilizer Association (IFA) [37], and the Forest Resources Assessment (FRA) Reports [59]. The data included subsidized NPK fertilizer and organic fertilizer use for agriculture. The data also included cropland cover, area covered by different crop types, and crop production. Data on income (PPP) per citizen and literacy rate were collected from the World Development Indicators of the World Bank [60,61,62] and the World Income Inequalities Database [62]. Data on environmental factors such as climate, soil pH, soil water-holding capacity (WHC), and soil texture were acquired from the National Aeronautics and Space Administration (NASA) [63], Global Soil Data Task Group (GSDTG) [64], and World Soil Information Service (WoSIS) [65].
Other sources of data for the study were the official National Bureau of Statistics and ministries of agriculture in various countries for the relevant study periods. Furthermore, online literature and publications were also consulted. The three major crop types included in the investigation were multiple or layered (multi-layered) crops, herbaceous crops, and woody crops. The main multi-layered crop species were bottle gourd, groundnut, banana, pumpkin, ash gourd, pawpaw, ridge gourd, marigold, tomatoes, bitter gourd, plantain, corn and oats, wheat, barley, soybean, sorghum, alfalfa, and many species of beans, including black-eye bean, green bean, and Dolichos bean. The common herbaceous crop species were lettuce (leaves), celery (stalks), carrot (roots), potato (tubers), onion (bulbs), and broccoli (flowers). On the other hand, the major woody crop species were almond shrubs, contorted hazelnut shrubs, porcelain berry, grapevines, plum, oranges, coconut, cashew nut, date palm, walnut, and apples.

2.2. Data Analysis

The data analysis involved qualitative, quantitative, and geospatial techniques. Percentages, sums, and averages were used to estimate the fertilizer use, cropland cover, area covered by different crop types, crop production, temperature, and precipitation. Multivariate analysis techniques were adopted for quantitative analyses, such as principal component analysis (PCA) and correlation. The geospatial data analysis techniques used involved spatial analytical GIS tools, which were used to map the global distributional trends of environmental parameters, NPK use, and crop production during the study period. PCA is a multivariate statistical technique that is used to reduce the number of parameters in a dataset by converting them into a smaller number of components, where each component is a linear weighted combination of the initial variables [66,67]. In this study, PCA was applied to reduce the data to the most significant parameters that were associated with crop production [68]. As a result, 24 parameters were reduced to the 14 most significant variables, including fertilizer use, crop production quantity, crop types, income, cropland cover, temperature, precipitation, soil pH, soil WHC, soil texture, GDP, food imports, food exports, and organic manure production. The SPSS statistical software was used to perform the correlation analysis of the investigated parameters. ArcGIS 10.7.1 was used for the spatial analysis and mapping of the global distribution and trends of parameters [69]. The data on subsidized fertilizers, crop production, and income were collected from the previously mentioned databases. They were arranged in a spreadsheet based on countries and regions. Thereafter, the values were exported into the ArcMap domain of ArcGIS via attribute tables for each parameter layer by using the editor’s tool. The geocoordinates of the countries were identified, and the map(s) were rectified. On the other hand, satellite images from NASA were used to quantify the cropland cover and environmental parameters, such as the climate and the soil. These images were downloaded and exported into the ArcMap environment. The images were rectified, and all necessary image processing and enhancement methods, such as image classifications, were performed as required. The symbology of each parameter’s layer was established, and the values for each inputted parameter were calibrated, while range values were created as applicable. This was followed by appropriate value adjustment and classification. Next, the colors for each mapped parameter were chosen to best suit the work. By using the map layout tool, the desired figures (maps) were produced, and legends were added after appropriate labeling. Finally, the figures (or maps) were exported and saved in either PDF, JPEG, or TIF format. Where necessary, the data were normalized in order to transform the values to the same unit of measurement, which is especially important when performing correlation analysis.

3. Results and Discussion

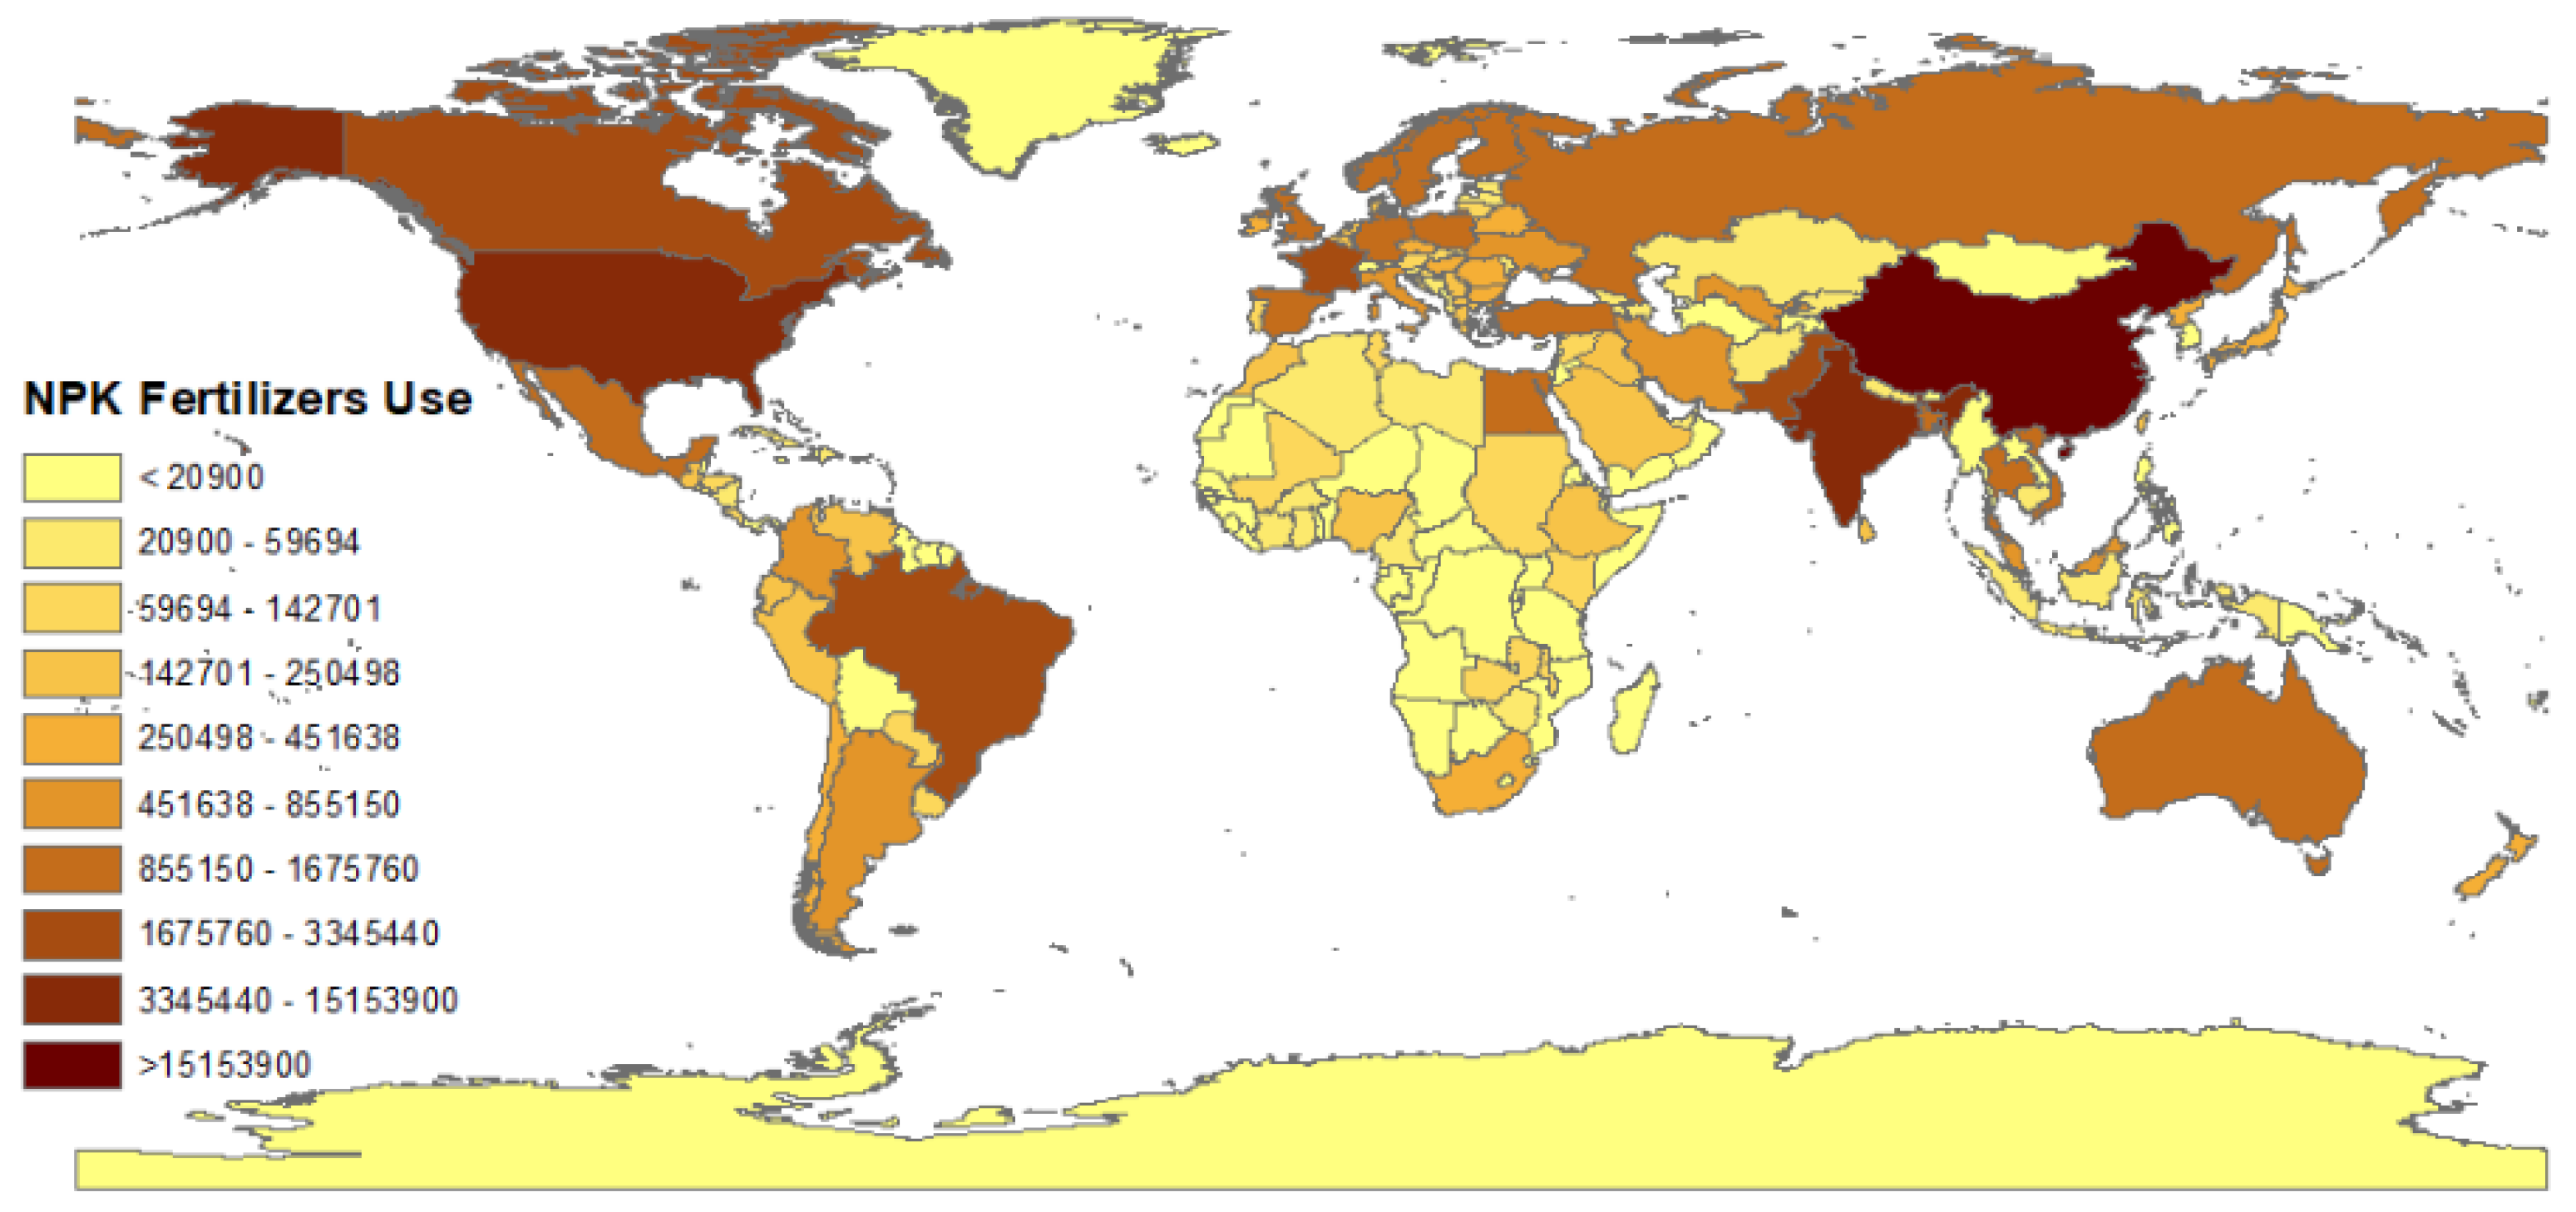
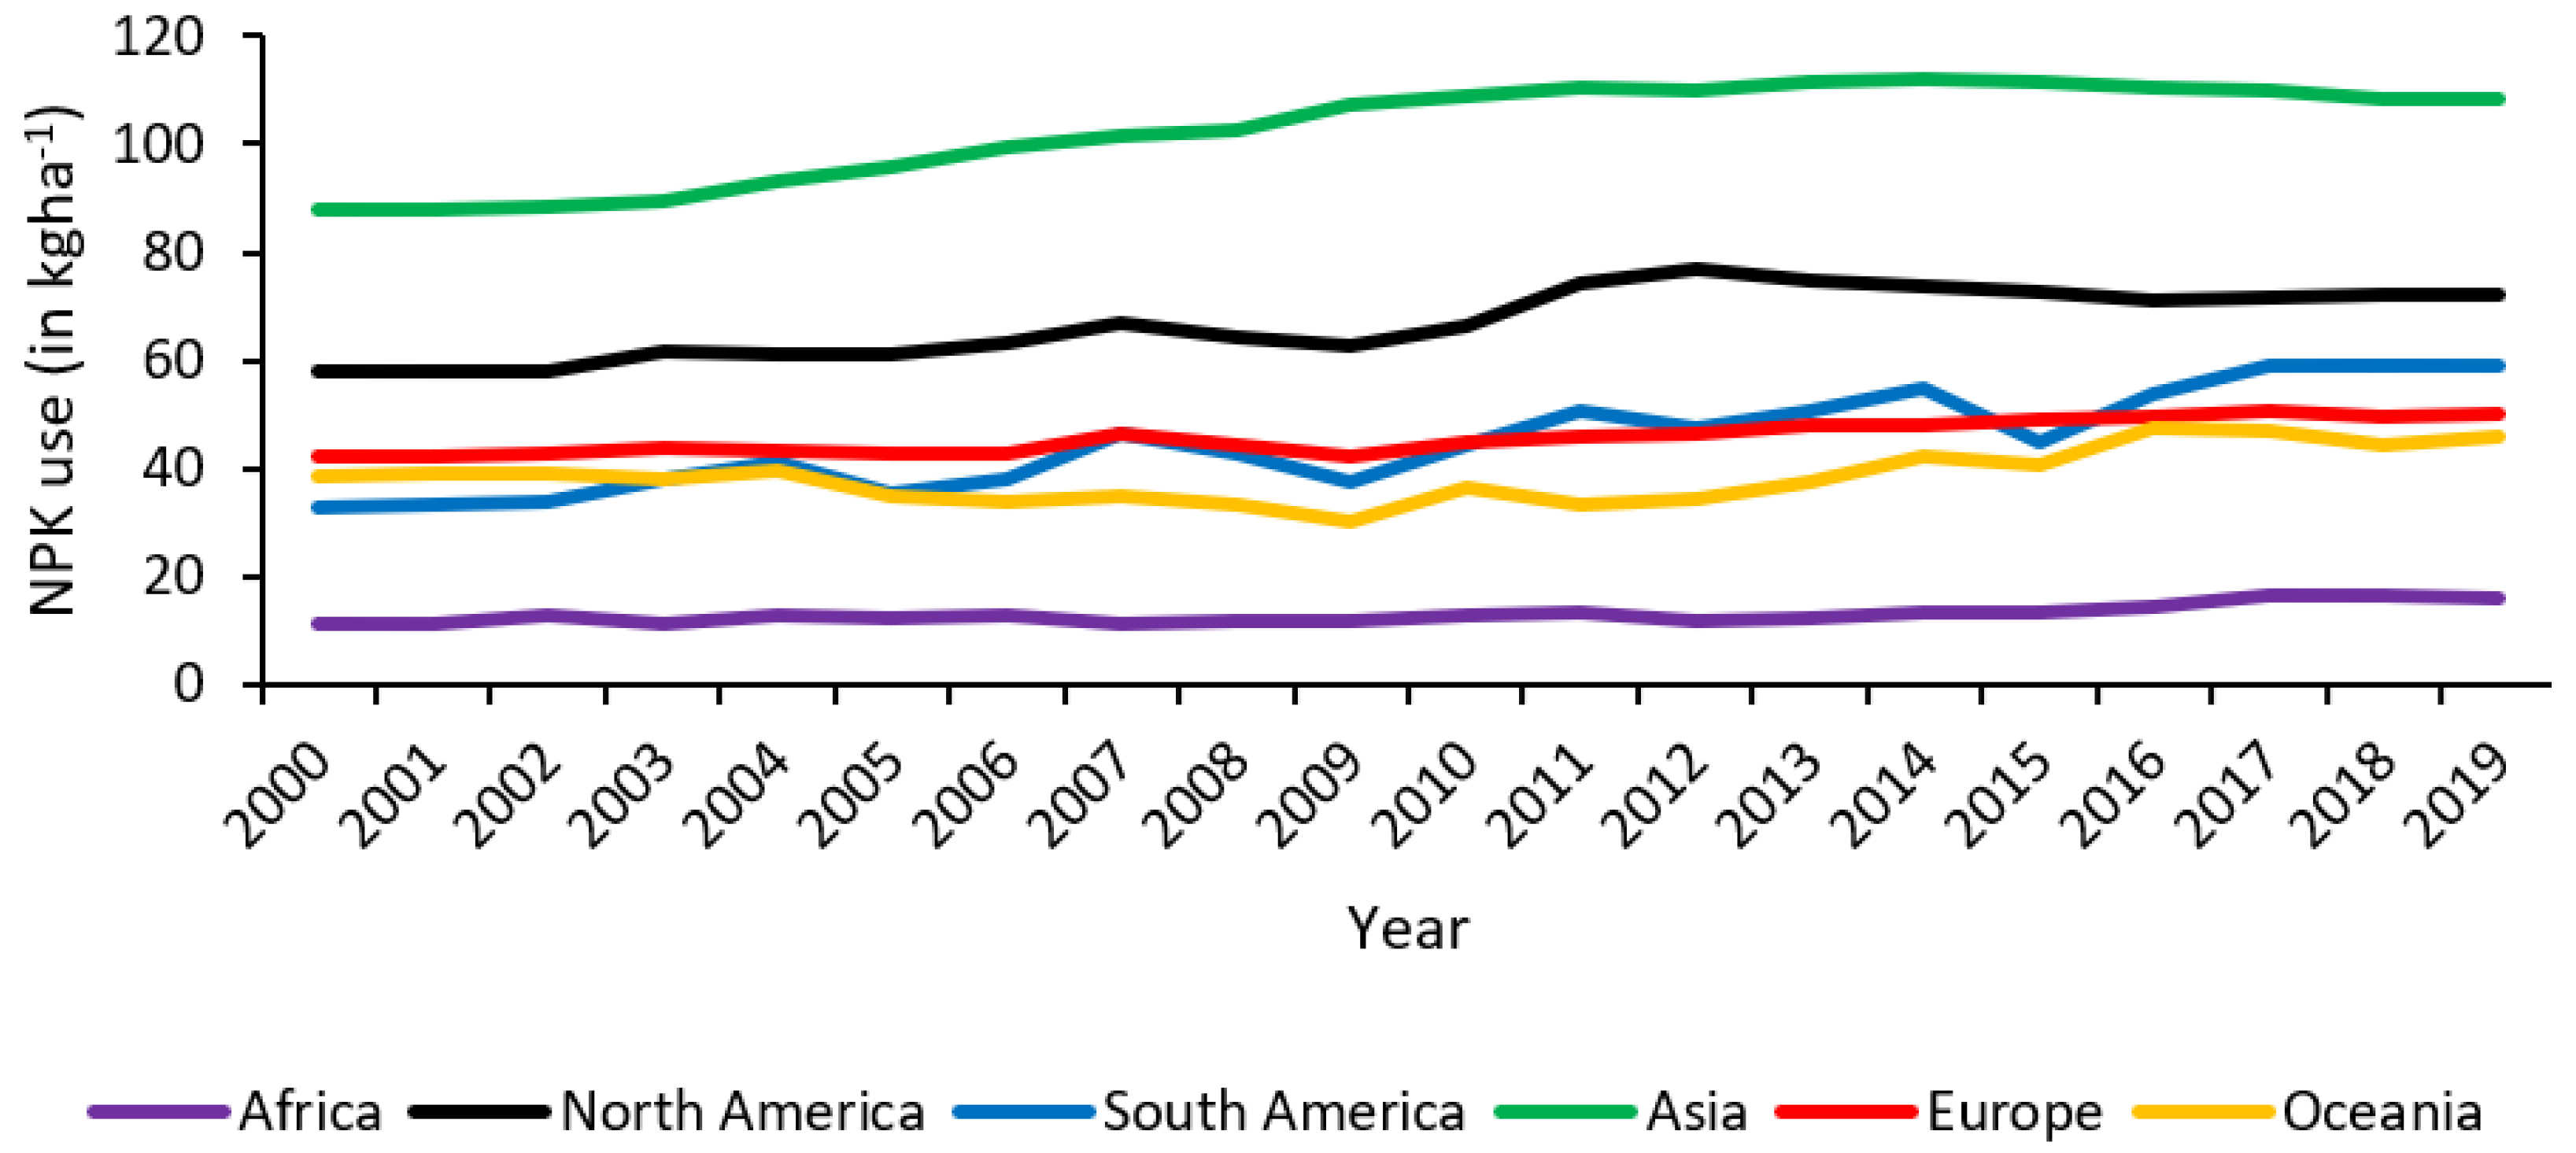
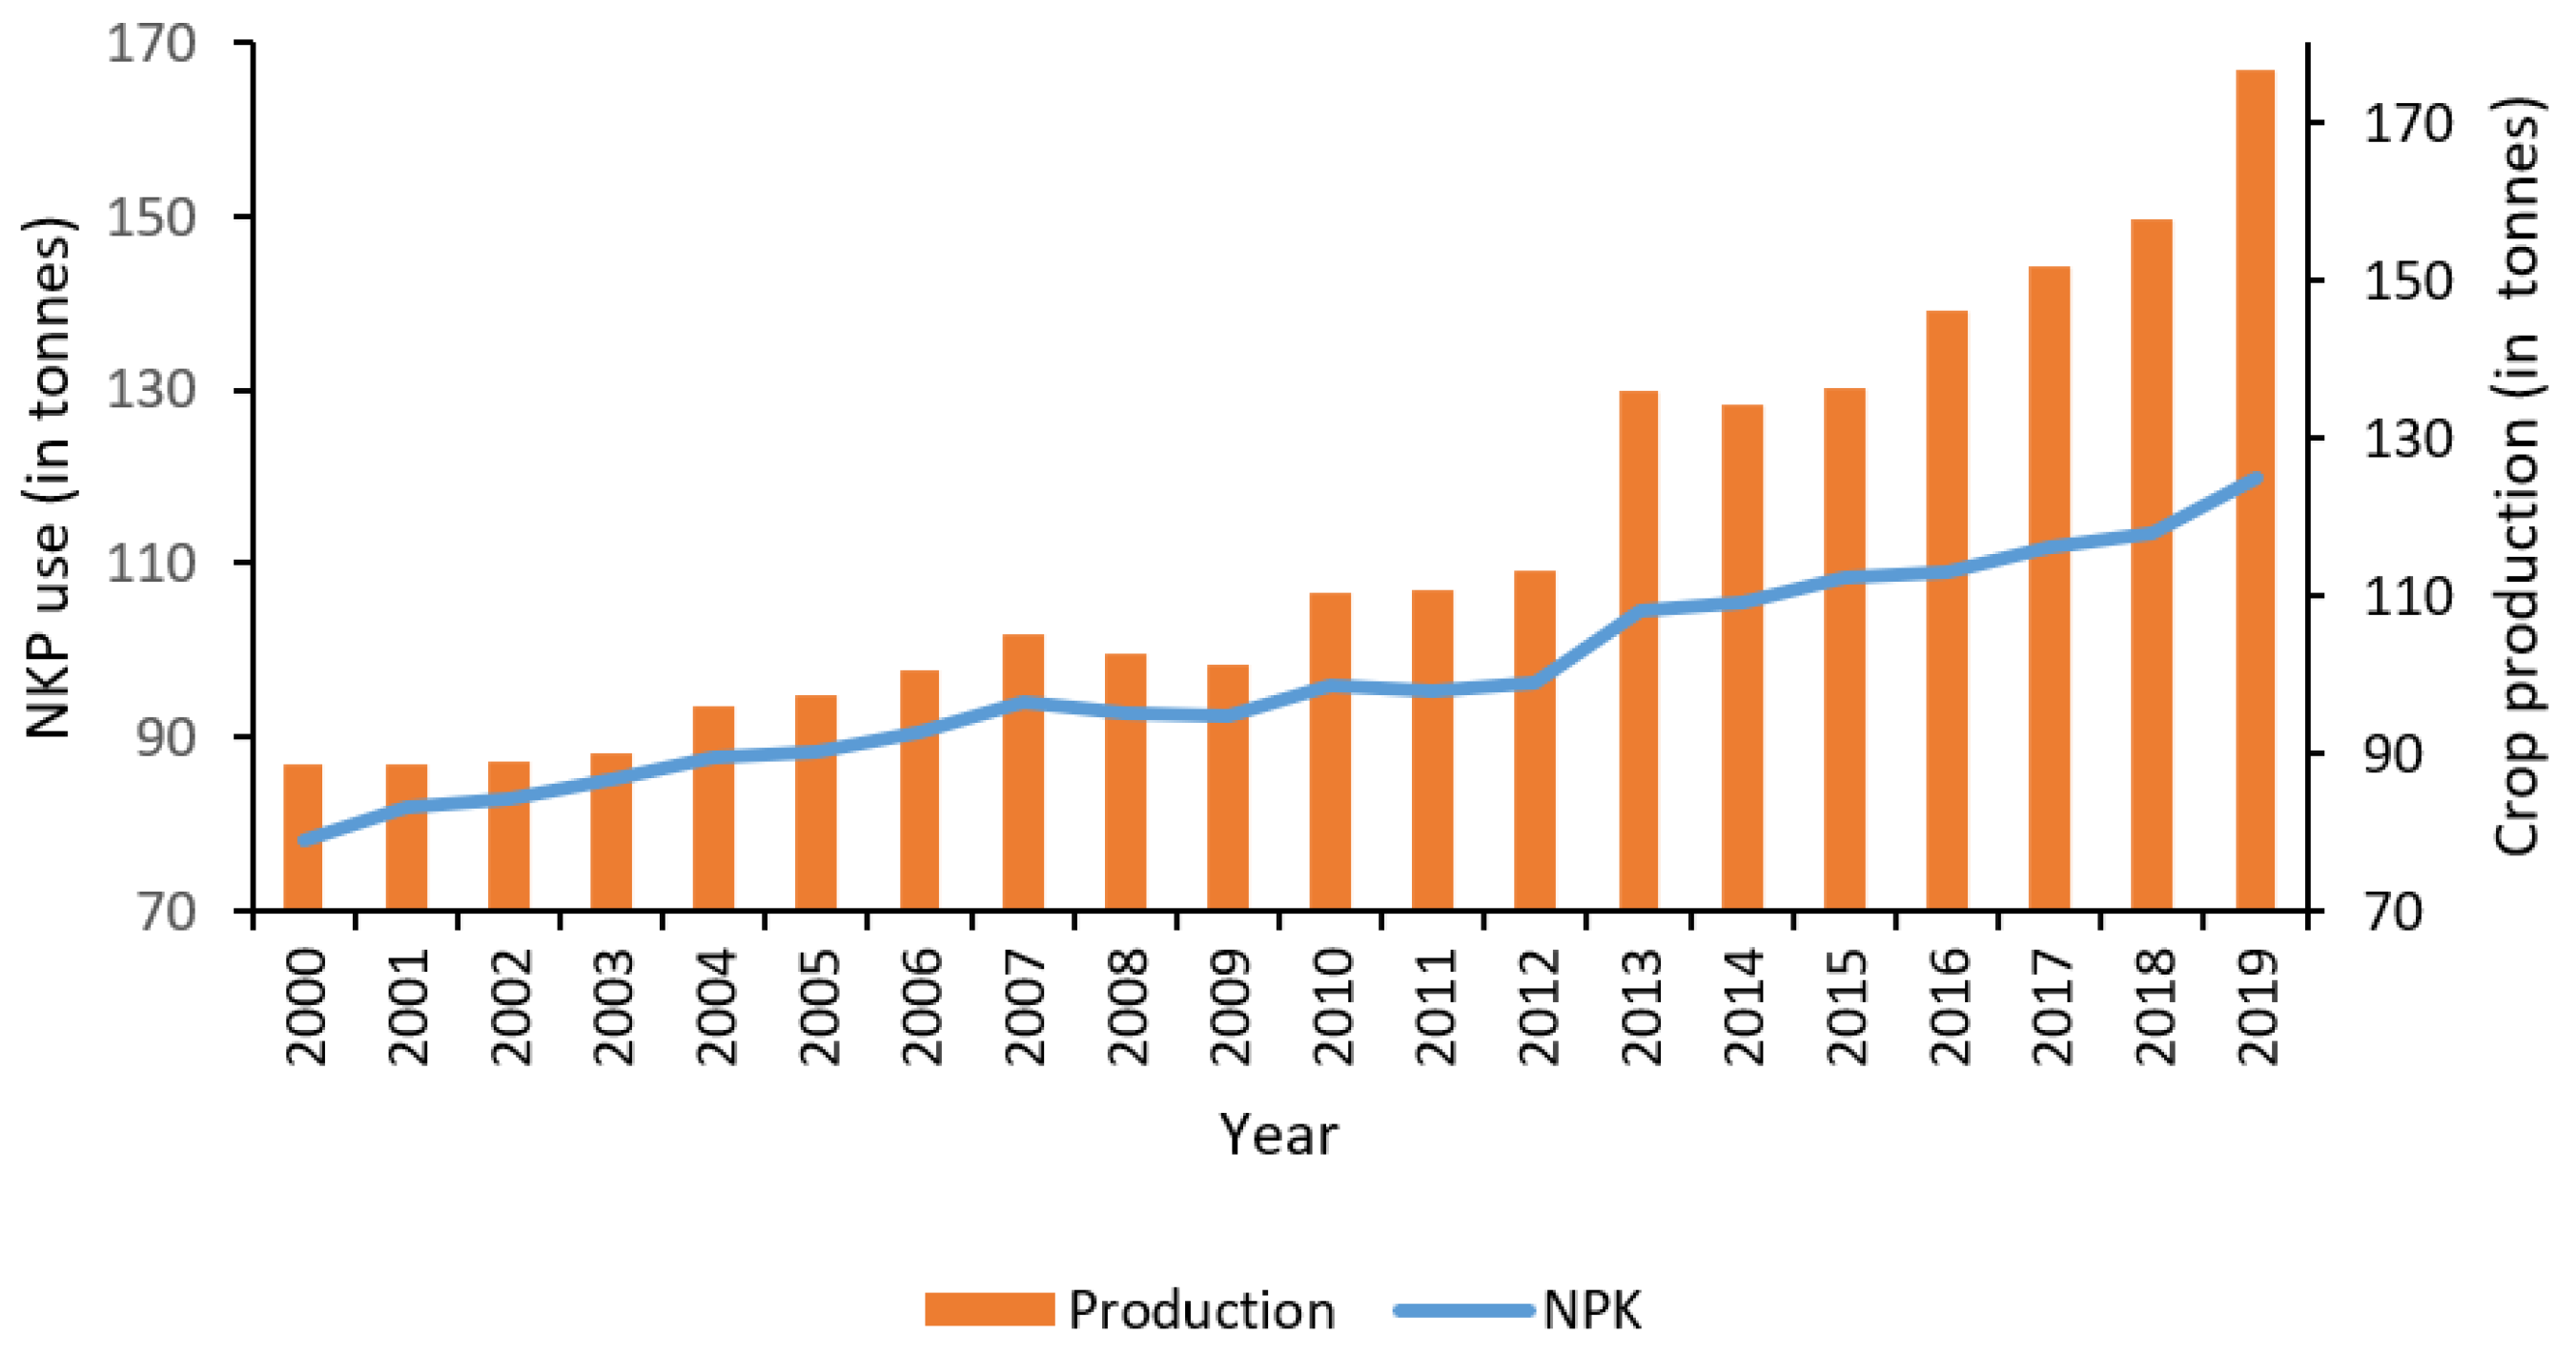
3.1. Subsidized Fertilizer Use and Crop Production

Globally, the interwoven relationships between environment-economic systems, subsidies, and agricultural production need to be strong to enhance adequate food supply for the increasing population [3,7,8]. For a variety of reasons, including socioeconomic and environmental factors, not every country or region has equal access to subsidized fertilizer [20]. The results reveal that fertilizer subsidization and application generally increase with countries’ economic status. For example, countries or regions that have more economic resources tend to have higher fertilizer subsidies (Figure 1). This study also found that more than 95% of North American and European countries had the highest total fertilizer use, ranging from 855,160 to 18,224,035 kg ha−1. The USA (15,071,752 kg ha−1) and China (18,224,035 kg ha−1) accounted for the highest subsidized NPK fertilizer use from 2000 to 2019. In South America, Brazil (1,945,038 kg ha−1), Argentina (450,612 kg ha−1), and Colombia (432,175 kg ha−1) reported the highest total subsidized fertilizer use on the continent during the study period. Costa Rica, Suriname, Guyana, and Bolivia had the lowest use of fertilizer subsidies in the region.
On the other hand, countries in Africa had the lowest fertilizer subsidies. With the exception of Egypt, South Africa, Ethiopia, and Nigeria, which used between 142,000 kg ha−1 and 457,300 kg ha−1 fertilizer, most countries in Africa used less than 20,900 kg ha−1. This is a comparatively low value, despite the indisputable fact that African soils need greater fertility restoration than the soils on any other continent. Many authors have reported that African soils have inherent difficulties in agriculture in terms of fertility, texture, pH value, or WHC. Unsustainable land use practices such as overcropping, tillage, and bush burning have worsened these conditions by causing leaching, erosion, and consequently nutrient depletion [70,71,72]. The especially poor condition of soils in Africa has been exacerbated by the disappearance of the traditional practice of long fallowing, which is no longer feasible due to population growth [52,56,73,74].
With the current global changes in environmental and human factors, it is expected that activities related to food production will also experience changes, including improvements. For instance, as climate change and rapid population growth affect available food production, most countries and continents have improved their farming systems to adapt to climate change and enhance food supply for their citizens [47,56,61,75,76,77,78,79,80]. This is exemplified in Figure 2, which shows high fertilizer applications per area of cropland for all continents excluding Africa. Asia reported the highest fertilizer use, which ranged from 87.86 kg ha−1 in 2000 to 108.44 kg ha−1 in 2019. This was followed by North America (57.90 kg ha−1 in 2000 to 72.25 kg ha−1 in 2019), Europe (41.95 kg ha−1 in 2000 to 49.87 kg ha−1 in 2019), and Oceania, especially Australia and New Zealand (38.74 kg ha−1 in 2000 to 45.63 kg ha−1 in 2019). On the other hand, South America used 32.78 kg ha−1 in 2000 and 59.17 kg ha−1 in 2019, while Africa used 10.99 kg ha−1 in 2000 and 14.13 kg ha−1 in 2019. All continents underwent reasonable increases in their fertilizer use, whereas the trend for Africa showed no notable increase. Between 2000 and 2019, Asia experienced an increase of 20.58 kg ha−1 (23.42%), and North America had a 14.35 kg ha−1 increase, while Africa had only a 3.31 kg ha−1 increase in fertilizer use during the two decades of investigation. Many studies have reported diverse causes of Africa’s soil fertility depletion. The majority of these studies have indicated that farmers’ failure to manage agricultural production in a way that maintains soil nutrients is the major challenge [81,82]. Consequently, there is a universal belief that improved soil quality is needed to promote agricultural productivity, enhance food security, and boost livelihood and income. Achieving these goals requires a substantial increase in fertilizer use [83].
The total global fertilizer use continuously increased from 79 million tonnes in 2000 to 125 million tonnes in 2019 (Figure 3). Similarly, improvement in the use of fertilizer subsidies led to an increase in crop production quantity [84]. For instance, a total of 86.1 million tonnes of crops were produced in 2000, while 166.8 million tonnes of crops were produced in 2019 (Figure 3).
The agricultural crop production quantity between 2000 and 2019 varied across countries and regions. China accounted for the highest crop production of 32,370,300 tonnes, followed by the USA with 11,749,515 tonnes (Figure 4). Countries in Europe also had high production quantities (>1 million tonnes each), except Sweden, Portugal, and Ireland, for which data are not available. The results further show that Brazil and Argentina accounted for more than 55% of agricultural products in their region, while Mexico (745,289 tonnes) led in Central America. In addition to China, in Asia, India, Japan, and Indonesia also had good crop production. Crop production in Australia (918,607 tonnes) and New Zealand (445,372 tonnes) was commensurate with the quantity of fertilizer that they applied. Africa had the lowest production quantity among the continents. The North African countries (Egypt, Libya, Algeria, Tunisia, and Morocco), Nigeria, Ghana, and South Africa produced up to 200,000 tonnes each. All other countries in Africa produced less than 37,000 tonnes. Crop production was strongly connected with the economic status of the countries, and in turn, this could be linked with the quantity of fertilizer use. Almost all countries that had relatively high crop production quantity had fertilizer subsidy policies. Therefore, there is a likelihood that sustainable fertilizer policies enabled them to achieve such remarkable success in crop production [85,86,87,88].
Fertilizer subsidies are probably essential tools for ensuring global food safety. For instance, our results show that China had the highest crop production. This might relate to the fact that, in the last decade, China had 55 million tonnes of subsidized fertilizer, which accounts for over 30% of global fertilizer use on cropland [89]. This study acknowledges that excess use of subsidized fertilizer is also detrimental. On the one hand, from the environmental view, excess fertilization is a long-term soil fertility problem because it contributes to soil contamination, leading to a higher concentration of toxic elements, such as chromium and cadmium. On the other hand, from a socioeconomic view, subsidies could be a core component in commencing an “African Green Revolution,” as pursued in Malawi [90]. A sustainable agricultural subsidy policy changed Malawi from a food-importing to a food-exporting country.
In terms of the average area covered by different crop types, global cultivation varied among continents [57,58,59]. Multiple/layered crops (Figure 5) accounted for the largest area because it is universally accepted that the best farming system for a growing population is to manage land as a fixed asset [91,92]. The area covered by herbaceous crops was also substantial, while woody crops accounted for less than 10% of the area covered globally. Multi-layered crop farming involves cultivating different crops with different growing heights and different harvesting seasons on the same piece of land to maximize the uptake of available physical resources [91]. Multiple cropping systems can produce crops at the same time and provide several ecosystem functions in the same space [91]. Increasing multiple cropping is an important strategy for increasing the harvested area and crop production without expanding physical cropland [93,94]. Multiple (layered) cropping has been a welcome development in agriculture, as it has been adopted by many countries and regions due to an increase in population and climate change [95,96,97].
Several studies support our result that multiple cropping systems account for the most significant percentage of the entire arable land area covered by different crop types [91,92]. It has been reported that the global crop-cultivable area is currently 1.29 billion hectares [92,98]. Previous authors have reported that increasing multiple cropping in suitable areas could increase these global crop-cultivable areas by 87–395 million hectares [92,98]. Herbaceous plants, also known as herbs or vegetables, are perennial, annual, or biennial, depending on the region in which they are grown and their ability or lack thereof to survive in winter, drought, wet, or dry seasons [99]. In addition to multi-layered crops, herbaceous cropping has worldwide acceptance because it is a sustainable source of nutrients for soil fertility [100]. It can solve soil erosion, leaching, and evaporation problems [99]. Further, herbaceous crops supply food for people and livestock in all seasons, provided that irrigation is applied where needed [49,99]. Woody cropping refers to the intensive production of agricultural staple commodities from highly domesticated woody perennial plants. Some authors have reported that the woody cropping system is globally unpopular [101]. This may be attributable to the fact that it involves the cultivation of trees that mature over more extended periods, and most farmers only cultivate these species for their biofuel advantage [102].

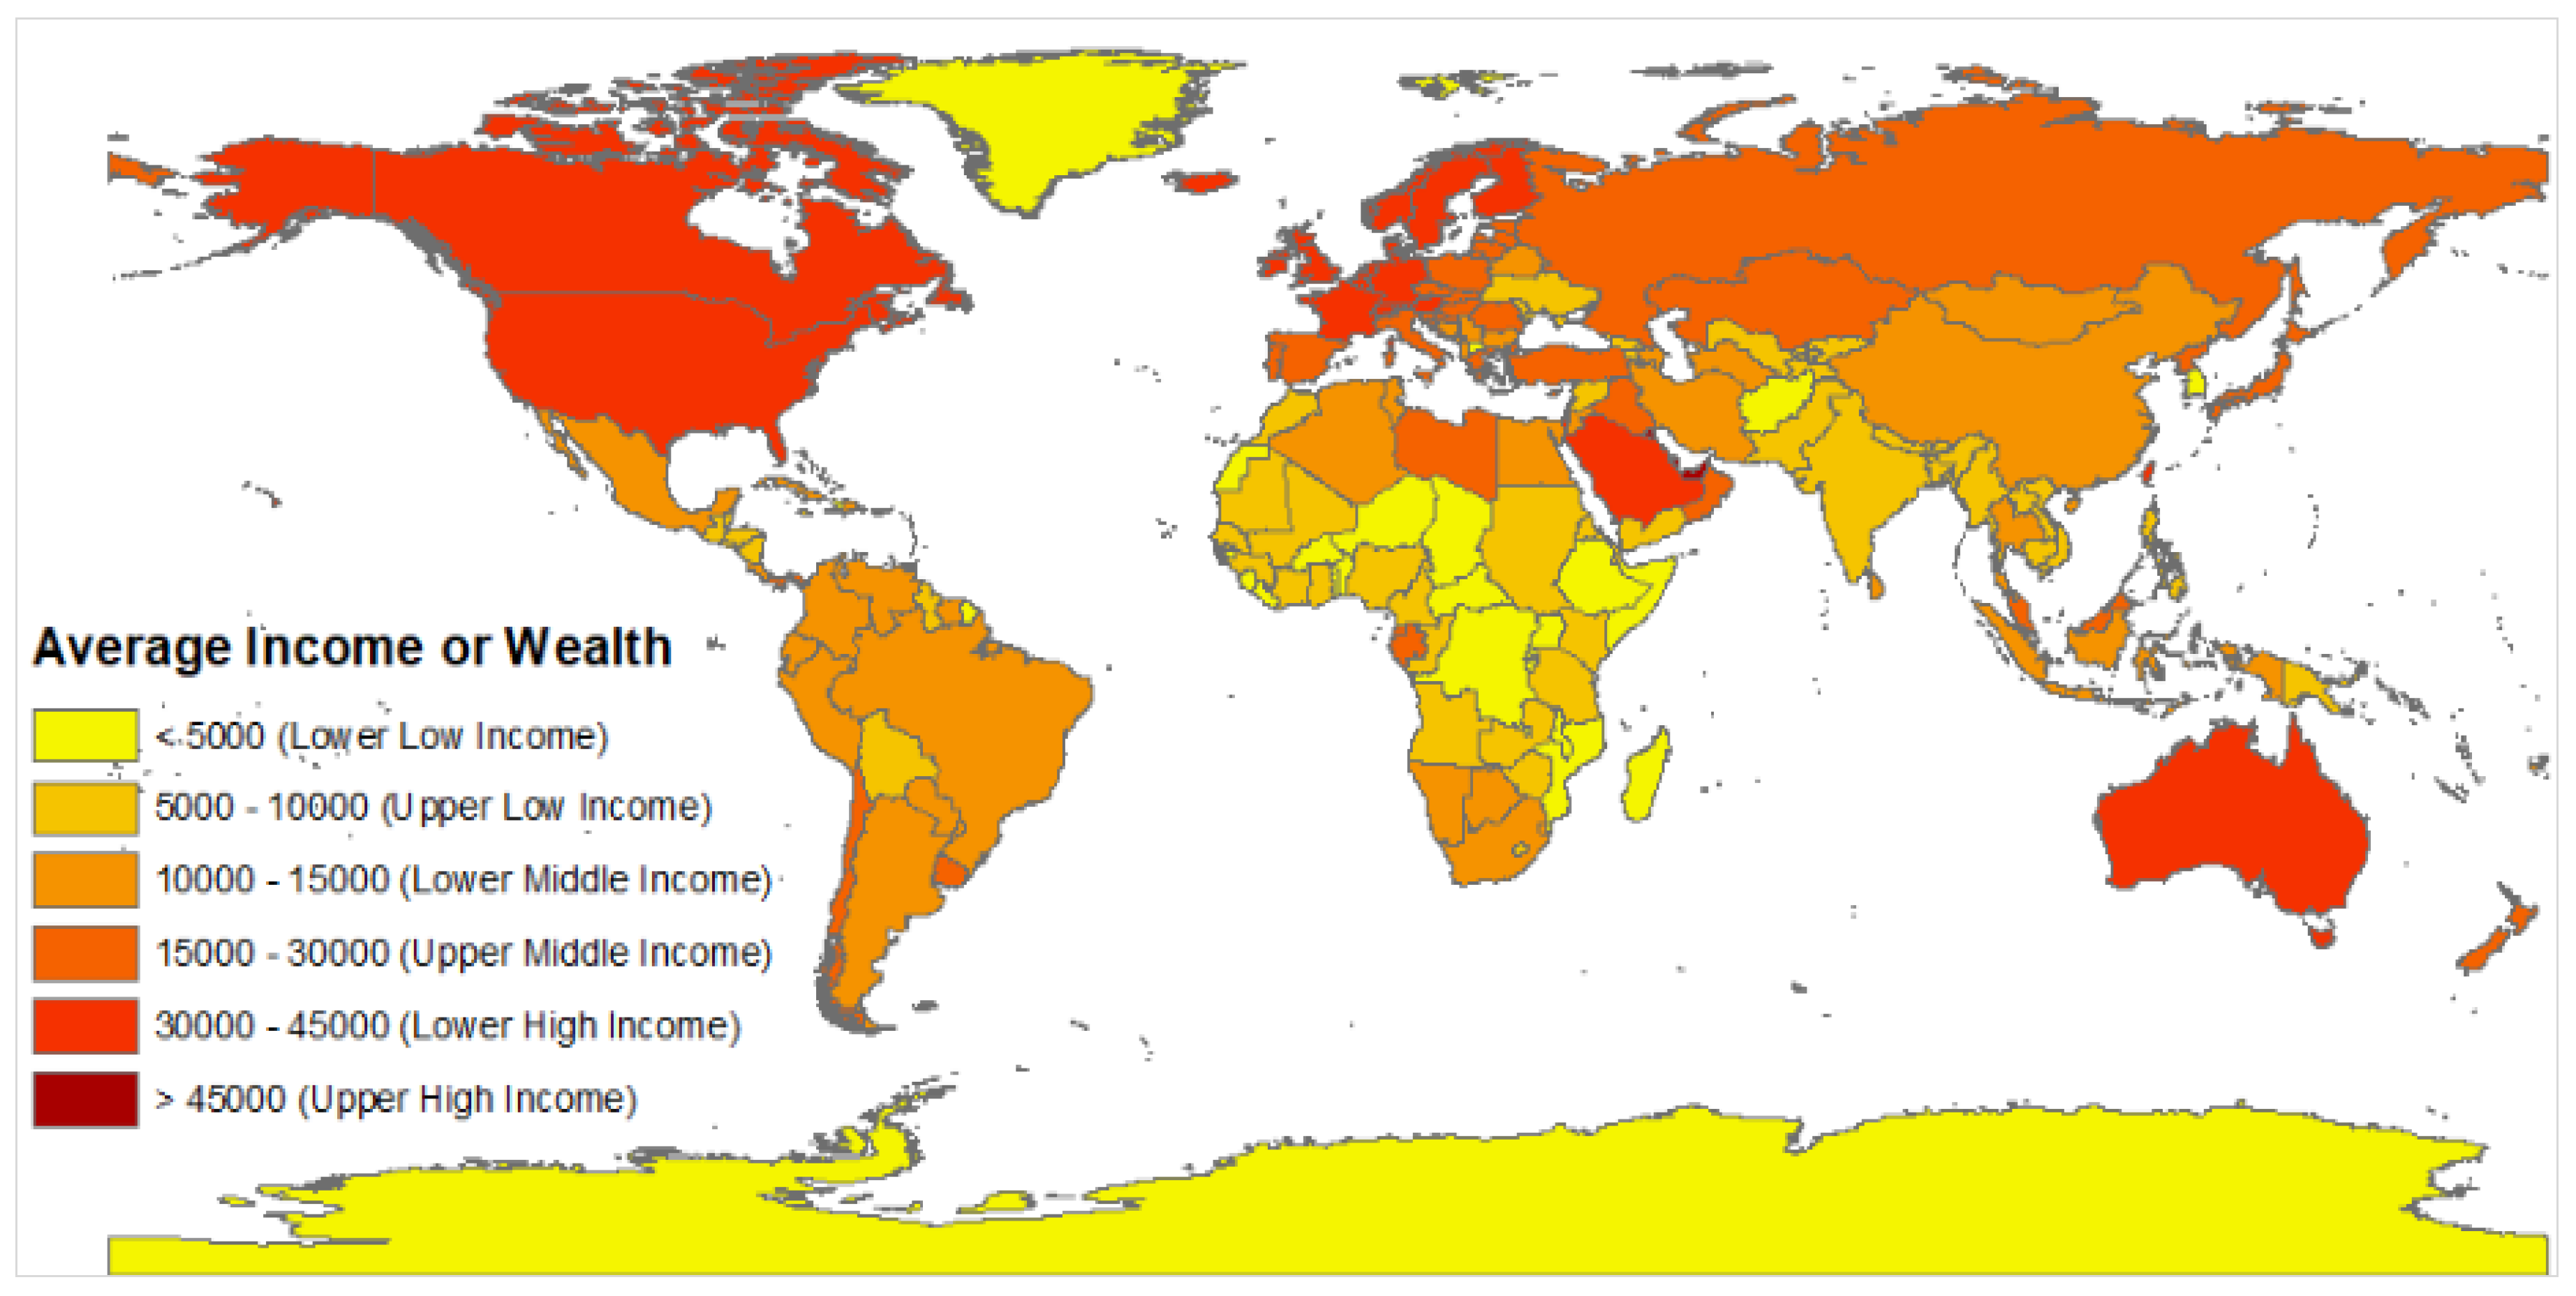
3.2. Income, Fertilizer Subsidy, and Food Safety Nexus

A substantial inequality exists in the average income of citizens across the world. This has been reported in the literature by many authors [103,104,105,106,107]. Our results reveal that the upper high-income countries were Qatar and Luxembourg (Figure 6). Countries in Europe and North America, as well as Australia, New Zealand, and Saudi Arabia, were grouped into the lower high-income class and had average incomes ranging from 30,000 to USD 45,000 per citizen (Figure 6). Most countries in South America fall into the category of low-middle income and had average incomes ranging from USD 10,000 to 15,000 per citizen. The average income in Uruguay and Chile was more than USD 15,000 per citizen. African countries had the lowest income per citizen. Apart from Libya, Gabon, South Africa, Botswana, and Namibia, which had an average income of about USD 12,000 per citizen, all other African countries had less than USD 10,000 per citizen.
Niger, Madagascar, Chad, Congo DR, and the Benin Republic were in the lower low-income category and had less than USD 5000 per citizen. The average income per citizen might have contributed significantly to the amount of subsidized fertilizer used in agriculture, consequently determining the crop production quantity. For instance, North America, Europe, China, and India had high incomes per citizen. High income per citizen supported by good economic growth has been reported as a key factor for sustainable fertilizer subsidy and crop production [108]. In most developing countries, the constraints associated with achieving such success include a poor economy, corruption, lack of accountability, and self-interest among leaders [31]. For example, little money is budgeted for fertilizer subsidies, and most of the money is diverted to individuals’ purses, while a meager amount is left for actual fertilizer subsidies. Even when fertilizer is available, it is not properly distributed to the poor farmers who need it the most but is provided to the most influential farmers who might be friends or relatives of politicians [109]. These practices not only obstruct the aim of the subsidy but also hinder the goals of sustainable economic growth and food security [32,110].
Crop production quantity had a significantly strong correlation with all measured parameters, except food imports (Table 1). Crop production quantity had a very high correlation with GDP (0.91), cropland cover (0.82), and precipitation (0.73). Fertilizer use had a significant and strong correlation with crop production quantity (0.93), income per citizen (0.61), GDP (0.67), and some environmental variables, such as soil pH (0.60) and precipitation (0.58). Crop type showed a high correlation only with climatic parameters (precipitation and temperature). The income per citizen was strongly correlated with cropland cover (0.74), GDP (0.83), and food exports (0.75). The soil WHC decreased with an increase in precipitation (−0.67). Globally, several studies have focused on the relationships between crop production and socioeconomic and environmental factors [111,112]. For example, in Lake Taihu of the Yangtze River Delta of eastern China, total nitrogen and phosphorous were reported in [113] to correlate with GDP, urban area, temperature, precipitation, and crop area. Though the correlation between crop production and precipitation was positive in our study, other studies found a negative correlation [113,114]. Furthermore, in disagreement with our finding, a report by other scholars showed a non-linear relationship between crop production and GDP [115].

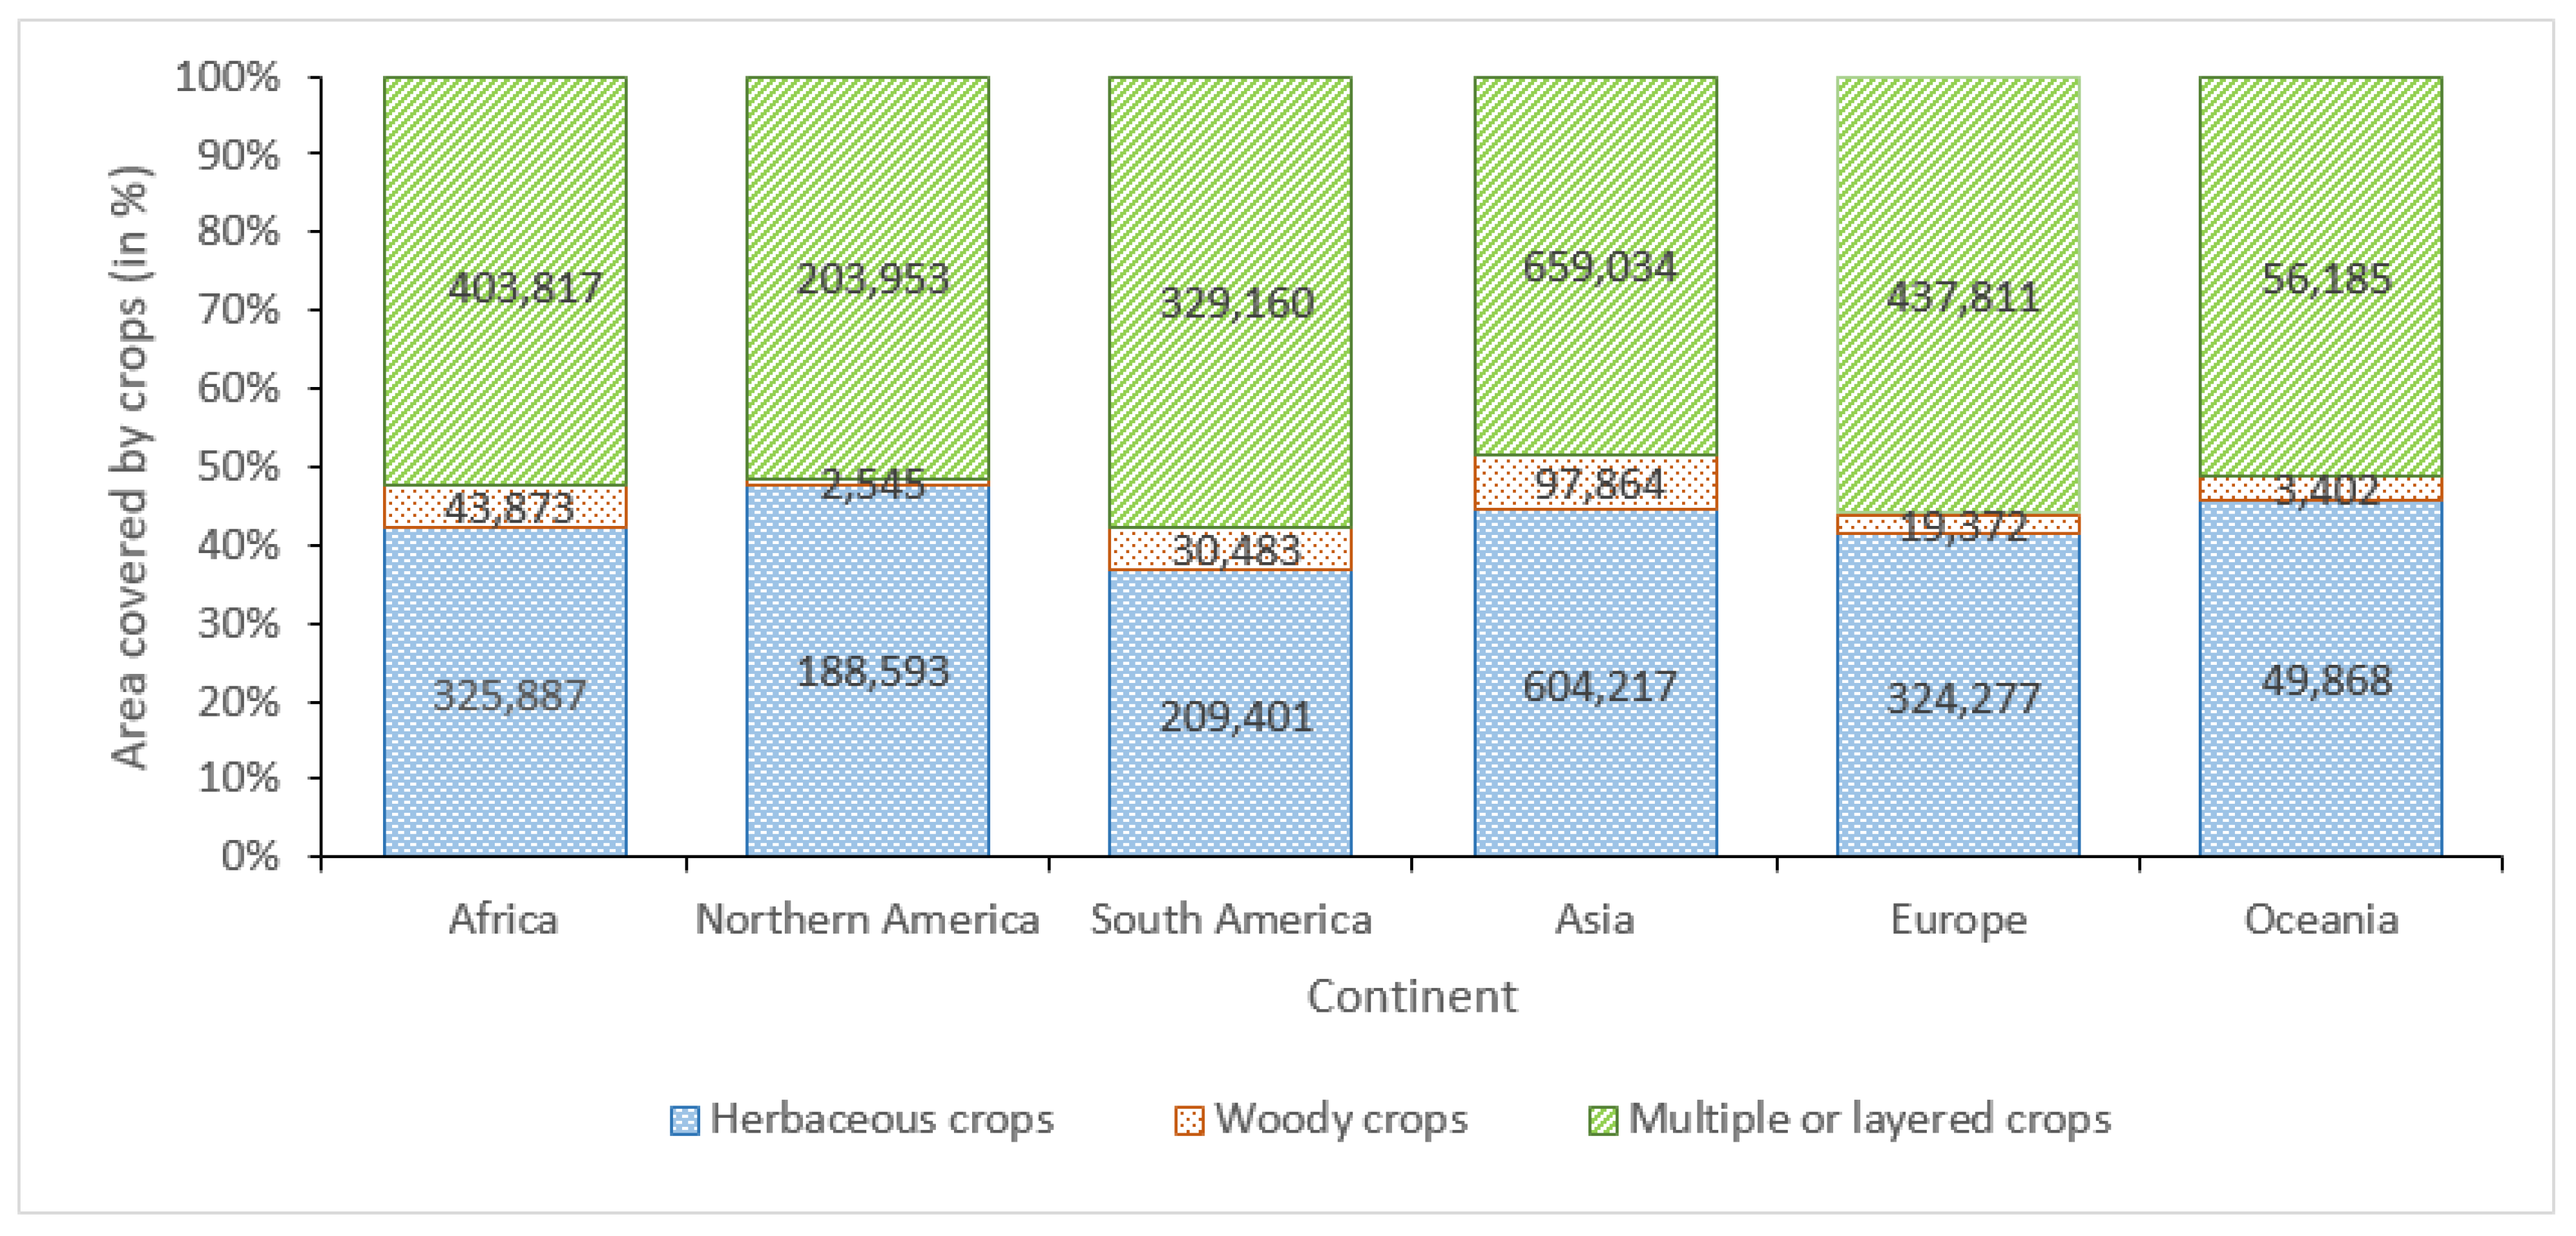
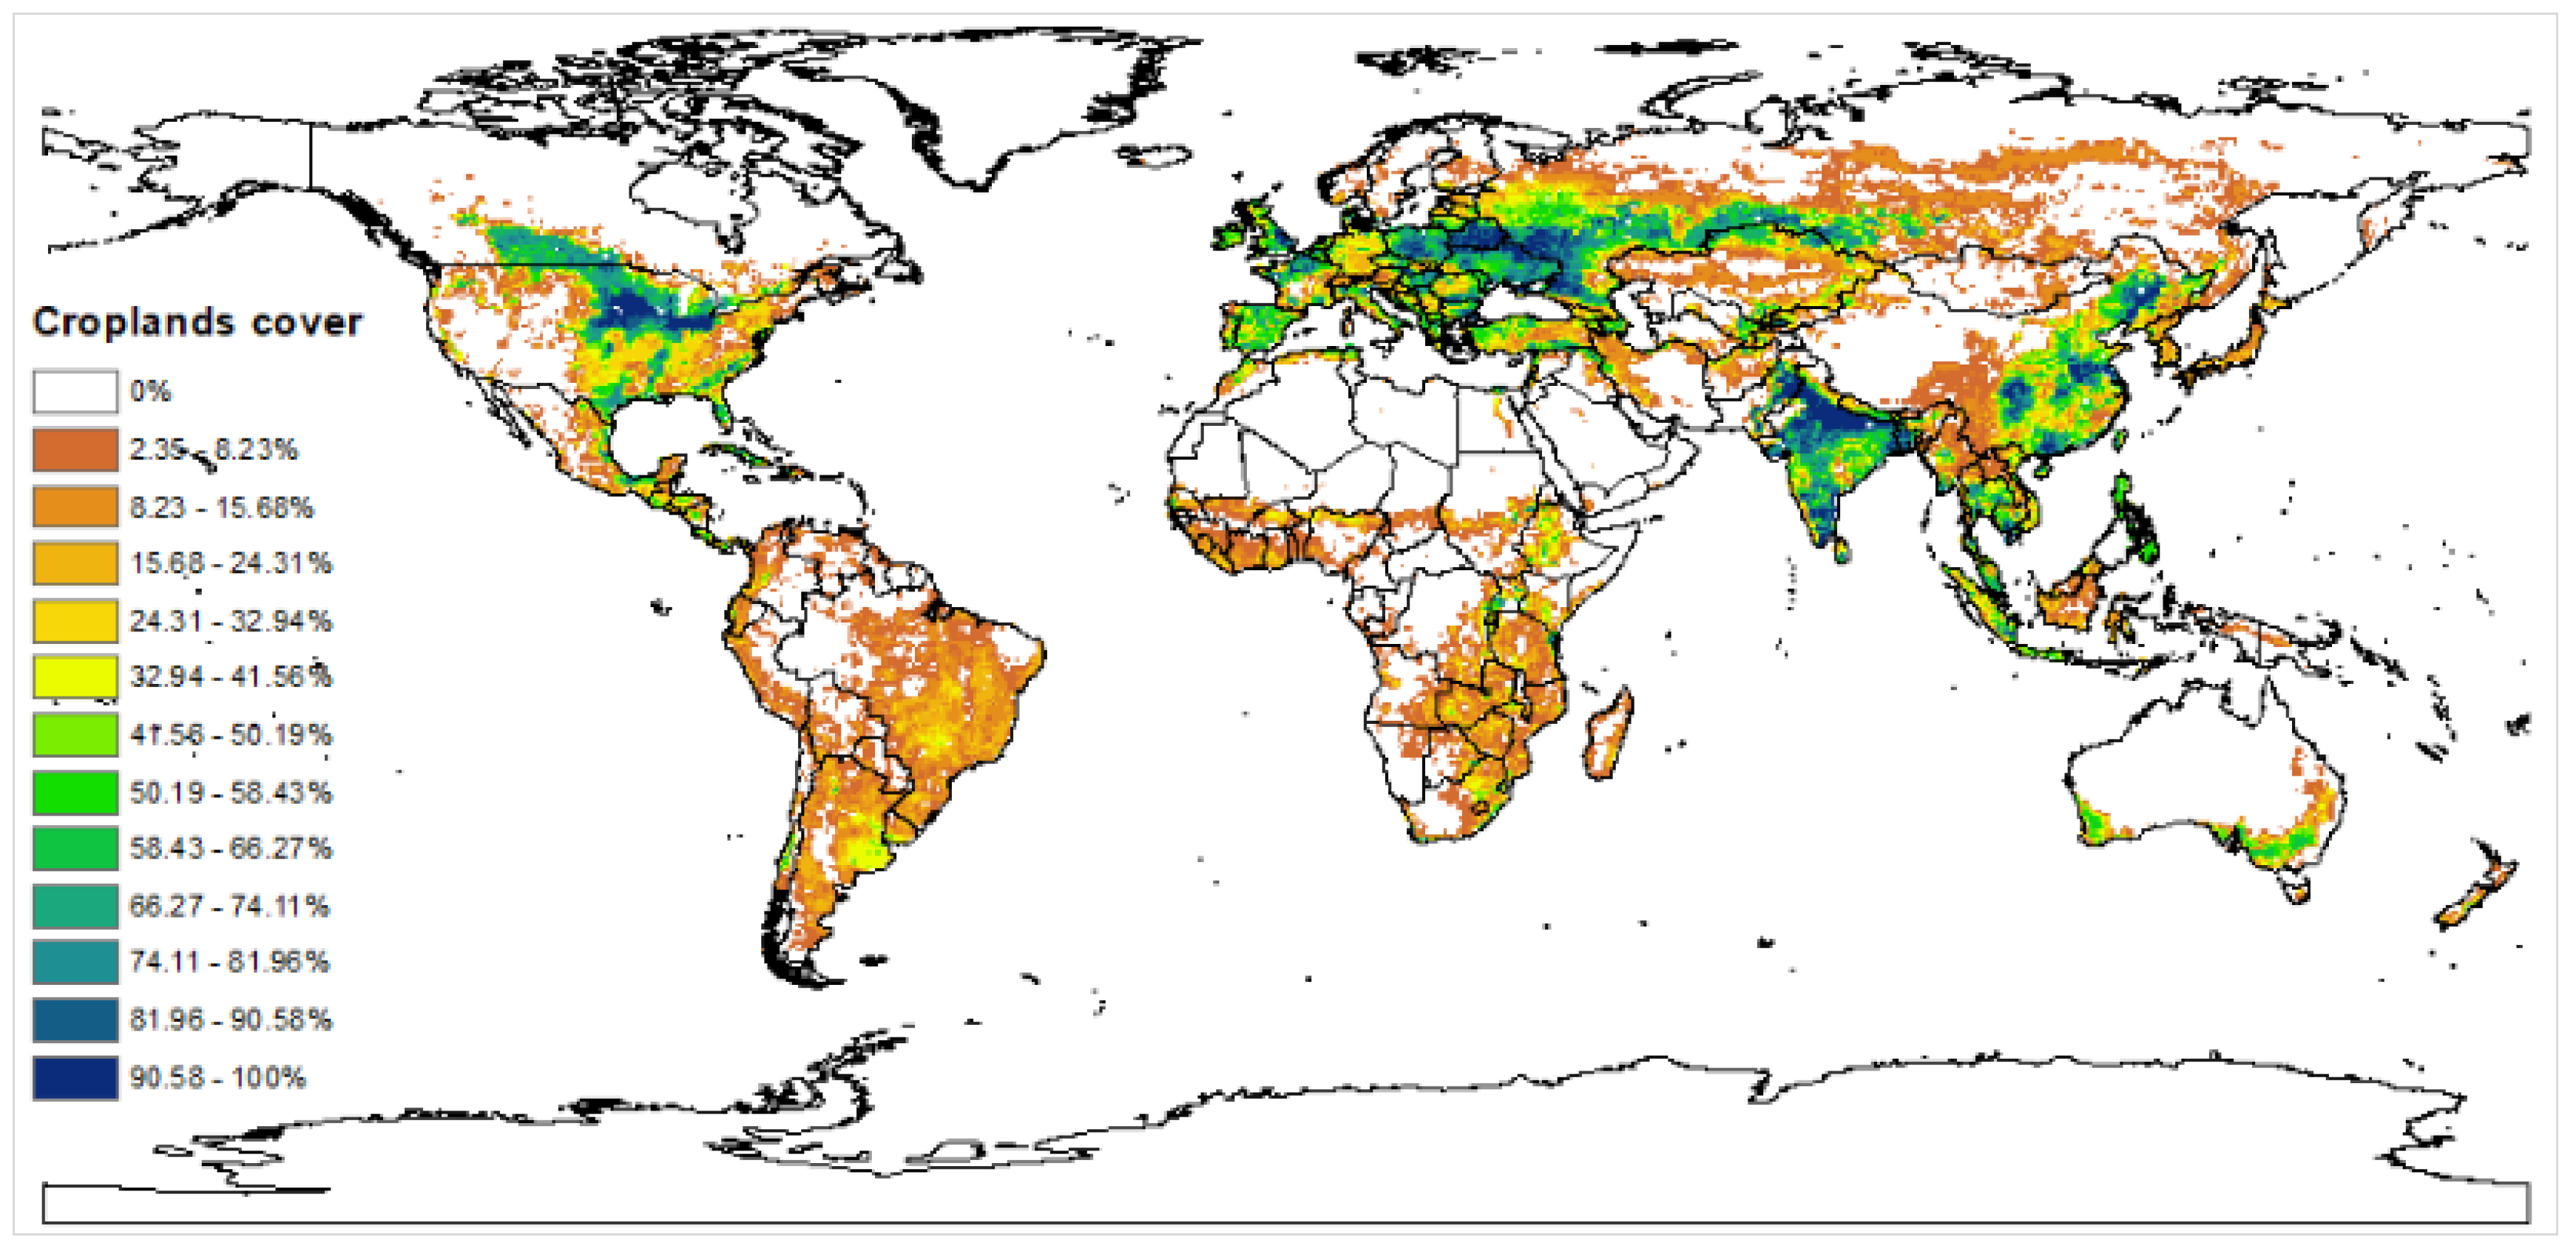
3.3. Cropland Cover and Food Production

Countries in Europe, North America, China, and India had the highest percentage of cropland cover during the study period (Figure 7). On average, India had about 76% cropland cover, while Europe had about 64%, excluding the Scandinavian countries. The highest cropland cover in the USA and China was recorded in the eastern parts extending north-east and south-east. Most developing countries in Africa and South America had a low percentage of cropland cover. In South America, only Brazil and Argentina had cropland cover, which ranged between 25% and 40%. In Africa, only a few areas in East Africa and West Africa had cropland cover, which was below 20% on average. A greater area of Africa and Australia had no cropland cover. This finding, to a large extent, corresponds to the crop production quantity recorded in each region. For example, China, the USA, India, and Europe had the highest crop production when compared with South American and African countries (see Figure 4). This might be explained by the differences in cropland cover and differences in the quantity of fertilizer used by the various regions [48,75,76,77,78,79,80].

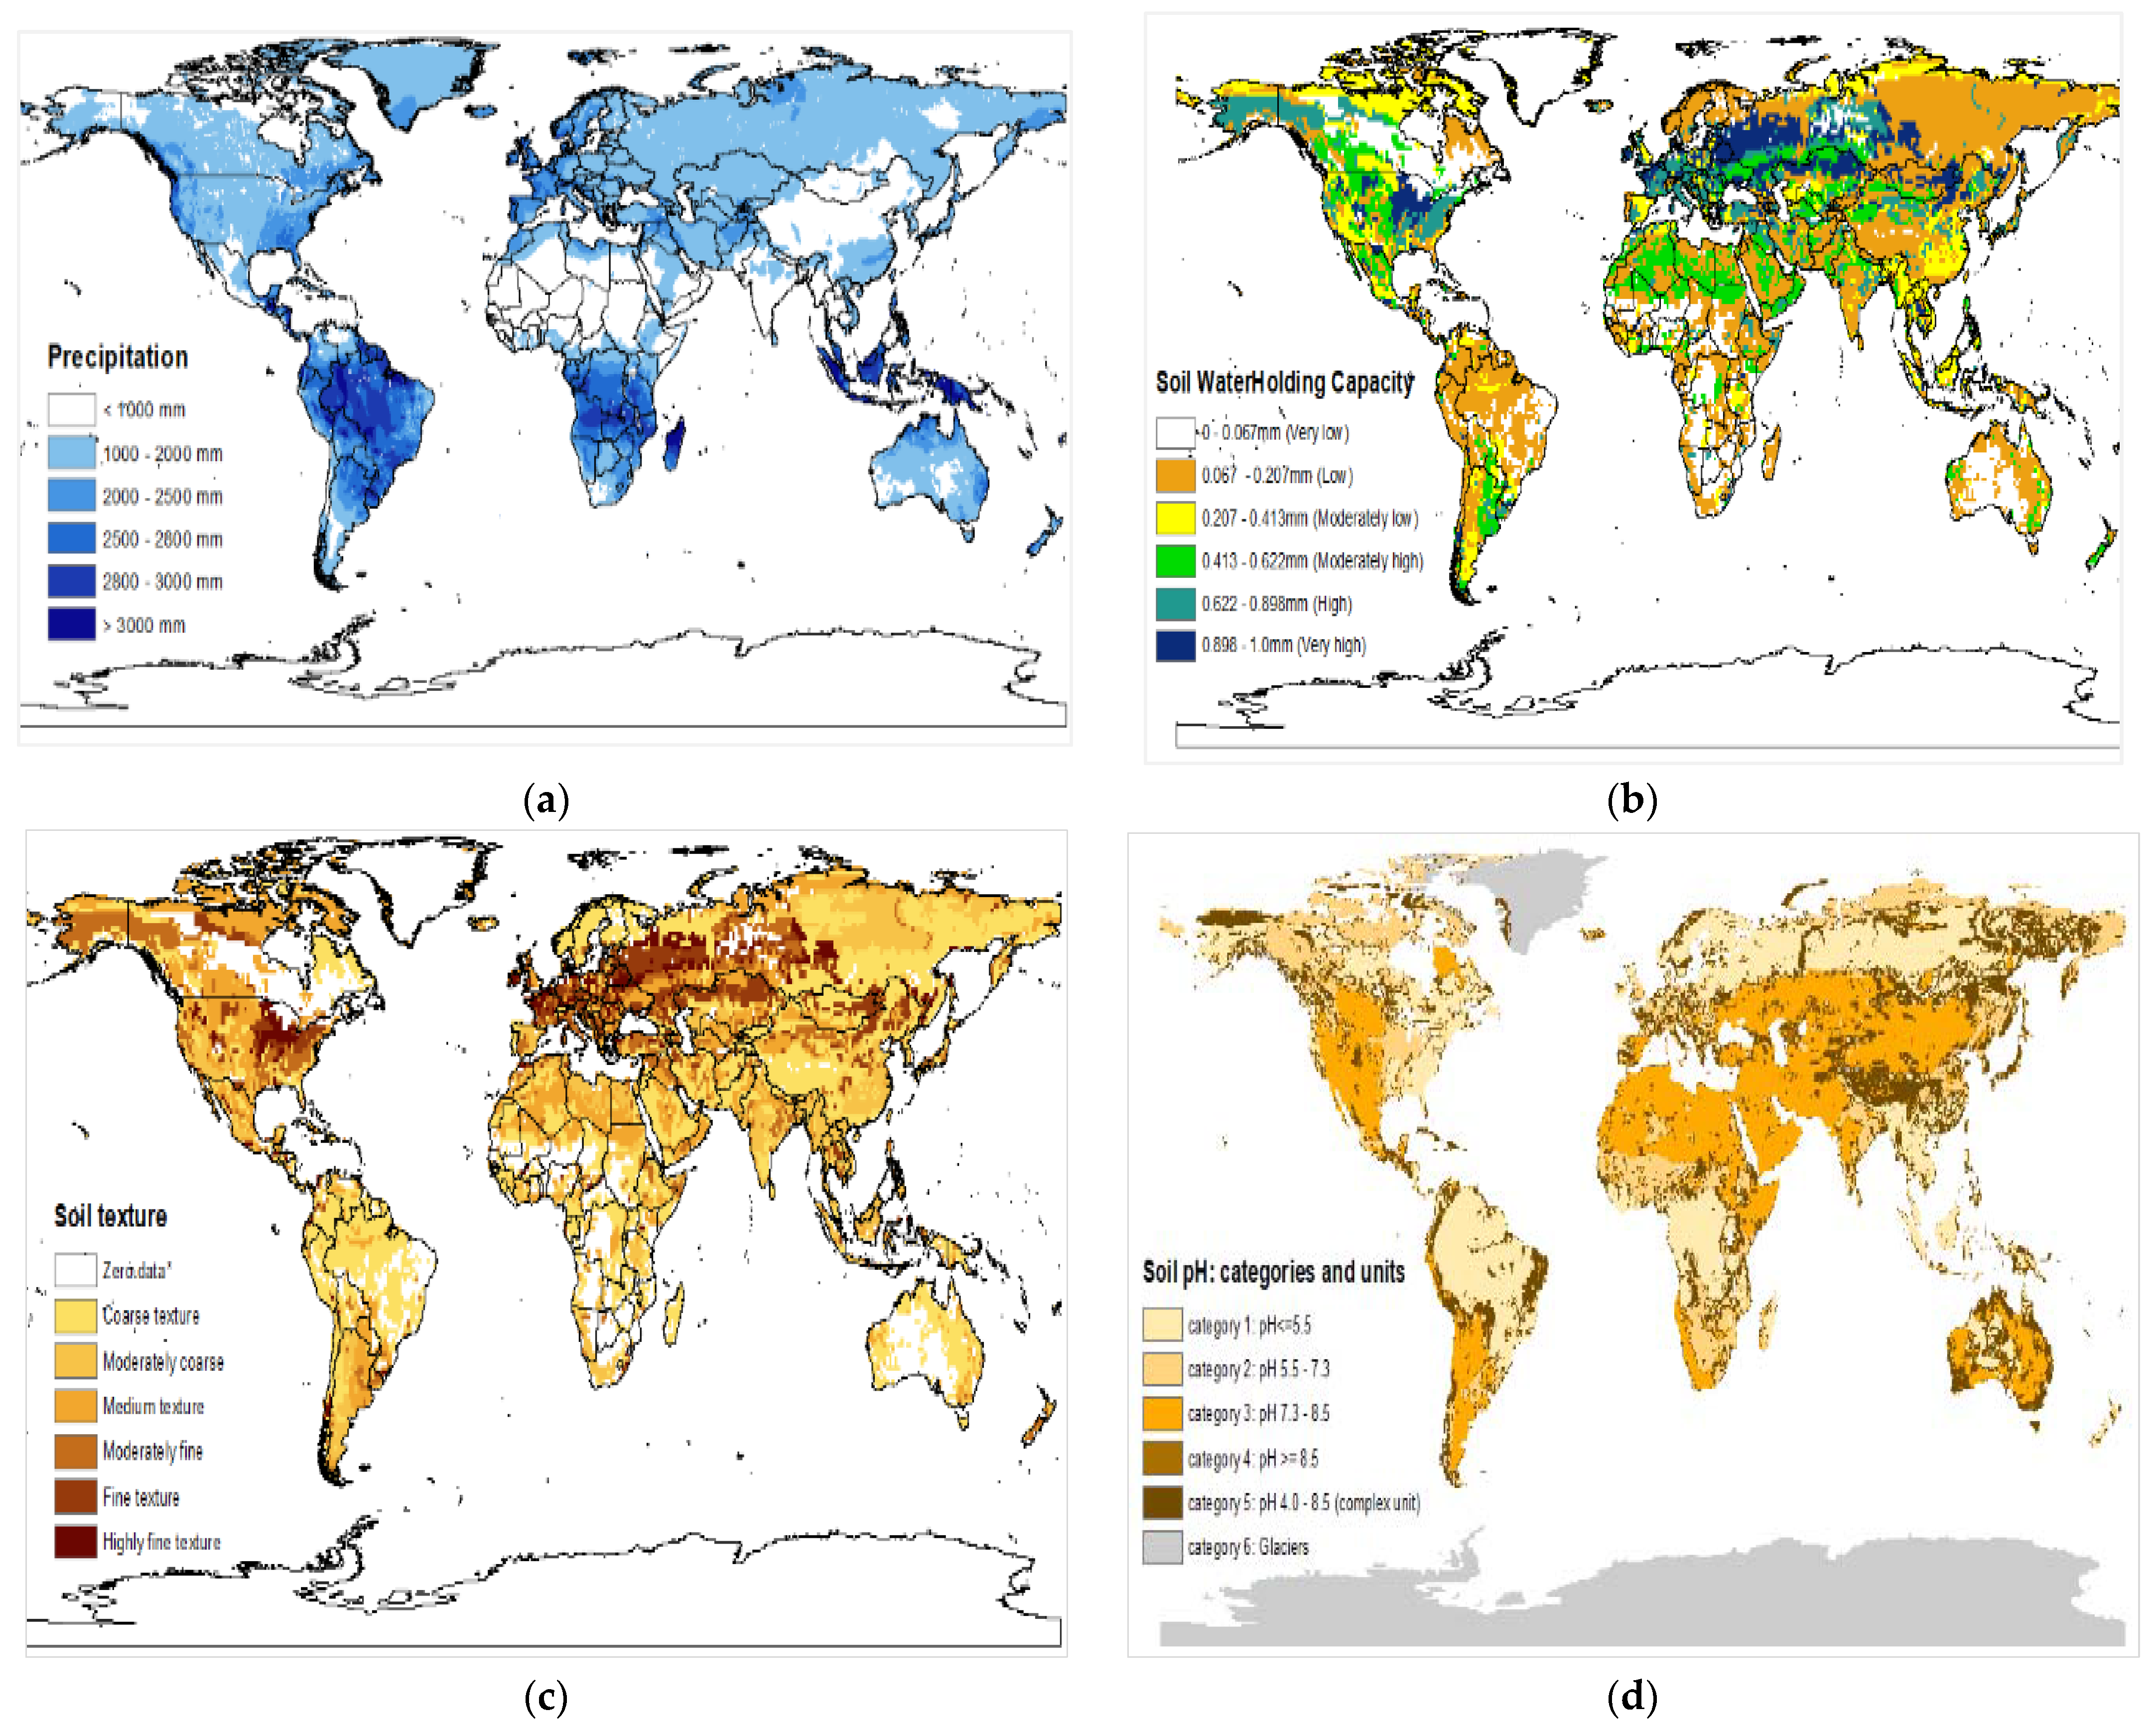
3.4. Impacts of Environmental Factors on Food Security

In addition to human and economic factors, environmental factors might have also largely contributed to the percentage of cropland cover and the crop production quantity during the study years (Figure 8), and this has been reported by several authors [116,117]. For example, the average precipitation was not uniformly distributed. Some countries or regions had extremely high precipitation while others received exceptionally low amounts (Figure 8a). Europe, the USA, and Australia had an optimal amount of precipitation, while South America and Africa had unfavorable precipitation patterns. Soil WHC (Figure 8b), soil texture (Figure 8c), and soil pH (Figure 8d) are also very important parameters in crop production. Soil that has either a low capacity to retain water, poor pH, or poor texture is often characterized as infertile and is usually course in texture. Though, challenges from soil pH can be corrected by liming the soil, yet this might pose difficulties to be performed sustainably in most developing countries especially in Africa which have low capital, human and material resources. The inability of the soil to hold water is caused by many factors, including intensive (over) cultivation, poor farming practices, lack of fertilizer application, and deforestation. These human activities lead to degraded and poor-quality soil.
It has been confirmed that soil moisture content, determined by the soil WHC and texture, affects soluble nutrient uptake and microbial activity, consequently determining crop growth [118]. Extreme environmental factors such as excessive precipitation, drought, flood, and soil erosion are some of the physical factors that can also reduce soil fertility. However, environmental factors can be alleviated if human and economic resources are well utilized
The soils in Africa and South America have low water retention because (i) they have been degraded over time by acute anthropogenic activities without sustainable management, (ii) little or no manure was applied to restore soil fertility, (iii) financial resources and innovations to manage the soils are lacking, and (iv) the regions are located in the tropics, and thus, they are hot in all months, causing harsh weather that has adverse effects on the soil. Australia also has soil with poor water retention (Figure 8b), but with its human and economic resources, it is able to manage the soil and restore its fertility for improved crop production [119].

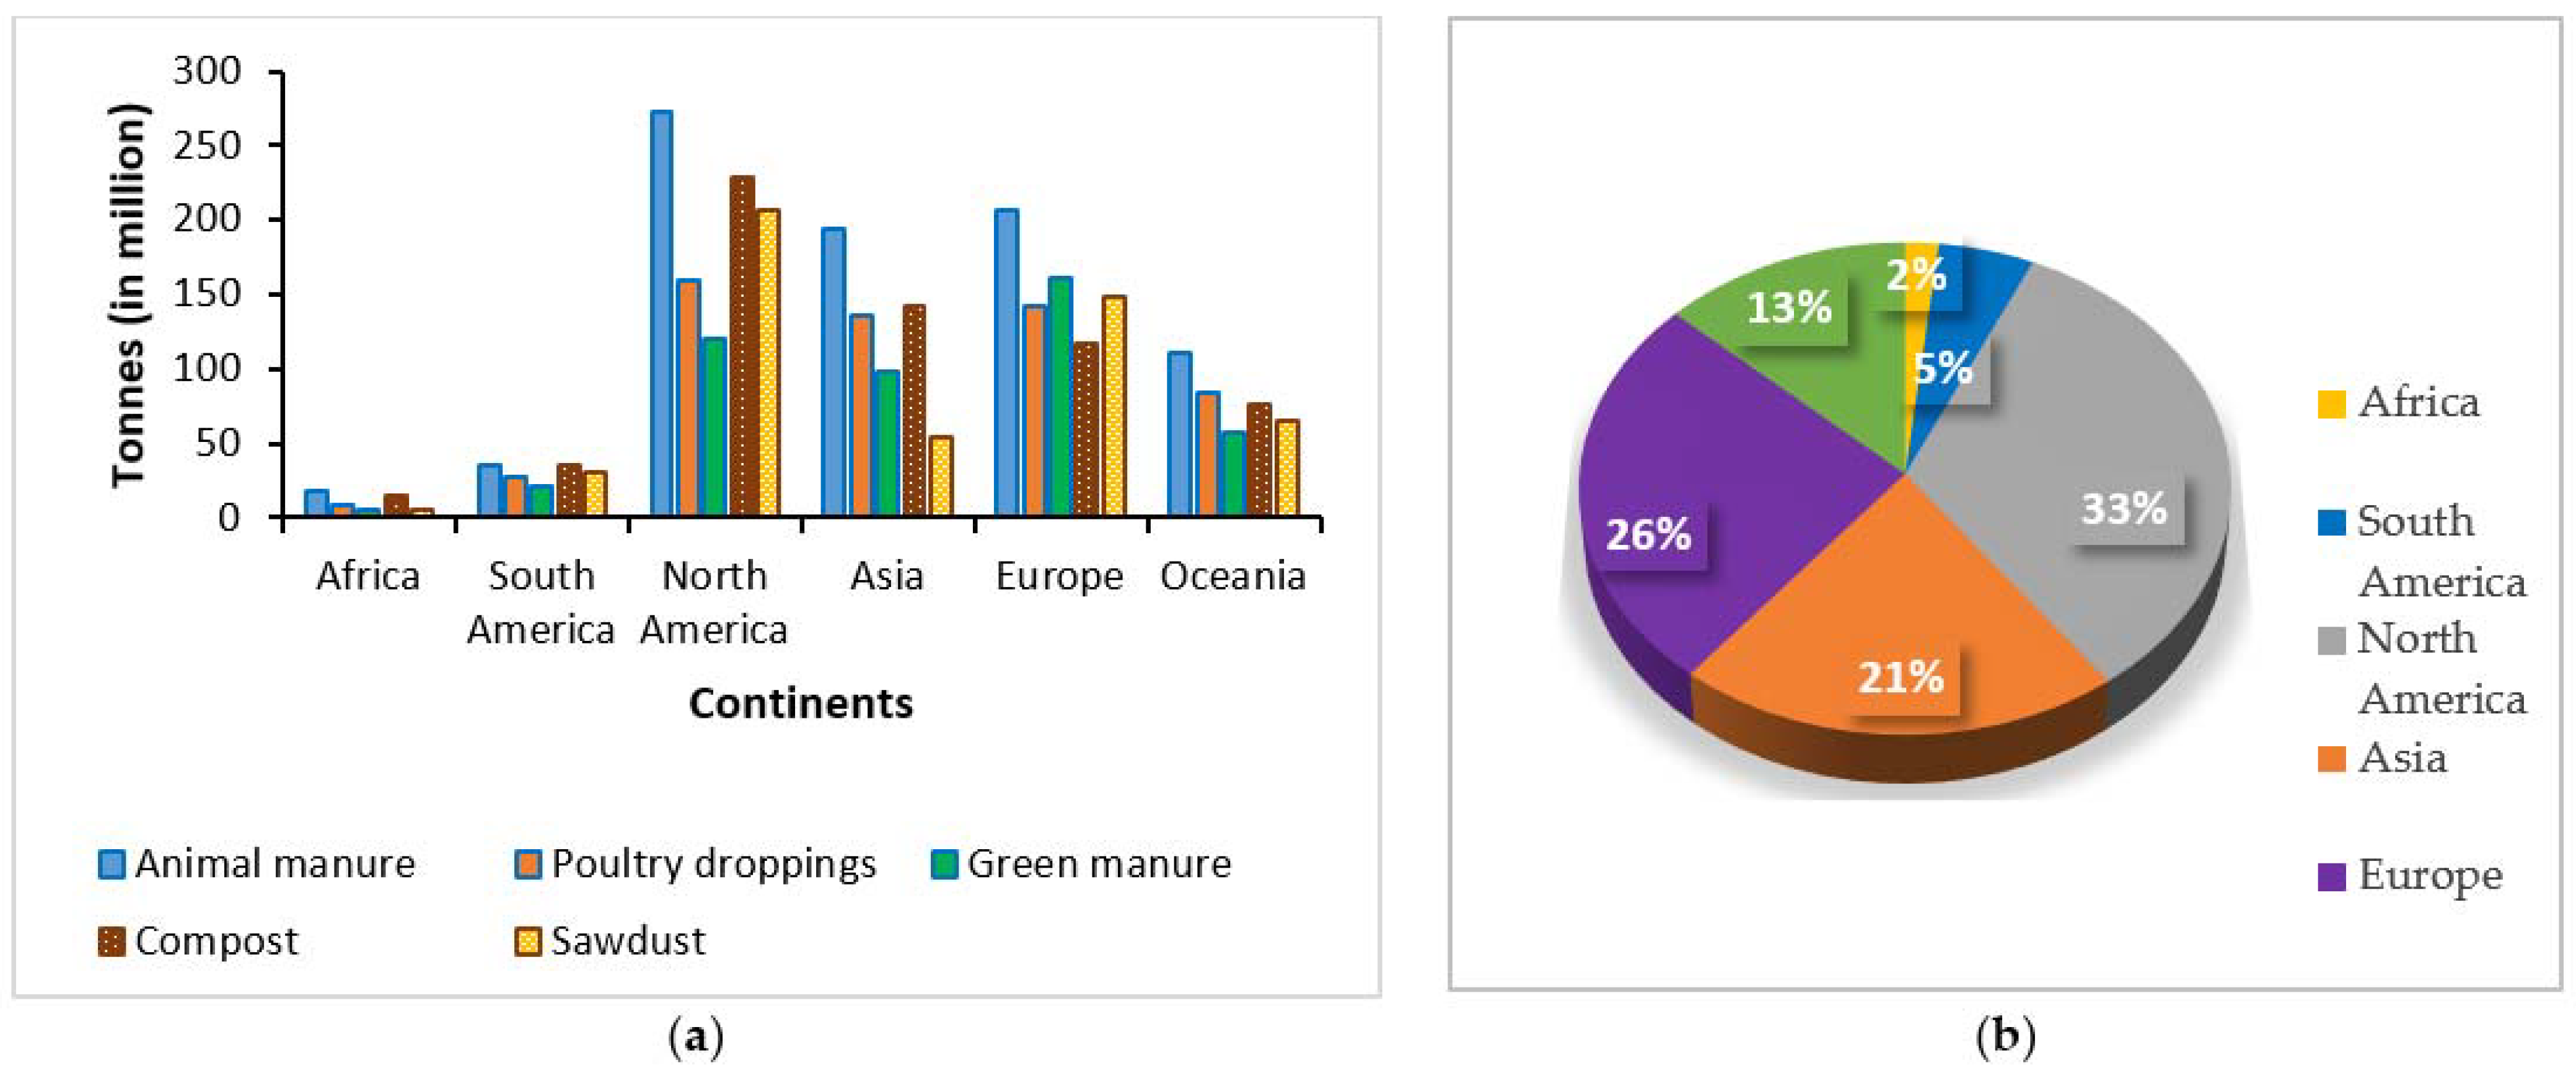
3.5. Organic Fertilizer USE as a Sustainable Tool for Bioeconomy

Across the continents, the highest production of organic fertilizer was from animal manure, while sawdust and green manure were the lowest in some regions (Figure 9a). In terms of global organic fertilizer production, Africa (2%) and South America (5%) accounted for the lowest of the world total, while North America and Europe had the highest, accounting for 33% and 26%, respectively (Figure 9b). Many studies have shown that crop yield per N fertilizer use is relatively low in African countries [45,56,61,74,75]. Therefore, as has been realized in developed countries (Figure 9), developing countries need to increase the use of organic fertilizer, as this is the best alternative to offset the economic and environmental costs of using inorganic fertilizers [43,44,46,120]. Organic fertilizer (from animal and plant residues) is currently the most sustainable means of improving soil fertility and increasing food supply.
To replace inorganic fertilizer, most developed countries have shifted to the use of organic manure, which is more environmentally friendly. However, the majority of countries in Africa are lagging behind in the use of either organic or inorganic fertilizers. In African countries, and in most of the other developing countries, smallholder farmers have a low tendency to use organic fertilizer [54,72,73]. This has also contributed to the challenges of the low productivity of crops in these countries [73]. Many recent studies have reported that organic fertilizer significantly increased the soil pH and the concentrations of nitrogen, phosphorus, potassium, calcium, and magnesium when compared with inorganic fertilizer (46,72). On the contrary, some authors advise against the total eradication of inorganic fertilizer, especially in regions that have poor soils, including Africa, and recommend that organic fertilizer be supplemented with a minimal amount of inorganic fertilizer in order to achieve optimal production [44,46]. This has been supported by other scholars, who reported that the best proportion of fertilizer application for the African Savannah soils, for instance, is 1 organic to 3 inorganic fertilizers [49,50].
In Africa, inorganic fertilizers are expensive and difficult to access by the majority of farmers. The prices range from 0.85 to 1.63 USD kg−1 [57] from major distributors who sell at wholesale rates. This price is high for poor farmers, who depend on less than USD 1 per day as income. Moreover, the retail price is higher than the above-stated range, and most farmers purchase retail goods since they cannot afford to buy wholesale [57]. On the other hand, organic fertilizer is scarce because of a lack of financial resources to increase the number of livestock animals that generate manure [56]. In Africa, where livestock receives poor-quality feed, the nitrogen content in manure is usually below 2% [57]. In developed regions, such as North America and Europe, legally mandated nutrient management plans for intensive livestock production require that animal manure be analyzed for its nutrient content on a regular basis [121,122]. Moreover, in Africa, plant residues are used for other high-demanding domestic needs instead of being used as green manure [54,56]. In addition, poor countries do not have the human resources and technology to process organic fertilizers, which is not an obstacle in rich countries [53,54]. From a different view, other scholars were of the opinion that because of the high labor intensity and low quality of organic fertilizer, the restoration of soil fertility in Africa and other developing regions increasingly requires the use of inorganic fertilizer [54]. This work does not state that the lack of subsidized fertilizer use in most developing countries has led to their low crop production, because other agricultural support incentives are also lacking. For example, in most developed countries, in addition to fertilizer use, indirect subsidies have been applied to purchases of essential agricultural inputs, such as new crop varieties with higher yields, improved pesticides, and agricultural machinery [123]. These agrarian inputs have contributed to increased food production in these developed nations compared with the developing world, where these initiatives are presently not attainable [5].

4. Conclusions

This study proves that environment-economic systems have strong relationships with fertilizer subsidies and crop production. Furthermore, food security and income at local, regional, and global scales are largely influenced by the quantity of fertilizer use. Our results reveal that subsidized fertilizer use and crop production generally increase with countries’ economic status. Countries and regions that have more economic resources tend to have higher fertilizer subsidies and crop yields. Several socioeconomic factors influence crop production. Among these factors are agricultural policies (such as fertilizer subsidies), the financial status of nations and farmers, agricultural practices, and soil management techniques. Environmental conditions are another vital factor that has a substantial impact on crop yield and food security. Notable environmental factors include climate and soil quality (such as soil pH, soil texture, and soil WHC). These environmental factors have more adverse effects in tropical regions such as Africa. However, with proper human management, the application of the best technologies, and the adoption of sustainable policies, the effects of the environment can be ameliorated to achieve high crop yields. This study provides strong evidence that Africa needs fertilizer subsidies to cushion the impacts of its harsh environment and increase food production. This is because the continent has the lowest crop production due to low fertilizer use. While the total eradication of fertilizer subsidies in Africa is discouraged, the application of organic fertilizer is highly encouraged. This will help to address the challenges of low food production caused by poor soil and high food demand due to harsh weather and rapid population growth. In addition, it has been widely acknowledged that inappropriate fertilizer management is one of the reasons for the overuse of fertilizer. A primary explanation for the overuse of fertilizer is that farmers lack adequate knowledge of fertilizer management. These findings prove that subsidized NPK fertilizer has increased crop production, and this has varied between developed and developing regions. In support of sustainability, this study reveals the benefits of using more organic manure than inorganic fertilizer in developing regions, including Africa. Appropriate policies, such as soil testing, fertilizer recommendation programs, and an organic fertilizer subsidy that will induce farmers to adopt suitable fertilizer management practices, should be put in place for sustainability.
It is also important to note that the scope of this work was limited to the investigated parameters, and other agricultural inputs (such as new crop varieties with higher yields, improved pesticides, and agricultural machinery) might also have a substantial influence on crop production. Therefore, further studies that consider these additional parameters are necessary.

Supplementary Materials

The following are available online at https://www.mdpi.com/article/10.3390/su13169408/s1, Table S1: A summarized report showing the global increase in the use of N, P, K fertilizers and crop production from 1961 to 2014; Table S2: Some data related to the work.

Author Contributions

Conceptualization, all authors; Methodology, all authors; Software, C.N. and M.S.; Validation, all authors; Formal Analysis, M.S. and C.N.; Investigation, all authors; Resources, all authors; Data Curation, M.S., C.N., and R.C.P.; Writing—Original Draft Preparation, all authors; Visualization, all authors; Supervision, M.H.; Project Administration, M.H.; Funding Acquisition, M.H. All authors have read and agreed to the published version of the manuscript.

Funding

This work was supported by the grant ‘EVA4.0, No. CZ.02.1.01/0.0/0.0/16_019/0000803’, financed by Operational Program Research, Development and Education, the Ministry of Education Youth and Sport of the Czech Republic.

Institutional Review Board Statement

Not applicable.

Informed Consent Statement

Not applicable.

Data Availability Statement

The data presented in this study are available on request from the corresponding author. The data are not publicly available due to the processing of data from different sources; some were retrieved throughout an extensive interview campaign, others were obtained from institutional databases, and some were from the published literature.

Acknowledgments

The Faculty of Forestry and Wood Sciences, Czech University of Life Sciences, is acknowledged. Support from individuals who were interviewed in some of the countries is also acknowledged.

Conflicts of Interest

The authors declare no conflict of interest.

References

  1. Hu, J. The economic instruments for environmental protection of Chinese Taipei. In Proceedings of the APEC MRC Group Conference, Manila, Philippines, 22–23 November 1996. [Google Scholar]
  2. Organization for Economic and Co-operative Development (OECD). Managing the Environment: The Role of Economic Instruments. 1994. Available online: https://core.ac.uk/download/pdf/48031478.pdf (accessed on 9 January 2021).
  3. Liang, L.; Wang, Y.; Ridoutt, B.G.; Lal, R.; Wang, D.; Wu, W.; Wang, L.; Zhao, G. Agricultural subsidies assessment of cropping system from environmental and economic perspectives in North China based on LCA. Ecol. Indic. 2019, 96, 351–360. [Google Scholar] [CrossRef]
  4. International Fertilizer Association. 2016. Available online: http://www.fertilizer.org/Statistics (accessed on 11 January 2021).
  5. Lopez, R.A.; He, X.; Falcis, E.D. What drives China’s new agricultural subsidies? World Dev. 2017, 93, 279–292. [Google Scholar] [CrossRef] [Green Version]
  6. Mather, D.L.; Jayne, T.S. Fertilizer subsidy and the role of targeting in crowding out: Evidence from Kenya. Food Secur. 2018, 10, 397–417. [Google Scholar] [CrossRef]
  7. Chen, Y.; Chen, M.; Mishra, A.K. Subsidies under uncertainty: Modeling of input- and output-oriented policies. Econ. Model. 2020, 85, 39–56. [Google Scholar] [CrossRef]
  8. Hossain, M.; Singh, V.P. Fertilizer use in Asian agriculture: Implications for sustaining food security and the environment. Nutr. Cycl. Agroecosyst. 2000, 57, 155–169. [Google Scholar] [CrossRef]
  9. Wu, Y.; Wang, E.; Miao, C. Fertilizer use in China: The role of agricultural support policies. Sustainability 2019, 11, 4391. [Google Scholar] [CrossRef] [Green Version]
  10. Rakshit, M. Some economics of fertiliser subsidy. J. Quant. Econ. 2018, 16, S209–S228. [Google Scholar] [CrossRef]
  11. OECD. Agriculture and the Environment: Canada’s Response, Prepared by Agriculture Canada Environmental Bureau; OECD: Paris, France, 1993. [Google Scholar]
  12. OECD. Agricultural and Environmental Policies: Opportunities for Integration; OECD: Paris, France, 1989. [Google Scholar]
  13. Rolfe, C.J.B. Using Subsidies to Promote Environmental Protection in Agriculture: A Review of Programs in North America and Europe; West Coast Environmental Law Research Foundation: Victoria, BC, Canada, 1993. [Google Scholar]
  14. Runge, C.F. Environmental Effects of Trade in the Agricultural Sector: A Case Study. 1992. Available online: https://ageconsearch.umn.edu/record/14449/ (accessed on 13 June 2021).
  15. Adams, G.; Patrick, W.; Brian, W.; Robert, E.Y. Do “Decoupled” payments affect, U.S. crop area? Preliminary evidence from 1997–2000. Am. J. Agric. Econ. 2001, 83, 1190–1195. [Google Scholar] [CrossRef]
  16. Ervin, D.E. Agriculture, Trade and the Environment: Anticipating the Policy Challenges; OECD: Paris, France, 1997. [Google Scholar]
  17. Taheripour, F.; Khanna, M.; Nelson, H.C. Welfare impacts of alternative public policies for agricultural pollution control in an open economy: A general equilibrium framework. Am. J. Agric. Econ. 2010, 90, 701–718. [Google Scholar] [CrossRef]
  18. O’Connor, D. Applying economic instruments in developing countries: From theory to implementation. Environ. Dev. Econ. 1999, 4, 91–110. [Google Scholar] [CrossRef]
  19. Nunes, J.M.R.; Bonito, A.; Loures, L.; Gama, J.; López-Piñeiro, A.; Peña, D.; Albarrán, Á. Effects of the European Union agricultural and environmental policies in the sustainability of most common Mediterranean soils. Sustainability 2017, 9, 1404. [Google Scholar] [CrossRef] [Green Version]
  20. Vitalis, V. Agricultural subsidy reform and its implications for sustainable development: The New Zealand experience. Environ. Sci. 2007, 4, 21–40. [Google Scholar] [CrossRef] [Green Version]
  21. Sumner, D.A. American farms keep growing: Size, productivity, and policy. J. Econ. Perspect. 2014, 28, 147–166. [Google Scholar] [CrossRef] [Green Version]
  22. Wegren, S.K.; Frode, N.; Elvestad, C. The impact of Russian food security policy on the performance of the food system. Eur. Geogr. Econ. 2016, 57, 1–29. [Google Scholar] [CrossRef]
  23. Sckokai, P.; Moro, D. Modeling the reforms of the common agricultural policy for arable crops under uncertainty. Am. J. Agric. Econ. 2006, 88, 43–56. [Google Scholar] [CrossRef]
  24. Yi, F.J.; Sun, D.Q.; Zhou, E.H. Grain subsidy, liquidity constraints and food security impact of the grain subsidy program on the grain-sown areas in China. Food Policy 2016, 50, 114–124. [Google Scholar] [CrossRef]
  25. Antón, J.; Chantal, L.M. Do counter-cyclical payments in the 2002 US farm act create incentives to produce? Agric. Econ. 2004, 31, 277–284. [Google Scholar] [CrossRef]
  26. Kirwan, B.E.; Roberts, M.J. Who really benefits from agricultural subsidies? Evidence from field-level data. Am. J. Agric. Econ. 2016, 98, 1095–1113. [Google Scholar] [CrossRef]
  27. Mayrand, K.; Dionne, S.; Paquin, M.; Pageot-LeBel, I. The Economic and Environmental Impacts of Agricultural Subsidies: An Assessment of the 2002 US Farm Bill & Doha Round; Unisféra International Centre: Montreal, QC, Canada, 2013. [Google Scholar]
  28. Mayrand, K.; Marc, D.; Ortega, G.A.; Marrón, L.F.G. The Economic and Environmental Impacts of Agricultural Subsidies: A Look at Mexico and Other OECD Countries; Unisféra International Centre: Montreal, QC, Canada, 2013. [Google Scholar]
  29. Worldwatch Institute. Agricultural Subsidies Remain a Staple in the Industrial World. 2014. Available online: http://vitalsigns.worldwatch.org/vs-trend/agricultural-subsidies-remain-staple-industrial-world (accessed on 5 February 2021).
  30. FAO. Country Fact Sheet on Food and Agriculture Policy Trends. 2016. Available online: http://www.fao.org/3/a-i6054e.pdf (accessed on 10 February 2021).
  31. World Summit on Sustainable Development. The UN Plan of Implementation. 2002. Available online: http://www.johannesburgsummit.org/html/documents/summit_docs/2309_planfinal.htm (accessed on 7 February 2021).
  32. OECD. Environmentally Harmful Subsidies. 2005. Available online: https://www.oecd.org/site/agrehs/35217152.pdf (accessed on 15 January 2021).
  33. Dawson, C.J.; Hilton, J. Fertiliser availability in a resource-limited world: Production and recycling of nitrogen and phosphorus. Food Policy 2011, 36, S14–S22. [Google Scholar] [CrossRef]
  34. van Beers, C.; de Moor, A. Public Subsidies and Policy Failures: How Subsidies Distort the Natural Environment, Equity and Trade and How to Reform Them; Edward Elgar: Cheltenham, UK, 2001. [Google Scholar]
  35. Steenblik, R.P. Subsidy measurement and classification: Developing a common framework. In Environmentally Harmful Subsidies: Policy Issues and Challenges; OECD: Paris, France, 2003; pp. 101–141. [Google Scholar]
  36. Food and Agriculture Organization (FAO). Available online: http://www.fao.org/statistics/en/2016 (accessed on 6 June 2021).
  37. International Fertilizer Association. Production & International Trade, International Fertilizer Association. Regional Figures for MAP, DAP, and TSP. Available online: http://www.fertilizer.org/En/Statistics/PIT_Excel_Files.aspx (accessed on 26 January 2021).
  38. Food and Agriculture Organization. FAOSTAT Online Statistical Service 2017. Available online: http://www.faostat.fao.org (accessed on 10 June 2021).
  39. Pellegrinia, P.; Fernández, R.J. Crop intensification, land use, and on-farm energy-use efficiency during the worldwide spread of the green revolution. Proc. Natl. Acad. Sci. USA 2018, 115, 2335–2340. [Google Scholar] [CrossRef] [Green Version]
  40. Kibirige, J.S. Population growth, poverty and health. Soc. Sci. Med. 1997, 45, 247–259. [Google Scholar] [CrossRef]
  41. Foley, J.A.; Ramankutty, N.; Brauman, K.A.; Cassidy, E.S.; Gerber, J.S.; Johnston, M. Solutions for a cultivated planet. Nature 2011, 478, 337–342. [Google Scholar] [CrossRef] [Green Version]
  42. Chen, X.; Zeng, D.; Ying, X.; Fan, X. Perceptions, risk attitude and organic fertilizer investment: Evidence from rice and banana farmers in Guangxi, China. Sustainability 2018, 10, 3715. [Google Scholar] [CrossRef] [Green Version]
  43. Han, S.H.; An, J.Y.; Hwang, J.; Kim, S.B.; Park, B.B. The effects of organic manure and chemical fertilizer on the growth and nutrient concentrations of yellow poplar (Liriodendron tulipifera L.) in a nursery system. Forest Sci. Tech. 2016, 12, 137–143. [Google Scholar] [CrossRef] [Green Version]
  44. Wossen, T.; Gatiso, T.T.; Kassie, M. Estimating Returns to Fertilizer Adoption with Unobserved Heterogeneity: Evidence from Ethiopia; International Institute of Tropical Agriculture (IITA): Nairobi, Kenya, 2018. [Google Scholar]
  45. Attigah, A.S.; Asiedu, K.E.; Agyarko, K.; Dapaah, H.K. Growth and yield of okra (Abelmoschu sesculentus L.) as affected by organic and inorganic fertilizers. ARPN J. Agric. Biol. Sci. 2013, 8, 766–770. [Google Scholar]
  46. Dennis, E.A.; Anane-Sakyi, C.; Affi-Pungu, G. The effect of cow dung and mineral fertilisers on yield of dry season gardening of onion in the Upper East Region of Ghana. In Proceedings of the 1st National Workshop on Food and Industrial Crops, Kumasi, Ghana, 25–27 October 1994. [Google Scholar]
  47. Kanton, R.A.L.; Prasad, P.V.V.; Mohammed, A.M.; Bidzakin, J.K.; Ansoba, E.Y.; Asungre, P.A.; Sugri, I. Organic and inorganic fertilizer effects on the growth and yield of maize in a dry agro-ecology in Northern Ghana. J. Crop Improv. 2016, 30, 1–16. [Google Scholar] [CrossRef]
  48. Jones, D.L.; Cross, P.; Withers, P.J.A.; Deluca, T.H.; Robinson, D.A.; Quilliam, R.S. Nutrient stripping: The global disparity between food security and soil nutrient stocks. J. Appl. Ecol. 2013, 50, 851–862. [Google Scholar] [CrossRef]
  49. Tittonell, P.; Giller, K.E. When yield gaps are poverty traps: The paradigm of ecological intensification in African smallholder agriculture. Field Crops Res. 2013, 143, 76–90. [Google Scholar] [CrossRef] [Green Version]
  50. Ali, E.B.; Awuni, J.A.; Danso-Abbeam, G. Determinants of fertilizer adoption among smallholder cocoa farmers in the western region of Ghana. Cogent Food Agric. 2018, 4, 1538. [Google Scholar] [CrossRef]
  51. Gedefaw, A.; Sisay, D. Factors affecting use of organic fertilizer among smallholder farmers in Sekela district of Amhara region, Northwestern Ethiopia. Cogent Food Agric. 2019, 5, 1669398. [Google Scholar] [CrossRef]
  52. Chianu, J.N.; Chianu, N.J.; Mairura, F. Organic fertilizers in Sub-Saharan farming systems. In Sustainable Agriculture Reviews; Springer: Berlin, Germany, 2012; Volume 9. [Google Scholar]
  53. Tropical Soil Biology and Fertility Institute. Integrated Soil Fertility Management in Africa: Principles, Practices and Developmental Process; CIAT: Cali, Colombia, 2009; p. 263. [Google Scholar]
  54. Cedrez, B.C.; Chamberlin, J.; Guo, Z.; Hijmans, R.J. Spatial variation in fertilizer prices in Sub-Saharan Africa. PLoS ONE 2020, 15, e0227764. [Google Scholar] [CrossRef] [Green Version]
  55. Harris, F. Management of manure in farming systems in semi-arid West Africa. Exp. Agric. 2002, 38, 131–148. [Google Scholar] [CrossRef]
  56. Food and Agriculture Organization of the United Nations (FAO). FAOSTAT Inputs/Fertilizers by Nutrient, and FAOSTAT Inputs Land Use. 2020. Available online: http://www.fao.org/faostat/en/?#data (accessed on 2 April 2021).
  57. Food and Agriculture Organization. FAOSTAT Database 2019. Available online: http://www.fao.org/faostat/en/#data (accessed on 15 February 2021).
  58. Food and Agriculture Organization of the United Nations. FAO Soils Portal FAO/UNESCO Soil Map of the World. Available online: http://www.fao.org/soils-portal/data-hub/soil-maps-and-databases/faounesco-soil-map-of-the-world/en/ (accessed on 8 April 2021).
  59. Forest Resources Assessment (FRA). Report and Database on World Forest Resources. Available online: http://www.fao.org/forest-resources-assessment/en/ (accessed on 10 February 2021).
  60. World Bank. World Development Indicators. Available online: http://data.worldbank.org/datacatalog (accessed on 2 January 2021).
  61. World Bank Groups. Database on Literacy Rate. Available online: https://data.worldbank.org/indicator/SE.ADT.LITR.ZS (accessed on 4 January 2021).
  62. World Income Inequalities Databases (WID). Available online: https://wid.world/ (accessed on 20 February 2021).
  63. National Aeronautics and Space Administration (NASA). Available online: https://www.neo.sci.gsfc.nasa.gov (accessed on 7 January 2021).
  64. Global Soil Data Task Group (GSDTG). Global Gridded Surfaces of Selected Soil Characteristics (IGBP-DIS). Available online: http://www.daac.ornl.gov/cgi-bin/dsviewer.pl?ds_id=569 (accessed on 15 January 2021).
  65. ISRIC. WoSIS Soil Profile Database. Available online: https://www.isric.org/explore/wosis (accessed on 3 March 2021).
  66. Harttgen, K.; Vollmer, S. Inequality decomposition without income or expenditure data using an asset index to simulate household income. In Human Development Research; UNDP: New York, NY, USA, 2011. [Google Scholar]
  67. Salem, N.; Hussein, S. Data dimensional reduction and principal components analysis. Procedia Comput. Sci. 2019, 163, 292–299. [Google Scholar] [CrossRef]
  68. Nguyen, L.H.; Holmes, S. Ten quick tips for effective dimensionality reduction. PLoS Comput. Biol. 2019, 15, e1006907. [Google Scholar] [CrossRef] [PubMed] [Green Version]
  69. ESRI. ArcGIS Desktop: Release 10; Environmental Systems Research Institute: Redlands, CA, USA, 2019. [Google Scholar]
  70. Crawford, E.W.; Jayne, T.S.; Kelly, V.A. Alternative Approaches for Promoting Fertilizer Use in Africa, with Particular Reference to the Role of Fertilizer Subsidies; Department of Agricultural Economics Michigan State University: East Lansing, MI, USA, 2005. [Google Scholar]
  71. Stewart, Z.P.; Pierzynski, G.M.; Middendorf, J.; Prasad, V. Approaches to improve soil fertility in Sub-Saharan Africa. J. Exp. Bot. 2020, 71, 632–641. [Google Scholar] [CrossRef] [Green Version]
  72. Bationo, A.; Ntare, B.R.; Tarawali, S.A.; Tabo, R. Soil fertility management and cowpea production in the semiarid tropics. In Challenges and Opportunities for Enhancing Sustainable Cowpea Production; Fatokun, C., Tarawali, S., Singh, B., Kormawa, P., Tamo, M., Eds.; IITA: Ibadan, Nigeria, 2002; pp. 301–318. [Google Scholar]
  73. Vanlauwe, B.; Bationo, A.; Chianu, J.; Giller, K.E.; Merckx, R.; Mokwunye, U.; Ohiokpehai, O.; Pypers, P.; Tabo, R.; Shepherd, K.D. Integrated soil fertility management: Operational definition and consequences for implementation and dissemination. Outlook Agric. 2010, 39, 17–24. [Google Scholar] [CrossRef] [Green Version]
  74. Vanlauwe, B.; Wendt, J.; Diels, J. Combined application of organic matter and fertilizer. In Sustaining Soil Fertility in West Africa; American Society of Agronomy: Madison, WI, USA, 2001. [Google Scholar]
  75. Watson, M. Agricultural infrastructure development imperative for sustainable food production: A Zimbabwean perspective. Russ. J. Agric. Soc. Econ. Sci. 2013, 24, 13–21. [Google Scholar]
  76. Gouache, D.; Bris, X.L.; Bogard, M.; Deudon, O.; Pagé, C.; Gate, P. Evaluating agronomic adaptation options to increasing heat stress under climate change during wheat grain filling in France. Europ. J. Agron. 2012, 39, 62–70. [Google Scholar] [CrossRef]
  77. Bennett, D.J.; Jennings, R.C. Successful Agricultural Innovation in Emerging Economies; Cambridge University Press: Cambridge, UK, 2013. [Google Scholar]
  78. Komarek, A.M.; Drogue, S.; Chenoune, R.; Hawkins, J.; Msangi, S.; Belhouchette, H.; Flichman, G. Agricultural household effects of fertilizer price changes for smallholder farmers in central Malawi. Agric. Syst. 2017, 154, 168–178. [Google Scholar] [CrossRef]
  79. Akram, U.; Metson, G.S.; Quttineh, N.H.; Wennergren, U. Closing Pakistan’s yield gaps through nutrient recycling. Front. Sustain. Food Syst. 2018, 2, 24. [Google Scholar] [CrossRef] [Green Version]
  80. Kannan, P.; Paramasivan, M.; Marimuthu, S.; Swaminathan, C.; Jayakumar, B. Applying both biochar and phosphobacteria enhances Vigna mungo L. growth and yield in acid soils by increasing soil pH, moisture content, microbial growth and P availability. Agric. Ecosyst. Environ. 2021, 308, 107258. [Google Scholar] [CrossRef]
  81. Vico, A.; Sáez, J.A.; Pérez-Murcia, M.D.; Martinez-Tomé, J.; Andreu-Rodríguez, J.; Agulló, E.; Bustamante, M.A.; Sanz-Cobena, A.; Moral, R. Production of spinach in intensive Mediterranean horticultural systems can be sustained by organic-based fertilizers without yield penalties and with low environmental impacts. Agric. Syst. 2020, 178, 102765. [Google Scholar] [CrossRef]
  82. Correndo, A.A.; Rotundo, J.S.; Nicolas, T.; Sotirios, A.; Jeffrey, A.; Dorivar Ruiz-Diaz, C.; Franzen, D.; Franzluebbers, A.J.; Emerson, N.; Schwalbert, R.; et al. Assessing the uncertainty of maize yield without nitrogen fertilization. Field Crops Res. 2021, 260, 107985. [Google Scholar] [CrossRef]
  83. Fontana, M.B.; Novelli, L.E.; Sterren, M.A.; Uhrich, W.G.; Benintende, S.M.; Barbagelata, P.A. Long-term fertilizer application and cover crops improve soil quality and soybean yield in the Northeastern Pampas region of Argentina. Geoderma 2021, 385, 114902. [Google Scholar] [CrossRef]
  84. Tibbett, M.; Daws, M.I.; George, S.J.; Ryan, M.H. The where, when and what of phosphorus fertilisation for seedling establishment in a biodiverse jarrah forest restoration after bauxite mining in Western Australia. Ecol. Eng. 2020, 153, 105907. [Google Scholar] [CrossRef]
  85. Scholz, R.W.; Geissler, B. Feebates for dealing with trade-offs on fertilizer subsidies: A conceptual framework for environmental management. J. Clean. Prod. 2018, 189, 898–909. [Google Scholar] [CrossRef]
  86. Yan, Z.; Liu, P.; Li, Y.; Ma, L.; Alva, A.; Dou, Z.; Zhang, F. Phosphorus in China’s intensive vegetable production systems: Overfertilization, soil enrichment, and environmental implications. J. Environ. Qual. 2013, 42, 982–989. [Google Scholar] [CrossRef]
  87. Heffer, P.; Prud’homme, M. Fertilizer outlook 2015–2019. In Proceedings of the IFA Annual Conference, Instanbul, Turkey, 25–27 May 2015. [Google Scholar]
  88. Hofstetter, P.; Müller-Wenk, R. Monetization of health damages from road noise with implications for monetizing health impacts in life cycle assessment. J. Clean. Prod. 2015, 13, 1235–1245. [Google Scholar] [CrossRef]
  89. Ju, X.T.; Gu, B.J. Status-quo, problem and trend of nitrogen fertilization in China. J. Plant Nutr. Fert. Sci. 2014, 20, 783–795. [Google Scholar]
  90. Denning, G.; Kabambe, P.; Sanchez, A.; Malik, R.; Flor, R.; Harawa, P.; Nkhoma, C.; Zamba, C.; Banda, C.; Magombo, M.; et al. Input subsidies to improve smallholder maize productivity in Malawi: Toward an African green revolution. PLoS Biol. 2009, 7, e1000023. [Google Scholar] [CrossRef] [Green Version]
  91. Gaba, S.; Lescourret, F.; Boudsocq, S.; Enjalbert, J.; Hinsinger, P.; Journet, E.P.; Navas, M.L.; Wery, J.; Louarn, G.; Malézieux, E.; et al. Multiple cropping systems as drivers for providing multiple ecosystem services: From concepts to design. Agron. Sustain. Dev. 2015, 35, 607–623. [Google Scholar] [CrossRef] [Green Version]
  92. Waha, K.; Dietrich, J.P.; Portmann, F.T.; Siebert, S.; Thornton, P.K.; Bondeau, A.; Herrero, M. Multiple cropping systems of the world and the potential for increasing cropping intensity. Glob. Environ. Chang. 2020, 64, 102131. [Google Scholar] [CrossRef] [PubMed]
  93. Ray, D.K.; Foley, J.A. Increasing global crop harvest frequency: Recent trends and future directions. Environ. Res. Lett. 2013, 10, 44041. [Google Scholar] [CrossRef]
  94. Wu, W.; Yu, Q.; You, L.; Chen, K.; Tang, H.; Liu, J. Global cropping intensity gaps: Increasing food production without cropland expansion. Land Use Policy 2018, 76, 515–525. [Google Scholar] [CrossRef]
  95. Qiu, J.; Tang, H.; Frolking, S.; Boles, S.; Li, C.; Xiao, X.; Liu, J.; Zhuang, Y.; Qin, X. Mapping single-, double-, and triple-crop agriculture in china at 0.5° × 0.5° by combining county-scale census data with a remote sensing-derived land cover map. Geocarto Int. 2003, 18, 3–13. [Google Scholar] [CrossRef]
  96. Government of India. Agricultural Statistics at a Glance 2016; Government of India: New Delhi, India, 2016.
  97. Teklewold, H.; Kassie, M.; Shiferaw, B.; Köhlin, G. Cropping system diversification, conservation tillage and modern seed adoption in Ethiopia: Impacts on household income, agrochemical use and demand for labor. Ecol. Econ. 2013, 93, 85–93. [Google Scholar] [CrossRef]
  98. Waha, K.; Herrero, M. Multiple Cropping Could Help Feed the World. Available online: https://ccafs.cgiar.org/news/multiple-cropping-could-help-feed-world (accessed on 16 January 2021).
  99. Mayberry, D.; Hau, D.K.; Dida, P.R.; Bria, D.; Praing, J.; Mata, A.D.; Budisantoso, E.; Dalgliesh, N.; Quigley, S.; Bell, L.; et al. Herbaceous legumes provide several options for increasing beef cattle productivity in eastern Indonesia. Anim. Prod. Sci. 2021, 61, 20545. [Google Scholar] [CrossRef]
  100. Failla, S.; Pirchio, M.; Sportelli, M.; Frasconi, C.; Fontanelli, M.; Raffaelli, M.; Peruzzi, A. Evolution of smart strategies and machines used for conservative management of herbaceous and horticultural crops in the Mediterranean basin: A review. Agronomy 2021, 11, 106. [Google Scholar] [CrossRef]
  101. Zalesny, R.S.; Stanturf, J.A.; Gardiner, E.S.; Perdue, J.H.; Young, T.M.; Coyle, D.R.; Headlee, W.L.; Bañuelos, G.S.; Hass, A. Ecosystem services of woody crop production systems. Bioenergy Res. 2016, 9, 465–491. [Google Scholar] [CrossRef] [Green Version]
  102. Pleguezuelo, C.R.R.; Zuazo, V.H.D.; Bielders, C.; Bocanegra, J.A.J.; Perea Torres, F.; Martínez, J.R.F. Bioenergy farming using woody crops. A review. Agron. Sustain. Dev. 2015, 35, 95–119. [Google Scholar] [CrossRef] [Green Version]
  103. Jorgenson, K.; Ryan, P.; Clark, T.B.; Givens, J.E.; Hill, T.D.; Huang, X.; Kelly, O.M.; Fitzgerald, J.B. Inequality amplifies the negative association between life expectancy and air pollution: A cross-national longitudinal study. Sci. Total Environ. 2021, 758, 143705. [Google Scholar] [CrossRef]
  104. Mohammadbeigi, A.; Khazaei, S.; Veisani, Y.; Delpisheh, A.; Jenabi, E. Global inequality in the incidence and mortality rate of melanoma skin cancer according to human development index: A country-level analysis. Egypt J. Dermatol. Venerol. 2021, 41, 26–31. [Google Scholar]
  105. Huh, H.S.; Park, C.Y. A new index of globalisation: Measuring impacts of integration on economic growth and income inequality. World Econ. 2020, 44, 409–443. [Google Scholar] [CrossRef]
  106. Gutiérrez-Romero, R.; Ahamed, M. COVID-19 response needs to broaden financial inclusion to curb the rise in poverty. World Dev. 2021, 138, 105229. [Google Scholar] [CrossRef]
  107. Henderson, K.; Loreau, M. Unequal access to resources undermines global sustainability. Sci. Total Environ. 2021, 763, 142981. [Google Scholar] [CrossRef]
  108. Blampied, N. Economic growth, environmental constraints and convergence the declining growth premium for developing economies. Ecol. Econ. 2021, 181, 106919. [Google Scholar] [CrossRef]
  109. Liverpool-Tasie, S. Fertilizer subsidies and private market participation: The case of Kano state, Nigeria. Agric. Econ. 2014, 45, 1–16. [Google Scholar] [CrossRef]
  110. Holden, S.T. Fertilizer and sustainable intensification in Sub-Saharan Africa. Glob. Food Secur. 2018, 18, 20–26. [Google Scholar] [CrossRef]
  111. Najafi, E.; Devineni, N.; Khanbilvardi, R.M.; Kogan, F. Understanding the changes in global crop yields through changes in climate and technology. Earths Future 2018, 6, 410–427. [Google Scholar] [CrossRef]
  112. Sinare, B.; Miningou, A.; Nebié, B.; Eleblu, J.; Kwadwo, O.; Traoré, A.; Zagre, B.; Desmae, H. Participatory analysis of groundnut (Arachis hypogaea L.) cropping system and production constraints in Burkina Faso. J. Ethnobiol. Ethnomed. 2021, 17. [Google Scholar] [CrossRef]
  113. Xu, X.; Liu, H.; Jiao, F.; Ren, Y.; Gong, H.; Lin, Z.; Huang, C. Influence of climate change and human activity on total nitrogen and total phosphorus: A case study of Lake Taihu, China. Lake Reserv. Manag. 2020, 36, 186–202. [Google Scholar] [CrossRef]
  114. Jose, C.P.; Tania, C.; Maribela, P. Evaluation of carob tree productivity during a 30-Year Period, in relation to precipitation and air temperature. Environ. Proc. Int. J. 2020, 7, 1221–1233. [Google Scholar]
  115. Rehman, A.; Jingdong, L.; Kabir, A.; Hussain, I. Effects of wheat yield and area under wheat crop on agricultural GDP in Pakistan: An econometric analysis. Int. J. Adv. Appl. Sci. 2017, 4, 137–141. [Google Scholar]
  116. Singh, G.; Nelson, K.A. Long-term drainage, subirrigation, and tile spacing effects on maize production. Field Crops Res. 2021, 262, 108032. [Google Scholar] [CrossRef]
  117. Olabanji, M.F.; Ndarana, T.; Davis, N. Impact of climate change on crop production and potential adaptive measures in the olifants catchment, South Africa. Climate 2021, 9, 6. [Google Scholar] [CrossRef]
  118. Gao, J.; Yan, Y.; Hou, X.; Liu, X.; Zhang, Y.; Huang, S.; Wang, P. Vertical distribution and seasonal variation of soil moisture after drip-irrigation affects greenhouse gas emissions and maize production during the growth season. Sci. Total Environ. 2021, 763, 142965. [Google Scholar] [CrossRef] [PubMed]
  119. Macdonald, B.C.T.; Nachimuthu, G.; Chang, Y.F.; Nadelko, A.J.; Tuomi, S.; Watkins, M. Nitrogen composition in furrow irrigated run-off water. Agric. Water Manag. 2020, 242, 106399. [Google Scholar] [CrossRef]
  120. Anwar, M.; Patra, D.D.; Chand, S.; Alpesh, K.; Naqvi, A.A.; Khanuja, S.P.S. Effect of organic manures and inorganic fertilizer on growth, herb and oil yield, nutrient accumulation, and oil quality of French basil. Commun. Soil Sci. Plant Anal. 2005, 36, 1737–1746. [Google Scholar] [CrossRef]
  121. Oenema, O. Government policies and measures regulating nitrogen and phosphorus from animal manure in European agriculture. J. Anim. Sci. 2004, 82, 196–206. [Google Scholar]
  122. NRCS-USDA. Draft Comprehensive Nutrient Management Planning Technical Guidance. Available online: https://www.nrca.usda.gov/programs/afo/cnmp_guide_600.50.html (accessed on 3 March 2021).
  123. Huang, J.; Wang, X.; Rozelle, S. The subsidization of farming households in China’s agriculture. Food Policy 2013, 41, 124–132. [Google Scholar] [CrossRef]
Figure 1. Total subsidized fertilizer use for agriculture from 2000 to 2019 (in kg ha−1). Source: Authors’ own collation, analysis, and mapping using data from FAO [56,57,58] and IFA [37].
Sustainability 13 09408 g001
Figure 2. NPK use per area of cropland based on continents from 2000 to 2019. Source: Authors’ own collation, analysis, and mapping using data from FAO [56,57,58] and IFA [37].
Sustainability 13 09408 g002
Figure 3. Total global NPK use (in million tonnes) and total crop production (in million tonnes). Source: Authors’ own collation, analysis, and mapping using data from FAO [56,57,58] and IFA [37].
Sustainability 13 09408 g003
Figure 4. Average agricultural crop production quantity from 2000 to 2019 (in tonnes). Source: Authors’ own collation, analysis, and mapping using data from FAO [56,57,58] and IFA [37].
Sustainability 13 09408 g004
Figure 5. Average area covered by different crop types on different continents from 2000 to 2019 (in % and 1000 ha). Source: Authors’ own collation, analysis, and mapping using data from FAO [56,57,58] and IFA [37].
Sustainability 13 09408 g005
Figure 6. Average income (PPP) per citizen in USD from 2000 to 2019. Source: Authors’ own collation and analysis using data from World Bank [60,61] and World Income Inequalities Database, WID [62].
Sustainability 13 09408 g006
Figure 7. Cropland cover from 2000 to 2019. Source: Authors’ own collation, normalization, analysis, and mapping using data from FAO [56,57,58] and NASA [63].
Sustainability 13 09408 g007
Figure 8. Environmental parameters as determinants of crop production from 2000 to 2019. (a) Average precipitation (in mm), (b) average soil water-holding capacity (WHC), (c) soil texture, and (d) average soil pH and soil categories. Source: Authors’ own collation, analysis, and mapping using data from FAO [56,57,58], NASA [63], GSDTG [64], and WoSIS [65].
Sustainability 13 09408 g008
Figure 9. Organic manure production (on average) from 2000 to 2019 (a) by type and region, (b) proportion/percentage share of the world’s production by continent. Animal manure includes goat and sheep droppings, pig and hog dung, cow dung, and horse droppings; poultry includes all birds and poultry livestock; green manure includes plant residues and farm wastes, such as fresh plant materials and dry litters, mulching materials, and decomposed plants; composts include domestic, rural, semi-urban, and urban composts; sawdust consists of wood and timber products from wood mill industries and stations. Sources: Authors’ compilation and analysis using data from Food and Agriculture Organization of the United Nations FAO [56,57,58].
Sustainability 13 09408 g009
Table 1. Summary of correlation analysis between studied parameters.
ParametersFertilizer UseCropProdQtyCrop TypesIncomeCroplandCoverTemperaturePrecipitationSoil pHSoil WHCSoil TextureGDPFood ImportFood Export
Fertilizer Use1.00
CropProdQty0.93 *1.00
Crop Types0.030.68 *1.00
Income0.61 **0.50 *0.051.00
CroplandCover0.070.82 **0.000.74 *1.00
Temperature0.190.66 *0.58 *0.23 *0.001.00
Precipitation0.580.73 **0.69 *−0.070.00−0.141.00
Soil pH0.60 *0.51 *0.060.000.000.000.051.00
Soil WHC0.320.45 *0.010.000.00−0.09−0.67 *0.501.00
Soil Texture0.020.61 *0.000.110.000.000.020.330.88 *1.00
GDP0.67 *0.91 *0.000.83 *0.37 *0.250.000.000.040.001.00
Food Import−0.55−0.120.00−0.440.160.000.000.000.010.070.001.00
Food Export0.630.57 *0.000.75 *0.59 **0.000.230.000.350.140.79 *−0.511.00
* Correlation is statistically significant at p < 0.05; ** Correlation is statistically significant at p < 0.01. Description of Abbreviations: CropProdQty = Crop Production Quantity; Soil WHC = Soil Water-Holding Capacity. Source: Authors’ analysis and computation.
Publisher’s Note: MDPI stays neutral with regard to jurisdictional claims in published maps and institutional affiliations.

