Article

Research on Route Optimization of Hazardous Materials Transportation Considering Risk Equity

Business School, East China University of Science and Technology, Shanghai 200237, China
*
Author to whom correspondence should be addressed.
Sustainability 2021, 13(16), 9427; https://doi.org/10.3390/su13169427
Submission received: 7 July 2021 / Revised: 16 August 2021 / Accepted: 17 August 2021 / Published: 22 August 2021

Abstract

:
The consequences of a hazmat accident can be catastrophic due to the characteristics of hazardous materials. Different from the models, which are constructed from the perspective of “government-carrier”, this paper considers the three objectives of the risk, the cost, and the compensation cost from the “government-carrier-public” perspective, so as to construct a route optimization model of hazmat transportation considering risk equity. Moreover, considering that the difference in regional emergency response time will significantly affect the risk, this research incorporates the emergency response time into the transportation risk assessment function, and realizes risk equity by minimizing the total compensation cost based on the difference in regional emergency response time. To solve the proposed model, a multi-objective genetic algorithm based on linear weighting is designed. The results obtained from the case study verify the necessity of considering the risk equity in the route optimization model of hazardous materials transportation and prove that the established model and algorithm can find an optimal route that meets the expectations of the government, the carrier, and the public.

1. Introduction

Hazardous material (hazmat) refers to any type of substance that is capable of causing harm to people, property, or the environment. The transportation of hazmat is essential not only for industrial countries like Germany and Canada, but also for developing countries, resulting in the fact that the amount of hazmat transportation has reached an unprecedented level in the past decade. Because many hazardous materials are flammable, explosive, or corrosive, the risk generated by an accident during transportation must be considered; otherwise, the consequences will be catastrophic. For example, in July 2013, a driverless train with 72 tank cars of petroleum crude oil derailed in the city center in Lac-Mégantic, Quebec, Canada, causing the death of at least 42 persons. On 1 July 2019, a tanker truck in Nigeria overturned and caught fire, leading to 48 deaths, and the number of injuries was greater than 90. On 13 June 2020, a truck transporting liquefied petroleum gas exploded on the Shenhai Expressway in Wenling City, Zhejiang Province, killing 20 people and seriously injuring 24 others. Considering the tremendous consequences of a hazmat accident, many governments have established specific regulations for hazmat transportation. In addition, many studies on hazmat transport have been conducted in terms of risk assessment, routing, network design, etc. Some literature [1,2,3] on route optimization of hazmat transportation usually establish a model considering the transportation risk and transportation cost from the perspectives of “government-carrier”.
However, with the development of society, the public is given increasing importance to equity, and the concept of equity has been introduced into various research fields. For the transportation of hazmat, apart from the total network risk, the risk equity, i.e., the “fairness” of the spatial distribution of risk, should also be considered. When a certain route is selected as the transportation route for hazmat, it will naturally increase the risks around the route. Therefore, some literature [4,5] has begun to add the objective of risk equity to establish a route optimization model of hazmat transportation considering transportation risk, transportation cost, and risk equity from the “government-carrier-public” perspective.
When assessing transportation risk in the route optimization model of hazmat transportation, studies [6,7,8,9] have adopted the population exposure risk approach. However, they mostly select the optimal route from the perspective of ex-ante planning, ignoring the importance of ex-post processing. When a hazmat accident occurs during transportation, the response of emergency departments near the link will decrease the harm. Therefore, it is of great practical significance to consider the impact of the emergency response time on the transportation risk and risk equity. By integrating the emergency response time, we present a more practical risk assessment approach in order to construct a route optimization model of hazmat transportation from the perspective of ex-post processing. The main contributions of this study are that the emergency response time of the emergency departments around the link is included in the transportation risk assessment function. In the risk equity model, the risk compensation is made for the links that exceed the average risk of the selected route from the perspective of the risk compensation cost to highlight the risk equity.
The study is structured as follows. The related literature is summarized in Section 2. Model building is presented in Section 3. Section 4 introduces the Solution produce. The computational results of the numerical study are presented and analyzed in Section 5, before ending with the conclusions and future research.

2. Literature Review

In this section, we briefly review several streams in hazmat transportation research relevant to this paper: (1) Risk assessment, (2) route optimization, and (3) risk equity consideration.

2.1. Risk Assessment

The risk caused by an accident during hazmat transportation makes the transportation problem of hazmat much more complicated than when other materials are moved. How to measure the transportation risk of hazmat is one of the important issues in the field of hazmat transportation, because how to reduce the accidents of hazardous materials has become an important and urgent research topic in the safety management of hazardous materials [10].
The risk makes the transportation problem of hazmat much more complicated than when other materials are moved. Therefore, a variety of models have already been proposed to assess the risk in hazmat transportation.
Alp [11] used the approach of Traditional Risk to capture risk. Saccomanno and Chan [12] proposed the Incident Probability model, which focused on using accident probability to represent risk. The Population Exposure model was used to measure the risk in hazmat transportation [13,14,15,16,17]. Erkut and Ingolfsson [18] proposed three risk measurement models based on the avoidance of major disasters. Many popular risk assessment approaches in earlier studies are summarized [19].

2.2. Route Optimization

It is necessary not only to evaluate the transportation risk of hazmat to construct a transportation risk assessment function, but also to consider the influence of road speed limits, traffic restrictions, vehicle capacity, road capacity, and other factors on the route optimization model of hazmat transportation during the transportation, so as to construct a route optimization model that can better comprehend the transportation situation of hazmat in reality.
At present, many studies focus on the measurement of population risk in the route optimization of hazmat transportation. Considering factors such as the number of exposed people and accident probability in the transportation of hazmat, scholars have constructed the route optimization models of hazmat transportation that consider population risks [20,21]. Afterwards, Qu et al. [22] made improvements to the traditional model in terms of transportation methods, accident probability, and consequences. Bronfman et al. [23] maximized the distance from population centers to hazmat transportation routes to reduce risk. Financial risk assessment tools such as VaR and CVaR have also been introduced in the route optimization model of hazmat transportation that consider population risk [24,25]. In addition to considering minimizing the total population risk, scholars also pay more attention to the trade-off between the two goals of risk and cost from the perspective of the government and the enterprise [1,2,3,4]. Scholars have begun to pay attention to the influence of uncertain factors such as road closures and emergencies on the route optimization of hazmat transportation considering population risks. Fan et al. [26] constructed a route optimization model considering road closure to solve the problem of urban hazmat transportation route optimization. Mohammadi et al. [27] studied the route optimization under the random interruption scenario of the multimodal transportation hub of hazmat. Hu et al. [28] established a multi-objective location path optimization model that can solve the problems of risk, cost, and customer satisfaction in the management of dangerous goods transportation under the constraints of traffic restrictions. Su et al. [29] considered the uncertainty of the carrier’s route choice and constructed a model based on the conditional value-at-risk (CVaR) for route choice.

2.3. Risk Equity Consideration

Since the transportation of hazmat will bring great potential risks, for the government, the main focus is to minimize the risks in the road transportation network. However, the consequence of such a decision may lead to a situation where hazmat is concentrated in a certain area and flows less frequently in other areas. Although route optimization has been achieved at the government level, for the public, especially those near the section where hazmat is transported, they will think that they are taking more risks than other individuals, and this will be psychologically unfair. Therefore, as the public’s awareness of risk equity increases, in the process of route optimization of hazmat transportation, risk equity should also be considered, that is, to make the spatial distribution of risks more balanced.
Holeczek [30] proposed that the fair distribution of risk may appear as a good risk management strategy, especially in the eyes of the public. Keeney [31] first proposed in 1980 that risk equity is the maximum difference of risk levels between a fixed group of individuals. After that, Gopalan et al. [32,33] first introduced risk equity into vehicle path optimization as a constraint condition and established single-path and multi-path models for hazardous materials’ transportation in order to minimize transportation risk and achieve risk distribution equity on the premise that the risk difference assumed through the population region is less than the set threshold. Carotenuto et al. [34] fairly distributed the risk of hazardous materials transportation to the population by setting a risk threshold for each link. Kang et al. [35] introduced the value at risk model (VaR) from the financial field into the risk assessment of hazardous materials’ transportation and set the risk threshold for the risk difference between any two regions. Garrido and Bronfman [36] set an acceptable threshold for accident probability and accident consequences in urban transportation of a variety of hazardous materials, establishing a model accordingly. Fang et al. [37] proposed a risk threshold on each service leg, through which the speed-dependent risk was ensured to be spread equitably in a railway network. Hosseini and Verma [38] imposed threshold restrictions on both the yards and arcs of the railroad network so that equitable distribution of risk across the network was guaranteed.
In the above literature, risk equity is described as a constraint condition, and risk equity is realized by directly setting the risk difference threshold. Another approach that has been applied in the literature on risk equity is the minmax method, which minimizes the maximum differential total risk or the risk value. For the purpose of making risk distribution more balanced, Lindner-Dutton et al. [39] proposed a measurement model to minimize the sum of maximum risk differences between every O-D pair over all shipments. Current and Ratick [40] formulated a mixed-integer program to locate facilities to handle hazmat, such that the maximum hazmat amounts shipped past any individual person and any facility are minimized. List and Mirchandani [41] used the maximum regional risk assumed by each unit of population to measure the equity of the risk distribution of the entire transportation network in the route selection model of hazardous materials transportation. Verter and Kara [42] applied the above method to a case study and discussed the risk equity of natural gas road transportation between Quebec and Ontario. To determine the safest set of routes, Bell [43] used the minmax method in the case of a risk-averse attitude towards hazmat shipments. Bianco et al. [44] formulated a linear bilevel programming model for the design of the hazardous materials’ transportation network, considering the equity of risk by minimizing the maximum link risk of overpopulated links of the entire network. Bianco et al. [5] minimized the maximum total link risk to ensure the spreading of risk in an equitable way. Chiou [45] proposed a stochastic program to reduce maximum time-varying risk over links to promote equity of risk in a spatial distribution. Ke et al. [6] minimized the maximum link risk to attain risk equity under a bi-level problem setting.

3. Model Building

3.1. Model Hypothesis

To simplify the problem, the present paper assumes the following:
  • In the constructed model, only one carrier in operation is considered, without considering other carriers.
  • The population density around the link depends on the population density of the geographic area to which it belongs. Considering the uncertainty of the population density, we treat it as an interval number.
  • Assume that the transportation cost of hazmat vehicles on the link is determined by the driving time, that is, the transportation cost is determined by the travel distance and driving speed.
  • Considering that the speed of a hazmat vehicle is an uncertain value, the driving speed of different hazmat types on link are treated as the number of intervals.

3.2. Problem Description

In fact, there are many uncertain parameters in the entire transportation network. Although the probability of a transportation accident is not only related to the type of hazmat, but also related to weather, time, road conditions, vehicle conditions, and professional skills of transport personnel, the accident probability can be obtained through historical data. So, the probability of transportation accidents is expressed as the product of the accident probability per kilometer when transporting h-type hazmat and the length of link ( i , j ) in this research. The population density around the link is determined in this research by the population density of the geographical area to which the link belongs. Moreover, we consider the emergency response time of the emergency response departments near the link from the perspective of ex-post-processing and add the emergency response time to the risk assessment function. Considering the risk differences between the different links, risk equity is realized from the perspective of risk compensation cost. Therefore, a multi-objective route optimization model of hazmat considering transportation risk, transportation cost, and risk equity is proposed.

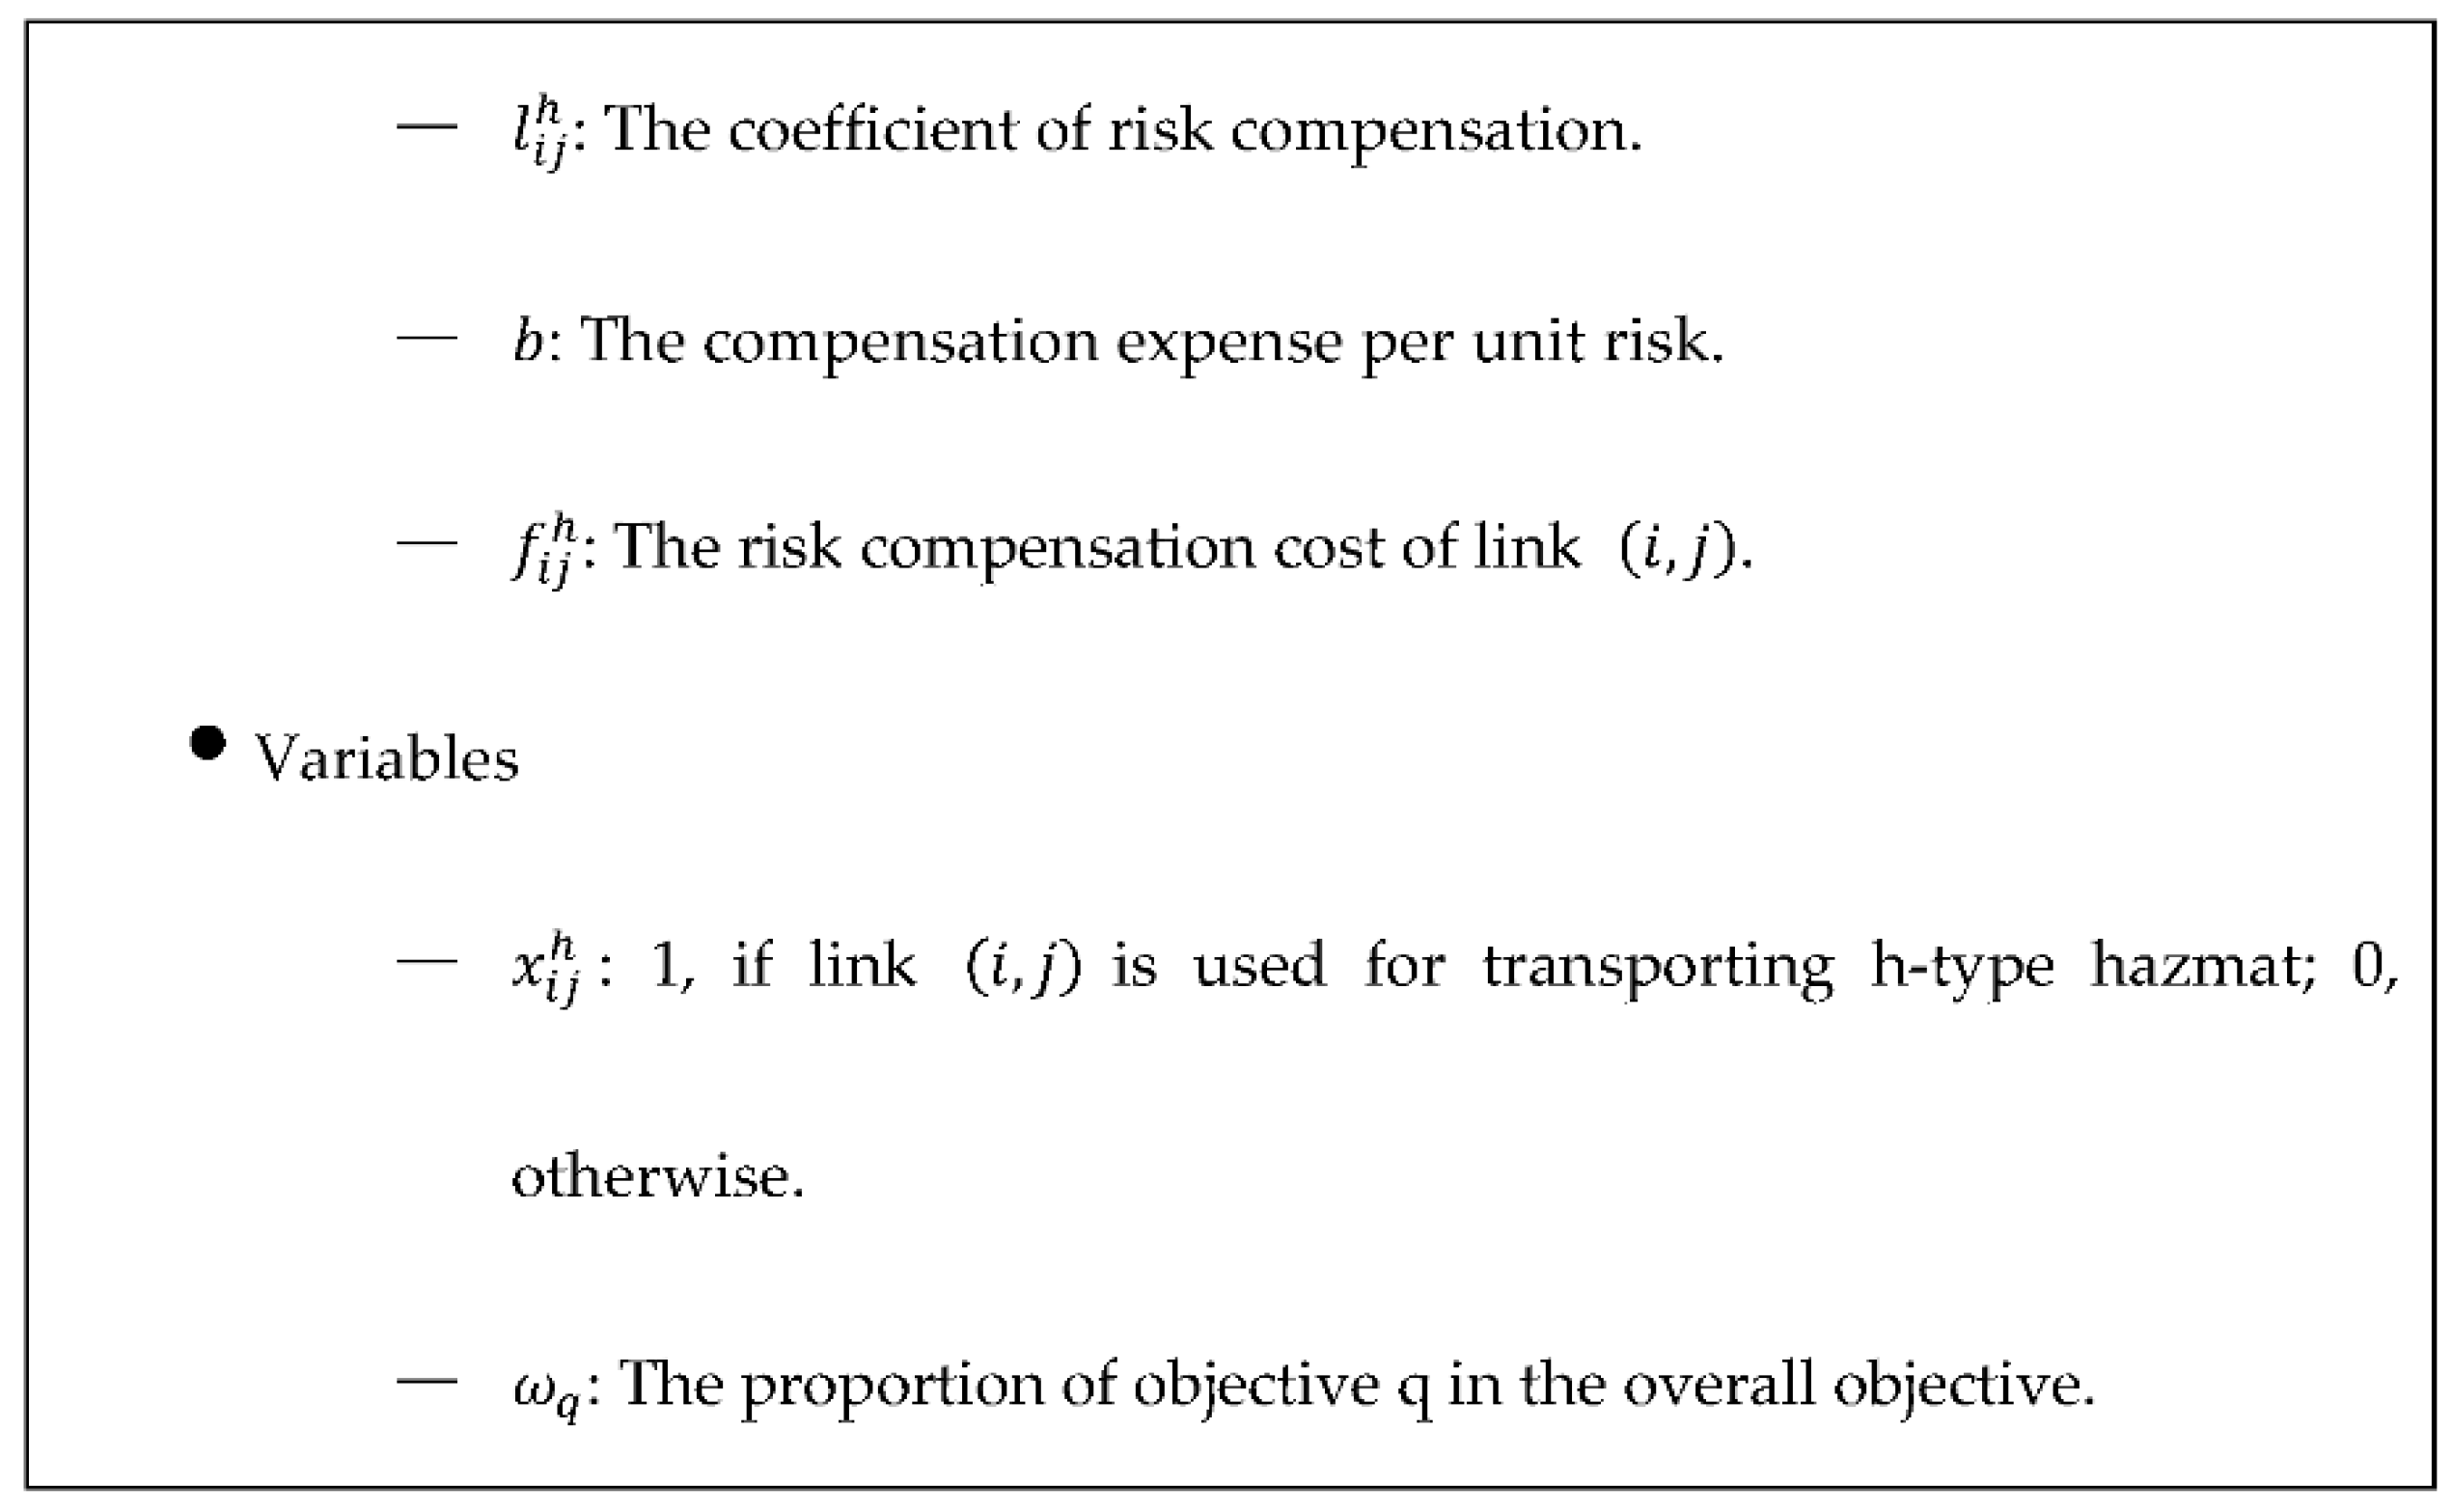
3.3. Parameter Description

The transportation network is represented by a graph G = ( N , A ) , where N is the set of nodes and A is the set of links. The transportation of hazmat requires the carrier to transport various hazmat types through the road network from the starting point to the end point. There are multiple feasible routes for the transportation of hazmat between the starting point and end point. The constructed route optimization model of hazmat can select the optimal transportation route in order to meet the expectations of the government, the carrier, and the public. The parameters and variable symbols used in this paper are described in Figure 1.

3.4. Mathematical Formulation

The transportation network is represented by a graph G = ( N , A ) with a set of nodes N and a set of links A. According to [33], if λ represents the radius of the spread, people within the λ neighbourhood of a link could potentially be affected.
Therefore, the area of the affected range is:
S i j = 2 λ h d i j + π ( λ h ) 2
In this section, considering the uncertainty of population density, ρ z   is treated as an interval number, that is,   ρ z = [ ρ z , ρ z + ] . Therefore, the population number affected by a hazmat transportation accident on link i , j   is as follows:
P O P i j h = S i j [ ρ z , ρ z + ]
According to [46], P h is defined as the accident probability per kilometer of h-type hazmat. When transporting h-type hazmat, the accident probability on link ( i , j )   can be expressed as:
P i j h = P h d i j
According to a standard of emergency response coverage document report prepared by Portland Fire and Rescue (PFR), 90% of hazmat accidents in urban areas can be responded to within 18 min while maintaining an acceptable response level, but the delay of the emergency response time can greatly increase the harm generated by a hazmat accident. However, there are some differences in the emergency response time of emergency departments near different links. The shorter the emergency response time, the more effectively the emergency department can reduce the consequences of an accident and the possibility of a secondary accident; that is, the transportation risk caused by a hazmat accident is smaller, so the transportation risk in this paper is represented by the product of the accident probability, the accident consequence, and the emergency response time.
R i j h = P i j h P O P i j h t i j
From the perspective of the carrier, the transport cost refers to the cost of fuel. In this paper, the transportation cost considered by the carrier is expressed as the time cost, which is related not only to the travel distance and the driving speed of the vehicle on the link ( i , j ) , but also to the transportation cost per unit time of h-type hazmat. Considering that the speed of an h-type hazmat vehicle travelling on link ( i , j )   is uncertain, it is treated as an interval number, that is, v i j h = [ v i j h , v i j h + ] .
The transportation cost is then expressed as follows:
C i j h = C h d i j [ v i j h ,   v i j h + ]
In this paper, risk equity is quantified by means of the risk compensation cost and optimized as one of the multi-objective functions. In this paper, we define risk compensation as follows: In view of the potential risks during transportation and according to the corresponding risk evaluation standards, risk bearers around the links of the transportation network will be compensated with a certain price before an accident occurs to reflect the risk equity. On this basis, this paper makes the following improvements. First, the transportation risk model in this paper takes the difference in the emergency response time of emergency response departments near links into account. Therefore, different from the simple consideration of population exposure risk, the risk equity model in this paper covers the risk injustice caused by the difference in the emergency response time of links. Second, different from the cost of risk compensation for individuals, the risk compensation cost in this paper is for the links that exceed the average risk. Finally, the risk equity model in this paper takes the change in risk equity into account when there is more than one hazmat in the transportation network.
In this paper, the risk compensation cost on link ( i , j )   is the product of the risk compensation coefficient, the unit risk compensation cost, and the risk. The expression of the risk compensation cost is as follows:
f i j h = l i j h R i j h b
where R i j h represents the transportation risk on link ( i , j ) , b represents the compensation expense per unit risk, and l i j h represents the coefficient of the risk compensation, which is determined by the difference ratio between the transportation risk on link ( i , j )   and the average risk of the selected route. The formula is as follows:
l i j h = { R i j h R h ¯ R h ¯ , R i j h R h ¯ > 0 0 , R i j h R h ¯ < 0   ( i , j ) A , h H
Because the objective functions and constraint conditions both contain interval numbers, which cannot be solved directly, the model can be deterministically transformed by the method of interval number sorting.
For the interval number, substituting the maximum and minimum values of the interval numbers into the parameters, we can obtain the maximum and minimum values of the parameters containing the interval number, as shown in Formulas (8)–(11).
R i j h = P i j h S i j ρ z t i j
R i j h + = P i j h S i j ρ z + t i j
C i j h = C h d i j v i j h +
C i j h + = C h d i j v i j h
Therefore, R i j h = [ R i j h , R i j h + ] and C i j h = [ C i j h , C i j h + ] .
Therefore, the original parameter containing the interval number can be converted into:
R i j h = η i j h 1 R i j h + ( 1 η i j h 1 ) R i j h +
C i j h = η i j h 2 C i j h + ( 1 η i j h 2 ) C i j h +
where η i j h 1 and η i j h 2 , respectively, represent the willingness of decision makers to bear the transportation risk and transportation cost in the decision of hazmat transportation. Considering that setting η i j h 1 and η i j h 2 will cause deviations to the obtained objective variable value, in order to control the deviation, the acceptable deviation values d i j h 1 and d i j h 2 are specified, which represent the deviation between the objective variable value and the minimum variable value, as shown below, where d 1 m a x and d 2 m a x , respectively, represent the maximum deviation value acceptable to the decision maker.
d i j h 1 = R i j h R i j h , d i j h 1 d 1 m a x  
d i j h 2 = C i j h C i j h , d i j h 2 d 2 m a x  
According to the above analysis, the route optimization problem of hazmat transportation considering risk equity can be expressed as the following multi-objective mixed-integer programming model:
min h H ( i , j ) A R i j h x i j h
min h H ( i , j ) A C i j h x i j h
min h H ( i , j ) A f i j h
s.t.
P h d i j φ h ,   ( i , j ) A , h H
R i j h ϕ h ,   ( i , j ) A , h H
( i , j ) A x i j h ( i , j ) A x j i h = { 1 ,   j = O h 0 ,   o t h e r w i s e 1 ,   j = D h   ,   h H
d i j h 1 = R i j h R i j h , d i j h 1 d 1 m a x .  
d i j h 2 = C i j h C i j h , d i j h 2 d 2 m a x .  
x i j h ( 0 , 1 ) ,     ( i , j ) A , h H
There are three optimization objectives in this model. Among them, Equation (16) indicates that the total risk of transportation routes of multitype hazmat is minimized when considering the emergency response time. Equation (17) minimizes the total transportation cost of hazmat in all directions in the entire transportation network considering the difference in the transportation cost per unit time of different types of hazmat. Equation (18) makes use of the risk compensation cost to compensate the links that exceed the average risk and achieves risk equity by minimizing the risk compensation cost. Equation (19) is the transportation accident probability threshold of all links when transporting h-type hazmat, denoting the maximum acceptable accident probability of all links. Equation (20) is the transportation accident risk threshold of all links when transporting h-type hazmat, denoting the maximum acceptable accident risk of all links. Equation (21) is the flow conservation constraint, which ensures that the transportation direction of all hazmat is from the starting point to the end, and the flow direction is balanced throughout the entire transportation network according to [47]. Constraint (24) is the value range of decision variable x i j h .

4. Solution Procedure

The model constructed in this paper is a route optimization model of multi-variety hazmat transportation considering risk equity in an uncertain environment, which includes the three objectives of transportation risk, transportation cost, and risk equity. First, for the route optimization of multi-variety hazmat transportation, the transportation of different varieties of hazmat are independent of one another; second, because these three objectives are often in conflict, they cannot reach the optimal conditions at the same time; finally, after deterministic transformation of the model constructed under an uncertain environment, a multi-objective genetic algorithm based on linear weighting is designed to solve the problem.
Assuming that the route optimization problem of hazmat transportation contains Q objectives, of which the objective function value corresponding to the objective q is z q , the objective value range of the objective q is [ z q m i n , z q m a x ] . Due to the difference in different objective dimensions, the function values corresponding to the Q objectives are normalized, and the function values are mapped to the interval [0, 1]. Finally, the multi-objective model is converted into a single-objective model in a linearly weighted manner, and then the traditional genetic algorithm is applied to solve the problem. The specific steps are as follows.
To facilitate the problem description, it is assumed that the transportation route optimization problem contains Q objectives, of which the objective function value corresponding to objective q is z q , the target value interval of the first k shortest routes of the single-objective problem is [ z q m i n , z q m a x ] , and the optimal solution is the objective function value when all the single objective optimal values are optimal, namely, ( z 1 m i n , z 2 m i n , , z q m i n ) . The specific steps of the algorithm are as follows:
(1)
Normalize the single-objective functions: z q = z q z q m i n z q m a x z q m i n .
(2)
Use the linear weighting method to weight multiple objectives: min Z = ω 1 z 1 + ω 2 z 2 + + ω q z q .
(3)
Encoding and initialization: Encoding abstracts the chromosomes and individuals in the genetic space through a certain mechanism in order to solve the problem. Since the problem to be solved is a transportation problem, the N-dimensional vector X = { x 1 , x 2 , , x n } is used to represent the genetic makeup on the chromosome. After the encoding scheme is determined, the genetic algorithm uses a random method to generate a set of several individuals, which is called the initial population. The number of individuals in the population can be freely defined as required.
(4)
Calculate fitness: Since we consider the shortest route problem in this paper, the relative fitness is calculated by C f ( x ) , where C is a constant.
(5)
Selection and replication: Use the roulette algorithm to generate a random value and compare its size with the cumulative relative fitness in order to select good individuals from the population to enter the genetic iteration.
(6)
Crossover: Since the chromosome code is a set of nonrepetitive numbers, the traditional way of aligning up and down crossing will often produce invalid routes. Therefore, different crossover methods are used, as follows:
  • On the Tx and Ty chromosomes representing routes, two loci are randomly selected as i and j, respectively, the area between the two loci is defined as a cross domain, and the cross content of the two loci is memorized as temp1 and temp2, respectively.
  • According to the mapping relationship in the intersection area, find the same elements as temp2 and temp1 in the individual Tx and individual Ty, respectively, and set the elements to 0, that is, set the cross content to 0.
  • Circulate Tx and Ty to the left, and delete it when it encounters 0, until there are no more zeros at the left end of the cross regions in all coding strings. All the gaps are then concentrated in the cross region, and the original genes in the cross region are moved backward, that is, the cross content found in the previous step that has been set to 0 is deleted to reorder the chromosome genes.
  • Insert temp2 into the intersection region of Tx and insert temp1 into the intersection region of Ty, to form a new chromosome, that is, to cross the locus where the intersection content has been deleted.
(7)
Mutation: Using the cross-mutation method, two numbers are randomly generated, and the original order of the nodes is exchanged.

5. Computational Results

5.1. Overview of the Shanghai Road Transport Area

Shanghai is one of the four municipalities directly governed by the Central Government in China, and the total land area of the city is 6340.5 km 2 . Shanghai governs a total of 16 municipal districts, including the Huangpu District, Changning District, and Xuhui District. According to the 2020 Shanghai Statistical Yearbook, the total permanent population of the city is 24,281,400, and the average population density is 3830 / km 2 . In 2020, the total length of roads opened to traffic in Shanghai reached 13,045 km, and the road density reached 206 km per 100 square kilometers. Among them, the expressway mileage is 845 km, and the expressway density reaches 13 km per 100 square kilometers. It is necessary to pay special attention to the transportation risk when transporting hazmat in Shanghai due to the highly dense population and the distribution of the road network. It is of great practical significance to use the case of the Shanghai transportation network to verify the route optimization model of hazmat transportation considering risk equity.
The distribution of the road network of Shanghai is shown in Figure 2.

5.2. Basic Situation of the Case

The road transportation network of Shanghai is simplified, and the transportation network map of hazmat of Shanghai is obtained, as shown in Figure 3, in which there are 24 nodes and 40 links. Among them, the node data come from the cross node in the real road network, and the length data of the links were obtained according to the Baidu map. According to the administrative divisions of Shanghai, links belong to multiple administrative geographic regions, and the population density around the link is improved from the population density of each geographic region in the 2020 Shanghai Statistical Yearbook.
It is assumed that in the hazmat transportation network of Shanghai, there are two types of hazmat that need to be transported from starting point 1 to end point 24. These two types of hazmat are explosives and flammable liquids. The two types of hazmat are marked as H1 and H2, in which the accident influence radiuses are λ 1 = 1.6   km ,   λ 2 = 0.8   km , the transportation costs per unit time are C 1 = 1000 ,   C 2 = 600 , the compensation expense per unit risk is b = 20, and the factors in deterministic transformation are η i j h 1 = 0.8 and η i j h 2 = 0.5. When transporting hazmat H1 and H2 separately, the transportation accident probability thresholds of the links are φ 1   = 0.045, and φ 2   = 0.031, and the transportation accident risk thresholds of the links are φ 1   = 1500 and φ 2 = 200. According to [48], 90% of hazmat accidents in urban areas can be responded to within 18 min while maintaining an acceptable response level. Therefore, the emergency response time is t i j = r a n d ( 0 , 18 ) , and the speeds of vehicles transporting different types of hazmat are interval numbers. The specific data are shown in Table 1.

5.3. Result Analysis

The model established in this paper is a multi-objective mixed integer linear programming (MILP) model, which is solved using the multi-objective genetic algorithm based on a linear weighting designed in Section 4, and the solution software applied is MATLAB R2018b. Due to the inconsistency of the three objective dimensions, the objective function values of the routes are normalized, and weights are set for different objectives, where the weights of the three objective functions of transportation risk, transportation cost, and risk equity in the final objective function are, respectively, set as ω 1   = 0.5, ω 2   = 0.3, and ω 3   = 0.2. We find that the optimal transportation route of hazardous material H1 is 1→6→7→13→14→15→21→24 and the optimal objectives value is 27,571.2743, and the optimal transportation route of hazardous material H2 is 1→11→6→7→13→14→15→21→24 and the optimal objectives value is 6579.546345. Although they have most of the same links, there are still some differences, as shown in Figure 4.
Through the multi-objective genetic algorithm based on linear weighting proposed in this paper, the optimal transportation routes considering the risk equity of two different types of hazmat can be obtained. The following is an analysis of single objectives.
When only considering the transportation risk, the optimal transportation route for H1 is 1→11→6→7→13→14→15→21→24 and the optimal objectives value is 7015.794739, and the optimal transportation plan for H2 is 1→11→6→7→13→14→15→21→24 and the optimal objectives value is 1141.78676. For these two types of hazmat, the influence radiuses of the hazmat accident and the accident probability per kilometer, which are determined by the type of hazmat, are all different. However, they are unified in the transportation plan that achieves the optimal transportation risk, which is because the transportation risk is linearly related to the product of the influence radius of a hazmat accident and the accident probability per kilometer, so normalizing the transportation risk can eliminate most of the impact of parameter differences. Because the population density within the influence range of a hazmat accident is determined by the population density interval of the area where the link is located, the uncertain population affected by the transportation of the two hazmat on the same link remains consistent. Therefore, after normalization, there are few differences in the objective function values of the transportation risk and risk equity of the H1 and H2 optional transportation routes, as shown in Figure 5.
When only considering the transportation cost, the optimal transportation route for H1 is 1→11→17→19→22→23→24 and the optimal objectives value is 1611.706349, and the optimal transportation route for H2 is 1→11→6→7→13→14→15→21→24 and the optimal objectives value is 813.5119048. After normalization, the obtained transportation cost values eliminate the difference caused by the unit time transportation cost, but the two types of hazmat still have a large difference in the transportation routes that achieve the optimal transportation cost, which is because the uncertainty intervals of the transportation speed of the two types of hazmat are different, as shown in Figure 6.
Finally, when considering the objective of risk equity, comparing the optimal transportation routes under the multi-objective situation with the optimal transportation routes while only considering the transportation risk and the optimal transportation routes while only considering transportation cost separately, we can find that for H2, the optimal transportation routes under the above three situations are consistent, and they are all the route 1→11→6→7→13→14→15→21→24. However, for H1, the route with the lowest transportation risk is 1→11→6→7→13→14→15→21→24, the route with the lowest transportation cost is 1→11→17→19→22→23→24, and the optimal transportation route under the multi-objective situation is 1→6→7→13→14→15→21→24. Although the difference between the optimal transportation risk route and the optimal multi-objective route is only to change the route 1→11→6 to the route 1→6, there are still some differences.
The differences between the optimal transportation routes of H1 and H2 illustrate that it is necessary to consider the differences in the optimal transportation routes caused by the influence radiuses of hazmat accidents, the accident probabilities per kilometer and the unit time transportation costs of different types of hazmat. On the other hand, for H1, the difference in the optimal transportation risk route, the optimal transportation cost route, and the optimal route of multiple objectives shows that multiple objectives need to be considered comprehensively in the process of optimizing the transportation route of hazmat.

6. Conclusions and Future Research

Different from most traditional route optimization models of hazmat transportation, which only consider transportation risk and transportation cost from the perspective of the government and the hazmat carrier and ignore the importance of risk equity, we constructed a multi-objective route optimization model of hazmat transportation considering the transportation risk, transportation cost, and risk equity in this paper. In addition, we considered the impact of the emergency response time on the transportation risk and risk equity and realized the risk equity by setting compensation costs. Subsequently, a multi-objective genetic algorithm based on linear weighting was proposed to solve the constructed multi-objective route optimization model of hazmat transportation. The solution results obtained by a case show that the constructed model can effectively find a transportation route that satisfies the government, the carrier, and the public. The specific contributions are:
(1)
Most of the previous transportation risk models of hazmat only evaluate the accident consequences caused by transportation accidents, and few consider that the emergency response time of the emergency departments around the link is an important factor affecting the transportation risk. Therefore, in this paper, the emergency response time of the emergency departments around the link is included in the transportation risk assessment function. In the risk equity model, risk compensation is made for the links exceeding the average risk from the perspective of the risk compensation cost to highlight the risk equity.
(2)
Since the population density and the transportation speed usually change within an interval, these two uncertain parameters are treated as interval numbers to construct a route optimization model of hazmat transportation considering the risk equity under uncertain environments. The model with interval numbers is transformed into a deterministic model by using the method of interval number sorting.
(3)
A case transporting different types of hazmat based on the actual road background in Shanghai, China, is constructed. The case data are substituted into the model considering the risk equity, and the model is solved with a multi-objective genetic algorithm based on linear weighting. The results show the necessity of considering risk equity in the route optimization of hazmat.
This research will help the management agency of hazmat transportation change the concept from “total risk-total cost” to “total risk-total cost-risk equity”, in which “total risk-total cost” is considered from the perspective of “government-carrier” and “total risk-total cost-risk equity” is considered from the perspective of “government-carrier-public”.
To avoid the risk of a certain road section being too high, which may cause irreparable harm to the population of this road section and affect the sustainable development of hazmat transportation, this research constructed the route optimization model to select the route with the least total risk. Moreover, this research not only focuses on the minimum total risk and total cost, but also focuses on how to reduce the risk difference in different road sections and areas and achieve risk equity as much as possible, which promote the sustainable development of hazmat transportation industry because the lack of risk equity is an important reason that more and more people oppose the transportation of hazmat. Moreover, the results of this research can provide scientific guidance for the optimization practice of hazmat transportation and help the hazmat transportation industry achieve sustainability.
Several research directions can be explored in the future. First, in this paper, the emergency response time of the emergency response departments near the link is treated as a random number, not real data. In the future, the GIS system can be used to collect links and emergency response department data. Second, the method of processing uncertain parameters with the interval number can only consider a certain degree of uncertainty, and the approaches of processing uncertain parameters should be studied more carefully.

Author Contributions

Conceptualization, S.L.; Data curation, L.Z.; Investigation, J.L.; Methodology, L.L. and J.L.; Supervision, T.F. All authors have read and agreed to the published version of the manuscript.

Funding

This work is funded by the National Natural Science Foundation of China (72032001, 72074076, 71302043); the Shanghai Natural Science Foundation (18ZR1409400), and Ministry of Education, Humanities and Social Sciences Research Planning Foundation (21YJA630057).

Institutional Review Board Statement

Not applicable.

Informed Consent Statement

Not applicable.

Data Availability Statement

The data used in this study are accessible at: Baidu map (https://map.baidu.com/@13520914,3633327,13z (accessed on 3 March 2021)), 2020 Shanghai Statistical Yearbook (http://tjj.sh.gov.cn/tjnj/20210303/2abf188275224739bd5bce9bf128aca8.html (accessed on 3 March 2021)).

Conflicts of Interest

The authors declare no conflict of interest.

References

  1. Verma, M.; Verter, V. A lead-time based approach for planning rail–truck intermodal transportation of dangerous goods. Eur. J. Oper. Res. 2010, 202, 696–706. [Google Scholar] [CrossRef]
  2. Assadipour, G.; Ke, G.Y.; Verma, M. A toll-based bi-level programming approach to managing hazardous materials shipments over an intermodal transportation network. Transp. Res. Part D Transp. Environ. 2016, 47, 208–221. [Google Scholar] [CrossRef]
  3. Bula, G.A.; Murat Afsar, H.; González, F.A.; Prodhon, C.; Velasco, N. Bi-objective vehicle routing problem for hazardous materials transportation. J. Clean. Prod. 2019, 206, 976–986. [Google Scholar] [CrossRef]
  4. Ma, C.R.; Mao, B.H.; Xu, Q.; Hua, G.D.; Zhang, S.J.; Zhang, T. Multi-depot vehicle routing optimization considering energy consumption for hazardous materials transportation. Sustainability 2018, 10, 3519. [Google Scholar] [CrossRef] [Green Version]
  5. Bianco, L.; Caramia, M.; Giordani, S.; Piccialli, V. A game-theoretic approach for regulating hazmat transportation. Transp. Sci. 2016, 50, 424–438. [Google Scholar] [CrossRef]
  6. Ke, G.Y.; Zhang, H.; Bookbinder, J.H. A dual toll policy for maintaining risk equity in hazardous materials transportation with fuzzy incident rate. Int. J. Prod. Econ. 2020, 227, 107650. [Google Scholar] [CrossRef]
  7. Du, J.M.; Li, X.Y. Multi-depot vehicle routing problem for hazardous materials transportation: A fuzzy bilevel programming. Inf. Sci. 2017, 399, 201–218. [Google Scholar] [CrossRef]
  8. Men, J.K. A chance constrained programming approach for HazMat capacitated vehicle routing problem in Type-2 fuzzy environment. J. Clean. Prod. 2019, 237, 117754. [Google Scholar] [CrossRef]
  9. Zhao, L.; Cao, N. Fuzzy random chance-constrained programming model for the vehicle routing problem of hazardous materials transportation. Symmetry 2020, 12, 1208. [Google Scholar] [CrossRef]
  10. Zhou, Z.; Ha, M.; Ma, H. Half open multi-depot heterogeneous vehicle routing problem for hazardous materials transportation. Sustainability 2021, 13, 1262. [Google Scholar] [CrossRef]
  11. Alp, E. Risk-based transportation planning practice: Overall methodology and a case example. INFOR Inf. Syst. Oper. Res. 1995, 33, 4–19. [Google Scholar] [CrossRef]
  12. Saccomanno, F.F.; Chan, A.W. Improving transportation of hazardous materials through risk assessment and routing. Transp. Res. Rec. J. Transp. Res. Board 1985, 1020, 12–18. [Google Scholar]
  13. Batta, R.; Chiu, S.S. Optimal obnoxious paths on a network: Transportation of hazardous materials. Oper. Res. 1988, 36, 84–92. [Google Scholar] [CrossRef]
  14. ReVelle, C.; Cohon, J.; Shobrys, D. Simultaneous siting and routing in the disposal of hazardous wastes. Transp. Sci. 1991, 25, 138–145. [Google Scholar] [CrossRef]
  15. Sun, Y.; Li, X.; Liang, X.; Zhang, C. A bi-objective fuzzy credibilistic chance-constrained programming approach for the hazardous materials road-rail multimodal routing problem under uncertainty and sustainability. Sustainability 2019, 11, 2577. [Google Scholar] [CrossRef] [Green Version]
  16. Goldberg, D.M.; Hong, S. Minimizing the risks of highway transport of hazardous materials. Sustainability 2019, 11, 6300. [Google Scholar] [CrossRef] [Green Version]
  17. Sung, H.; Kim, J.; Hong, J.; Park, D.; Lee, Y.I. Transport management characteristics of urban hazardous material handling business entities. Sustainability 2019, 11, 6600. [Google Scholar] [CrossRef] [Green Version]
  18. Erkut, E.; Ingolfsson, A. Catastrophe avoidance models for hazardous materials route planning. Transp. Sci. 2000, 34, 165–179. [Google Scholar] [CrossRef]
  19. Erkut, E.; Ingolfsson, A. Transport risk models for hazardous materials: Revisited. Oper. Res. Lett. 2005, 33, 81–89. [Google Scholar] [CrossRef]
  20. Kara, B.Y.; Verter, V. Designing a road network for hazardous materials transportation. Transp. Sci. 2004, 38, 188–196. [Google Scholar] [CrossRef] [Green Version]
  21. Verter, V.; Kara, B.Y. A path-based approach for hazmat transport network design. Manag. Sci. 2008, 54, 29–40. [Google Scholar] [CrossRef] [Green Version]
  22. Qu, H.L.; Xu, J.L.; Wang, S.J.; Xu, Q. Dynamic routing optimization for chemical hazardous material transportation under uncertainties. Ind. Eng. Chem. Res. 2018, 57, 10500–10517. [Google Scholar] [CrossRef]
  23. Bronfman, A.; Marianov, V.; Paredes-Belmar, G.; Luer-Villagra, A. The maximin HAZMAT routing problem. Eur. J. Oper. Res. 2015, 241, 15–27. [Google Scholar] [CrossRef]
  24. Wang, Z.Z.; Zhao, L.Y.; Cao, N.B.; Yu, M.M.; Chen, M.T. The route choice of hazardous material transportation with Value-at-Risk model using chance measure in uncertain environments. Adv. Mech. Eng. 2018, 10. [Google Scholar] [CrossRef] [Green Version]
  25. Hosseini, S.D.; Verma, M. Conditional Value-at-Risk (CVaR) methodology to optimal train configuration and routing of rail hazmat shipments. Transp. Res. Part B Methodol. 2018, 110, 79–103. [Google Scholar] [CrossRef]
  26. Fan, T.J.; Chiang, W.C.; Russell, R. Modeling urban hazmat transportation with road closure consideration. Transp. Res. Part D Transp. Environ. 2015, 35, 104–115. [Google Scholar] [CrossRef]
  27. Mohammadi, M.; Jula, P.; Tavakkoli-Moghaddam, R. Design of a reliable multi-modal multi-commodity model for hazardous materials transportation under uncertainty. Oper. Res. 2017, 257, 792–809. [Google Scholar] [CrossRef]
  28. Hu, H.; Li, X.; Zhang, Y.; Shang, C.; Zhang, S. Multi-objective location-routing model for hazardous material logistics with traffic restriction constraint in inter-city roads. Comput. Ind. Eng. 2019, 128, 861–876. [Google Scholar] [CrossRef]
  29. Su, L.; Kwon, C. Risk-averse network design with behavioral conditional value-at-risk for hazardous materials transportation. Transp. Sci. 2019, 54, 184–203. [Google Scholar] [CrossRef]
  30. Holeczek, N. Hazardous materials truck transportation problems: A classification and state of the art literature review. Transp. Res. Part D Transp. Environ. 2019, 69, 305–328. [Google Scholar] [CrossRef]
  31. Keeney, R.L. Equity and public risk. Oper. Res. 1980, 28, 527–534. [Google Scholar] [CrossRef]
  32. Gopalan, R.; Batta, R.; Karwan, M.H. The equity constrained shortest path problem. Comput. Oper. Res. 1990, 17, 297–307. [Google Scholar] [CrossRef]
  33. Gopalan, R.; Batta, R.; Karwan, M.H. Modeling equity of risk in the transportation of hazardous materials. Oper. Res. 1990, 38, 961–973. [Google Scholar] [CrossRef]
  34. Carotenuto, P.; Giordani, S.; Ricciardelli, S. Finding minimum and equitable risk routes for hazmat shipments. Comput. Oper. Res. 2007, 34, 1304–1327. [Google Scholar] [CrossRef]
  35. Kang, Y.; Batta, R.; Kwon, C. Generalized route planning model for hazardous material transportation with VaR and equity considerations. Comput. Oper. Res. 2014, 43, 37–247. [Google Scholar] [CrossRef] [Green Version]
  36. Garrido, R.A.; Bronfman, A.C. Equity and social acceptability in multiple hazardous materials routing through urban areas. Transp. Res. Part A Policy Pract. 2017, 102, 244–260. [Google Scholar] [CrossRef]
  37. Fang, K.; Ke, G.Y.; Verma, M. A routing and scheduling approach to rail transportation of hazardous materials with demand due dates. Eur. J. Oper. Res. 2017, 261, 154–168. [Google Scholar] [CrossRef] [Green Version]
  38. Hosseini, S.D.; Verma, M. Equitable routing of rail hazardous materials shipments using CVaR methodology. Comput. Oper. Res. 2021, 129, 105222. [Google Scholar] [CrossRef]
  39. Lindner-Dutton, L.; Batta, R.; Karwan, M.H. Equitable sequencing of a given set of hazardous materials shipments. Transp. Sci. 1991, 25, 124–137. [Google Scholar] [CrossRef]
  40. Current, J.; Ratick, S. A model to assess risk, equity and efficiency in facility location and transportation of hazardous materials. Locat. Sci. 1995, 3, 187–201. [Google Scholar] [CrossRef]
  41. List, G.; Mirchandani, P. An integrated network/planar multiobjective model for routing and siting for hazardous materials and wastes. Transp. Sci. 1991, 25, 146–156. [Google Scholar] [CrossRef]
  42. Verter, V.; Kara, B.Y. A GIS-based framework for hazardous materials transport risk assessment. Risk Anal. 2002, 21, 1109–1120. [Google Scholar] [CrossRef] [PubMed] [Green Version]
  43. Bell, M.G.H. Mixed route strategies for the risk-averse shipment of hazardous materials. Netw. Spat. Econ. 2006, 6, 253–265. [Google Scholar] [CrossRef]
  44. Bianco, L.; Caramia, M.; Giordani, S. A bilevel flow model for hazmat transportation network design. Transp. Res. Part C Emerg. Technol. 2009, 17, 175–196. [Google Scholar] [CrossRef] [Green Version]
  45. Chiou, S.W. A resilience-based signal control for a time-dependent road network with hazmat transportation. Reliab. Eng. Syst. Saf. 2020, 193, 106570. [Google Scholar] [CrossRef]
  46. Saat, M.R.; Werth, C.J.; Schaeffer, D.; Yoon, H.; Barkan, C.P. Environmental risk analysis of hazardous material rail transportation. J. Hazard. Mater. 2014, 264, 560–569. [Google Scholar] [CrossRef]
  47. Fontaine, P.; Crainic, T.G.; Gendreau, M.; Minner, S. Population-based risk equilibration for the multimode hazmat transport network design problem. Eur. J. Oper. Res. 2020, 284, 188–200. [Google Scholar] [CrossRef]
  48. Taslimi, M.; Batta, R.; Kwon, C. A comprehensive modeling framework for hazmat network design, hazmat response team location, and equity of risk. Comput. Oper. Res. 2017, 79, 119–130. [Google Scholar] [CrossRef] [Green Version]
Figure 1. Mathematical notation.
Sustainability 13 09427 g001aSustainability 13 09427 g001bSustainability 13 09427 g001c
Figure 2. Distribution map of the Shanghai road network.
Sustainability 13 09427 g002
Figure 3. Hazmat transportation network map of Shanghai.
Sustainability 13 09427 g003
Figure 4. Optimal routes of H1 and H2 under the multi-objective situation.
Sustainability 13 09427 g004
Figure 5. Routes with the least transportation risk of H1 and H2.
Sustainability 13 09427 g005
Figure 6. Routes with the lowest transportation cost of H1 and H2.
Sustainability 13 09427 g006
Table 1. Description of the transport section.
Geographic AreaThe Population Density ( Inhab / km 2 ) Included LinksThe Length of Link ( km ) Emergency Response Time ( min ) Transportation Speed of H1 ( km / h ) Transportation Speed of H2 ( km / h )
Qingpu District[900, 2700]1→2179[50, 80][40, 80]
1→6187[50, 60][40, 50]
1→11123[40, 50][70, 80]
2→71414[70, 90][40, 50]
6→7117[50, 60][70, 90]
7→13712[40, 50][70, 80]
11→6123[40, 50][70, 80]
11→12155[40, 60][40, 60]
12→13138[70, 90][40, 50]
Songjiang District[1400, 4300]2→31513[40, 80][40, 50]
3→447[60, 70][60, 70]
3→81511[40, 50][80, 80]
4→9139[40, 60][40, 60]
7→81113[40, 50][40, 70]
8→9911[40, 90][40, 50]
8→141015[70, 90][60, 90]
9→15149[50, 60][40, 50]
13→1487[40, 60][70, 80]
14→15915[50, 70][70, 90]
Jinshan District[600, 2000]4→51213[40, 70][50, 50]
5→10134[80, 90][50, 50]
9→101212[50, 70][60, 80]
10→161411[60, 70][40, 80]
15→161714[70, 80][60, 80]
Jiading District[1700, 5100]11→17209[40, 70][60, 70]
12→18123[40, 70][50, 70]
17→181413[70, 80][40, 60]
Baoshan District[3700, 11,000]17→192210[70, 90][60, 80]
18→19156[70, 90][50, 90]
Pudong District[2200, 6800]19→20173[50, 70][70, 80]
19→22184[80, 90][40, 80]
20→2187[40, 60][60, 70]
20→221113[40, 70][50, 80]
21→23126[40, 60][40, 90]
22→23107[70, 90][60, 70]
23→241811[50, 60][80, 90]
Minhang District[3400, 9200]14→20269[70, 80][50, 60]
Fengxian District[800, 2500]15→21237[50, 60][80, 90]
16→242817[40, 50][40, 60]
21→242314[40, 60][70, 80]
Publisher’s Note: MDPI stays neutral with regard to jurisdictional claims in published maps and institutional affiliations.

