Article

Research on Innovation Non-Equilibrium of Chinese Urban Agglomeration Based on SOM Neural Network

1
School of Safety Science and Emergency Management, Wuhan University of Technology, Wuhan 430070, China
2
School of Management, Wuhan University of Technology, Wuhan 430070, China
3
School of Mathematics and Statistics, Central South University, Changsha 410083, China
4
School of Economics and Trade, Henan University of Technology, Zhengzhou 450001, China
*
Author to whom correspondence should be addressed.
These authors contributed equally to this work.
Sustainability 2021, 13(17), 9506; https://doi.org/10.3390/su13179506
Submission received: 26 June 2021 / Revised: 13 August 2021 / Accepted: 21 August 2021 / Published: 24 August 2021

Abstract

:
Different indicators, such as the number of patent applications, the number of grants, and the patent conversion rate, were proposed in this study to analyze the issue of innovation imbalance within and between urban agglomerations from a new perspective. First, a preliminary analysis of the current state of innovation and development of China’s nine urban agglomerations was conducted. Then the Theil index, widely used in equilibrium research, was employed to measure the overall innovation gap of China’s urban agglomerations. The study innovatively used the self-organizing feature map to identify the correlation characteristics of the innovation and development within China’s urban agglomerations and visualize them through Geographic Information Science. The research findings show that the hierarchical differentiation of the innovation and development of China’s urban agglomerations is becoming increasingly clear, and that the imbalance in regional innovation development is pronounced. The imbalance in innovation development within urban agglomerations is more significant than the imbalance in innovation development among urban agglomerations. The analysis indicated that a possible cause is the crowding effect and administrative standard effect of the central city. The key to addressing this problem is promoting innovative and coordinated development between regions.

1. Introduction

Urban agglomeration (UA) is a new form of urbanization resulting from the increase in global urban development. The 2006 “Eleventh Five-Year Plan” clearly stated that “urban agglomerations should be taken as the main form of urbanization”. This marked the first time the development of urban agglomerations was included in the national strategic framework. At the end of 2012, the “18th National Congress” emphasized implementation of an innovation-driven development strategy. It declared that scientific and technological innovation should be placed at the core of the overall national development. Cities are the sources of innovation, and innovation is the primary motivation to promote the integrated development of urban agglomerations. In 2014, the “National New-type Urbanization Plan (2014–2020)” proposed to “optimize and upgrade urban agglomerations in the eastern region”, “cultivate and develop urban agglomerations in central and western regions”, “establish a coordination mechanism for urban agglomeration development”, and “enhance urban innovation capabilities.” The development of urban agglomerations that support regional and, potentially, national growth has been significantly evaluated from a strategic perspective in China. Following the 19th National Congress of the Communist Party of China, the development of urban agglomerations has entered a new era of comprehensive quality improvement. Innovation-driven development is an important engine for improving the quality of development.
According to the “China Urban Agglomeration Development Report 2016”, there are currently nine large urban agglomerations at a mature stage of development in China: the Yangtze River Delta, Guangdong–Hong Kong–Macao Greater Bay Area, Beijing–Tianjin–Hebei, Shandong Peninsula, Central Plains Economic Zone, Chengdu–Chongqing Economic Zone, Wuhan City Circle, Changsha–Zhutan, and Poyang. Previous studies have shown that innovation imbalances in China’s urban agglomerations, such as scattered innovation resources and significant gaps in innovation levels, restrict the overall development of China’s urban agglomerations. However, most of the research on disequilibrium of innovation has focused on individual city clusters or specific large cities, whereas relatively little research has been conducted among city clusters. In these studies, the definition of the scale of the Chinese cities was based on the size of the cities rather than the level of innovation. Moreover, most of these studies only conducted a simple superficial analysis of the imbalance in the innovation of urban agglomerations and failed to explore further reasons for the imbalance. Therefore, the key to addressing the imbalance that exists within and between China’s urban agglomerations is, first, the introduction of the SOM neural network and Theil Entropy Index, and, subsequently, an exploration of the causes. The Theil Entropy Index shows the imbalance of innovation among and within urban agglomerations at the data level, and the heat map of the gap within urban agglomerations effectively illustrates this point. In the current study, after SOM neural network training, the two-dimensional map of the innovation difference of Chinese urban agglomerations was used to define the scale of Chinese urban innovation. The neuron value matching map was used to sequentially analyze the influence of the variables, and the inner innovation connection map of urban agglomerations was used to study the inner correlations among the city clusters. Finally, based on these studies, the driving effect of the imbalance in the innovation of Chinese urban agglomerations was investigated. This study took these nine relatively mature urban agglomerations as examples to analyze the phenomenon of imbalanced innovation in Chinese urban agglomerations, and explored the reasons for their occurrence.

2. Literature Review

Due to the in-depth implementation of innovation-driven development strategies and the continuous progress of urbanization, researchers have paid increasing attention to regional innovation. Most literature has paid greater attention to the efficiency of regional innovation, including the measurement of innovation efficiency (Wang Chunzhi, Zhao Guojie, 2015 [1]; Zhang et al. 2003 [2]; Agbali, Trillo et al. (2017) [3]; Ben and Wang (2011) [4]; Cooke (2001) [5]; Villani and Lechner (2021) [6]); and regional differences in innovation efficiency and its contributing factors (Mao Qi Lin, Xu Jiayun, 2015 [7]; Cheng Qiang, et al., 2015 [8]; Zhang Changzheng, 2012 [9]; Bai Junhong, Jiang Fuxin, 2011 [10]; Zhou Xiaoyan, 2009 [11]; Jefferson et al., 2006 [12]; Nasierowski and Arcelus, 2003 [13]; Narula, 2000 [14]; Hong, Feng et al. (2016) [15]; Wang, Yang et al. (2019) [16]). Cooke (2001) [5] believes that European regional innovation is overly dependent on the government for public intervention, leading to market failure. Villani (2021) [6] uses an example of a university in Italy to show that universities need to make effective changes to help improve innovation efficiency. Most researchers have found that China’s regional innovation presents the characteristics of uneven development, and the innovation level of coastal areas and technological clusters is significantly higher. Further evaluation of the impact of production efficiency is required.
For smart cities, many successful studies have been carried out from the perspective of the three aspects of smart city innovation (Mora, Bolici et al. (2017) [17]; Nam and Pardo (2011) [18]; Caragliu and Bo (2019) [19]); smart city governance (Berry and Okulicz-Kozaryn (2012) [20]; Bulkeley, Coenen et al. (2016) [21]); and smart city development (Bibri (2017) [22]; Datta (2015) [23]). Researchers pointed out that it is first necessary to support innovation, and then drive technology and organize innovation at the policy level; the governance of the city requires the correct measurement of the city scale; and the development of the city must consider the complex relationship network between the collaborative clusters of urban entities. Research on smart cities indicates that the relationship between cities needs to be considered; that is, the concept of urban agglomerations needs to be introduced. The concept of urban agglomerations originated from Western urban research and was proposed by the French geographer Gottman, known as the “father of urban agglomerations”, and the word is “Megalopolis” (Gottmann (1964) [24]). The field of urban agglomeration research is wide, and includes studying the impact of urban agglomerations on the environment (Spivak, Loktev et al. (2016) [25]; Gutiérrez-Avila, Arfer et al. (2021) [26]; Ebel (2020) [27]; Terando, Costanza et al. (2014) [28]); the spatial relevance of urban agglomerations (Lang and Knox (2009) [29]; Berry and Okulicz-Kozaryn (2012) [20]); and the definition of urban agglomeration size (Porfiryev and Bobylev (2018) [30]; Fang and Yu (2017) [31]). Studies in Russia, Mexico, and the United States all proved the effectiveness and practicality of urban agglomeration research. Lang (2009) [29] and others traced the development process of American metropolises and used new networks and spatial correlations to re-integrate urban space. However, no research has been conducted on the spatial correlation for Chinese urban agglomerations. Porfiryev (2018) [30] stated that, in Russian cities, the population index is currently the main criterion for measuring the concept of megacities, but other characteristics need to be considered. Since the reform and opening up, China’s urban construction has advanced by leaps and bounds. In 1983, Ning Yuemin first introduced the concept of “Megalopolis” to China. As researchers have different understandings of this term, it has numerous translations, including “Huge City Belt” (Ning Yuemin), “Metropolitan Circle” (Shi Yulong), and “Metropolis Continuous Area” (Wang Xu). Until the end of 2005, the “Eleventh Five-Year Plan” proposed, for the first time, “urban agglomeration” as the standard translation of “Megalopolis.” Abundant research has been undertaken on Chinese urban agglomerations. According to the search results of CNKI, there are a total of 1891 related documents. In recent years, the number of related articles on urban agglomerations has increased sharply. In 2004, there were only 18 related documents, and in 2019, there were as many as 589. Research on the spatial effects and temporal and spatial characteristics of urban agglomerations and their economic development status accounts for the majority of these studies. Combining environmental governance issues has also become a popular research topic, for example, Chen Danling et al. (2018) [32]; Yu Jinkai and Ma Jianqiu (2018) [33]; Zhang Huan and others (2018) [34]; Wang Qing and Jin Chun (2018) [35]; Liu Yunqiang et al. (2018) [36]; Liu Shilin (2018) [37]; Chen Guoliang and Tang Gennian (2016) [38]; Fan, Lian et al. (2021) [39]; and Zhang, Kang et al. (2020) [40]. Feifan used the SBM model, the spatial autocorrelation model, and the spatial self-regression model; it was found that the green innovation efficiency of 235 domestic cities has a large spatial imbalance. Liu Shilin (2018) [37] combed the development history of urban agglomerations at home and abroad, explored the development of China’s urban agglomerations since the reform and opening up 40 years ago, and proposed the strategic direction and development goals of building a new type of urban agglomeration. Wang Qing and Jin Chun (2018) [35] used factor analysis, the Gini coefficient, and the Theil index to measure the extent of imbalance in the economic development level of China’s urban agglomerations, and found that the economic development level of each urban agglomeration showed a significant spatial distribution imbalance.
Research on the innovation of Chinese urban agglomerations generally includes measuring the innovation capability and innovation efficiency of Chinese urban agglomerations, in addition to the regional innovation synergy and network relevance. The methods used by scholars to measure innovation ability and efficiency include statistical analysis, the Theil index, the Gini coefficient, factor analysis, cluster analysis, the coefficient of variation, and data envelopment analysis. Zhou Can et al. (2017) [41] analyzed the correlation of the innovation capabilities between cities based on the results of measuring this capability of individual cities. Feng Feng and Wang Liangbing (2011) [42], Li Guoping (2014) [43], and other researchers believe that collaborative innovation between urban agglomerations is the inevitable trend of the future innovation and development of urban agglomerations. Li and Phelps (2018) [44] measured the extent of functional multi-centralization of urban agglomerations in the Yangtze River Delta by building a knowledge collaboration network. However, in the existing literature, it was found that the research on the imbalance of urban agglomeration innovation is mostly based on a single urban agglomeration or a small number of large urban agglomerations. There are few comparative analyses between urban agglomerations, and most of these only innovate on urban agglomerations. A simple superficial analysis of the imbalance problem fails to further explore the reasons behind it. Most of the research on innovation disequilibrium has analyzed individual urban agglomerations or large cities, and relatively few studies have been conducted among urban agglomerations. Moreover, these studies do not define the scale based on the innovation level of Chinese cities, and most fail to further explore the driving factors and the reasons for the formation of the balance problem. Therefore, in the current study, the SOM neural network and Theil Entropy Index were introduced. The Theil Entropy Index shows the imbalance in innovation between and within urban agglomerations at the data level. The heat map of the gap within the urban group effectively illustrates this point. The five major city innovation evaluation indicators proposed in this study were trained by the SOM neural network, and the two-dimensional map of the innovation difference of Chinese urban agglomerations was used to define the scale of Chinese urban innovation. The neuron value matching map was employed to analyze the influence between variables. Using sequential analysis, the internal innovation connection map of urban agglomerations was used to study the relevance of urban agglomerations. Finally, based on these studies, the driving effect of the imbalance of innovation in urban agglomerations in China was explored.

3. Research Methods and Results

3.1. Preliminary Analysis of the Current Situation of Innovation and Development of Chinese Urban Agglomeration

3.1.1. Definition of Urban Agglomeration

Drawing on the “China Urban Agglomeration Development Report 2016”, this study was based on the nine mature urban agglomerations of Yangtze River Delta, Guangdong–Hong Kong–Macao Greater Bay Area, Beijing–Tianjin–Hebei, the Central Plains, the Shandong Peninsula, Chengdu–Chongqing, Wuhan, Zhutan, and Poyang Lake and surroundings. These urban agglomerations encompass a total of 105 cities and represent the concept of Chinese urban agglomerations. With reference to government work reports and Internet information, the scope of these nine urban agglomerations is defined as shown in Table 1.

3.1.2. Number of Patent Applications and Authorizations

Urban agglomerations are the main component and trend of global urban development, in addition to the “main form” of China’s new urbanization. The number of patent applications refers to that number accepted by patent agencies for technological inventions, which reflects the activity of a society’s technological innovation and development activities, and represents the social innovation capabilities. The number of patent rights authorized represents the number of patent rights obtained in a patent application. This can be used to measure the actual innovation achievements of a region during a certain period. The ratio of the number of patents authorized to the number of applications represents the transformation of patent achievements. Therefore, the innovation and development of urban agglomerations can be assessed intuitively through the number of patent applications and patent grants.

3.1.3. Patent Conversion Rate

To mitigate the difference due to the size and absolute quantity of patents of each urban agglomeration, and objectively display each agglomeration’s conversion rate of patent applications to patent authorizations, the number of patent applications and the average number of authorizations of each urban agglomeration were compared. The following formula was used:
T n = ( x 1 + x 2 + + x n ) ( y 1 + y 2 + + y n )
where T n is the conversion rate from patent application to patent authorization, i.e., the patent conversion rate; x n is the number of patent authorizations in a certain city in the urban agglomeration; and y n is the number of patent applications in a certain city in the urban agglomeration.
The mean value of patent applications was obtained by dividing the total number of applications in all cities in the urban agglomeration by the number of cities, and the mean value of patent authorizations was obtained by dividing the number of authorized numbers of all cities in the urban agglomeration by the number of cities. This was undertaken to eliminate the differences in absolute amounts, and enabled collaborative analysis of the patent conversion rate to explore the relationship between patent applications and patent authorizations.

3.2. Research on the Disequilibrium of Innovation and Development of Chinese Urban Agglomerations

3.2.1. Theil Index Method

The Theil Entropy Index is named after Theil (Theil, 1967), who used the concept of entropy in information theory to calculate income inequality. This index was originally used as an indicator to measure the income gap between individuals and regions. Its greatest advantage is that it can be used to measure the contribution of gaps within and between agglomerations to the total gap. Subsequently, the Theil index was widely used in the study of equilibrium due to the advantages of total difference and decomposability.
In information theory, entropy refers to the average amount of information. Assuming that the probability of occurrence of a certain event A is p , if event A is certain to occur, the amount of information contained in this message is:
I P = ln 1 p
Assuming that the probability of occurrence of n events E 1 , E 2 , , E n contained in a complete event agglomeration is p 1 , p 2 , , p n , then:
Therefore, the expected amount of information or entropy is:
E I ( x ) = i = 1 n p i I ( p i ) = i = 1 n p i I n 1 p i = i = 1 n p i I n ( p i )
The Theil index is a special case of the entropy index; the entropy index is applicable when there are multiple individuals. The basic form of the Theil index is:
T = 1 N i = 1 n X i X ¯ I n X i X ¯
where T is the Theil index, which was used in this study to indicate the overall innovation gap of the 105 sample cities included in the nine urban agglomerations; N is the sample number, which represents the number of sample cities included in the nine sample urban agglomerations; X i is the observation value of the sample i on the research variable X . In this study, X represents the innovation ability of each city, which was measured by the number of patent applications, patent authorizations, and patent authorizations/patent applications; X ¯ represents the average of all sample individuals.
The Theil index has ideal decomposable properties. When the sample is divided into multiple agglomerations, the Theil index measures the contribution of the gap between agglomerations and gaps to the total gap. In this study, N individual samples are divided into K agglomerations, each agglomeration is Y k k = 1 , 2 , , K , and the number of individuals included in each agglomeration is n k k = 1 , 2 , , K , then: k = 1 k n k = n .
Let T b and T w be the innovation gap between agglomerations and the innovation gap within agglomerations respectively; then, the Theil index can be decomposed into:
T = T b + T w = k = 1 k X k I n X k n k / n + k = 1 k X k i Y k X i X i I n X i / X k 1 / n k
This study used T b to measure the innovation gap between the nine urban agglomerations, T w to measure the innovation gap between cities within the nine urban agglomerations, and T to measure the overall innovation gap in China’s urban agglomerations.

3.2.2. Innovation Imbalance Based on the Gap in the Patent Conversion Rate of Urban Agglomerations

To more intuitively measure the imbalance of innovation in China’s urban agglomerations, the intra-agglomeration gap T w of the patent conversion rate of each urban agglomeration was separately marked on the map as a heat map (Figure 1). The heat data in the map is displayed in reverse color. If the value of T w is smaller, the integration between cities within the urban agglomeration is closer, the innovation gap is smaller, and the color is darker; on the contrary, the greater the value of T w , the less the integration between cities within the urban agglomeration, the greater the innovation gap, and the lighter the color. In addition, the depth of the color is also restricted by the distance. For the same T w value, if the city is small and the distance is close, the color is darker.

3.2.3. Self-Organizing Feature Map (SOM)

The self-organizing feature map (SOM) is an unsupervised competitive learning feedforward network proposed by Kohomen [45]. When the SOM network accepts external input patterns, it is divided into different regions. Each area has a different response to the input, and the similar input distance is shorter. In the process of each neuron adjustment, the neighboring neurons stimulate each other, the distant neurons inhibit each other, and the neuron that wins in the mutual competition is the best matching unit of the sample. Because the SOM neural network is based on unsupervised learning, there is no need to manually input sample labels during the training phase. Cluster analysis on the data can be performed without knowing the category, and can be used to identify the correlation characteristics of the internal innovation and the development of Chinese urban agglomerations.
Training the SOM neural network is divided into the following main steps:
(1)
Assign a random value to the initial weight of each node in the output layer;
(2)
Input the sample vector X = x 1 , x 2 , x 3 , , x n T to the input layer;
(3)
Calculate the victory neurons. First calculate the distance d i j between each node of the output layer and the input sample vector:
d i j = i = 1 N x i t w i j t 2
where N represents the dimension of the input layer sample vector, x i t is the i sample vector of the t step, and w i j t represents the weight between the i input layer sample vector and the output layer node j .
Then choose the output node i , j with the smallest distance as the winning node:
d i j = min d i j
(4)
Update the weight. The formula is as follows:
w i j t + 1 = w i j t + φ t β t x i w i j t
where φ t is the learning rate of the t step, which generally decreases linearly or exponentially as the training progresses, and β t is the neighborhood function, using the Gaussian nearest neighbor function.
φ t + 1 = φ t φ 0 T β t = exp d c j 2 2 r 2 t
(5)
Continue to the next step of training until the number of steps t > T .

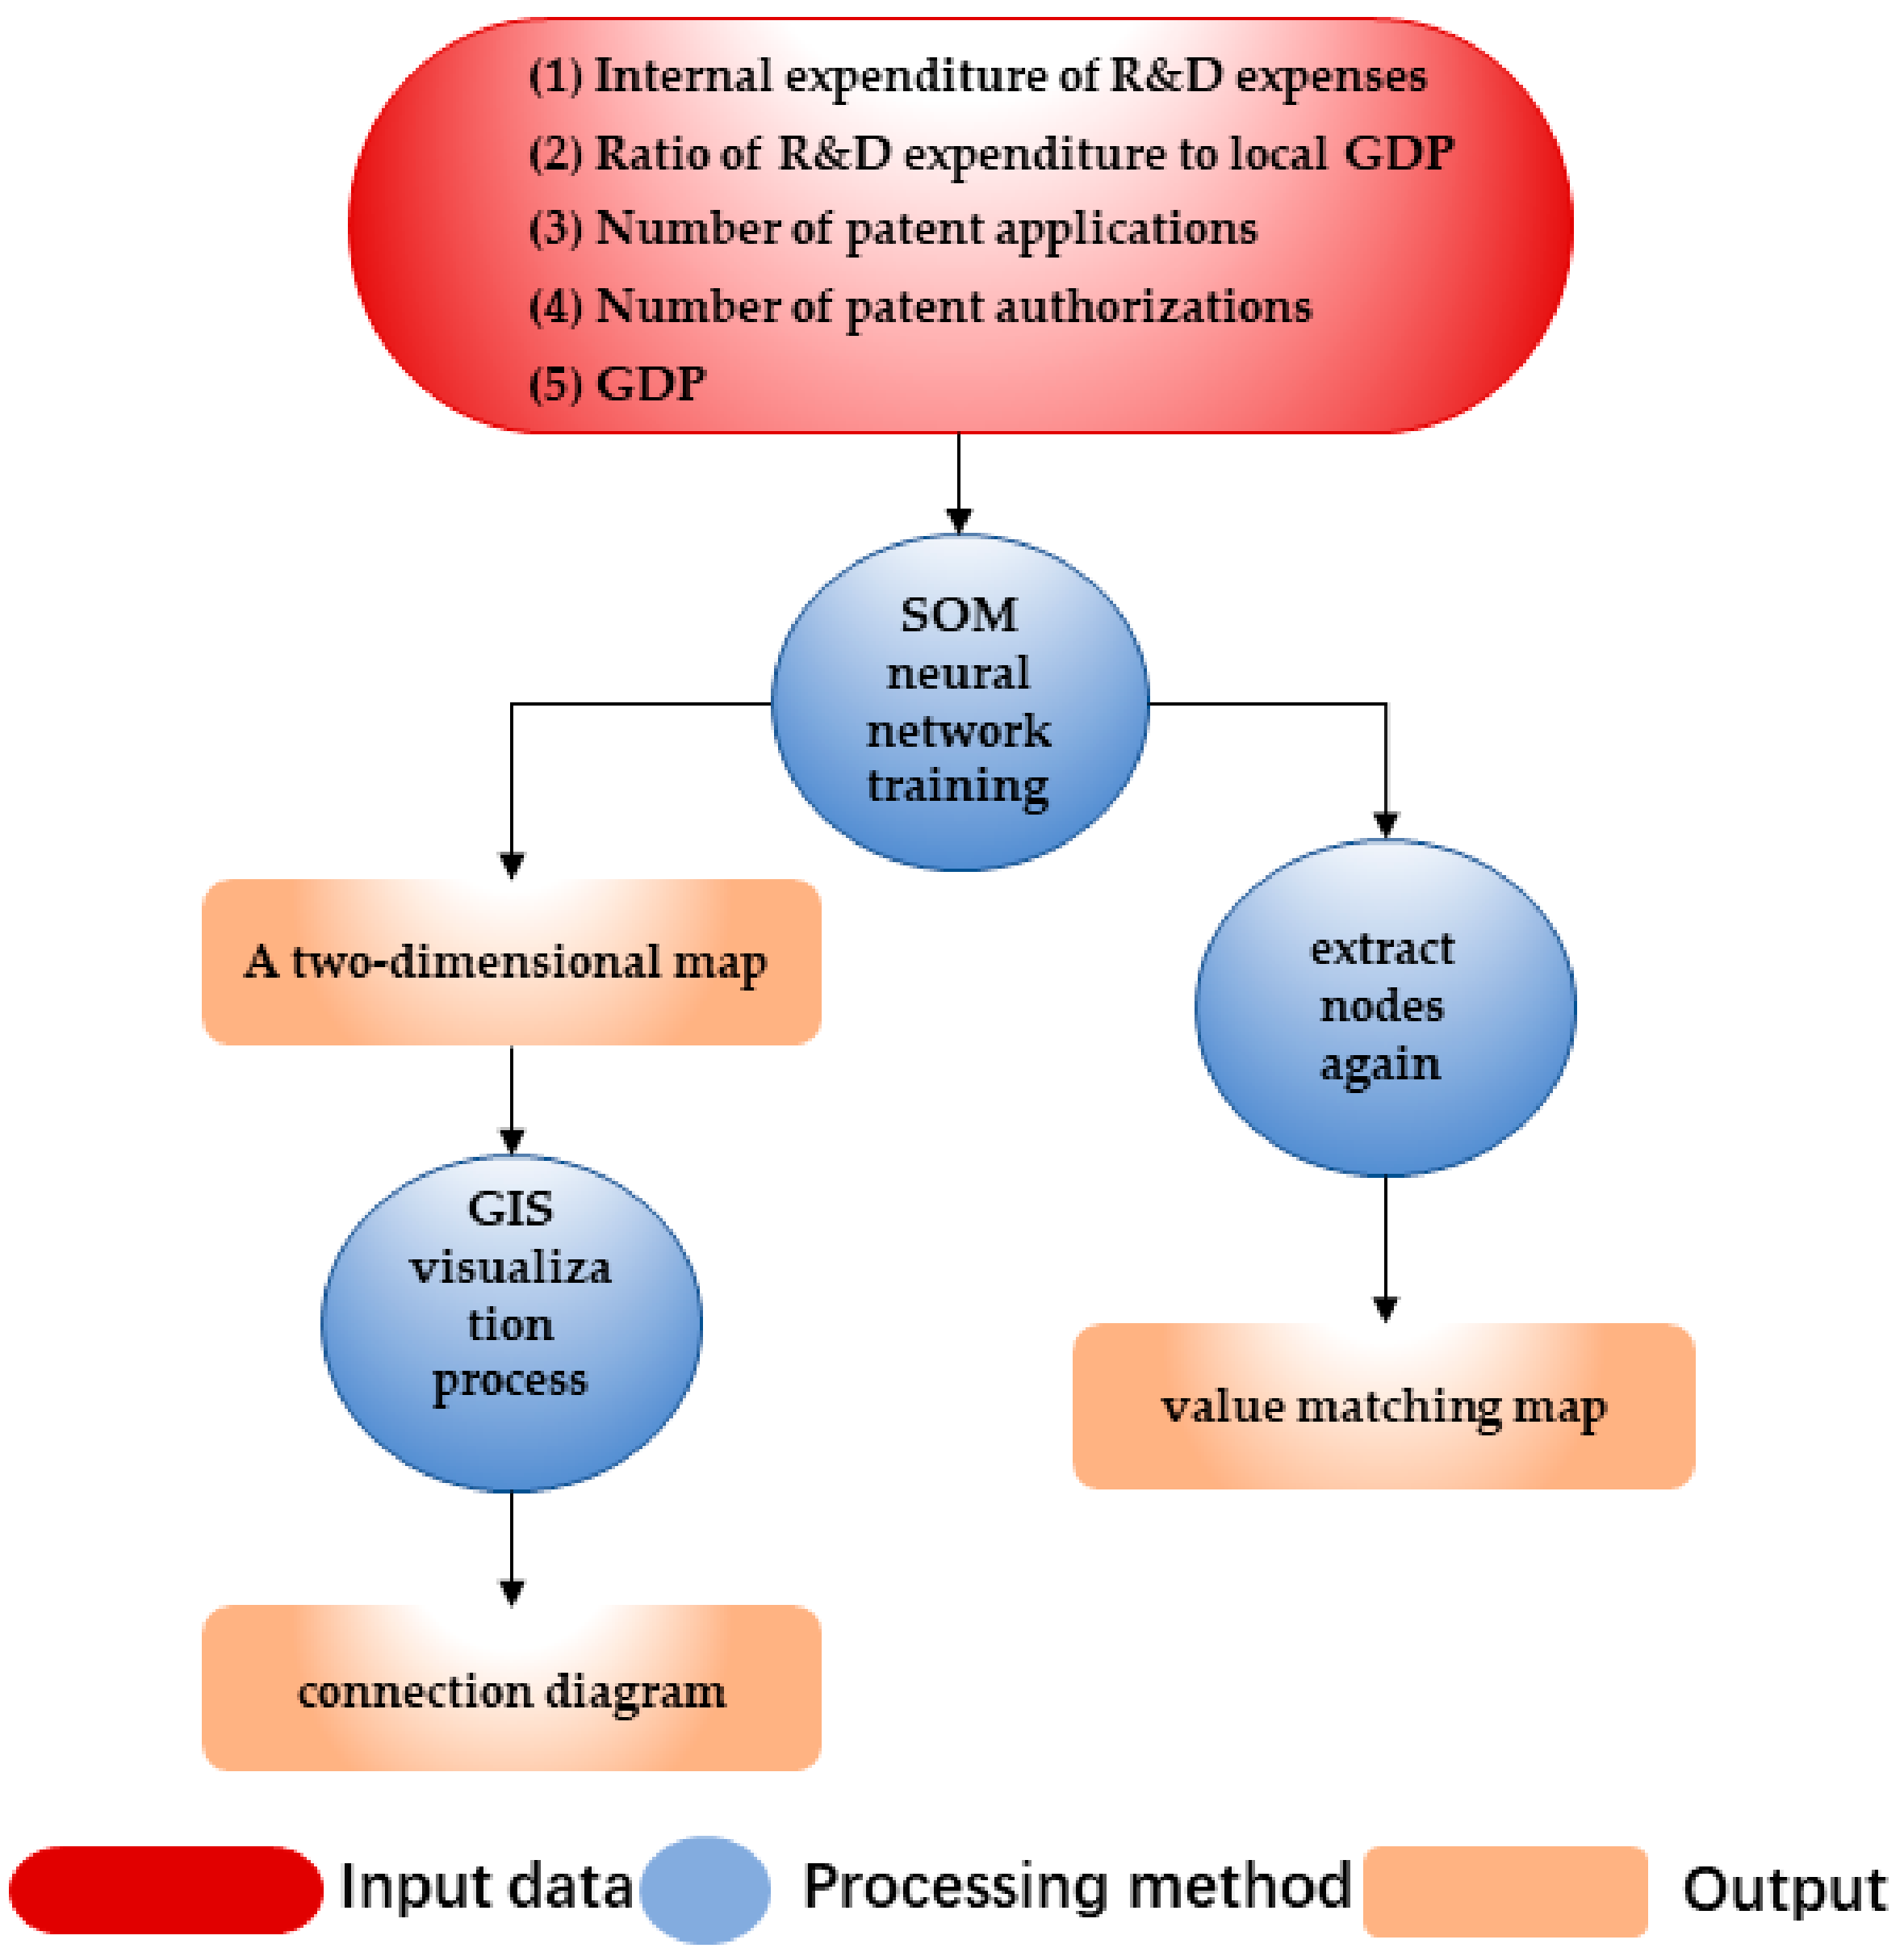
3.2.4. Five Basic Indicators for SOM Analysis

The research objects of this paper are the nine major urban agglomerations in China, namely, Yangtze River Delta, Guangdong–Hong Kong–Macao Greater Bay Area, Beijing–Tianjin–Hebei, the Central Plains, the Shandong Peninsula, Chengdu–Chongqing, Wuhan, Changsha–Zhutan, and Poyang Lake. There is a total of 105 cities among these urban agglomerations. The inspection period was the whole year of 2019. SOM+GIS visualization was used for the innovation analysis of the Chinese urban agglomerations. Scientific and feasible evaluation indicators of urban innovation were constructed for the three aspects of the basic environment, namely, innovation input, innovation output, and innovation. This began with the concept of innovation, based on the principles of science, representativeness, and availability, in addition to the actual situation of urban innovation, and by combing the relevant domestic and foreign literature [46,47,48,49,50,51,52].
Innovation investment refers to the financial support and policy guarantee provided by the government in the process of supporting urban innovation and development [51]. The internal expenditure of research and development (R&D) funds was selected to reflect the investment intensity of innovation, and the R&D expenditure was selected as the local gross national product (GDP). The ratio was used to reflect the relationship between the city’s technological development level and economic development, while also reflecting the support for R&D investment, thus enabling the process of innovation disequilibrium investigation to fully account for the differences in the economic structure of each city.
In terms of innovation output, the city’s technological innovation capability is reflected by the involvement of innovation activity, the transformation of innovative activity results, and the application of new technologies. Indicators such as the number of patent applications and the number of patent authorizations comprehensively reflect the city’s innovation output. These indicators have been widely used in research relating to output evaluation [51,52,53,54].
GDP extensively reflects the living standards and economic conditions of urban residents, and has a close relationship with innovation ability. It has been noted that urban economic growth depends on the innovation capability of a city [55]. Feng Yunting (2019) believes that urban innovation capability is endogenous to the economic structure; hence, the GDP indicator was selected to reflect the role of the economic development level in the innovation environment.
After reviewing and analyzing various innovation indicators, five basic indicators were selected:
(1)
Internal expenditure of R&D expenses;
(2)
Ratio of R&D expenditure to local GDP;
(3)
Number of patent applications;
(4)
Number of patent authorizations;
(5)
GDP.
The data processing flowchart (Figure 2) shows the data processing methods and the corresponding results obtained based on the five basic indicators in this section’s in-depth study of the imbalance of the innovative development of China’s urban agglomerations.

3.2.5. Data Processing

The data processing involved transferring the indicators into the SOM neural network training. First, we drew a two-dimensional map of the innovative differences of Chinese urban agglomerations and then performed GIS visualization processing to obtain the contact map. In addition, we extracted the node weights twice to obtain the neuron weight map.

3.2.6. SOM Data Processing and GIS Visualization Processing

SOM data processing: First, we used the SOM neural network to perform dimensionality reduction and classification operations. The internal expenditure of R&D funds, the proportion of R&D funds to local GDP, and the patents were used as input layer parameters. After multiple training and adjustments, it was found that when the number of network output nodes was 256, the network achieved the best performance. Therefore, the output layer was composed of 256 neurons, represented as a 16 × 16 matrix. In this study, the cities belonging to the same urban agglomeration were classified into one category, so there were nine different urban agglomeration distributions in the result. The Gaussian function was specifically used to update the continuous weight value, which can be used to characterize the relationship between the strength of the influence and the distance. The weight value was initialized to a random number to adapt to the situation in which the amount of input data was small because the number of cities used was 114. The maximum number of training times was 114. Finally, when the initial learning rate was 0.8, the minimum learning rate was 0.1, and the number of training times was 4000. This resulted in the optimal training effect and classification. After multiple rounds of evolution, calculations were performed on the nine city cluster samples, and the classified nodes were directly marked with city names on the grid map to observe the innovation differences and correlation strengths of the city clusters. On the map, the different colors indicate different urban agglomerations. The darker areas are the dividing lines, and the lighter areas are clusters, which can be regarded as one type.
Geographic Information Science (GIS) visualization process: The Folium library was used for GIS visualization. First, the central city of each urban agglomeration and its surrounding cities was indicated. Then, according to the two-dimensional neuron map obtained by the SOM neural network, the Euclidean distance between the central city of each urban agglomeration and its surrounding cities was calculated by grouping the urban agglomerations. This distance was used as the data to measure the innovation gap. Finally, the central city and its surrounding cities were connected with a line segment. The thickness of the line segment indicates the size of the Euclidean distance and the closeness of the innovative connection. That is, the thicker the connecting line segment, the closer (smaller) the Euclidean distance, which means the closer the innovative connection between two cities connected by a line segment. Conversely, the thinner the connection line segment, the longer (larger) the Euclidean distance, and the weaker the innovative connection between the two cities connected by this line segment. The map of innovation connections within urban agglomerations (Figure 3) shows the closeness of the innovative connections between surrounding cities and central cities in the nine urban agglomerations.

3.2.7. Extract Node Weights after SOM Data Processing

After training the SOM network, based on the training results, the weight information of each neuron node was extracted twice, and the neuron value matching map was drawn of the five basic feature indicators, namely, internal R&D expenditure, R&D expenditure as a percentage of local GDP, number of patent applications, number of patent grants, and GDP.

4. Results and Discussion

4.1. Results

4.1.1. Result Analysis of the Current Situation of Innovative Development of Urban Agglomeration

On 21 March 2019, the World Intellectual Property Organization (WIPO) reported that China’s global ranking in terms of the number of international patent applications rose to second for the first time. Moreover, China is expected to surpass the United States to take the top position in three years and become the largest international patent country. According to the “Annual Report of Patent Statistics in 2019”, the total number of patent applications and authorizations in China in 2019 was 4.3805 million and 2.4475 million, respectively. From the perspective of the nine urban agglomerations as a whole, the number of patent applications and authorizations for 2019 totaled 2,697,128 and 1,546,526, respectively, accounting for approximately 61.57% and 63.19% of the national total. It can be seen that these nine urban agglomerations are the “growth poles” and essential sources of strength for China’s innovative development.
Based on the “Annual Report of Patent Statistics in 2019”, a horizontal analysis indicates the hierarchical differentiation of the innovation and development of China’s urban agglomerations is becoming increasingly clear, and the imbalance of regional innovation and development is pronounced. The innovation and development of the Yangtze River Delta urban agglomeration is the most advanced. The number of patent applications was 1,202,281, accounting for 27.45% of the national total, and it accounts for 44.58% of the total of the nine urban agglomerations. The level of innovation and development of the Poyang Lake urban agglomeration is relatively backward. The number of patent applications was only 52,360, accounting for 1.20% and 1.94% of the urban agglomeration and the national totals, respectively, and was nearly 20-fold less than the patents of the Yangtze River Delta urban agglomeration. Among the three major urban agglomerations of the Yangtze River Delta, Guangdong–Hong Kong–Macao Greater Bay Area, and Beijing–Tianjin–Hebei, the number of patent applications and authorizations in the Yangtze River Delta was relatively large, followed by Guangdong–Hong Kong–Macao Greater Bay Area and then Beijing–Tianjin–Hebei. In addition to the three major urban agglomerations, the Chengdu–Chongqing urban agglomeration has a relatively high degree of innovation and development, with 189,691 and 119,454 patent applications and authorizations, respectively, followed by the Shandong Peninsula urban agglomeration with the number of patent applications and authorizations being 189375 and 107019 respectively.
In the following, we use the city cluster around Poyang Lake as an example: let us divide the number of patent authorizations and patent applications in the six major cities of Nanchang, Jiujiang, Shangrao, Fuzhou, Jingdezhen, and Yingtan by 6 to obtain the average number of patent authorizations and the average number of patent applications. The total number of patent authorizations divided by the total number of patent applications, T n , is the patent conversion rate of the urban agglomeration:
T n = ( 13,057 + 6121 + 5068 + 5488 + 2283 + 1961 ) ( 21,684 + 9473 + 7888 + 7648 + 3088 + 2579 ) = 0.649
Table 2 lists the average patent applications, average patent authorizations, and patent conversion rates of the nine urban agglomerations studied in this analysis. It can be seen from Table 2 that in terms of the average number of patent applications and authorized number of urban agglomerations, the Yangtze River Delta urban agglomeration is ranked first, followed by the Guangdong–Hong Kong–Macao Greater Bay Area urban agglomeration, and then the Beijing–Tianjin–Hebei urban agglomeration. The three major city clusters have a clear lead, and the overall and average innovation levels of the Guangdong–Hong Kong–Macao Greater Bay Area urban agglomeration and the Beijing–Tianjin–Hebei urban agglomeration are similar. Among the other six urban agglomerations, the Shandong Peninsula urban agglomeration has a higher average level of innovation, followed by Chengdu–Chongqing. The overall innovation levels of the two urban agglomerations are in reverse order, whereas the Poyang Lake urban agglomeration retains its ranking of last place. Regarding the ratio of the number of authorizations to the average number of urban agglomeration applications, the innovative development pattern of the nine urban agglomerations was considerably different from the pattern demonstrated above. The Poyang Lake City Agglomeration was ranked first; the Chengdu–Chongqing urban agglomeration rose to second; the Central Plains urban agglomeration rose to joint third; and the Beijing–Tianjin–Hebei urban agglomeration ranked fourth. In contrast, the Guangdong–Hong Kong-Macao Greater Bay Area urban agglomeration fell to fifth; the Shandong Peninsula urban agglomeration fell to sixth; the Yangtze River Delta urban agglomeration fell to seventh; and the Zhutan city agglomeration around the Changjiang River remained unchanged. From eighth position previously, the Wuhan city circle fell to last position.
To more intuitively show the differences between the urban agglomerations, the data in Table 2 is now plotted as a histogram as shown in Figure 4, which represents the innovation status of China’s urban agglomerations. From Figure 4, compared with the overall average, only the Yangtze River Delta, the Guangdong–Hong Kong–Macao Greater Bay Area, and the Beijing–Tianjin–Hebei urban agglomerations have higher patent applications and authorizations than the overall average, and the values of the remaining six urban agglomerations are all lower than the overall average. In terms of the number of patent applications/patent authorizations, the gap between each urban agglomeration and the overall average is considerably smaller than the gap between the number of patent applications and authorizations and the overall average. For most urban agglomerations, this index fluctuates within the overall average. Among the urban agglomerations, the five that are significantly higher than the overall average are those of Guangdong–Hong Kong–Macao Greater Bay Area, Beijing–Tianjin–Hebei, the Central Plains, Chengdu–Chongqing, and the Poyang Lake. The four urban agglomerations that are significantly lower than the overall average are those of the Yangtze River Delta, Shandong Peninsula, Wuhan, and Changsha–Zhutan.
In summary, the innovation capability of the Yangtze River Delta urban agglomeration is the highest overall. This is because this area contains the most cities and the largest urban agglomeration. Nonetheless, the difference between this area and the Guangdong–Hong Kong–Macao Greater Bay Area urban agglomeration is, on average, narrowing. Although the number of cities in the Guangdong–Hong Kong–Macao Greater Bay Area urban agglomeration is small, the average level of innovation in these cities is advanced. The Beijing–Tianjin–Hebei urban agglomeration has the weakest innovation capability among the three major urban agglomerations, but the average level of actual innovation achievement is similar to that of the Guangdong–Hong Kong–Macao Greater Bay Area. Although all the Shandong Peninsula city clusters are second-tier cities, their average innovation capability is relatively strong, and is the best with the exception of the three major city clusters. The Chengdu–Chongqing urban agglomeration has the second-largest number of cities, following the Yangtze River Delta urban agglomeration. Its overall innovation capability is relatively strong, and its average innovation capability is weaker than that of the Shandong Peninsula urban agglomeration. The innovation capability of the Central Plains, Wuhan, and Changsha–Zhuxiangtan urban agglomerations is moderate. Both overall and average innovation capabilities of the Poyang Lake urban agglomeration are the weakest, which is due to the small size of the urban agglomeration and its smaller cities.

4.1.2. Analysis of the Research Results of the Theil Index Method

Based on the derived patent application volume, patent grant volume, and patent conversion rate of each city group, the innovation gap between the city T b and the innovation gap within the city T w can be calculated. For detailed data, see the table of innovation gaps in China’s urban agglomerations (Table 3). The heat map for the gap T w of the group patent conversion rate is shown in Figure 1.
The innovation gap table of China’s urban agglomerations in 2019 (Table 3) indicates that, when the innovation capability of a city is measured by the number of patent applications, the overall innovation gap T A between all internal cities included in the Chinese urban agglomeration is 0.6227. This is slightly lower than the innovation gap T G = 0.6910 when the number of authorized patents is used to measure the innovation capability, and far higher than the overall innovation gap T C = 0.0126 when the patent conversion rate is used to measure the innovation capability. It can be seen that, for the number of patent applications and authorizations, the overall gap in China’s urban agglomerations is relatively large, whereas in terms of the patent conversion rate, the overall gap is relatively small and basically remains balanced. This shows that there are significant differences in the innovation enthusiasm and ability, in addition to the ultimate innovation outcomes, between the cities. However, the actual innovation outcomes depend on the innovation capability; that is, the stronger the innovation capability (the number of patent applications), the greater the actual innovation outcomes (the number of patents authorized).
From the innovation gap between the nine major urban agglomerations, the ranking of T b of these three indicators is: T b C < T b A < T b G . Although this ranking of size is consistent with the overall innovation gap, there are large differences in the size and magnitude of the gap. The differences in these three indicators between agglomerations do not vary significantly. This shows that the gap between the innovation capabilities and actual innovation outcomes in the nine major urban clusters is not significant.
Combined with the analysis of the intra-group gap heat map (Figure 1), first, in terms of the number of patent applications, the innovation gap between cities within the Wuhan urban agglomeration was the most significant, reaching T W A (Wuhan agglomeration) = 1.2108. This was followed by the Chengdu–Chongqing urban agglomeration: T W A (Chengyu Agglomeration) = 1.1330. The innovation gap of the Poyang Lake urban agglomeration was the smallest, T W A (Poyang Lake Agglomeration) = 0.2360, but was nonetheless larger than the between-city innovation gap of the urban agglomerations T b A = 0.1764 . Second, for the quantity of patent authorizations, the innovation gap within the Wuhan urban agglomeration was still the largest, with T W G (Wuhan Agglomeration) = 1.2119, followed by the Chengyu urban agglomeration, with T W G (Chengyu Agglomeration) = 1.1716. The innovation gap within the Poyang Lake urban agglomeration was still the smallest, T W G (Poyang Lake Agglomeration) = 0.1912. With the exception of the urban agglomeration around Poyang Lake, the innovation gap within the city, T W G , of the urban agglomerations was still larger than the innovation gap between the city, T b G , of the urban agglomerations ( T b G authorization = 0.2481). Finally, regarding the patent conversion rate, the gap in the patent conversion rate within the Wuhan urban agglomeration was the largest, T W C (Wuhan Agglomeration) = 0.029. For the internal patent conversion of urban agglomerations around Poyang Lake and the Guangdong–Hong Kong–Macao Greater Bay Area urban agglomeration, the gap was small: T W C (Poyang Lake Agglomeration) = 0.0035 and T W C (Guangdong–Hong Kong–Macao Greater Bay Area) = 0.0041. The patent conversion rate between cities was T b C = 0.0081. Compared with the number of patent applications and patent authorizations, the gap in the patent conversion rates between inner urban agglomerations and among urban agglomerations narrowed, indicating that the actual innovation achievements account for a balanced proportion of innovation capabilities.
From the above analysis, it can be derived that:
(1)
There is a significant innovation gap in China’s urban agglomerations as a whole; that is, regional innovation capabilities are not balanced.
(2)
The innovation gap between different agglomerations within China’s urban agglomerations is relatively small; that is, the gap in the innovation development level of different urban agglomerations is relatively small.
(3)
The innovation gap within each urban agglomeration is relatively large, and larger than the innovation gap between different urban agglomerations; that is, the imbalance of innovation development within urban agglomerations is greater than the imbalance of innovation development among urban agglomerations.

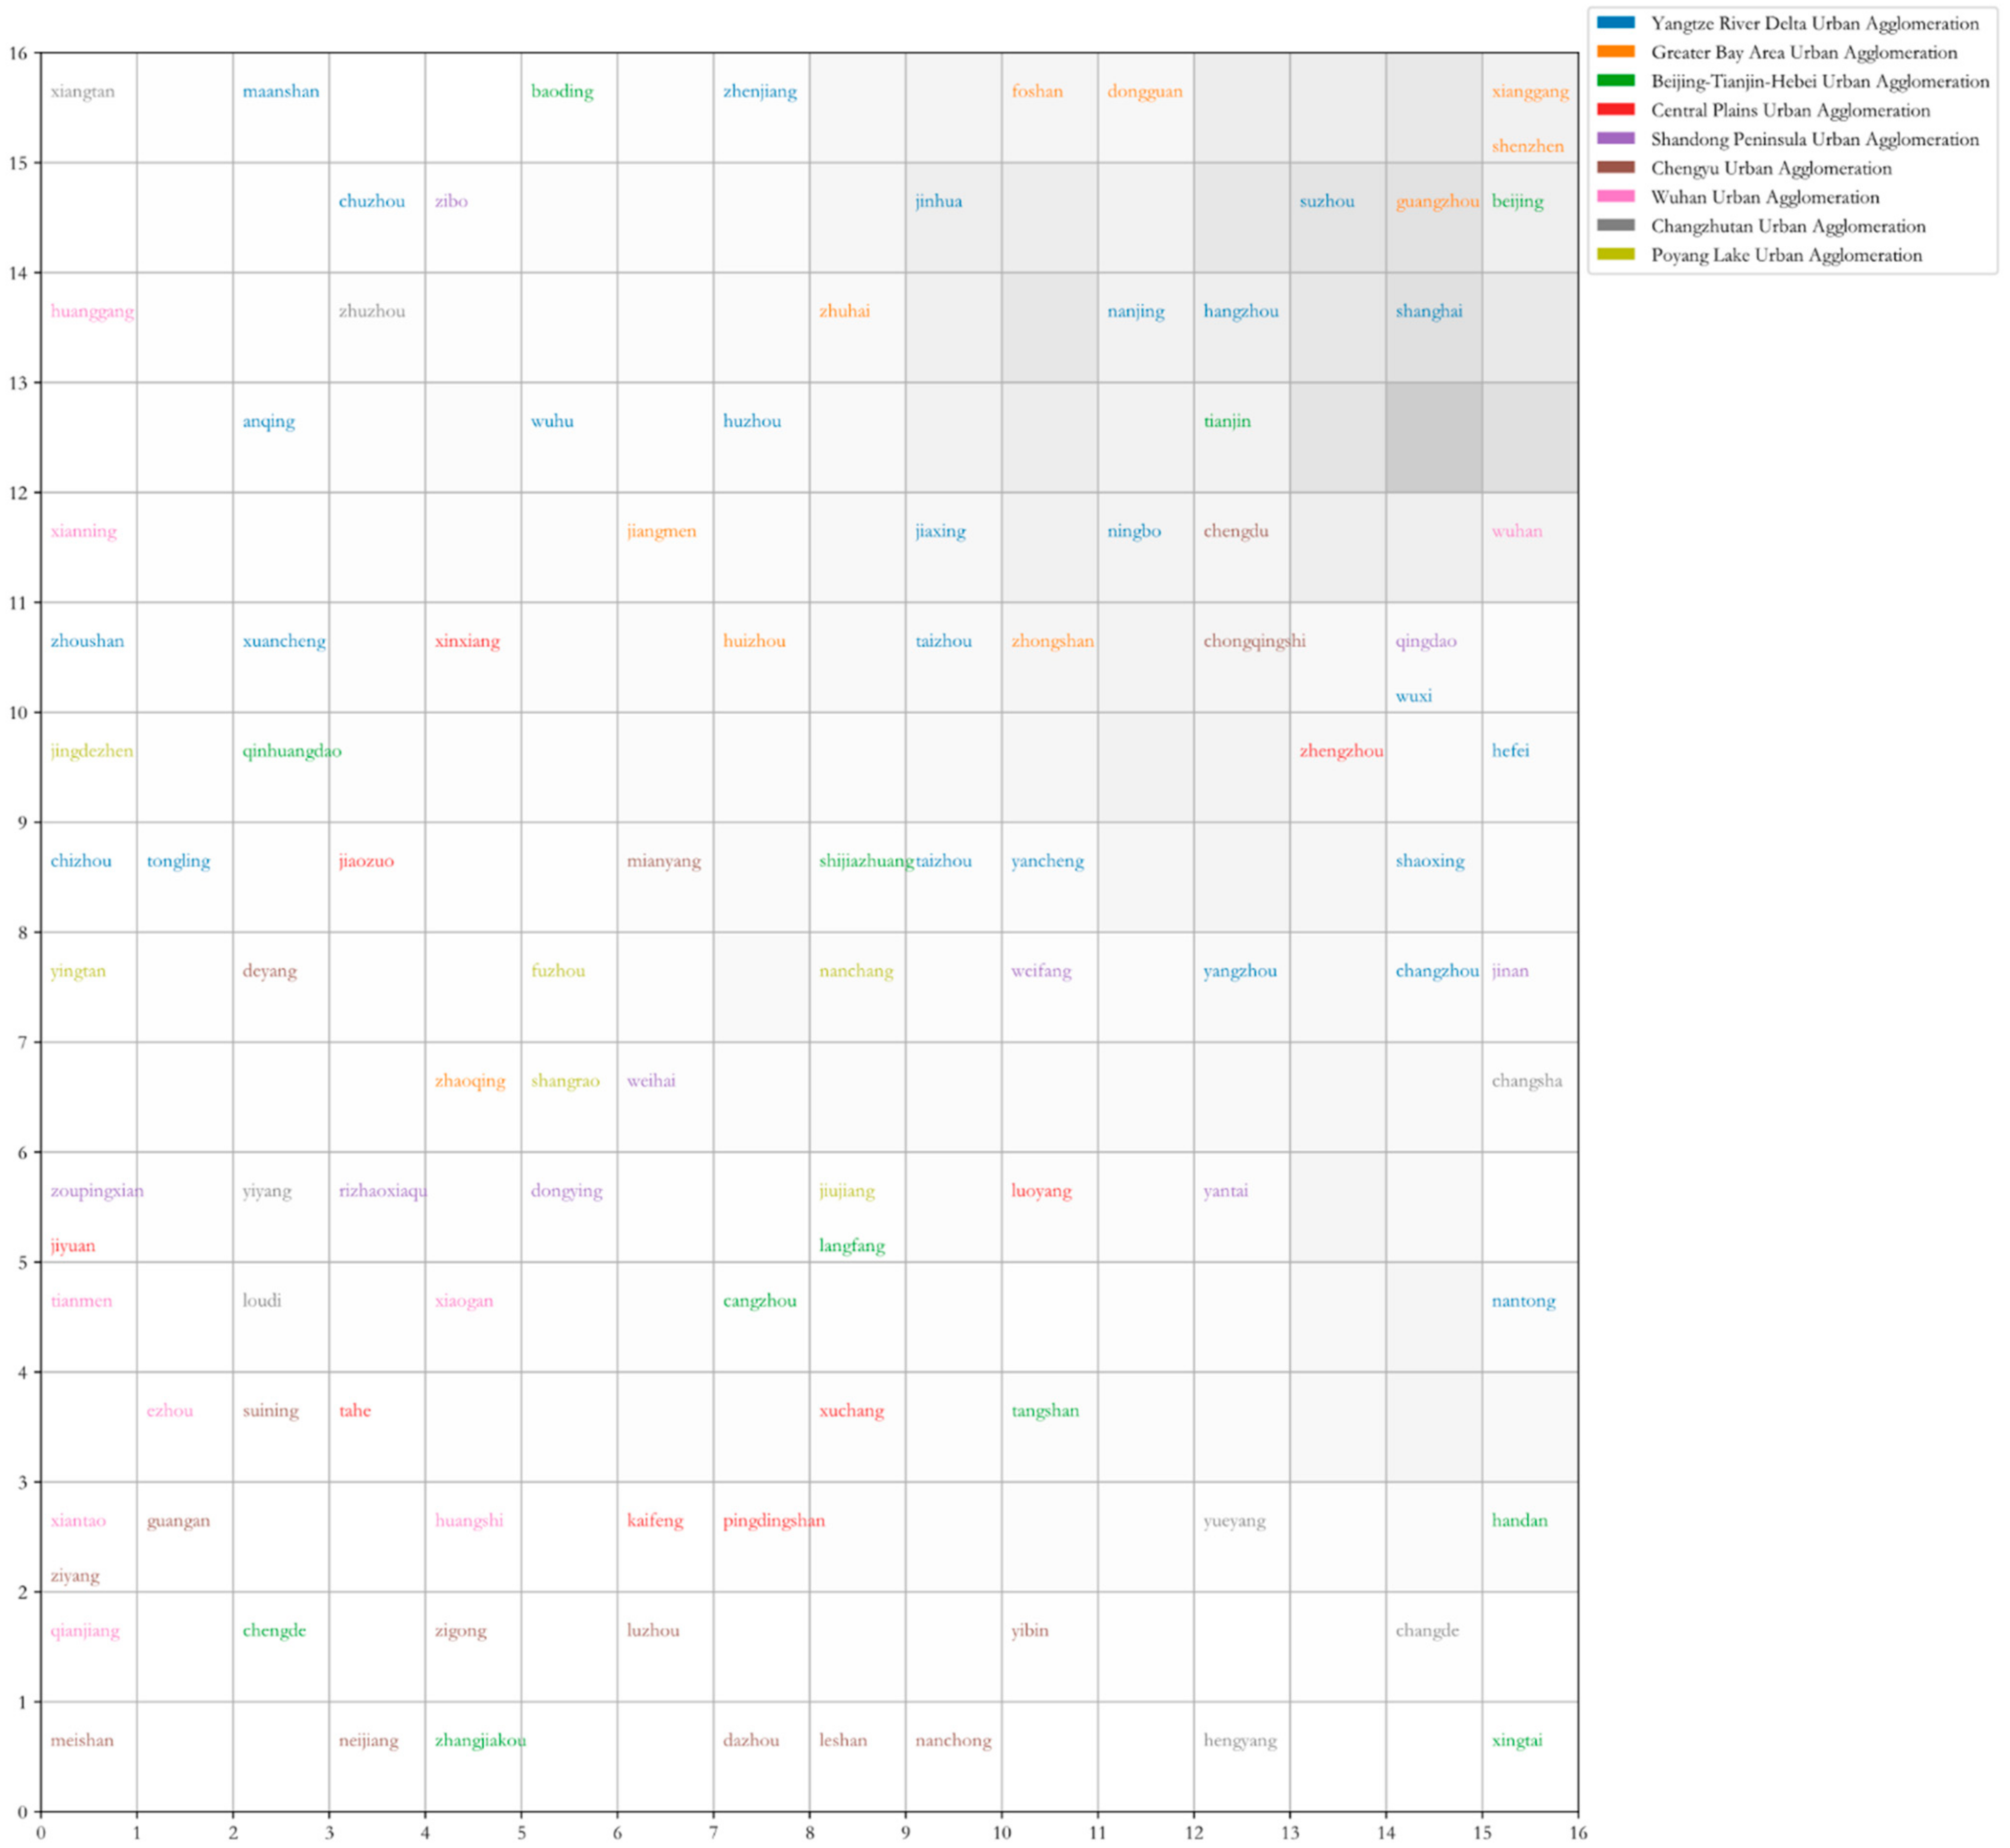
4.1.3. SOM Method Research Results

From the SOM data processing in the data processing process, a two-dimensional map of the innovation differences of Chinese urban agglomerations was obtained (Figure 5), and the internal innovation connection map of the urban agglomerations (Figure 3) was obtained based on the GIS data visualization. The node weights were extracted to obtain the neuron value matching graph of each feature (Figure 6).
From the classification data shown in the two-dimensional map of innovation differences in China’s urban agglomerations (Figure 5), different cities fall on different grids, and some cities also fall on the same grid. The distance of the grid to which the cities belong directly indicates the strength of the innovation correlation after classification. The different colors indicate the city groups to which they belong. The darker areas are the dividing lines, and the lighter areas are clusters, which can be regarded as one category. Chinese cities can be divided into three levels based on five dimensions of data. The first level is the moderately innovative cities, including Shenzhen, Beijing, Guangzhou, Suzhou, Shanghai, and Chengdu. These cities basically occupy the core of the urban agglomeration area. GDP, patent applications, and patent authorizations are all well developed. The second level is the moderately innovative cities, including Chongqing, Tianjin, Nanjing, Hangzhou, Foshan, Dongguan, Ningbo, Zhongshan, Xianning, and Xiaogan. As a cluster, their regional functions are concentrated in the surrounding areas radiating within the strong innovation energy circle. Regions affected by the economies and innovation capabilities of central cities also have moderately innovation capabilities, and maintain a moderately level of innovative development. The third level is weakly innovative cities, including all of the remaining low-level cities. Because these cities are located within the outermost space of the urban agglomeration, and are distant from the central city, their innovation resources and capabilities cannot be maintained at a high level. Thus, they only exist as low-level innovation cities. Figure 5 divides the different cities from top right to bottom left; the neuron value matching map of each feature (Figure 6) also confirms this view. In Figure 6, the location of the neuron node is represented by the horizontal and vertical coordinates, and the color of this location indicates the sensitivity of the current neuron to the basic feature indicators. The internal component of R&D expenditure, the proportion of R&D expenditure in local GDP, the number of patents, the number of patent applications, and the weight of GDP neuron nodes increase from the bottom left to the top right, indicating that these five basic indicators have a positive correlation. For example, almost all the features have the highest weight at the point (16, 0), which is also shown in red in the figure; that is, the highest value of the basic feature index is gathered here and decreases from the upper right to the lower left. Combined with the two-dimensional map of the urban agglomeration, the weight value also decreases from the top right to the bottom left. It can be considered that the cities at the top right have high basic indicators and good innovation capabilities. Combined with the weight of R&D as a proportion of local GDP, there are two cluster points. Some cities in the upper left corner also account for a weight greater than 0.8. This is different from the other four indicators, and also affects the formation of the final two-dimensional map.
The map of innovation connections within urban agglomerations (Figure 3) shows the closeness of the innovative connections between the surrounding cities and the central cities in the nine urban agglomerations. From Figure 3, the internal innovation connection of the Chengdu–Chongqing urban agglomeration is not very strong. The main reason is that Chengdu and Chongqing are closely connected. However, according to the patent application volume and patent authorization data in the “2019 Patent Statistics Annual Report”, in terms of quantity, the Chengdu–Chongqing urban agglomeration has few innovation achievements and weak innovation capabilities. The strongest innovative connections within urban agglomerations are those in the Guangdong–Hong Kong–Macao Greater Bay Area and the Beijing–Tianjin–Hebei urban agglomerations. As shown in Figure 4, although the Beijing–Tianjin–Hebei urban agglomeration and the Guangdong–Hong Kong-Macao Greater Bay Area urban agglomeration have weaker innovation achievements than the longer triangle urban agglomeration, it can be seen from Figure 3 that the relationship between the different neighboring cities is close and the innovation gap is smaller. The innovation achievements of Yangtze River Delta surpass those of the other urban agglomerations, and drive the surrounding cities of Hangzhou, Nanjing, Shaoxing, etc., to develop rapidly. The Wuhan urban agglomeration, which has the worst innovative connections within the urban agglomeration, has not been influenced by Wuhan’s high-level innovative development, with the exception of the innovative scientific research achievements of Wuhan, and is still ranked among the weakly innovative cities.

4.2. Discussion

This study used different methods from the approaches used in previous research. In contrast, Lang (2009) and others used new networks and spatial correlation to reintegrate the urban space in the United States. The current study focused on the nine major urban agglomerations in China, and combined the Theil index and SOM neural network to analyze the imbalance of innovation. Porfiryev (2018) noted that the urban population index in Russia is currently the main criterion for measuring the scale of megacities. The five major cities’ innovation evaluation indicators proposed in this paper were trained by the SOM neural network to obtain a two-dimensional map of the innovation differences of Chinese urban agglomerations, and thus define the scale of Chinese urban innovation. In contrast, Cooke (2001) believes that innovation in the European region is too dependent on the government’s public intervention to cause market failure. However, this article advocates a development approach that combines market leadership and government guidance. In summary, the innovative methods based on Chinese research used in this study enabled effective conclusions to be drawn, but further attention and research is required to examine the issues of sustainable development and the impact on the ecology.
Based on the analysis of the empirical results, it can be concluded that there is a phenomenon of disequilibrium of innovation in urban agglomerations in China: the innovation gap between urban agglomerations is small, and the innovation gap within urban agglomerations is large. The main reasons for this are as follows:
In terms of the small innovation gap between urban agglomerations:
The urban innovation is quantified based on patent applications and authorizations, which largely depend on the relevant field of these applications. Recently, rapid development has occurred in the “high-tech” sector, which has been widely applied in various fields. In China, this sector has also received significant attention and investment. As a result, in addition to developed enterprises, universities and fast-growing high-tech small and medium-sized enterprises have become important for patent applications. Each city agglomeration has national key universities. These cities attach great importance to the technological innovation of their universities and the close cooperation between the universities and enterprises, so that the contribution of each city agglomeration via universities to patent applications is relatively similar. Furthermore, as high-tech development has become more regionally independent, various urban agglomerations have adopted policies to vigorously attract high-tech companies to settle locally, thus helping to narrow the gap between the subjects of patent applications in various regions.
In terms of the large innovation gap within the urban agglomeration:
(1)
Central cities, such as Beijing, Shanghai, Guangzhou, and Shenzhen; municipalities directly under the Central Government; and provincial capitals, have long gathered a large quantity of talents and resources. These urban areas have accumulated innovation ability and experience over a long period; as a result, it is difficult for surrounding small cities to catch up. In addition, according to the principles of the market economy, in response to the profit motive, talented individuals move from surrounding cities to the central city, which further exacerbates the innovation gap within urban agglomerations. This is the major reason why the imbalance in innovation development within urban agglomerations is greater than that between urban agglomerations. This also explains the small internal innovation gap of the Poyang Lake urban agglomeration, which does not have large cities, whereas the Wuhan urban agglomeration, which is centered on a large city, has a large internal innovation gap.
(2)
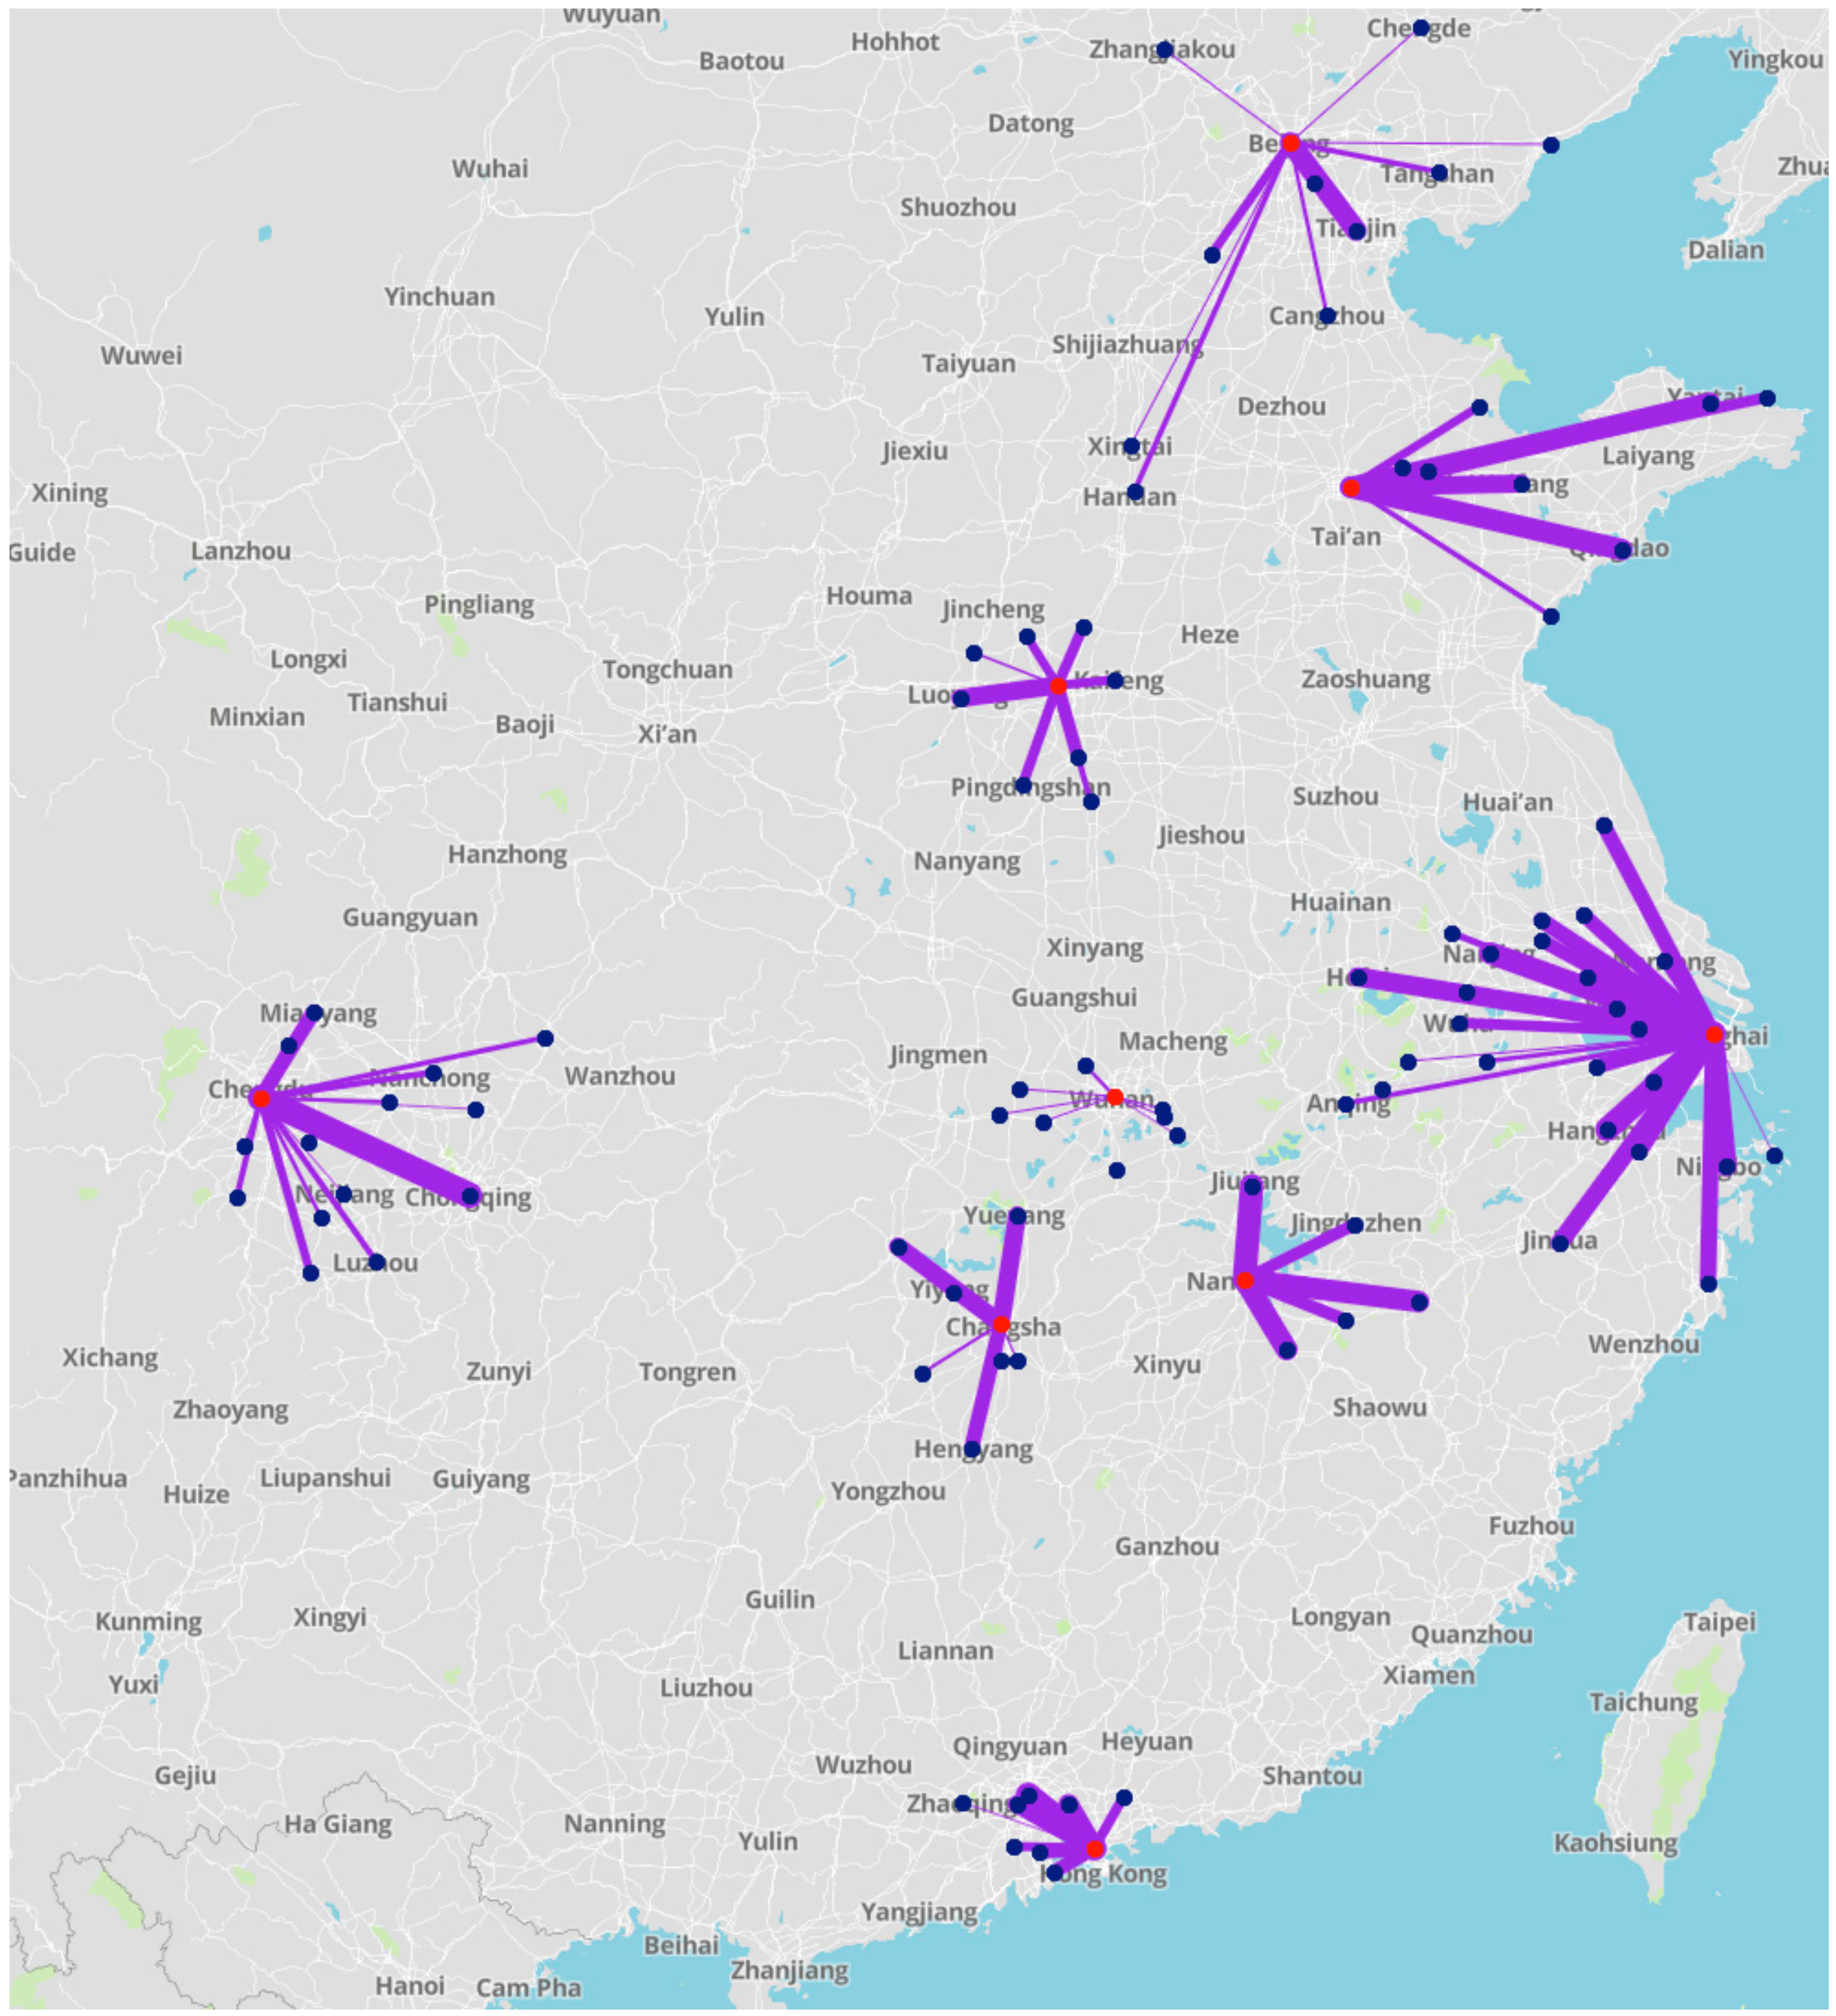
The innovation gap in urban agglomerations with strict administrative standards is even greater. This can be verified by the Beijing–Tianjin–Hebei urban agglomeration. Based on the analysis of the internal innovation connection diagram (Figure 3), the Beijing–Tianjin–Hebei urban agglomeration has applied for urban patents. The large gap in quantity is related to the stricter administrative standard of the development plans in the Beijing–Tianjin–Hebei region. Due to the resource allocation method of “strong government, weak market”, the policy gradient gap in the region is obvious, and results in significantly greater innovation resources in Beijing and Tianjin than in the surrounding cities and, therefore, a wider gap. On the contrary, the innovation difference in cities within the urban agglomeration of the Guangdong–Hong Kong–Macao Greater Bay Area, which operates according to “strong market, weak government”, is smaller.
(3)
Collaborative innovation development between regions will help narrow the innovation gap between cities. According to the central city theory explained in the first point, the innovation gap between cities in the Yangtze River Delta urban agglomeration, with Shanghai as the center, should be relatively large. However, the internal innovation gap of the Yangtze River Delta clusters is relatively small. The development of collaborative innovation among cities occurs within the triangle urban agglomeration. The Yangtze River Delta urban agglomeration has a more reasonable “center-periphery” gradient structure than other urban agglomerations. The relationship between Shanghai and surrounding cities is no longer an antagonistic and resource-competing relationship, but a mutually cooperative relationship. Through the reasonable division of labor and cooperation, the inner cities of the Yangtze River Delta urban agglomeration have formed a close community of interests. This will help reduce the innovation gap between internal cities and promote the collaborative development of innovation among these cities.

5. Conclusions

In the context of the implementation of the innovation-driven development strategy and the integrated development strategy of urban agglomerations, this study analyzed the current situation of the innovation and development of urban agglomerations in China. The study used the Theil index to calculate the innovation gap between Chinese urban agglomerations and their inner cities, and the SOM neural network to process the statistical data and visualize the strength of the innovative connections between the cities within the urban agglomeration. After analyzing the empirical results and their causes, the following conclusions can be drawn:
(1)
The hierarchical differentiation of the innovation development of China’s urban agglomerations is becoming increasingly clear, and there is a significant innovation gap overall. The problem of the imbalance in regional innovation development is pronounced; that is, regional innovation capabilities are not balanced.
(2)
The innovation gap between different urban agglomerations in China is relatively small; that is, the gap in the level of innovation and development of different urban agglomerations is relatively small.
(3)
The innovation gap between cities within each urban agglomeration is relatively large, and is significantly larger than the innovation gap between different urban agglomerations; that is, the imbalance in innovation development within urban agglomerations is greater than the imbalance in innovation development among urban agglomerations.
(4)
Central cities in urban agglomerations may squeeze the innovation resources of surrounding cities, leading to a widening in the innovation gap between cities. The irrational allocation of innovation resources in urban agglomerations with strong administrative standards will also further aggravate this gap. The coordinated development of innovation between regions can help narrow the innovation gap between cities.
Based on the above conclusions, it is recommended that Chinese urban agglomerations, when formulating development plans, adhere to the development policy of combining market leadership and government guidance, promote the flow and sharing of innovative resources between regions, and promote central cities to exert their “innovative radiation effects” rather than the “innovation squeeze effect.”

Author Contributions

Conceptualization, Y.S. and Q.Y.; methodology, M.Z.; writing—original draft preparation, X.W.; writing—review and editing, T.W. All authors have read and agreed to the published version of the manuscript.

Funding

The work is supported by the National Social Science Fund of China (No. 16ZDA045) and the National Natural Science Foundation of China (No. 71603197).

Data Availability Statement

Data source: “2019 City Yearbook Statistical Yearbook”, Intellectual Property Office, “2019 National Economic and Social Development Statistical Bulletin”, China Statistical Information Network, World Population Encyclopedia, “2019 Patent Statistical Yearbook”, etc.

Conflicts of Interest

The authors declare no conflict of interest.

References

  1. Wang, C.Z.; Zhao, G.J. Analysis of China’s regional innovation efficiency based on non-radial SE-C~2R model and pedigree clustering. China Soft Sci. 2015, 11, 68–80. [Google Scholar]
  2. Zhang, A.; Zhang, Y.; Zhao, R. A Study of the R&D Efficiency and Productivity of Chinese Firms. J. Comp. Econ. 2003, 31, 444–464. [Google Scholar] [CrossRef]
  3. Agbali, M.; Trillo, C.; Fernando, T.P.; Arayici, Y. Creating Smart and Healthy Cities by Exploring the Potentials of Emerging Technologies and Social Innovation for Urban Efficiency: Lessons from the Innovative City of Boston. Int. J. Civ. Environ. Struct. Constr. Archit. Eng. 2017, 11, 600–610. [Google Scholar]
  4. Ben, T.M.; Wang, K.F. Interaction Analysis among Industrial Parks, Innovation Input, and Urban Production Efficiency. Asian Soc. Sci. 2011, 7, 56–71. [Google Scholar] [CrossRef]
  5. Cooke, P. Regional Innovation Systems, Clusters, and the Knowledge Economy. Ind. Corp. Chang. 2001, 10, 945–974. [Google Scholar] [CrossRef]
  6. Villani, E.; Lechner, C. How to acquire legitimacy and become a player in a regional innovation ecosystem? The case of a young university. J. Technol. Transf. 2020, 4, 1–29. [Google Scholar] [CrossRef]
  7. Mao, Q.L.; Xu, J.Y. Market transformation, Employment dynamics and productivity growth in China. Manag. World. 2015, 10, 7–23 + 87. [Google Scholar]
  8. Cheng, Q.; Yin, Z.F.; Ye, J.Y. State-owned Enterprises and Regional Innovation Efficiency-Based on the Perspective of Externality Analysis. Ind. Econ. Res. 2015, 4, 10–20. [Google Scholar]
  9. Zhang, C.Z.; Huang, D.C.; Ma, Z.J. Industrial Agglomeration and Industrial Innovation Efficiency: The Connection and Promotion of Financial Market-Taking High-tech Industrial Agglomeration and Innovation as an Example. Ind. Econ. Res. 2012, 6, 17–25. [Google Scholar]
  10. Bai, J.h.; Jiang, F.X. A Study on Regional Innovation Efficiency Considering Environmental Factors—Based on the Three-stage DEA Method. Financ. Trade Econ. 2011, 10, 104–112+136. [Google Scholar]
  11. Zhou, X.Y.; Ge, J.; Ma, L.Y. An Empirical Study on the Efficiency of China’s Regional Innovation System Based on Dynamic Panel Data Mode. Econ. Manag. 2009, 31, 28–32. [Google Scholar]
  12. Jefferson, G.H.; Huamao, B.; Xiaojing, G.; Xiaoyun, Y. R&D Performance in Chinese Industry. Econ. Innov. New Technol. 2006, 15, 345–366. [Google Scholar]
  13. Nasierowski, W.; Arcelus, F.J. On the efficiency of national innovation systems. Socio Econ. Plan. Sci. 2003, 37, 215–234. [Google Scholar] [CrossRef]
  14. Narula, R.; Dunning, J.H. Industrial Development, Globalization and Multinational Enterprises: New Realities for Developing Countries. Oxf. Dev. Stud. 2000, 28, 141–167. [Google Scholar] [CrossRef]
  15. Hong, J.; Feng, B.; Wu, Y.R.; Wang, L. Do government grants promote innovation efficiency in China’s high-tech industries? Technovation 2006, 57, 4–13. [Google Scholar] [CrossRef]
  16. Wang, Q.; Yang, R.; Zhao, R.Y.; Wang, C. Does State-level Upgrade of High-tech Zones Promote Urban Innovation Efficiency: Evidence from China. Sustainability 2019, 11, 6071. [Google Scholar] [CrossRef] [Green Version]
  17. Mora, L.; Bolici, R.; Deakin, M. The First Two Decades of Smart-City Research: A Bibliometric Analysis. J. Urban Technol. 2017, 24, 3–27. [Google Scholar] [CrossRef]
  18. Nam, T.; Pardo, T.A. Smart city as urban innovation: Focusing on management, policy, and context. In Proceedings of the 5th International Conference on Theory and Practice of Electronic Governance ICEGOV ’11, Tallinn, Estonia, 26–29 September 2011; Association for Computing Machinery: New York, NY, USA, 2011; Volume 9, pp. 185–194. [Google Scholar] [CrossRef]
  19. Caragliu, A.; Bo, D.C.F. Smart innovative cities: The impact of Smart City policies on urban innovation. Technol. Forecast. Soc. Chang. 2019, 142, 373–383. [Google Scholar] [CrossRef]
  20. Berry, B.J.L.; Okulicz-Kozaryn, A. The city size distribution debate: Resolution for US urban regions and megalopolitan areas. Cities 2012, 29, S17–S23. [Google Scholar] [CrossRef]
  21. Bulkeley, H.; Coenen, L.; Frantzeskaki, N.; Hartmann, C.; Kronsell, A.; Mai, L.; Marvin, S.; McCormick, K.; van Steenbergen, F.; Palgan, Y.V. Urban living labs: Governing urban sustainability transitions. Curr. Opin. Environ. Sustain. 2016, 22, 13–17. [Google Scholar] [CrossRef] [Green Version]
  22. Bibri, S.E. A foundational framework for smart sustainable city development: Theoretical, disciplinary, and discursive dimensions and their synergies. Sustain. Cities Soc. 2017, 38, 758–794. [Google Scholar] [CrossRef]
  23. Datta, A. New urban utopias of postcolonial India: ‘Entrepreneurial urbanization’ in Dholera smart city, Gujarat. Dialogues Hum. Geogr. 2015, 5, 3–22. [Google Scholar] [CrossRef]
  24. Powson, E. Megalopolis: The urbanized northeastern seaboard of the United States. Prog. Hum. Geog. 2008, 32, 441–444. [Google Scholar]
  25. Spivak, A.A.; Loktev, D.N.; Rybnov, Y.S.; Soloviev, S.P.; Kharlamov, V.A. Geophysical fields of a megalopolis. Izv. Atmos. Ocean. Phys. 2016, 52, 841–852. [Google Scholar] [CrossRef]
  26. Gutiérrez-Avila, I.; Arfer, K.B.; Wong, S.; Rush, J.; Kloog, I.; Just, A.C. A spatiotemporal reconstruction of daily ambient temperature using satellite data in the Megalopolis of Central Mexico from 2003 to 2019. Int. J. Climatol. 2021, 41, 4095–4111. [Google Scholar] [CrossRef] [PubMed]
  27. Ebel, R. Chinampas: An Urban Farming Model of the Aztecs and a Potential Solution for Modern Megalopolis. Horttechnology 2020, 30, 13–19. [Google Scholar] [CrossRef] [Green Version]
  28. Terando, A.J.; Costanza, J.; Belyea, C.; Dunn, R.R.; McKerrow, A.; Collazo, J.A. The Southern Megalopolis: Using the Past to Predict the Future of Urban Sprawl in the Southeast U.S. PLoS ONE 2014, 9, e102261. [Google Scholar] [CrossRef] [Green Version]
  29. Lang, R.E.; Knox, P.K. The New Metropolis: Rethinking Megalopolis. Reg. Stud. 2009, 43, 789–802. [Google Scholar] [CrossRef]
  30. Porfiryev, B.N.; Bobylev, S.N. Cities and Megalopolises: The Problem of Definitions and Sustainable Development Indicators. Stud. Russ. Econ. Dev. 2018, 29, 116–123. [Google Scholar] [CrossRef]
  31. Fang, C.L.; Yu, D.L. Urban agglomeration: An evolving concept of an emerging phenomenon. Landsc. Urban Plan. 2017, 162, 126–136. [Google Scholar] [CrossRef]
  32. Chen, D.L.; Lu, X.H.; Kuang, B. Dynamic evolution and spatial convergence of urban land use efficiency in the urban agglomeration in the middle reaches of the Yangtze River. Chin. Popul. Resour. Environ. 2018, 28, 106–114. [Google Scholar]
  33. Yu, J.K.; Ma, J.Q. Study on the evolution of the spatial pattern of economic linkages in the Shandong Peninsula urban agglomeration. Geogr. Sci. 2018, 38, 1875–1882. [Google Scholar]
  34. Zhang, H.; Jiang, F.; Wang, Y.Q.; Cheng, J.H.; Qian, C. The temporal and spatial differences and distribution characteristics of the ecological livability and industry level of the Yangtze River Delta urban agglomeration. Chin. Popul. Resour. Environ. 2018, 28, 73–82. [Google Scholar]
  35. Wang, Q.; Jin, C. A Quantitative Measurement of the Unbalanced Economic Development Level of China’s Urban Agglomerations. Quant. Econ. Tech. Econ. Res. 2018, 35, 77–94. [Google Scholar]
  36. Liu, Y.Q.; Quan, Q.; Zhu, J.L.; Wang, F. Green Technological Innovation, Industrial Agglomeration and Ecological Efficiency: Taking the Urban Agglomeration of the Yangtze River Economic Belt as an Example. Resour. Environ. Yangtze River Basin 2018, 27, 2395–2406. [Google Scholar]
  37. Liu, S.L. The development process and future vision of China’s urban agglomerations since the reform and opening up. Gansu Soc. Sci. 2018, 5, 1–9. [Google Scholar]
  38. Chen, G.L.; Tang, G.N. Research on the Spatial Disintegration of the Secondary and Tertiary Industries Based on the Internet Perspective—Empirical Evidence from the Yangtze River Delta City Group. China Ind. Econ. 2016, 8, 76–92. [Google Scholar]
  39. Fan, F.; Lian, H.; Liu, X.Y.; Wang, X.L. Can environmental regulation promote urban green innovation Efficiency? An empirical study based on Chinese cities. J. Clean. Prod. 2020, 287, 125060. [Google Scholar] [CrossRef]
  40. Zhang, J.X.; Kang, L.; Li, H.; Ballesteros-Pérezt, P.; Zuo, J. The impact of environmental regulations on urban Green innovation efficiency: The case of Xi’an. Sustain. Cities Soc. 2020, 57, 102123. [Google Scholar] [CrossRef]
  41. Zhou, C.; Zeng, G.; Cao, X.Z. Study on the network structure and innovation ability of Chinese cities. Geogr. Research 2017, 36, 1297–1308. [Google Scholar]
  42. Feng, F.; Wang, L.B. Research on the improvement of regional science and technology policy performance from the perspective of collaborative innovation—Based on the empirical analysis of the Pan-Yangtze River Delta region. Sci. Sci. Manag. S. T. 2011, 12, 109–115. [Google Scholar]
  43. Guoping, L. Research on the integrated development policy of science and technology innovation in the Beijing-Tianjin-Hebei region. Econ. Manag. 2014, 6, 13–18. [Google Scholar]
  44. Li, Y.C.; Phelps, N. Megalopolis unbound: Knowledge collaboration and functional polycentricity within and beyond the Yangtze River Delta Region in China, 2014. Urban Stud. 2016, 5, 443–460. [Google Scholar] [CrossRef]
  45. Tomokiyo, M.T.; Hurst, M. A Language Model Approach to Keyphrase Extraction. Assoc. Comput. Linguist. 2003, 6, 33–40. [Google Scholar] [CrossRef] [Green Version]
  46. Li, B.; Tian, X.L.; Zhang, S.D.; Zhao, H.P. Research on the evaluation of urban innovation ability and the evolution of spatial-temporal pattern. Math. Stat. Manag. 2020, 39, 139–153. [Google Scholar]
  47. Haščič, I.; Migotto, M. Measuring Environmental Innovation Using Patent Data; Paris OECD: Paris, France, 2015. [Google Scholar]
  48. Deng, Y.W.; Hu, T.; Hou, J.J.; Zhang, M.L. Study on the Spatial Differentiation of Urban Innovation Ability in Changchun Metropolitan Area. Planner 2020, 36, 69–74. [Google Scholar]
  49. Zeng, J.Y.; Liu, Y.; Wang, R.Y.; Zhan, P.Y. Absorptive capacity and regional innovation in China: An analysis of patent applications, 2000–2015. Appl. Spat. Anal. Policy 2019, 12, 1031–1049. [Google Scholar] [CrossRef]
  50. Xie, S.H.; Gan, C.; Yu, H.Y. Evaluation of the Innovation Ability of the Yangtze River Delta Urban Agglomeration and Analysis of Its Spatial Differences. Urban Issues 2017, 8, 92–95+103. [Google Scholar]
  51. Zheng, Y.; Qin, K.X. Performance evaluation and temporal-spatial differences of ecological innovation in China’s provincial capitals: An empirical analysis since the implementation of innovation-driven development strategies. Technol. Prog. Countermeas. 2021, 1, 36–44. [Google Scholar]
  52. Feng, Y.T.; Zhai, J.T.; Ji, L.Q. Innovative ability, economic structure and the rise and fall of cities. Res. Financ. Issues 2019, 423, 115–123. [Google Scholar]
  53. Wu, M.; Liu, Z.J. Evaluation index system construction and empirical analysis of innovation oriented city. Sci. Technol. Econ. 2009, 22, 14–17. [Google Scholar]
  54. Liu, M.G.; Li, G.Y. Comparative research of typical innovation index compilation method at domestic and abroad. Int. Conf. Inf. Manag. IEEE 2017, 3, 447–452. [Google Scholar] [CrossRef]
  55. Zhou, Z.H. On the city’s comprehensive innovation ability. Shanghai Econ. Res. 2002, 4, 23–24. [Google Scholar]
Figure 1. Heat map of gaps of urban agglomeration within cities.
Sustainability 13 09506 g001
Figure 2. Data processing flowchart.
Sustainability 13 09506 g002
Figure 3. Internal innovation connection diagram of urban agglomerations.
Sustainability 13 09506 g003
Figure 4. Status of China’s urban agglomeration of innovation.
Sustainability 13 09506 g004
Figure 5. A two-dimensional map of the innovative differences of Chinese urban agglomerations.
Sustainability 13 09506 g005
Figure 6. The neuron value matching map of each feature.
Sustainability 13 09506 g006
Table 1. Scope of urban agglomerations.
Urban AgglomerationsCities under the Urban Agglomerations
Yangtze River Delta Urban AgglomerationShanghai, Nanjing, Wuxi, Changzhou, Suzhou, Nantong, Yancheng, Yangzhou, Zhenjiang, Taizhou in Jiangsu Province, Hangzhou, Ningbo, Jiaxing, Huzhou, Shaoxing, Jinhua, Zhoushan, Taizhou in Zhejiang Province, Hefei, Wuhu, Ma’anshan, Tongling, Anqing, Chuzhou, Chizhou, Xuancheng in Anhui Province
Guangdong–Hong Kong–Macao Greater Bay Area Urban AgglomerationGuangzhou, Shenzhen, Zhuhai, Foshan, Dongguan, Huizhou, Zhongshan, Jiangmen, Zhaoqing, Hong Kong, Macau
Beijing–Tianjin–Hebei Urban AgglomerationBeijing, Tianjin, Baoding, Tangshan, Langfang, Shijiazhuang, Qinhuangdao, Zhangjiakou, Chengde, Cangzhou, Xingtai, Handan in Hebei Province
Central Plains Urban AgglomerationZhengzhou, Kaifeng, Luoyang, Xinxiang, Pingdingshan, Xuchang, Jiaozuo, Luohe and Jiyuan in Henan Province
Shandong Peninsula Urban AgglomerationJinan, Qingdao, Zibo, Weifang, Dongying, Yantai, Weihai, Rizhao and Zouping counties in Shandong Province
Chengyu Urban AgglomerationChongqing City, Chengdu, Mianyang, Deyang, Leshan, Meishan, Suining, Neijiang, Nanchong, Ziyang, Zigong, Yibin, Guang’an, Dazhou, Luzhou in Sichuan Province
Wuhan Urban AgglomerationCentered on Wuhan, the largest city in the central region, it covers an urban agglomeration composed of 8 large and medium-sized cities around Huangshi, Ezhou, Huanggang, Xiaogan, Xianning, Xiantao, Qianjiang, Tianmen, etc.
Changzhutan Urban AgglomerationHunan Province: Parts of eastern and central Hunan centered on Changsha, Zhuzhou, Xiangtan, Hengyang, Yueyang, Yiyang, Changde, and Loudi
Poyang Lake Urban AgglomerationNanchang, Jiujiang, Shangrao, Fuzhou, Jingdezhen, and Yingtan in Jiangxi Province
Table 2. Average number of patent applications and authorizations in urban agglomerations in China.
Urban Agglomerations in ChinaNumber of CitiesAverage Value of Patent ApplicationsRankAverage Value of Patents AuthorizedRank Patent   Conversion   Rate   ( T n ) Rank
Yangtze River Delta Urban Agglomeration2646241.577126124.19210.5647
Guangdong-Hong Kong-Macao Greater Bay Area Urban Agglomeration1135977.600221046.25320.5854
Beijing-Tianjin-Hebei Urban Agglomeration1234474.000320096.75030.5835
Central Plains Urban Agglomeration912184.88967323.77860.6013
Shandong Peninsula Urban Agglomeration921041.667411891.00040.5656
Chengyu Urban Agglomeration1512646.06757963.60050.6302
Wuhan Urban Agglomeration911221.77875722.55670.5109
Changzhutan Urban Agglomeration89912.12585313.00090.5368
Poyang Lake Urban Agglomeration68726.66795663.00080.6491
average value10521380.707-12349.312-0.577-
Data source: “2019 City Yearbook Statistical Yearbook”, Intellectual Property Office, “2019 National Economic and Social Development Statistical Bulletin”, China Statistical Information Network, World Population Encyclopedia, “2019 Patent Statistical Yearbook”, etc.
Table 3. The innovation gap of China’s urban agglomerations in 2019.
2019Patent ApplicationPatent AuthorizationPatent Authorization/Patent Application
Urban Agglomerations T w A T b A T A T w G T b G T G T w C T b C T C
Yangtze River Delta Urban Agglomeration0.4174 0.4001 0.0093
Guangdong-Hong Kong-Macao Greater Bay Area Urban Agglomeration0.4284 0.17640.62270.3979 0.24810.6910.0041 0.00810.0126
Beijing-Tianjin-Hebei Urban Agglomeration1.0194 1.0494 0.0237
Central Plains Urban Agglomeration0.6502 0.5913 0.0075
Shandong Peninsula Urban Agglomeration0.4463 0.4429 0.0045
Chengyu Urban Agglomeration1.1330 1.1749 0.0224
Wuhan Urban Agglomeration1.2108 1.2119 0.0290
Changzhutan Urban Agglomeration0.5084 0.4995 0.0068
Poyang Lake Urban Agglomeration0.2360 0.1912 0.0035
Publisher’s Note: MDPI stays neutral with regard to jurisdictional claims in published maps and institutional affiliations.

