Abstract
The microalgal strain Chlorella sorokiniana isolated from a waste stabilization pond was used for tertiary treatment of municipal wastewater. Three light:dark (L:D) regimes of 12:12, 16:8, and 24:0 were used for treating wastewater in microalga (A), microalga + sludge (A + S), and sludge (S) reactors. The removal of nutrients (N and P) was found to be the highest in the microalga-based reactor, with more than 80% removal of biochemical oxygen demand (BOD) and 1.2–5.6 log unit removal of pathogens. The addition of sludge improved chemical oxygen demand (COD) removal. Nitrifiers were found to be predominant in the A + S reactor. Algal biomass productivity was more than 280 mg/L/d in all the L:D regimes. The increase in light regime improved nutrient removal and biomass productivity in the algal reactor. Results of the kinetic study showed that (i) nitrifiers had more affinity for ammonium than microalga, and hence, most of the ammonia was oxidized to nitrate, (ii) microalga assimilated nitrate as the primary nitrogen source in the A + S reactor, and (iii) solubilization of particulate organic nitrogen originated from dead cells reduced the nitrogen removal efficiency. However, in the microalga-based reactor, the ammonium uptake was higher than nitrate uptake. Among pathogens, the removal of Salmonella and Shigella was better in the A + S reactor than in the other two reactors (microalga and sludge reactor). Additionally, the heterotrophic plate count was drastically reduced in the presence of microalga. No such drastic reduction was observed in the stand-alone sludge reactor. Kinetic modeling revealed that microalga–pathogen competition and pH-induced die-off were the two predominant factors for pathogen inactivation.
1. Introduction
In conventional wastewater treatment, tertiary treatment is being used to remove nutrients such as nitrogen and phosphorous, which remain in wastewater after secondary treatment or the activated sludge process. Nitrification and denitrification cycles are used for nutrients removal; however, these processes are ineffective for achieving the nutrient level established by EU legislation. In addition to biological tertiary treatments, chemical-based methods such as precipitation (aluminum and iron salts) and coagulation are being employed; however, all these processes increase the treatment cost [1,2]. Conventional biological processes cannot reduce pathogen concentration to the desired values. Hence, chlorination and UV treatment are used for reducing pathogen content in treated wastewater [3]. Generally, the presence of pathogenic strains is determined by the total coliform and fecal coliform counts. In biological wastewater treatment, pathogenic organisms die due to the scarcity of nutrients and competition with other bacteria. The aerobic environment also affects the growth of pathogenic microorganisms. Integrated wastewater systems, including microalga-based wastewater treatment, play an essential role in improving the nutrients and pathogen removal efficiencies [4]. Microalga-based wastewater treatment improves the effluent quality by utilizing nitrogen and phosphorous, reducing pathogens, and removing various pharmaceutically active compounds, and it produces bioproducts such as proteins, carbohydrates, and lipids [5,6,7,8]. In waste stabilization ponds, which are being used to treat sewage, pathogenic microorganism die-off is facilitated by sunlight and diurnal changes in pH due to microalgal growth [9,10]. For the tertiary treatment of wastewater, the removal of nutrients and pathogens is crucial, and microalga-based treatment is one of the best options to achieve the same results [11].
In microalga-based wastewater treatment, the interaction between microalga and bacteria is one of the main factors that affect the treatment efficiency of the system [12,13,14]. In an integrated polyculture system, various symbiotic relationships develop among various species of microalga and bacteria. A symbiotic relationship ultimately improves the treatment efficiency [15]. Microalga-based wastewater treatments, which are being used for nutrient (such as nitrogen and phosphorus) removal, also enhance pathogen inactivation [4,10,16]. Some of these studies have shown enhanced inactivation of a particular pathogenic strain. For example, complete inactivation of Salmonella and/or helminth eggs was observed in high-rate algal ponds [9,10,16,17,18]. However, some studies have shown a low inactivation rate of Salmonella and Shigella in high-rate algal ponds. In particular, Salmonella showed high tolerance against changes in temperature, pH, and dissolved oxygen (DO) in the environment [3]. Hence, there is a need to study the effect of algal inoculum and light on pathogen inactivation in wastewater. There is also a need to develop kinetic models that can estimate the effect of various factors such as light intensity and reactive oxygen species on pathogen die-off. Kinetic models can also provide insight for the important parameters that can affect the pathogen inactivation significantly.
In this study, we aimed to quantify the role of microalga in the removal of nutrients, decrease in chemical oxygen demand (COD), biochemical oxygen demand (BOD), and pathogens (E. coli, Shigella, and Salmonella) in the microalga-based wastewater treatment. Kinetic modeling was employed to understand various factors that affect the removal of nutrients and pathogens. For pathogen die-off, the effects of light (light inhibition because of cell damage), reactive oxygen species (produced due to high DO and light intensity), microbe–pathogen interaction, and natural die-off were assessed.
2. Materials and Methods
2.1. Preliminary Growth of Microalgal Cells
Chlorella sorokiniana strain 1, isolated in our laboratory from a wastewater sample, was used in this study. The wastewater sample was obtained from a local waste stabilization pond located at Lakkarghat Rishikesh (India). At the first stage, the microalgal strain grew in a modified BG-11 medium that was maintained at 25 ± 2 °C and at pH = 7 for six days to achieve the required algal inoculum dose (700 mg/L as total suspended solids (TSS)). The culture was kept under continuous light illumination of 90 μmol/m2/s. Constituents of modified BG 11 media at pH = 9 were given in Rani et al. [11]. For modified BG-11 media at pH = 7, K2HPO4 was replaced with KH2PO4.
2.2. Experimental Setup
At the second stage, after attaining the required biomass of microalga, experiments were designed for analyzing the effects of different sets of parameters such as light period and microalga–sludge inoculum on BOD, COD, and nutrient (nitrogen, phosphorus) removal from the municipal wastewater (after secondary treatment). The following experiments were conducted considering factors such as light duration and microalga–sludge inoculum (separate or combined) as the operating parameters for assessing their roles on the wastewater treatment (N, P, and pathogen removals and microalgal biomass production).
Three systems were used: microalga (A) and sludge-based (S) system: L:D (h) cycles of 12:12, 16:8, and 24:0 were considered to assess the efficacy of microalga and sludge in treating municipal wastewater (after secondary treatment referred to as secondary effluent thereafter). Co-cultured microalga–sludge systems (A + S) were used with L:D of 12:12 and 16:8 and a constant microalga–sludge inoculum ratio of 3.5:1 (weight:weight, dry weight, microalga (700 mg/L):sludge (200 mg/L)). Optimal concentration of microalga was obtained from previous studies [11]. Later several doses of microalga were tried with 200 mg/L of sludge dose, and it was observed that microalga: sludge ratio 3.5:1 worked best for the wastewater used in this study. BOD of the secondary effluent is low; hence, there is no need to increase the concentration of sludge to a value close to activated sludge process.
2.3. Analytical Methods
The initial concentration of wastewater is shown in Table 1. After the preliminary growth, algal cells were harvested and transferred to real wastewater. In the A + S system, microalga and sludge inoculums were transferred to wastewater under the light intensity of 140 µmol/m2/s and temperature of 25 °C. The mixing was performed in a reactor (3-L working volume, borosilicate glass, and cylindrical) through agitators running at 150 rpm. The study was conducted in a batch mode for 48 h. Light intensity was measured using a photosynthetically active radiation sensor and a light meter (LI-193, LI-250A, Li-COR Biosciences, Lincoln, NE, USA).

Table 1.
Characteristics of real wastewater used for the study.
Samples of wastewater were obtained from a local municipal wastewater treatment plant in Rishikesh (India), and sludge samples were collected from an activated sludge plant in Haridwar. After sample collection, 50 mL of the sample was kept immediately at 4 °C for pathogen detection, and pathogen estimation was performed within 12 h.
DO was determined using a DO meter (Hach LDO), and pH of the wastewater was measured using a digital pH electrode (HI 902). Turbidity was estimated using a turbidimeter (HACH 2100AN). The wastewater sample was filtered through a 0.22 μm filter paper, and the filtered samples were further analyzed. COD and 5 day BOD (BOD5) were estimated using the standard methods [19]. Concentration of nutrients such as NO3-N, NH4-N, and PO4-P were measured using a UV–VIS spectrophotometer (HACH DR 6000). Total kjeldahl nitrogen (TKN) was measured using the HACH-simplified TKN s-TKNTM-TNT 880 kit (0–16 mg/L N).
Biomass growth was determined by measuring the total suspended solids (TSS) through the gravimetric method [19]. For differentiating between the algal and bacterial biomass in the wastewater, samples were also processed for chlorophyll estimation. Algal biomass and sludge were mixed at various ratios, and the chlorophyll contents of these mixtures were estimated. Chlorophyll content estimation and related empirical formula were taken from Becker [20]. Thereafter, a calibration curve was developed considering the ratios of various mixtures (microalga + sludge, A + S) and their corresponding chlorophyll content vs. microalga:sludge ratio. The standard curve was used to estimate the microalga and sludge content in an unknown mixture with known chlorophyll content (Supplementary Materials, Figure S1). Optical density at 670 nm was also determined to correlate the growth pattern of algal cells.
2.4. Frequency of Estimation of Various Parameters
COD, DO, TSS, NO3-N, PO4-P, ammonia, turbidity, OD, and chlorophyll content were measured every 6 h. BOD and TKN were measured at 0 and 48 h. pH and various microbial parameters were measured every 12 h.
2.5. Microbial Enumeration
Samples were analyzed for heterotrophic plate count (HPC) and enteric pathogens, such as E. coli, Salmonella, and Shigella species, present in wastewater by using the standard spread plate method [19]. Aliquots (1 mL) of wastewater sample and solids (1:10, sludge:distilled water) were used for serial dilution. The colony forming unit (CFU/mL) was used to estimate the viable microbial count. Microbial enumeration was carried out at every 12 h. Specific culture media such as tryptone glucose yeast agar for HPC, sorbitol MacConkey Agar (SMAC) for E. coli, xylose lysine deoxycholate agar for Salmonella, and deoxycholate citrate agar for Shigella were used. All the specified media were obtained from HiMedia Pvt. Laboratories, India.
Extent of removal was estimated using Equation (1).
where N0 and Nt denote the bacterial count at the beginning and at the end of the study, respectively. All pathogen removals presented in this manuscript are depicted in log10 unit.
Rate of removal was estimated using linear regression in Microsoft® Excel (version 16.43).
2.6. Kinetic Modeling
2.6.1. Nitrogen Removal
Nitrogen removal in the reactors can be described using Equations (2) and (3). In the experiment, total ammonia (TAN, NH4+ + NH3) was measured. Hence, the equilibrium chemistry between NH4+ and NH3 was used to estimate the individual concentration of NH4+ and NH3, i.e.,
where K = 5.56 × 10⁻¹⁰. We assumed that nitrifiers use ammonium (NH4+) as the substrate [21] and that microalga predominantly use ammonium as the nitrogen source.
where Ma and Mb represent the algal and bacterial biomass (mg/L) at a particular time t; TAN (NH3 + NH4), NH4, and NO3 represent the concentrations (mg/L) at a particular time; K1 represents the kinetic coefficient for ammonium oxidation by nitrifiers; K2 and K3 represent the kinetic coefficients for ammonia and nitrate uptake by microalga, respectively; K4 represents the kinetic coefficient for nitrate uptake by bacteria; K5 represents the kinetic coefficient for ammonia volatilization from wastewater; K6 represents the hydrolysis of organic nitrogen to ammoniacal nitrogen; and Kf and Kb represent the forward and backward reaction kinetics of ammonia, as given in Equation (6). Equations (2)–(6) were used to estimate the kinetic parameters and various components of the nitrogen fate at a particular time. To estimate the kinetic parameters, nonlinear optimization was used (error minimization). Dissociation of organic nitrogen (Org-N) was considered only during the estimation of kinetic parameters, as given in the Equations (3) and (4). Inherent assumptions regarding those equations are given in the Supporting Information.
TA= [NH4]{1 + K/[H+]}
2.6.2. Pathogen Die-Off
2.7. Quality Control and Quality Assurance
One-way and two-way analysis of variance followed by the Tukey test was used to estimate significant differences between the parameters. Statistical significance was tested at the 0.05 level. Blanks were kept at each L:D regime, 12:12, 16:8, and 24:0 h, and one at dark phase. For estimation of the accuracy of simulated results, the simulated results were compared with the experimentally determined values.
3. Results and Discussion
This study was designed to understand the effects of light duration and sludge and microalga inoculum doses on the treatment efficiency, biomass production, and pathogen removal. Therefore, the results are divided into following subheadings: (i) effects of light duration on biomass production and (ii) effects of different photoperiod regimes on the treatment efficiency. Afterward, a comparative assessment among the microalga, A + S, and sludge reactor was undertaken to understand the effects of different inoculations on the treatment performance.
3.1. Effects of Light Period on Biomass Production
In this study, C. sorokiniana (700 mg/L) was cultivated in the secondary effluent at a light intensity of 140 µmol photon/m2/s by using three different L:D regimes (12:12, 16:8, and 24:0) for two days to assess the variation in biomass production and nutrient, COD, and BOD removal rates.
3.1.1. Microalga-Based System
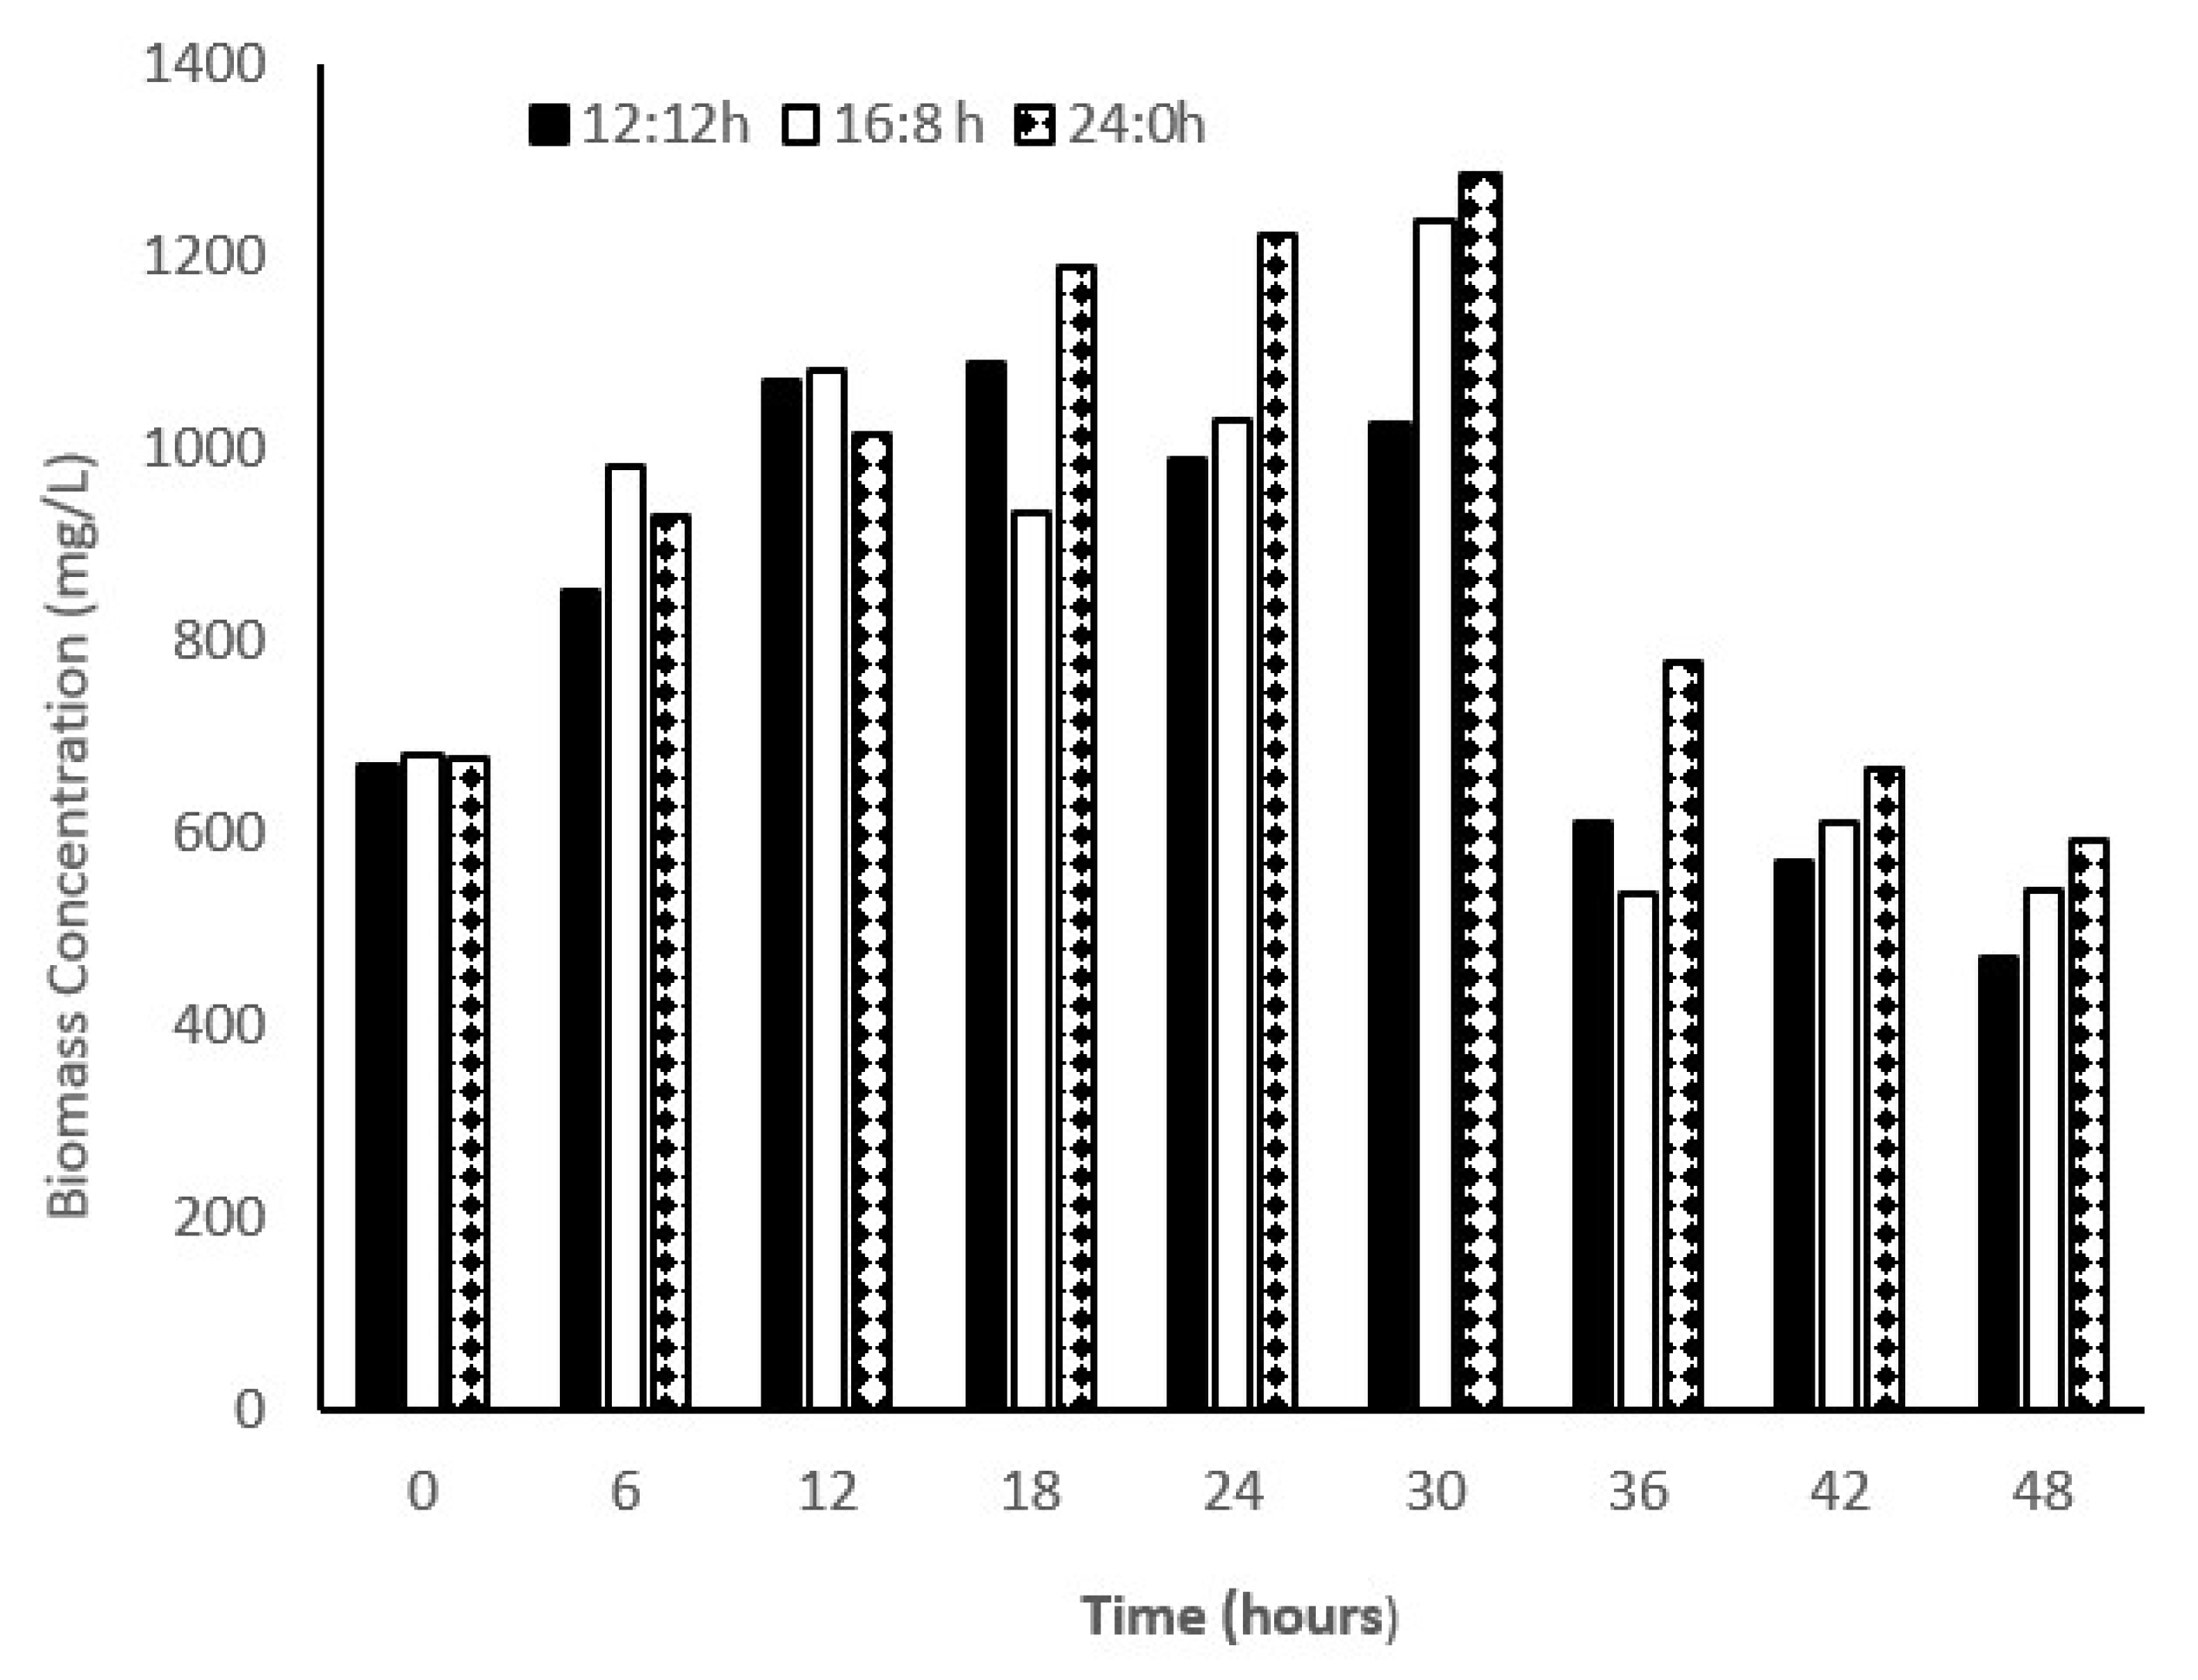
The strain of C. sorokiniana showed a considerable difference in the average biomass productivity with varying L:D regimes; biomass production was 283.2, 444, and 488 (mg/L/d) in L:D regimes of 12:12, 16:8, and 24:0, respectively. Approximately, a 1.5-fold increase in the biomass productivity was observed in the L:D regime of 24:0 compared with that of 12:12, whereas no considerable changes were observed in biomass productivity in the L:D regime of 24:0 compared with that of 16:8 (Figure 1). In a study, it was found that biomass productivity of C. pyronoidosa could reach 85, 77, and 60 mg/L/d in L:D regimes of 24:0, 16:8, and 12:12, respectively [22], which is lower than the one reported in the present study. Different strains of Chlorella species showed a significant difference in the biomass production when subjected to different photoperiod regimes. Many researchers have found that the growth rate and biomass productivity of microalga are sensitive to light intensity as well as photoperiod regimes [23]. Even the same strain exposed to different L:D regimes showed diverse outcomes. For example, Bohutskyi et al. [24] reported that C. sorokiniana showed no photoinhibition when tested in a wide range of light intensities, whereas the growth rates of all other species were reduced at the light intensity of >150 µmol photon/m2/s. Hence, light saturation is dependent on species. Various species showed different light saturation/inhibition limits. C. vulgaris showed higher growth rates, i.e., 1.15, 1.20, and 1.18 d−1 in L:D regimes of 12:12, 16:8, and 24:0, respectively, with high light intensity (200 µmol photon/m2/s). Lee and Lee [25] showed that the effect of using different L:D regimes (12:12 and 24:0) on the growth rate (0.1 d−1) of C. kessleri at the light intensity of 45 µmol photon/m2/s was not significant [26]. Selvaratnam et al. [27] reported biomass productivity in a primary effluent in the range of 133–146 mg/L/d. In this study, growth rates of C. sorokiniana were 0.33, 0.46, and 0.49 d−1 in the L:D regimes of 12:12, 16:8, and 24:0, respectively. Hence, the growth rate of microalga was found to be dependent on the duration of photoperiod. However, Su [28] observed that as the microalgal species are habituated with a diurnal light–dark cycle, a continuous light regime would affect the biomass growth. In our study, we observed that increase in light duration increased the biomass productivity. As shown in Figure 1, in all the experiments, biomass productivity increased up to 30 h and then suddenly declined to half of the biomass concentration at 36 h. For all the experiments, it seems that inorganic nitrogen limitation at 30 h and beyond causes cessation of growth and biomass productivity. When microalgal density was high, light penetration was limited. Hence, light limitation also affects the microalgal growth. In another batch study, we also observed that biomass productivity was not high as compared to the study we presented in this manuscript. In another batch study at 12/12 h light–dark cycle, our research group registered high growth rate. Concentration of biomass increased till 36 h and registered a biomass productivity of 520 mg/L/d. Hence, a considerable variability was observed in our study with respect to biomass productivity (unpublished data from our research group). Lage et al. [29] also observed a considerable variation in treatment efficiency and biomass growth in their study on treating municipal wastewater using monoculture and polyculture of microalga.

Figure 1.
Biomass concentration in microalga-based system. 12:12, 16:8, and 24:0 are the light/dark regime. Biomass concentration (TSS) were measured at 6 h interval.
3.1.2. Microalga + Sludge (A + S) System
In the A + S system, to check the microalga–bacteria interactions, C. sorokiniana (700 mg/L) with activated sludge (200 mg/L) was cultivated in the secondary effluent at a light intensity of 140 µ mol photon/m2/s with two different L:D regimes (12:12 and 16:8).
Average biomass productivity was 286 and 173 mg/L/d for L:D regimes of 12:12 and 16:8, respectively. Similar to the biomass productivity, the growth rate was higher in the L:D cycle of 12:12 (0.21 d−1) than that of 16:8 (0.11 d−1). At the L:D of 16:8, biomass concentration increased continuously up to 24 h and then suddenly decreased after 30 h. After 30 h, in both the treatments (12:12 and 16:8), cells entered the decay phase at a very fast rate (Figure 2). In this study, for both the cases, turbidity (~450 NTU) was high throughout the study, because of presence of sludge inoculum in both the reactors. Hence, light limitation was one of the factors responsible for lower biomass productivity. Low light intensity also affected the nitrate uptake (NO3 is the main N form at 30 h and thereafter). Hence, biomass productivity decreased rapidly. C. sorokinana continues to grow in a wide range of light intensities, whereas the growth phase of some of the microalgal species declined at the light intensity of more than 150 µmol photon/m2/s. Possibly, the effective light intensity used in this study was not sufficient for C. sorokiniana to sustain the biomass concentration with nitrate as the sole source of nitrogen in media. Similar observations were reported by Bohutskyi et al. [24].
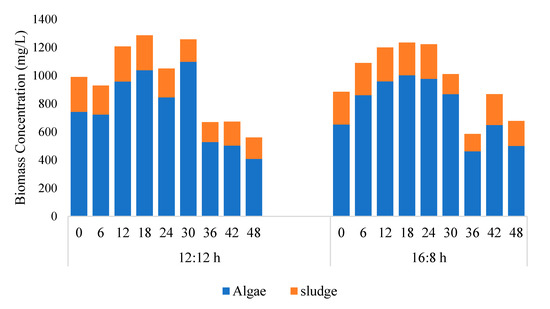
Figure 2.
Concentration of microalga and sludge obtained from chlorophyll data (microalga + Sludge reactor). 12:12 and 16:8 h light–dark regime. Chlorophyll based estimation methods given in details in Section 2.3.
Figure 2 shows that a major fraction of the biomass was microalga and its concentration changed with time, whereas the concentration of bacteria remained within 100–250 mg/L throughout the study. The algal biomass productivity in 12/12 and 16/8 h L:D study was reported to be 286 and 173 mg/L/d. As compared to the stand-alone microalga reactor, the addition of sludge could not increase biomass productivity in 12/12 h L:D study, whereas in 16:8 h L:D study, the addition of sludge had a detrimental effect on algal biomass productivity. In the A + S reactor, biomass productivity (16:8 h L:D study) was 173 mg/L/d, which was almost 270 mg/L/d lower as compared to the stand-alone microalga reactor. Other studies reported in the literature showed that the addition of sludge has a positive effect on the algal biomass productivity. For example, Fallahi et al. [30], Lee et al. [31], and Arcila and Buitron [32] observed that under prolonged light–dark period algal biomass productivity increased. Among the abovementioned studies Lee et al. [31] reported that prolong light period was detrimental for microalga growth. However, in our stand-alone microalga reactor, we observed that a continuous light period increased algal biomass productivity. The higher biomass productivity occurring in our study is most likely due to the short period of study (up to 30 h biomass concentration increased; in some cases, biomass concentration increased up to 42 h). Other studies which depicted detrimental effects of light periods were carried out for more than a week [28,31].
3.2. Effect of Different L:D Regimes on Nitrogen, Phosphorus, COD, and BOD
To study the effect of L:D regimes on nutrient removal, the concentration profiles of nutrients (total nitrogen and PO4-P) and organic carbon (COD and BOD) were obtained under three different L:D cycles (12:12, 16:8, and 24:0).
Nitrogen and phosphorus removal (microalga-based system): for different L:D cycles, there were slight differences in the total nitrogen and phosphorus removals. After 48 h, the total nitrogen content was reduced from 18 mg/L to 2.64, 2.47, and 3.21 mg/L, and the phosphorus content was reduced from 4.2 mg/L to 1.06, 0.72, and 0.68 mg/L in L:D regimes of 12:12, 16:8, and 24:0, respectively (Supplementary Materials, Figures S2 and S3).
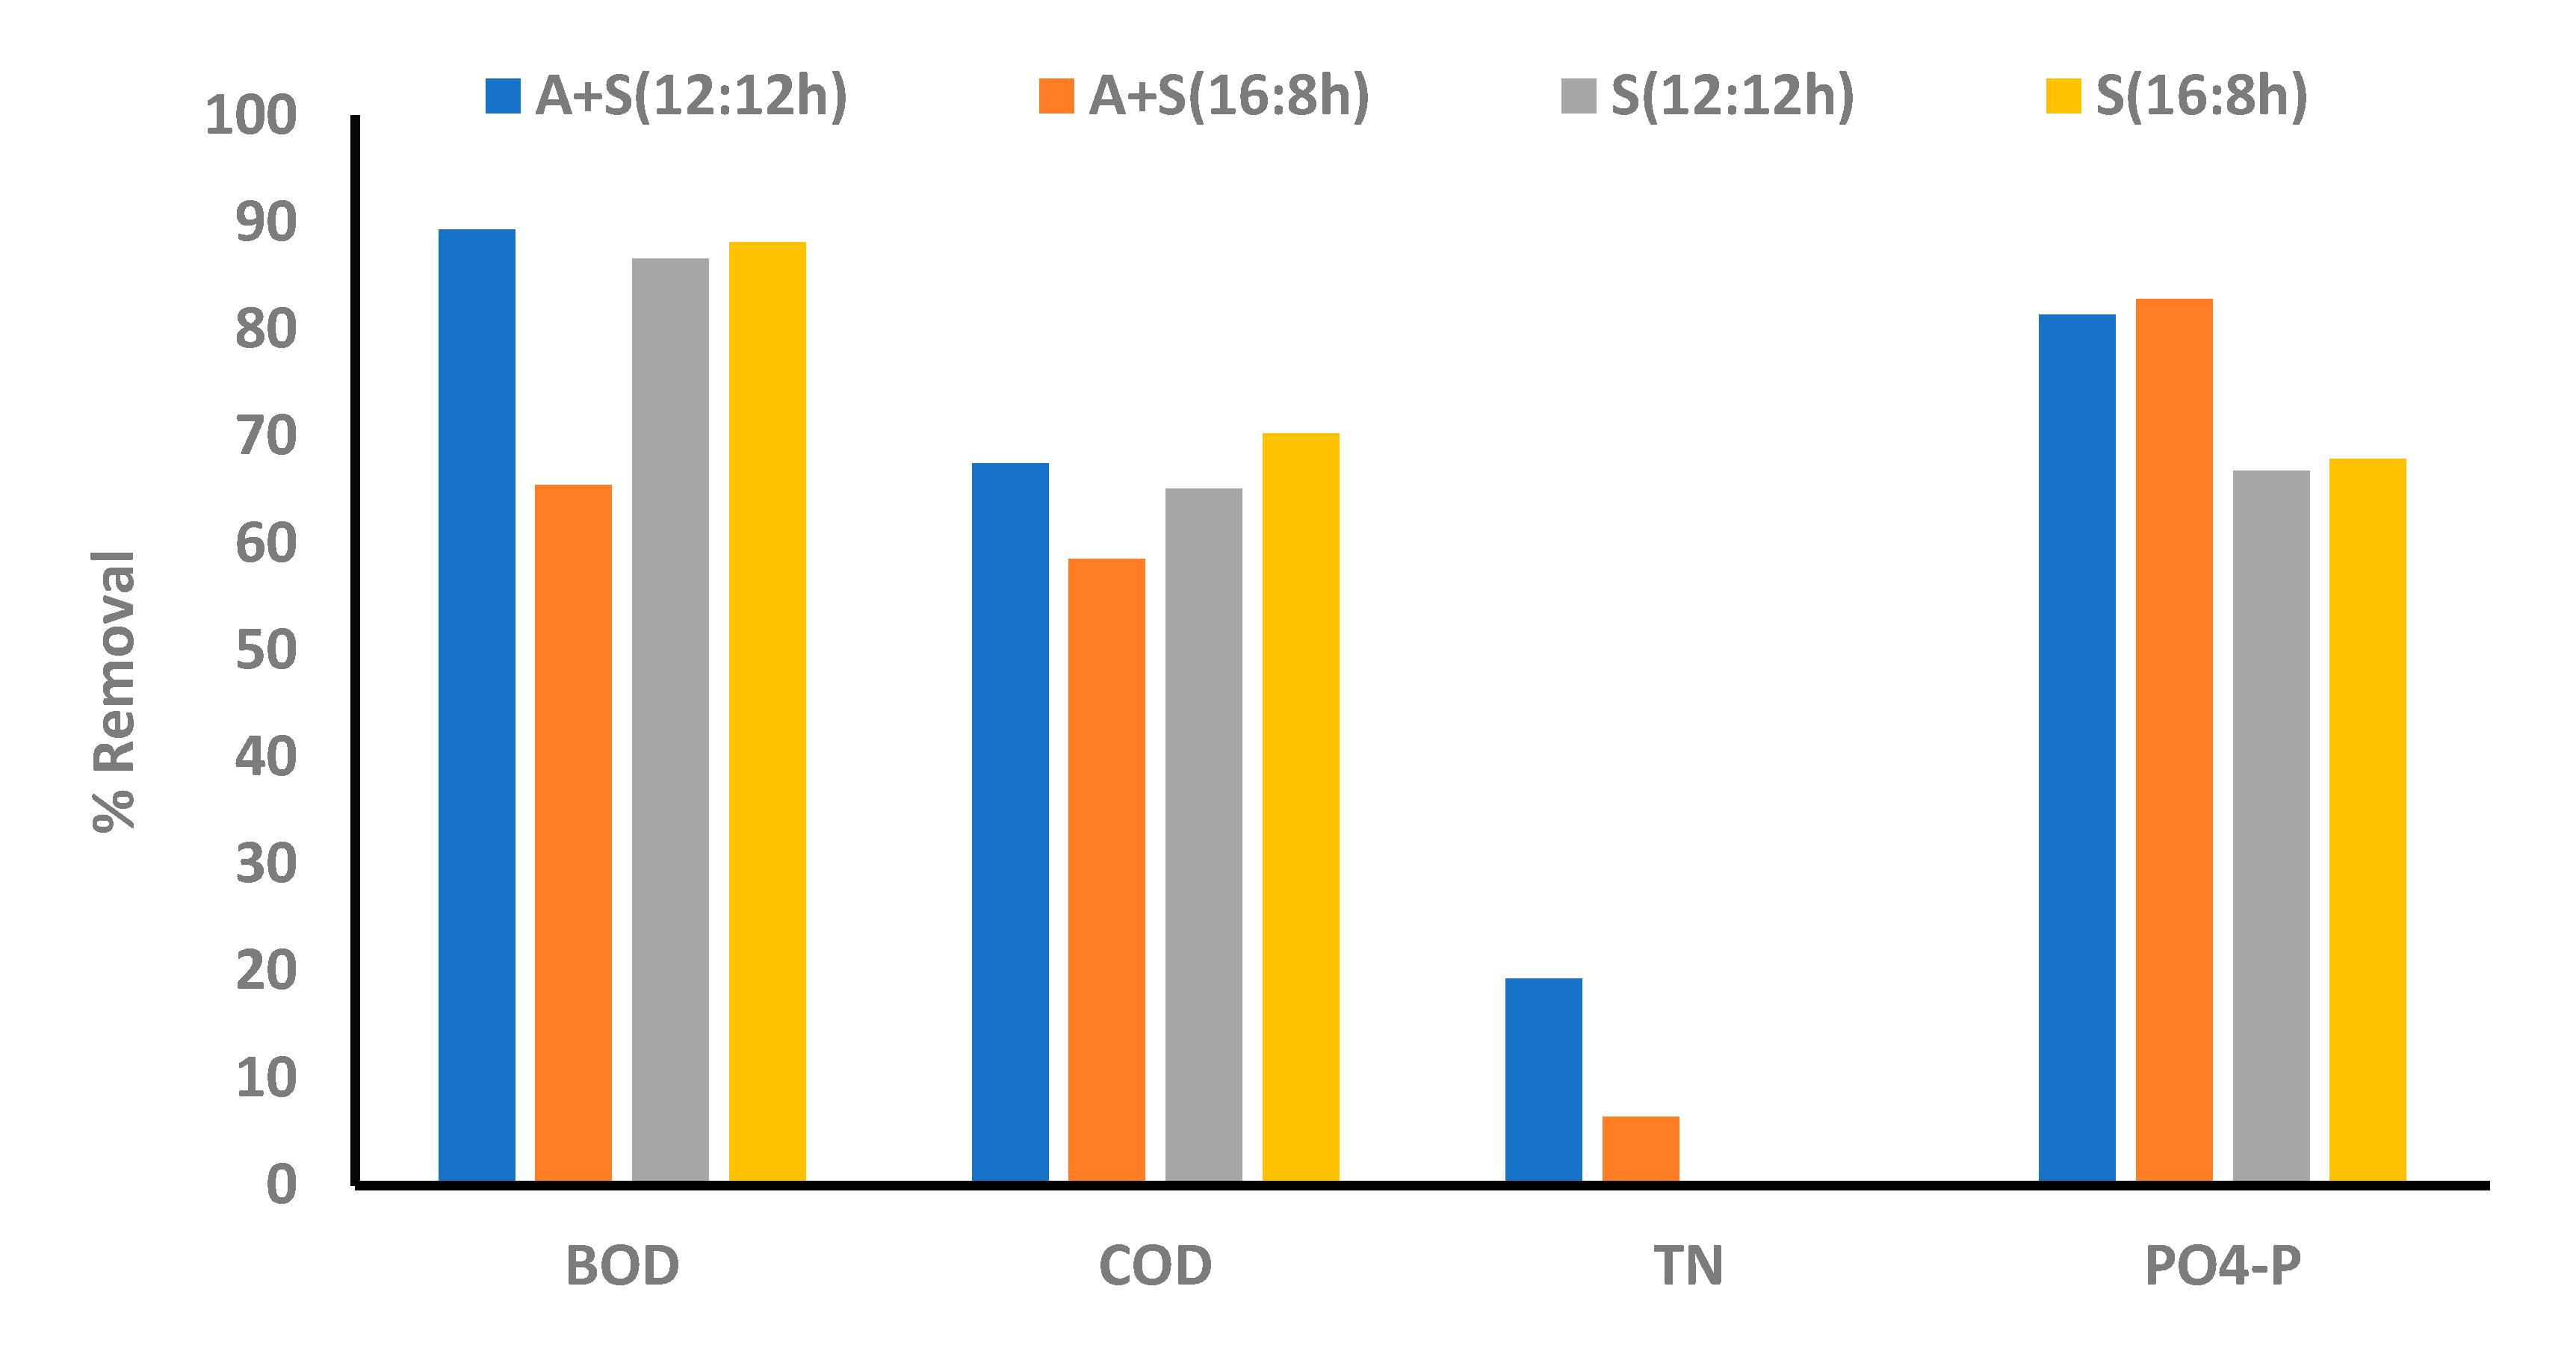
The percentage removal of TKN and NH4-N showed similar results for all the photoperiod regimes; however, NO3-N removal was slightly higher in the case of 24:0, whereas the percentage removal of PO4-P was the same in the case of 16:8 and 24:0 L:D regimes (Figure 3). High irradiance and long light periods are supposed to improve removal of nitrogen and phosphorus. A study reported that 100% nitrogen removal was observed in all the microalgal strains tested at high irradiance (120–180 µmol photon/m2/s) in the 24:0 L:D cycle [33]. Xin et al. [34] reported that Scenedesmus sp. removes 90% of the nitrate after 13 days of cultivation in L:D cycle of 14:0 under a light intensity of 25 µmol photon/m2/s. In another study, C. zofingiensis removed approximately 80% nitrogen under high irradiance (230 µmol photon/m2/s) and at a L:D regime of 24:0. The medium contained a high initial N concentration (148 mg/L) [35]. In this study, NO3-N and NH4-N were removed completely within 30 h in the longer light periods (16:8 and 24:0). It was observed that the biomass concentration increased until 30 h. As the biomass concentration increased, nitrogen concentration decreased. After 30 h, a slight increase in the nitrogen concentration was observed in the culture media. Unlike nitrogen removal, phosphate was removed continuously until 48 h in all the L:D regimes. Compared with the results of this study, the phosphorus removal rates by Scenedesmus sp. and C. zofingiensis have been reported to be 95–100% [34,35]. Contrary to the results of this study, the removal rate of phosphorus by C. kessleri was 8–20%, when cultured in an artificial wastewater sample under L:D regime of 12:12. In this study, 74–83% phosphorus removal was observed in all the L:D regimes. Several other studies that used Chlorella species for nutrient removal have reported a wide variation in nutrient removal with a variation in photoperiod regime. For example, Silva-Benavides and Torzillo [36] reported that increased light intensity improved the nutrient removal, particularly nitrogen and phosphorus. However, Lee and Lee [25] and Goncalves et al. [33] observed that nutrients removal is lower under continuous irradiation than under the 12:12 L:D regime.
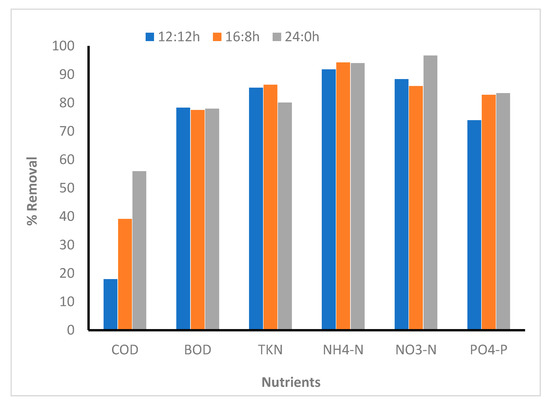
Figure 3.
Comparison between nutrient removal efficiency in different photoperiod regimes (microalga inoculated reactors). 12:12, 16:8, and 24:0 h light:dark regime.
In this study, maximum removal of nutrients was achieved after 30 h of cultivation. After 30 h, the biomass concentration declined rapidly, and nitrogen concentration (NO3 and NH3) increased slightly. However, the concentration of phosphate decreased until the end of the experiment.
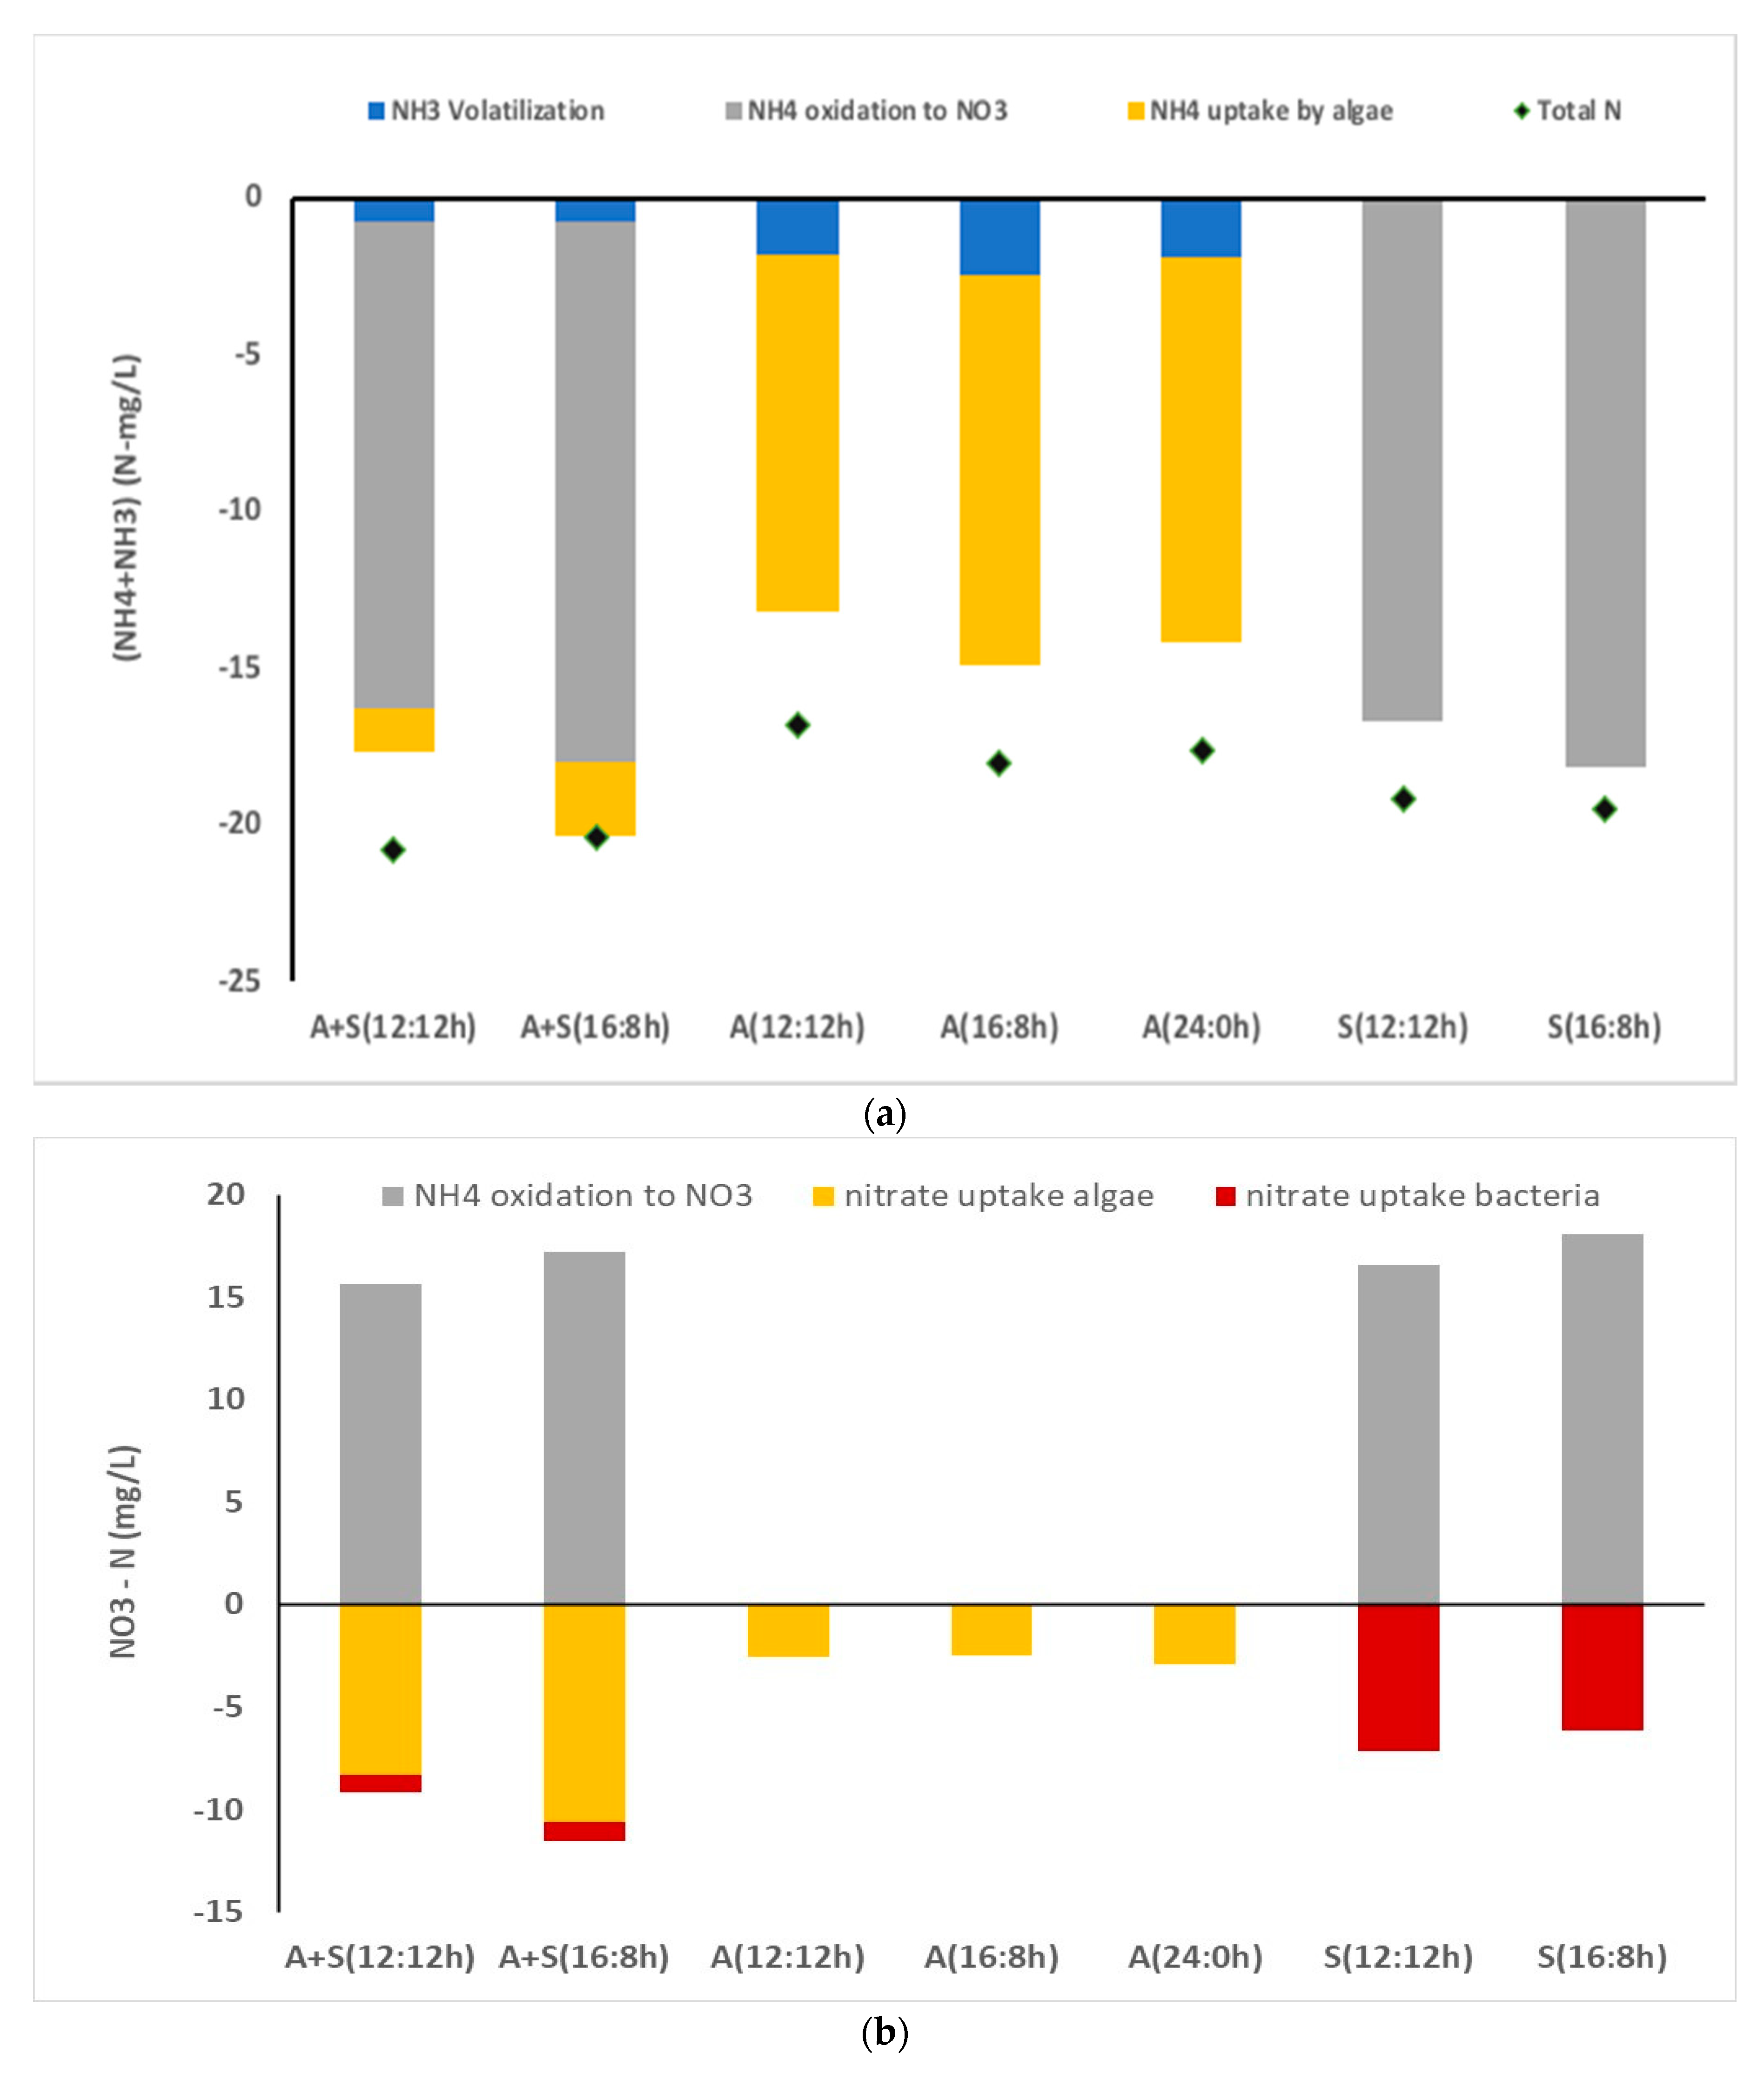
To further understand nitrogen uptake in microalga, kinetic modeling of nitrogen concentration was undertaken (Equations (2)–(6)). Results indicated that 2–3 mg/L of ammonia was volatilized during the course of the study, and the rest of the ammonia (11–12 mg/L) was absorbed by algal cells (13–14 mg NO3 -N/g of algal biomass). Nearly all nitrate nitrogen present in the media was absorbed by algal cells. No significant difference in nitrogen uptake was observed due to change in the light duration (Figure 4a,b). As compared to nitrogen uptake (~14 mg/L), P uptake was almost 1/3 rd of the N uptake (~14 mg/L) (3 mg/L PO4 -P). In our previous study, we observed that this particular strain consumed nearly a similar amount of N and P for growth [11]. Even though there was a little increase in P uptake with an increase in light regime, light and dark cycle could not affect the phosphorus uptake rate by algal cells. There was no difference in specific uptake (mg P/mg algal biomass) among various light regimes. The highest P uptake was observed during initial 12 h. During initial hours, the concentration of P in the media was higher than later period. Hence, diffusion of P inside the algal cell was higher in initial stage than that in later periods. Generally, P uptake is driven by photosynthetic activity as the solar energy is stored in the form of ATP for which additional P uptake is required. Hence, P uptake should be higher in light period as compared to dark period [37]. However, some of the studies showed that some of the algal strains showed luxury P uptake, which was independent to the light and dark phase. Luxury P uptake is driven after P starvation phase [38]. In our study, algal cells were incubated in limited nutrient medium for 2 days before its uses for the real wastewater treatment.
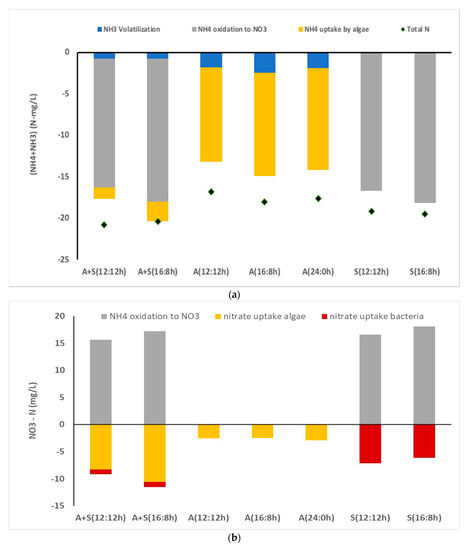
Figure 4.
Distribution and uptake of nitrogen in various reactors (a) NH3 + NH4–nitrogen, (b) nitrate nitrogen. A + S: Microalga + sludge reactor; S: sludge reactor, 12:12 and 16:8 h light–dark regime; A + S: microalga + sludge reactor; S: sludge reactor; A: microalga reactor 12:12, 16:8, and 24:0 h light–dark regime. Total N (experimentally determined values). Other values were come from kinetic modeling. Goodness of fit between simulated and experimental data are shown in Table S1.
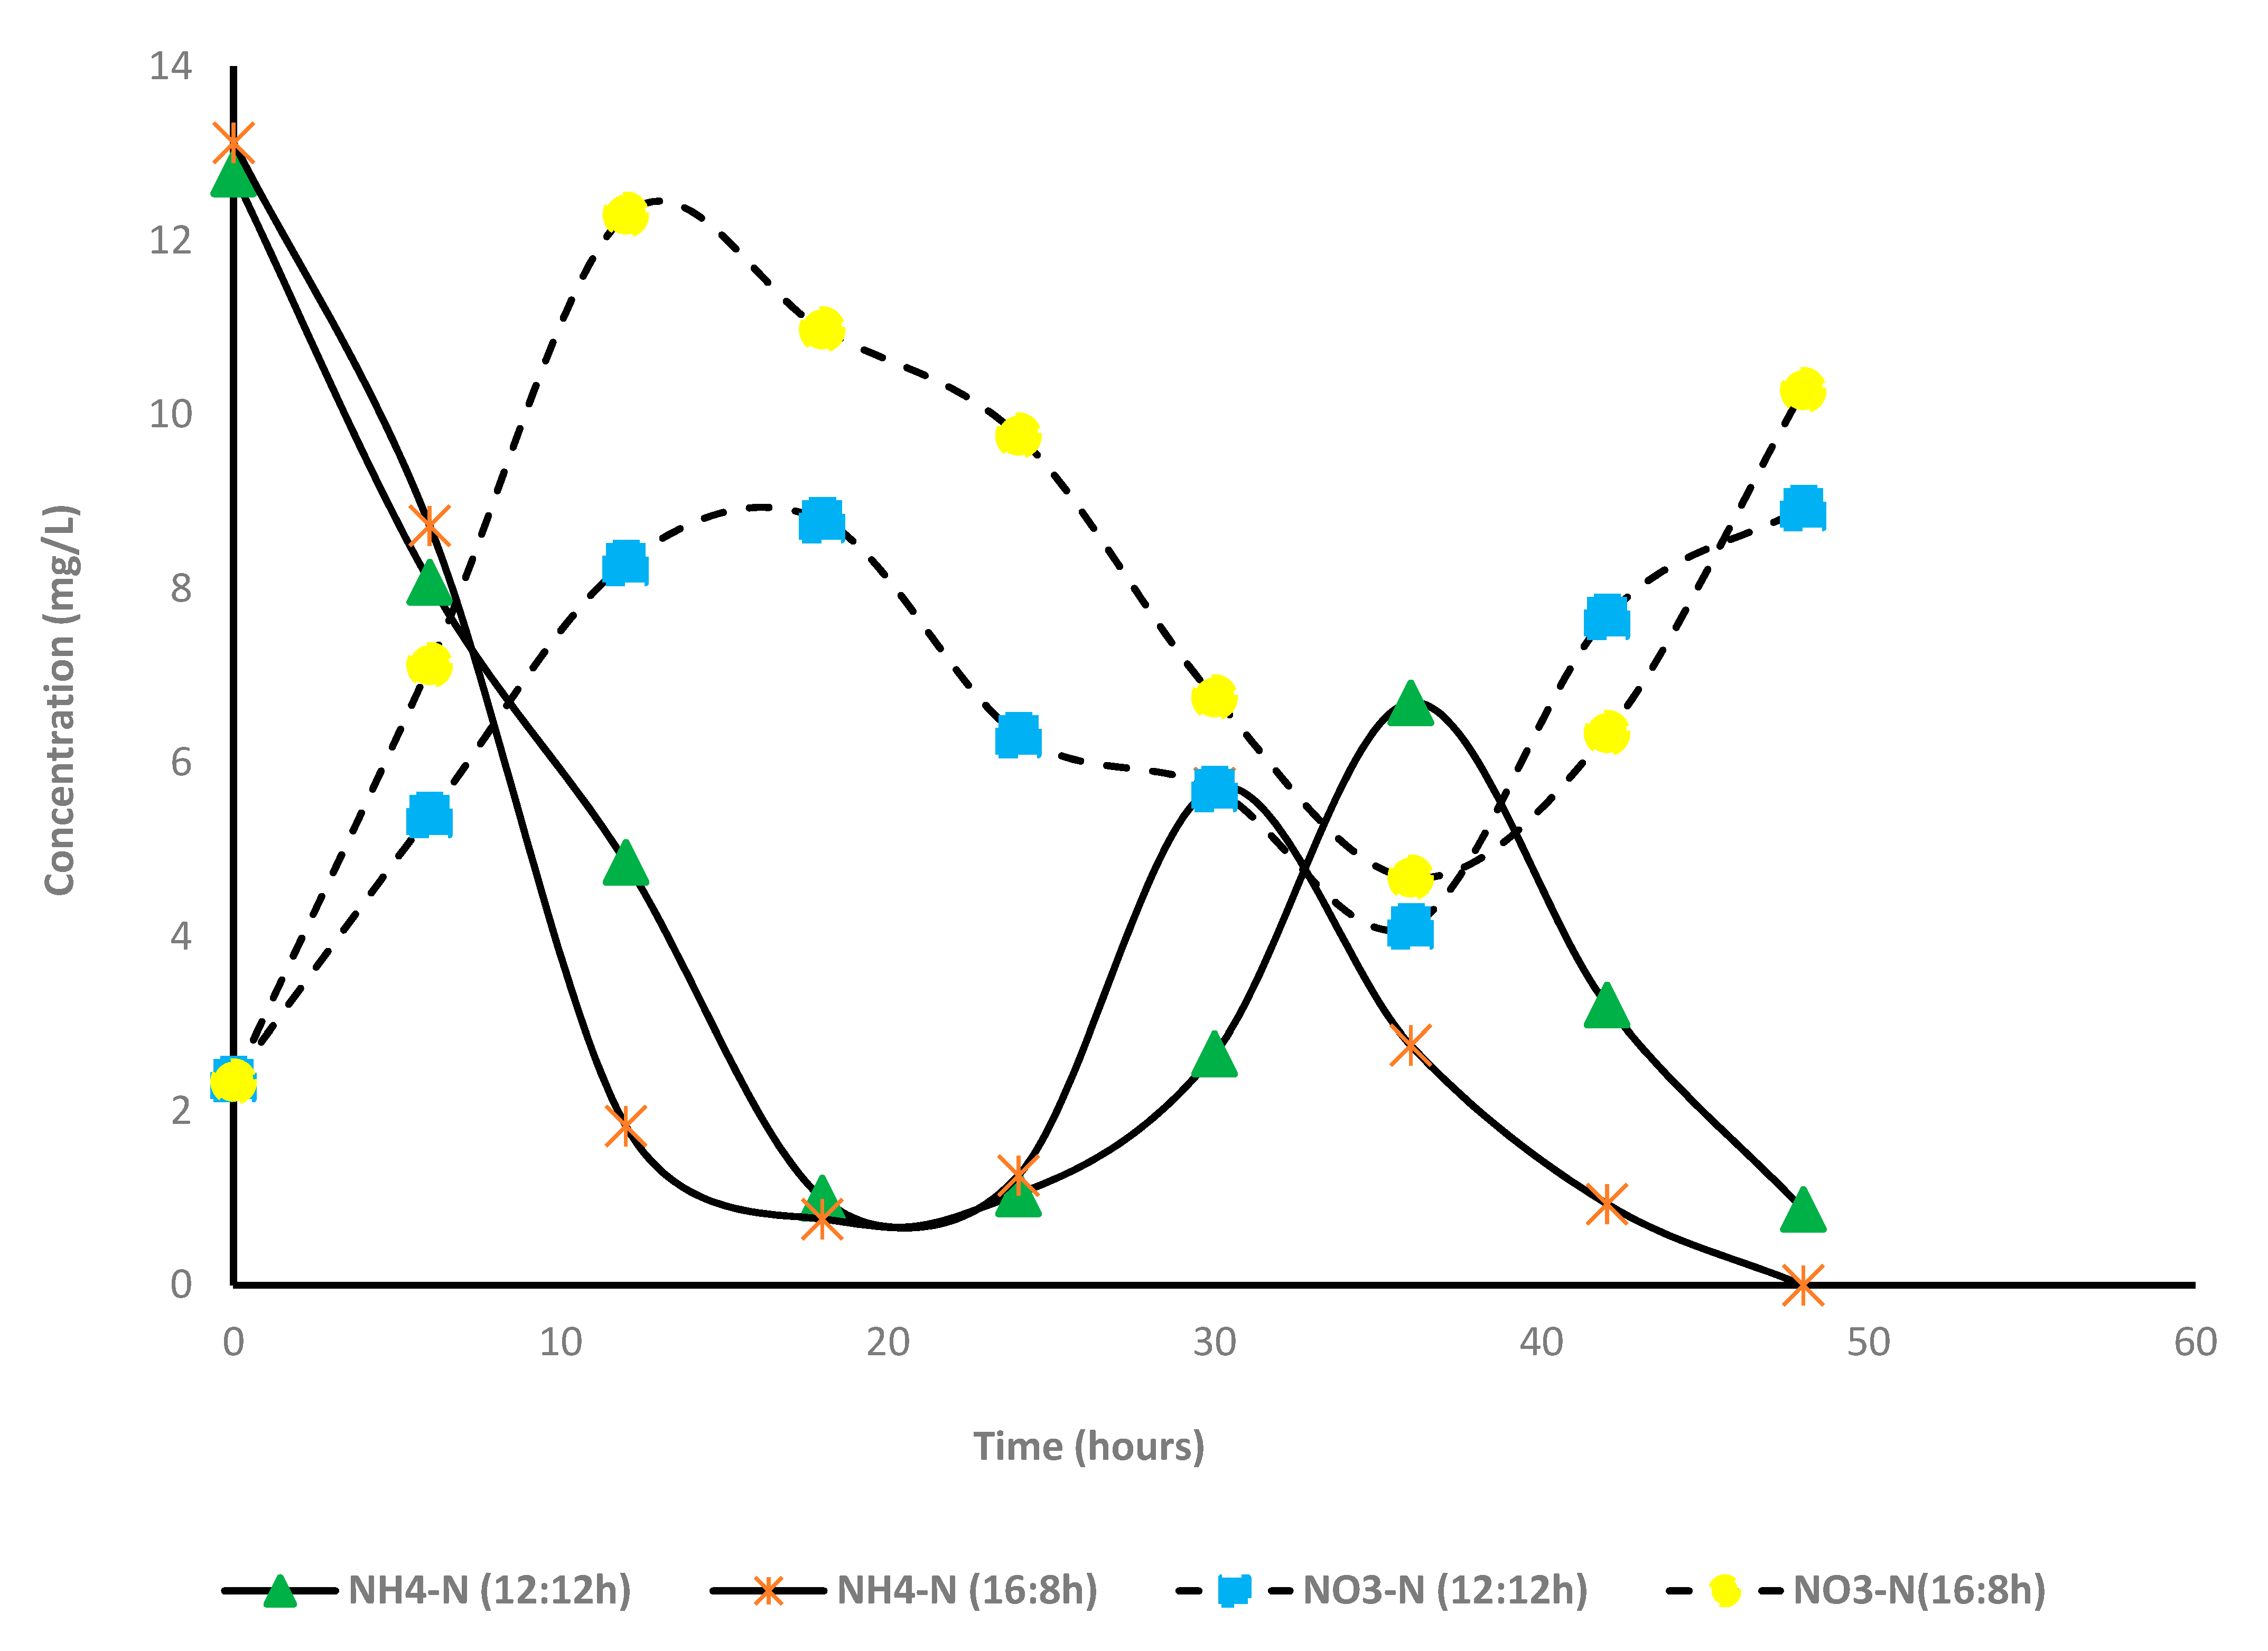
Nitrogen and phosphorus removal (A + S system): Contrary to the microalga-based system, percentage removal of total nitrogen was very low in the A + S system; 19.3% and 6.4% under L:D cycles of 12:12 and 16:8, respectively. In this study, TKN primarily comprised of ammonia (>90%). Unlike other nutrients, time-dependent changes in the concentrations of TKN were not measured. Only the initial and final concentrations of TKN were estimated. After 2 days of cultivation, 100% and 93% of NH4-N were converted to other forms of nitrogen (NO3) under L:D cycles of 16:8 and 12:12. For both the light periods, maximum removal of ammonia was observed within 18 h, and thereafter, the concentration of ammonia started increasing, and it increased until 36 h and then decreased (Figure 5). A similar pattern of ammonia concentration was observed for the 16:8 study. Compared with ammoniacal nitrogen removal, the concentration of nitrate nitrogen increased steadily with decreasing ammonia nitrogen concentration. Hence, most likely, ammoniacal nitrogen was converted to nitrate nitrogen, and a part of ammonia was consumed by the microalga. Conversion of ammonia to nitrate was facilitated by the considerable portion of nitrifiers present in the sludge, which further proliferated in the presence of low BOD and high oxygen concentration (DO concentration in A + S reactor 6–8 mg/L; 12:12 h, 7–8 mg/L 16:8 h). In both the light regimes, the presence of nitrite (NO2−) was not observed, indicating that ammonia to nitrite conversion was the rate limiting step. Simm et al. [39,40] reported that nitrite accumulation did not occur during high DO concentration. Free ammonia may have also inhibited the nitrite to nitrate conversion, although such high free ammonia concentration was not observed in this study.
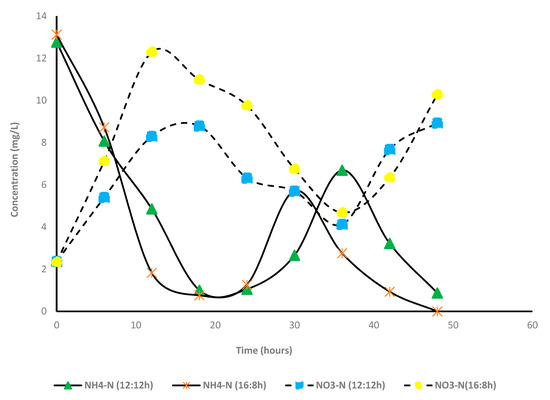
Figure 5.
Variation of concentration of nitrogen species in microalga + sludge inoculated reactor. 12:12 h and 16:8 h light–dark regime.
The rate of nitrate production (mg/L/h) was lower than the ammonia removal rate. Hence, it is likely that a part of the ammonia or nitrate is consumed by microalga. Figure 5 shows a good correlation between the minimum ammonia concentration and the maximum nitrate concentration. The observation thus corroborated that ammonia removal in the system is driven by nitrifiers. In addition, the rate of nitrification was higher in the long photoperiod (16:8) than that of the short photoperiod (12:12). The activity of nitrification was also corroborated by the decrease in alkalinity, which was due to the utilization of H+ ions produced during nitrification.
To understand the nitrogen concentration and delineation of nitrogen distribution, kinetic study was undertaken (model description in Section 2.6). The results showed that most of the ammonia (NH3 + NH4) was oxidized to nitrate by nitrifiers in the A + S and sludge only reactors, and very little ammonia was absorbed by algal cells. In the presence of nitrifiers, the algal cells consume nitrate instead of ammonia. Nitrate nitrogen absorbed by the microalgal cells during the course of the study was 8–9 mg/L (5–6 mg NO3-N/g of microalga, Figure 4). Though nitrogen uptake by microalgal cells appeared to reduce drastically in the presence of nitrifiers, this was not true. In addition, a considerable amount of organic nitrogen present in the media was hydrolyzed to ammonia (NH4 + NH3) during the study period. A mass balance approach of the experimental data revealed that approximately 5–6 mg/L organic nitrogen is converted to ammonia nitrogen during the course of the study in the A + S and the sludge-only reactors. A major source of organic nitrogen was dead cells. Chen et al. [13] also reported that dead cells were the source of ammonia in the media. At the end of the study, organic nitrogen in the media was approximately 6–7 mg/L, whose source was dead cells. Hence, the low nitrogen removal in the A + S, S reactor was attributed to the leaching of organic nitrogen from dead cells. Because the hydrolysis of dead cells was not observed in the stand-alone microalga reactor, microbes present in the sludge inoculum facilitated the hydrolysis of dead cells and facilitated subsequent release of organic nitrogen and ammonia in the media. Kinetic coefficients obtained under different L:D regimes and with or without microalga showed no significant difference in ammonia oxidation or the nitrate nitrogen uptake by microalgal cells (Supplementary Materials, Table S2). Specific ammonia oxidation (SAO), which is the ratio of ammonia oxidation (mg) per gram of sludge per hour, also did not show considerable differences in the A + S and sludge reactors. Increase in the light duration also did not affect the SAO. Compared with SAO, the ammonia uptake by microalga in the stand-alone microalga reactor was one order of magnitude lower in the initial 24 h of the study. However, the estimated SAO (maximum 4 mg NH4/g of sludge/h) was approximately half of the SAO, as reported by Meng et al. [41]. Meng and his coworkers [41] also studied the nutrient uptake in an A + S reactor. They observed a high nitrification activity in their reactor, and SAO was as high as 7.7 mg NH4 oxidized/g of sludge per h. By contrast, Su et al. [42] observed a lower SAO in their A + S reactor than that observed in this study. These changes may be attributed to prehandling of the sludge before its inoculation. Nitrifiers could be proliferated in the activated sludge if the sludge is kept in low BOD wastewater for some time. However, the aforementioned studies did not present details of the incubation period of sludge before its use in the actual study. In the tertiary wastewater treatment in a continuous mode, where BOD is low, the nitrifiers proliferate. Hence, a considerable concentration of nitrifiers is preferred in the inoculated sludge, if it is used in a batch study to estimate the operating parameters for continuous reactors. Sepehri et al. [43] also conducted wastewater treatment study with microalga and nitrifying sludge. They also observed low nitrogen removal efficiency in the presence of nitrifying bacteria. As compared to the present study, nitrogen removal reported by Sepehri et al. [43] was low (7–38%). Even a monoculture of Chlorella vulgaries could not remove a considerable portion of the nitrogen present in the media. One of the reasons behind it was a high nitrogen loading and low biomass concentration could not achieve an appreciable nitrogen removal. However, if one compares the nitrogen removal rate per unit of biomass, the nitrogen removal was similar. In our study, we observed around 0.011 mg–N/mg microalga removal, whereas Sepehri et al. [43] reported around 0.007 mg–N/mg microalga removal (taking 0.3 g/L microalga concentration). A higher uptake rate in our study most likely because of a low dose of ammonia which is toxic in higher concentration and the effects of unknown constituents in real wastewater. Rani et al. [11] observed a lower ammonia uptake in their study with synthetic wastewater using the same microalgal strain.
In the microalga and A + S reactor, pH of wastewater seldom increased to more than 9. Hence, it is unlikely that ammonia volatilization would be a significant part of the total ammonia. This can also be concluded from the kinetic study conducted in this study as well as from the literature. Valero and Mara [44] observed that even when the surface areas of the waste stabilization ponds were large, the ammonia volatilization contributed no more than 3% of total ammonia mass balance. Compared to ammonia uptake, nitrate uptake is an energy intensive process. Conversion of nitrate to ammonia required an additional ATP and NaDPH2 for its reduction.
In the A + S culture, phosphorus (PO4-P) removal efficiencies for the 12:12 and 16:8 L:D cycles were 81% and 83%, respectively (Figure 6). Contrary to the effluent nitrogen concentration, the effluent phosphorus concentration achieved was as per the EU legislation (concentration of 1–2 mg/L; [45]). Most of the phosphorus (>50%) was removed within 12 h of the study. Thereafter, the P removal rate decreased, and within 48 h, the effluent P concentration decreased below 2 mg/L. Under the 16:8 L:D cycle, the culture showed slightly quicker removal of phosphorus than that in the 12:12 cycle. Hence, the photoperiod slightly affected phosphorus removal. A study indicated that phosphorus removal is improved by increasing the duration of light regimes [33]. Phosphorus removal in this study was comparable to the PO4-P removal presented in the literature; however, in this study, the same removal efficiency was achieved in a shorter duration (48 h) [33,34,35]. Goncalves et al. [33] studied nutrient removal under different light intensities and by using four different L:D regimes and different strains of microalga. In the aforementioned studies, C. vulgaris showed the highest P removal of 2.67 mg/L/d under the highest light intensity (180 µmol photon/m2/s) and a long photoperiod regime (24:0). However, in this study, higher P removal (5 mg/L/d) was observed in both the photoperiod regimes (12:12 and 16:8) after 48 h of cultivation. However, enhanced uptake of P was attributed to the combined uptake of microalga and sludge present in media (comparison between individual uptake of P was given later). Hence, in this study, considerable P uptake was observed, and as per the finding from our previous study, the C. sorokiniana strain possesses this capability [11].

Figure 6.
Comparison between nutrient removal efficiency in different photoperiod regimes, A + S: microalga + sludge reactor. S: sludge reactor, 12:12 h and 16:8 h light–dark regime.
Increase in light period could not affect the phosphorus removal efficiency in the A + S and sludge reactors. However, increase in the photoperiod regime increased the phosphorus removal efficiency in the microalga system. Increase in light regime certainly improved the photosynthesis in the microalga reactor and also increased ATP production, which required P uptake. Arcila and Buitron [32] observed that P uptake in the microalga sludge-based wastewater treatment reached a maximum for a particular irradiance level. Mohamed et al. [46] reported that sufficient NO3 or ammonia concentration are necessary for uptake of phosphate by P accumulators. They observed a particular COD/ NH4/HCO3 as an optimal condition for the enhanced P removal. Low ammonia or low COD affects the P removal. However, in our study, we observed little increase in ammonia oxidation in higher light duration (by 2 mg/L). Similarly, COD removal was changed very little with an increase in light period. Hence, the change in light duration could not provide any apparent change in P uptake in the A + S or S reactor. The values of pH for the microalga-based and A + S reactors were also estimated, and possibly, phosphate was not removed because of precipitation. Precipitation of phosphate as calcium phosphate was predominant at a pH of 10 or more [47]. P precipitation can also occur in neutral pH when concentrations of P, Ca, or Mg were high. Such high concentrations generally occurred in effluents of anaerobically digested sludge. Some of the studies employed chemical equilibrium calculations for estimating phosphorus precipitation potential under various conditions. Close examination of data revealed that P removal through precipitation does not significantly contribute to the total P mass balance in our study [48]. To understand the phosphorus precipitation potential, Visual MINTEQ, an equilibrium chemistry calculation software developed by Prof John Gustafsson, was used. The software has been used previously by the present author for simulating arsenic speciation in wetland [49]. Visual MINTEQ simulation depicted that hydroxyapatite and alpha and beta calcium phosphate were the three potential precipitated form of P during the prevalent experimental condition. However, precipitation could only remove at most 1 mg/L PO4−3 from wastewater (initial phosphate concentration: 12–13 mg/L).
COD and BOD removal (microalga-based system): COD and BOD removal was found to vary with varying L:D regimes; COD removal under continuous illumination (24:0) showed the highest removal compared with the 12:12 and 16:8 L:D regimes (Figure 3). By increasing the light period, COD removal increased from 18% to 56%; these values are comparable to those reported in the literature [50,51]. However, it could not be deduced how the increase in photoperiod increased the COD removal efficiency. Several studies have shown that some of the algal species produce reactive oxygen species, which may have oxidized the chemicals and thus removed COD [52]. Halfhide et al. [53] reported 25% COD removal (Chlorella and Scenedesmus) for the microalga-assisted wastewater treatment, which is comparable to the data shown in this study. Effluent COD concentration achieved in this study satisfied most of the discharge guidelines provided by various regulatory organizations [54,55]. Contrary to the COD removal rates, BOD removal remained approximately the same for all the photoperiod regimes. The used algal strain showed mixotrophic growth in the presence of glucose (data not shown). Hence, readily biodegradable organics assimilated by the algal strain might remove a part of BOD present in wastewater.
COD and BOD removal (A + S system): Percentage removal rates for COD were 67% and 58%, and those for BOD were 89% and 65% under 12:12 and 16:8 L:D cycles, respectively. BOD5 was calculated on the first and last day of the experiment. After two days of cultivation, better removal of COD and BOD was observed in the 12:12 L:D regime (Figure 6). Different photoperiod regimes significantly affected the organic carbon removal. Uptake of organic matters by bacteria present in the sludge inoculum was the major driving force for COD and BOD removal in the dark phase. A similar trend was observed in a study by Lee and Lee [25], where a prolonged dark period improved COD removal.
Comparison of the removal patterns in the microalga, sludge, and A + S reactors showed that the COD removal is mainly due to the sludge, as the A + S and sludge reactors showed similar removal patterns, whereas in the microalga reactor, the lowest COD removal was observed (Figure 3 and Figure 6). Irrespective of the dark and light cycles, the concentration of COD in the A + S and sludge reactors decreased with time, as the removal was driven by the heterotrophic growth of bacteria present in the sludge. The percentage removal of COD was lower than that reported by other researchers [42,56,57]. Makut and coworkers [56] co-cultured the C. sorokinina strain with a known bacterium Klebsiella pneumoniae and Acinetobacter calcoacetius in artificial wastewater and raw dairy wastewater. The highest removal of COD (90%) was observed in raw dairy wastewater, whereas 82% COD removal was observed in the artificial wastewater, which is significantly higher than that observed in this study (A + S: 58%). The COD removal efficiency of microalga Auxenochlorella protothecoides-treated concentrated municipal wastewater was found to be 79% after 8 days, which is also higher than what was observed in this study [58].
Higher COD removal was attributed to the synergistic relationship between the strains of microalga and bacteria. Therefore, strain selection is also a crucial factor for ensuring a synergistic relationship between microalga and sludge. In addition to strain selection, different sludge concentrations also affect the COD removal rate. In a study, the highest COD removal was observed with an A + S inoculum ratio of 3:1 and 1:1 [14]. In this study, the coculturing of microalga and sludge did not provide any additional advantage for removal of N and P. However, in some studies, a synergistic relationship has been observed between microalga and bacteria. For example, C. vulgaris and Bacillus licheniformis (1:3) demonstrated superior performance in removing COD (87%) compared with what was observed in case of a mixture of (1:3) Microcystis aeruginosa and B. licheniformis (66%) [15]. In the present study, microalga–bacteria ratio (3.5:1) was opposite to the observation reported by Ji et al. [15]; however, the COD removal percentage was similar, and the removal was achieved within a short duration (48 h).
In the A + S and sludge-based reactor, the BOD removal was approximately the same, whereas in the microalga-based reactor, the BOD removal rate was higher than the corresponding COD removal rate. BOD removal efficiencies were 65%, 77%, and 88% for A + S, microalga-based, and sludge reactors, respectively, for the L:D regime of 16:8. Similar to COD removal, the highest BOD removal rate was observed in the stand-alone sludge reactor (Figure 3 and Figure 6). Effluent BOD was <10 mg/L in all the reactor, which is as per the discharge standards. Average BOD removal was 13–17 mg/L/d, which is similar to the BOD removal attained by Tchinda et al. [59].
3.3. Effect of Different Photoperiod Regimes and Sludge Inoculum on Pathogen Inactivation
Pathogen removal (microalga-based system): After 48 h, in the microalga-based system, the HPC in the effluent was reduced by 5.1 log unit under various light regimes, whereas in the control, the HPC decreased by 2.5 log unit (Figure 7). Increase in light duration did not affect the die-off of heterotrophic bacteria; however, the incorporation of microalga increased the die-off of heterotrophic bacteria. Hence, die-off was probably because of competition for nutrients and other plausible mechanisms associated with the predation of microalga over bacteria (antibacterial compounds and toxins secreted by microalga), as reported in the literature. In addition, the die-off of pathogens, which comprise 1/10th of the original population of HPC, slightly reduced the HPC (Figure 7). Using kinetic model, several research groups [4,13] have shown that the L:D regime does not affect the contribution of individual components to die-off of pathogens.
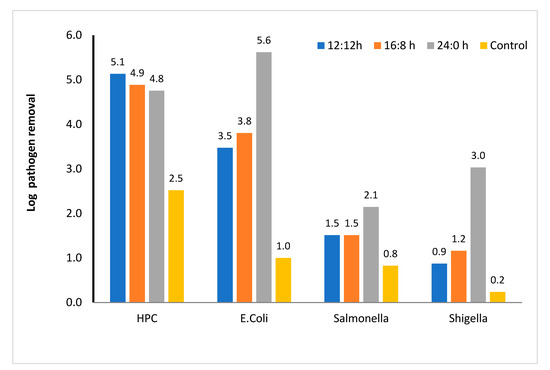
Figure 7.
Log removal of various enteric pathogens and heterotrophic plate count in microalga-based reactor. 12:12, 16:8, and 24:0 h light–dark regime, number above the column showed actual log removal of a particular pathogen.
Among the pathogens considered in this study, the die-off rate of E. coli was the highest, and the maximum die-off rate was observed in the continuous light regime. However, light regime did not affect the die-off rate in the reactors contain no microalga. Hence, the die-off process is microalga-mediated and is increased most likely by the oxygenation process and limitation of food in the presence of microalga. In addition to the oxygenation process, the alkaline pH (~9) also affected the die-off of E. coli. Contrary to HPC, in the continuous light regime, the E. coli die-off rate increased by two order magnitude compared with other light regimes (Figure 7). Other studies have also shown that E. coli die-off is the highest among all the studied pathogens [4,60]. However, the die-off rate constant estimated for E. coli in this study was comparable to that reported by Liu et al. [60] and Fallowfield et al. [61]. These studies also envisaged that high pH and production of reactive oxygen species enhanced the die-off of E. coli.
The die-off rate of Salmonella was the lowest among all the pathogens studied in this study. The log reduction after 48 h was within 1.5–2 log unit depending on the light regimes studied. Reduction of pathogens in the control was negligible. Hence, light-mediated die-off, which is one of the predominant factors for pathogen die-off, was not effective for Salmonella. Some of the researchers have also reported that Salmonella is resistant to a wide range of pH, DO, and temperature. Hence, Salmonella is used as the indicator of the biosolid disinfection efficiency [3]. Wu et al. [62] reported ~4 log unit removal in the wetland-mediated treatment system. Similarly, the die-off of Shigella was also microalga-mediated. In the continuous light regime, the removal was 3 log units, which is more than 2 log units higher than that of other light regimes.
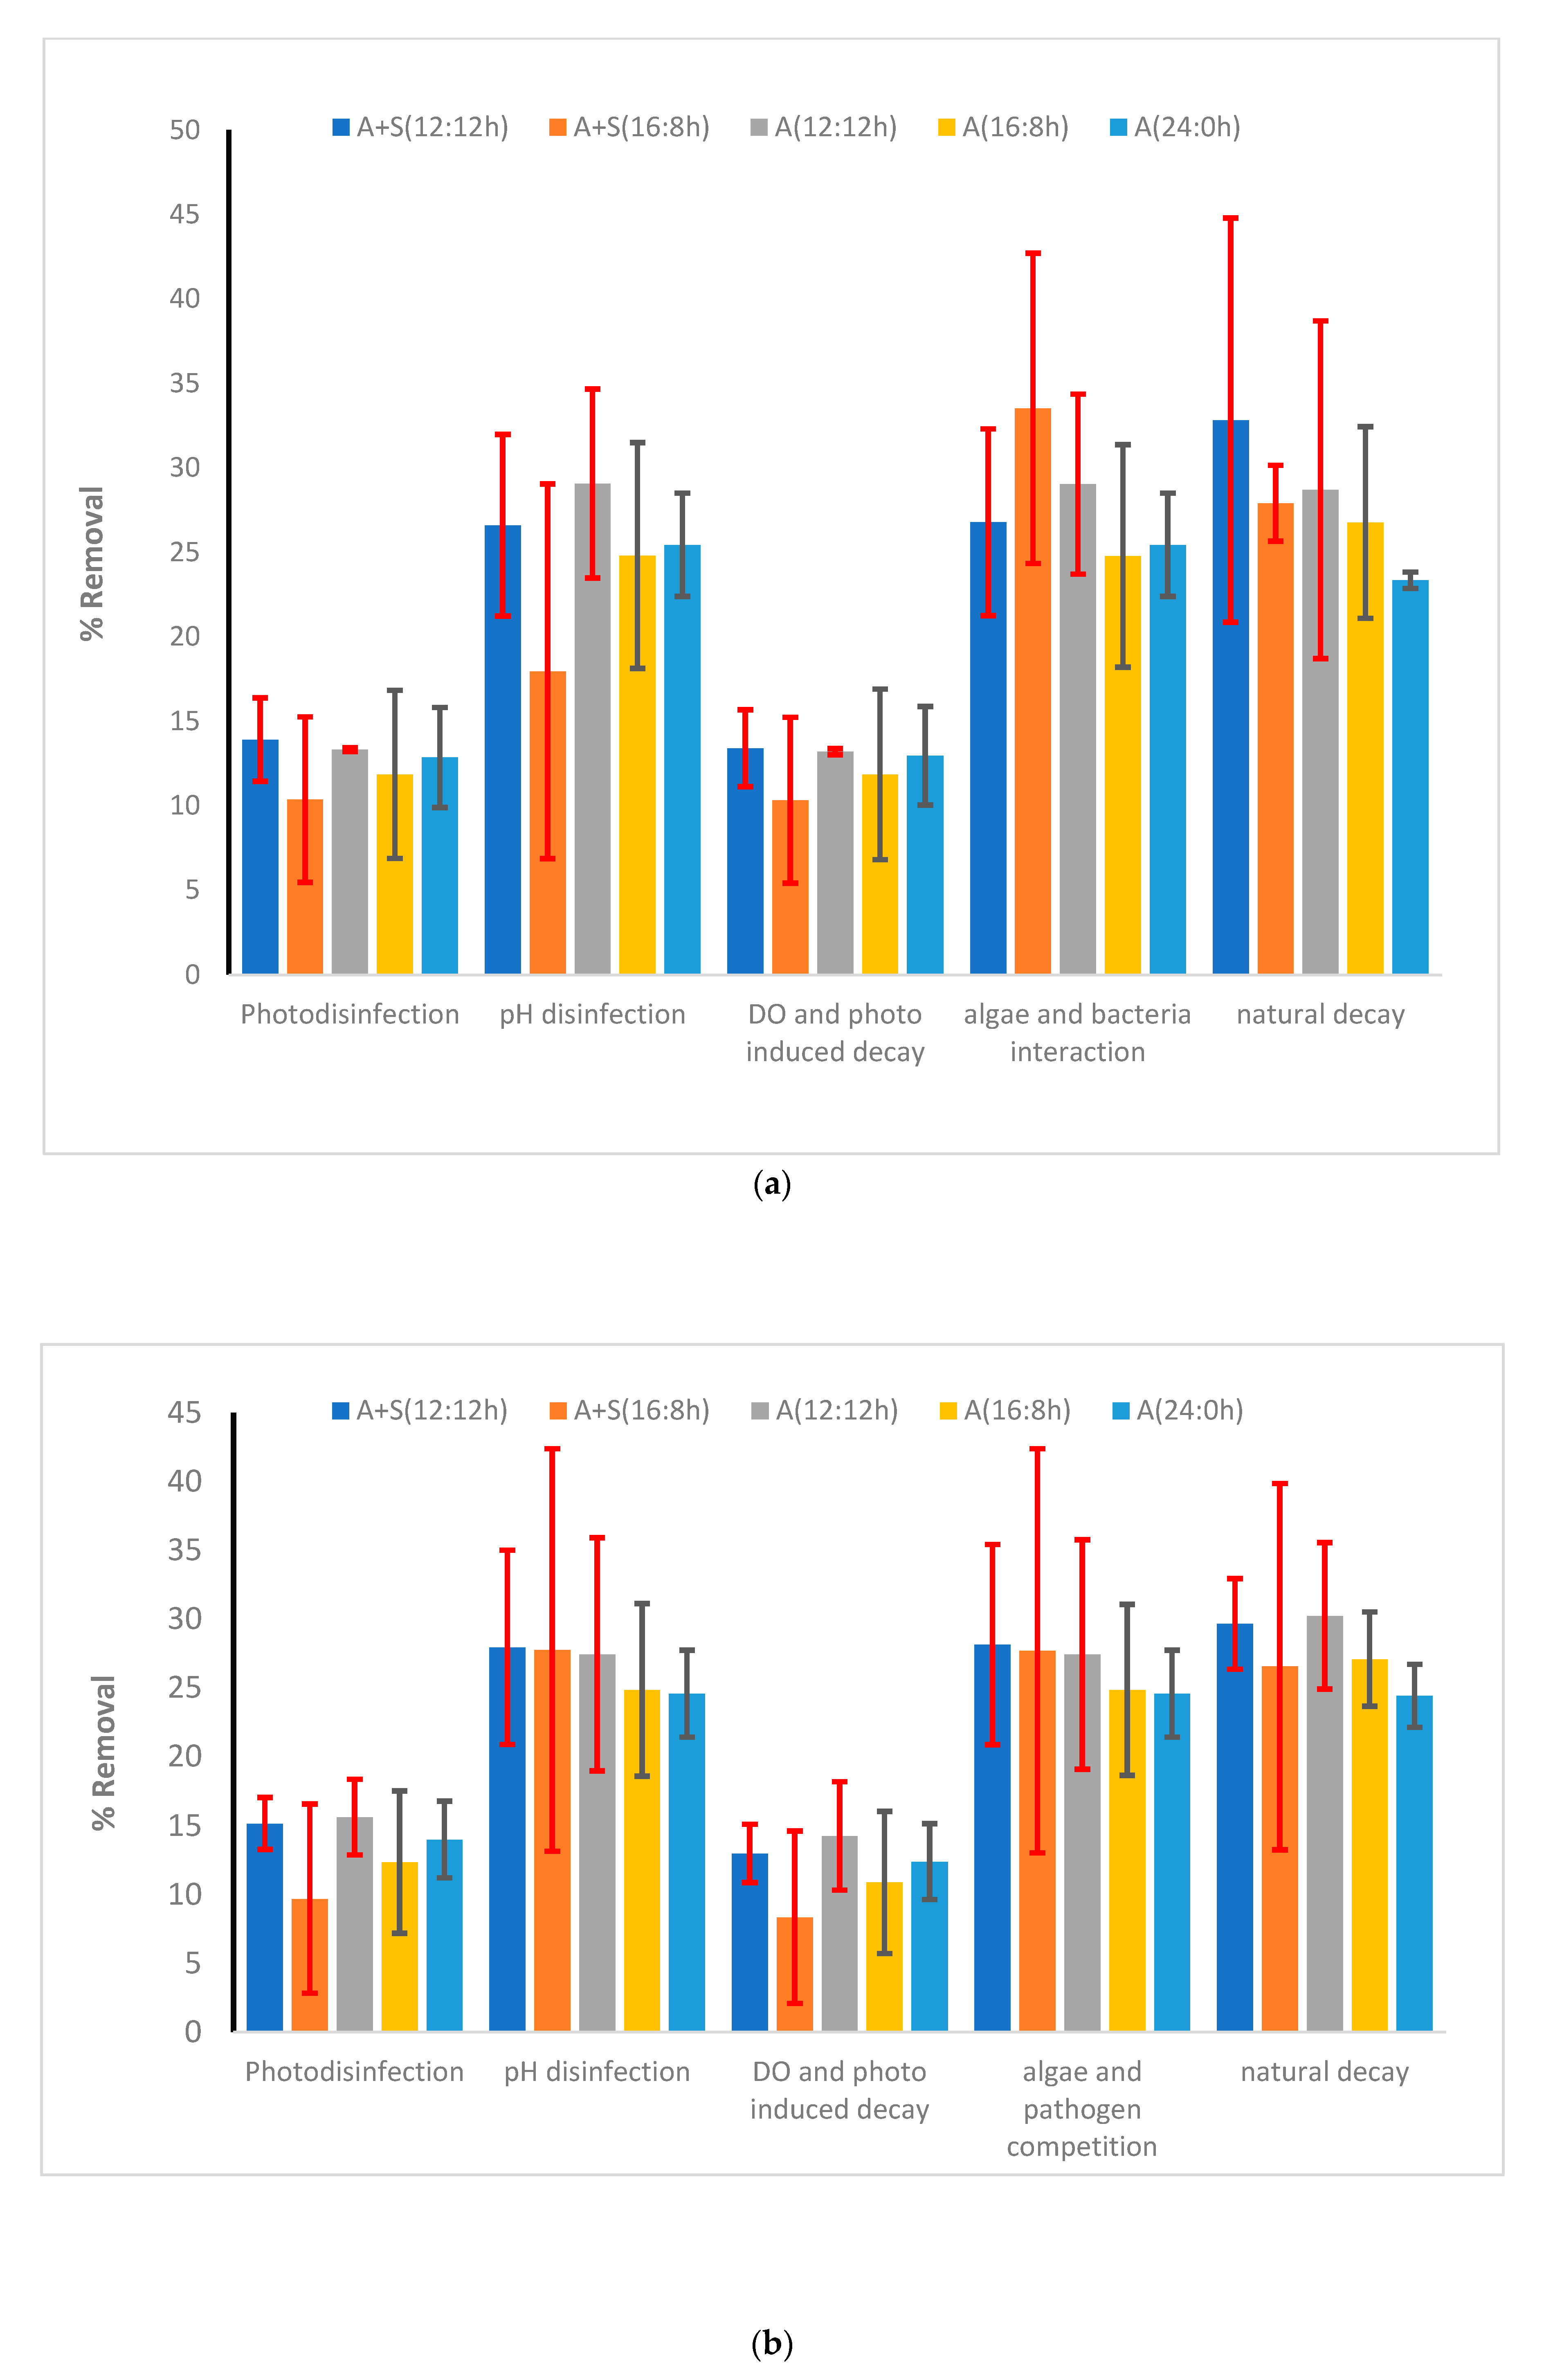
To understand other aspects and factors that affect the die-off of pathogens, a kinetic model was developed (Equation (7)). Among various factors that were considered for die-off in this study, in the microalga-based reactor, the major factors for die-off of E. coli were related to natural decay followed by microalga–pathogen interaction and pH changes (each contributed approximately 30% of the total die-off). The rest of the die-off was due to the photoinhibition, radicals produced from light, and high DO concentration. Increase in the light period did not affect the relative contribution of each of the aforementioned factors (Figure 8a,b and Supplementary Materials Figure S4). In the case of Salmonella, contributions of the aforementioned factors were also the most significant. The relative contribution of natural die-off of Salmonella was also higher than that of E. coli. Similar results were observed for Shigella, for which natural decay was the major contributor of die-off. Microalga–E. coli competition was severe for E. coli die-off. Kinetic coefficients obtained from the study are presented in the Supporting Information (Supplementary Materials, Table S3). According to the available literature on pathogen die-off, the E. coli die-off rate is higher than that of other pathogens [63,64]. According to Ouli et al. [64], the major contribution of E. coli die-off was due to natural decay followed by photo disinfection and pH-induced die-off. The trend reported by Ouli et al. [64] matched well with our study, where it was observed that pH and natural decay were the main contributors for E. coli die-off (Figure 8b). Another major disinfection pathway was the microalga–pathogen competition observed in our study. However, Ouli and coworkers did not consider such interaction. Park et al. [65] also investigated E. coli die-off in the light and dark mesocosm. Their estimated die-off rate was much higher even in dark regime as compared to the present study. For Salmonella and Shigella, the contribution of pH-induced die-off and microalga–pathogen interaction was much lower than their contribution in the case of E. coli die-off. Natural decay was the primary contributor (>50% contribution) for the die-off of Shigella and Salmonella. Contribution of photoinhibition and reactive oxygen species on the die-off of Shigella was very low (<10% of the total die-off, Supplementary Materials, Figure S4b).
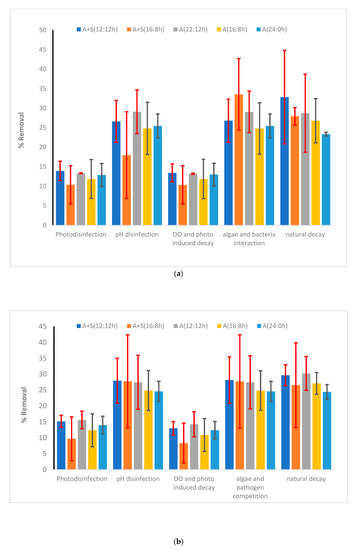
Figure 8.
Contribution of various factors in the removal of (a) heterotrophic plate count (HPC) and (b) E. coli. Vertical bars show the error bars. Vertical columns show the average value of each contribution over 48 h of the experiment. A + S: Microalga + sludge reactor, A: microalga reactor, S: sludge reactor 12:12 h, 16:8 h and 24:0 h are the various light:dark regimes. Error bars showed the standard deviation of temporal changes in the kinetic coefficients.
Pathogen removal (A + S system): pathogen removal varied for different photoperiod regimes and cocultures of the microalga and bacterial cells. Incorporating activated sludge for providing sufficient bacterial population in the A + S reactor increased the concentration of HPC and E. coli by one order of magnitude. However, the population of Shigella and Salmonella increased by three and two orders of magnitude, respectively.
The removal of all microorganisms was lower than that in the microalga reactor. In the A + S system, HPC reduced by 2.3–3.7 log units depending on the light regime, which was lower than 2 log units than that of the microalga reactor (Figure 7 and Figure 9). Removal of Shigella and Salmonella was 1.8–2.6 log units depending on the light regime. Kinetic modeling showed that the major contributors for pathogen die-off were pH-induced stress, microalga–pathogen competition, and natural decay. In the case of E. coli die-off, the addition of sludge did not affect the individual contribution of various components to die-off of pathogens considered in the kinetic model. However, in the case of Salmonella and Shigella, the addition of sludge enhanced the effect of pH and pathogen–microbe competition. However, compared with the stand-alone microalga reactor, these enhancements were not statistically significant (Figure 8b and Supplementary Materials Figure S2).
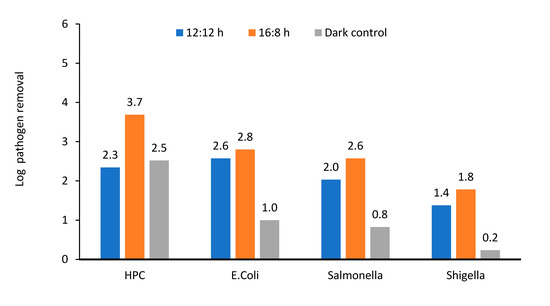
Figure 9.
Log removal of various enteric pathogens and heterotrophic plate count in microalga + sludge inoculated reactor. 12:12 and 16:8 h light–dark regime, number above the column showed actual log removal of a particular pathogen.
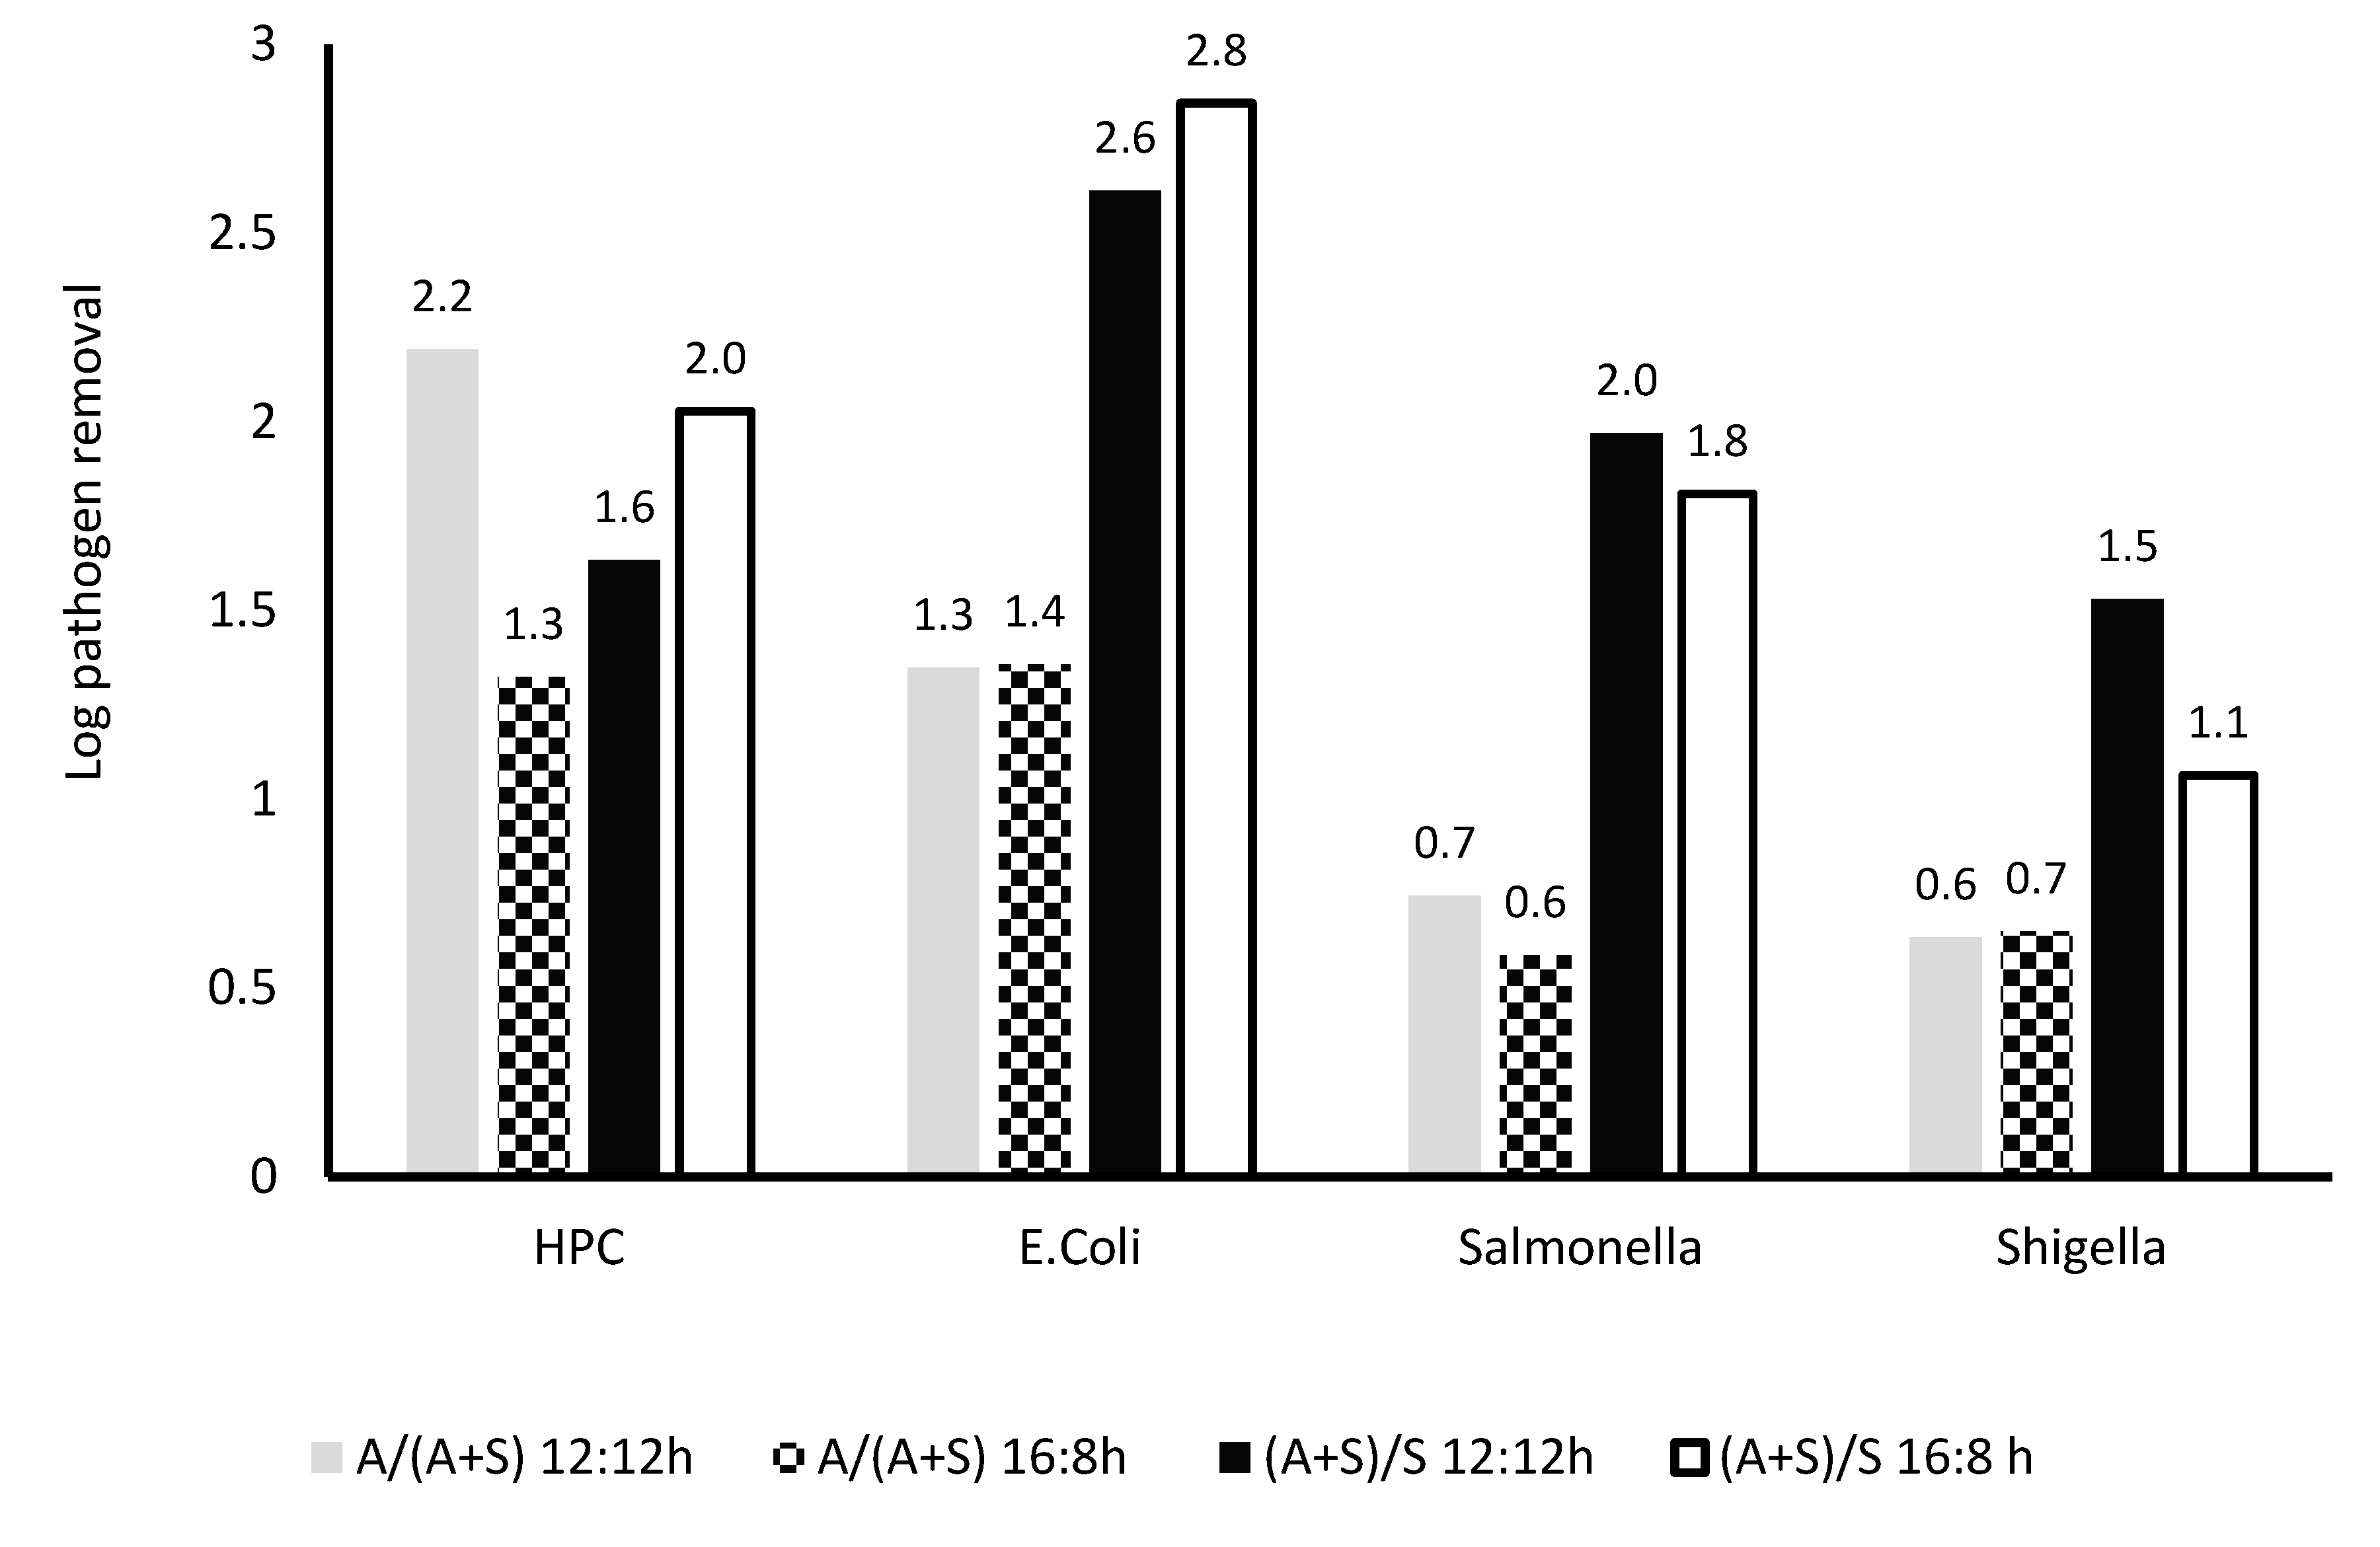
The microalga-based reactor was compared with the A + S reactor, and the A + S reactor was compared with the sludge reactor. For the 16:8 L:D regime, the reduction in HPC and E. coli was lower in the A + S reactor than that in the microalga reactor. In the microalga reactor, the removal was 1.3–2.2 times higher than that in the A + S reactor. However, removal of Salmonella and Shigella was lower in the algal reactor than that in the A + S reactor (Figure 10). Duration of light could not impact the removal of pathogen considerably, except the removal of HPC. Removals of all pathogens were lower in the A + S reactor than that of the sludge reactor. Hence, it can be deduced that the introduction of microalga enhances the removal of all pathogens, and this effect was found to be most prominent in the comparison of the sludge reactor with the A + S reactor (Figure 10). For HPC, significant difference was observed in the kinetic coefficient obtained for any factor, such as pH-induced die-off, between the microalga-based reactor and the A + S reactor. For E. coli die-off, the difference in the kinetic coefficient related to the pH-induced die-off between the A + S reactor and microalga-based reactor was also statistically significant. Further analysis revealed that for Salmonella, the difference in the pH-induced die-off rate between the two reactors was also not statistically significant. For Shigella die-off, differences in the microbe–pathogen interaction, pH-induced stress, and natural die-off were statistically significant between the two reactors (A + S and microalga-based).

Figure 10.
Comparison of removal of various microbes in A + S, S, and A reactor at different light regime. A/(A + S): ratio of removal in A and A + S system, A/(A + S): ratio of removal in A and A + S system. 12:12 and 16:8 h light–dark regime, number above the column showed actual log removal of a particular pathogen.
4. Conclusions
This study showed that the monoculture of microalga provides a rapid >80% removal of nitrogen and phosphorus from municipal wastewater. Increase in the light period improved the nutrient removal and increased the biomass production by 100 mg/L/day. In the A + S inoculated reactor, the removal efficiency of COD and BOD was improved by 10%. However, the removal efficiency of nitrogen decreased drastically because of enhanced activity of nitrifiers and hydrolysis of dead cells through microbial hydrolysis, which releases soluble organic nitrogen and ammonia. Pathogen removal was mostly microalga- and light-dependent. Most pathogenic strains, except Shigella and Salmonella, showed enhanced removal in the microalga-based reactor. The natural die-off of Shigella and Salmonella was the primary inactivation mechanism obtained from the kinetic study. The kinetic study of nitrogen removal revealed that organic nitrogen hydrolysis increased the ammoniacal nitrogen concentration in the A + S reactors. Kinetic models revealed that the addition of sludge increased the nitrification, and uptake of nitrogen by microalga was shifted from ammonia in the microalga reactor to nitrate in the A + S reactors.
Supplementary Materials
The following are available online at https://www.mdpi.com/article/10.3390/su13179554/s1, Table S1: Goodness of fit of nitrogen data with the simulated results using kinetic models, Table S2. Kinetic coefficients obtained from kinetic study of nitrogen transformation in various reactors. A: microalga, S: sludge, 12:12, 16:8, 24:0: light: dark regime, Table S3. Kinetic coefficients obtained for pathogen inactivation, Figure S1. Standard curve used for estimating microalga and bacterial biomass present in a mixture, Figure S2. Nitrogen removal in microalga-based reactor (a) nitrate–N removal, (b) ammonia–N removal, Figure S3. Phosphate removal in (a) microalga-based reactor and (b) microalga + sludge reactor, Figure S4. Contribution of various factors in the removal of (a) salmonella and (b) shigella. Vertical bars show the error bars. Vertical columns show the average value of each contribution over 48 h of the experiment. A + S: microalga + sludge reactor, A: microalga reactor, S: sludge reactor 12:12, 16:8, 24:0 h are the various light: dark regimes. Error bars showed the standard deviation of temporal changes in the kinetic coefficients.
Author Contributions
Conceptualization: R.C. and S.R., Data curation: S.R. and R.C. Formal analysis: S.R., R.C. and L.N. Funding acquisition: R.C. and L.N., Investigation: S.R. and R.C., Methodology: S.R., R.C. and W.T., Project Administration: R.C.; Resources: R.C. and W.T.; Software: R.C. Supervision: R.C., Validation: R.C., S.R., L.N. and W.T.; Visualization: S.R., R.C., L.N. and W.T., Writing original draft: S.R.; Writing-reviewing and editing: R.C., L.N. and W.T. All authors have read and agreed to the published version of the manuscript.
Funding
The research work is a collaborative effort of the University of British Columbia, Canada. and Indian Institute of Technology, Roorkee, India. (Funding agency: Department of Biotechnology (DBT-893-CED)), Govt. of India. A part of the funding was also+ acquired from the Department of Science and Technology, Govt. of India (DST–1589–CED). Swati Rani received fellowship for her PhD degree from the Ministry of Human Resources and Development (MHRD), Govt. of India. The research was also funded partially by INTER-EXCELLENCE project, grant number LTAIN19139 Czech Republic, and the institutional long-term research plan of the Institute of Botany of Czech Academy of Sciences, RVO 67985939.
Institutional Review Board Statement
Not applicable.
Informed Consent Statement
Not applicable.
Data Availability Statement
Not applicable.
Conflicts of Interest
The authors declare no conflict of interest.
References
- Clark, T.; Stephenson, T.; Pearce, P.A. Phosphorus removal by chemical precipitation in a biological aerated filter. Water Res. 1997, 31, 2557–2563. [Google Scholar] [CrossRef]
- Bunce, J.T.; Ndam, E.; Ofiteru, I.D.; Moore, A.; Graham, D.W. A review of phosphorus removal technologies and their applicability to small-scale domestic wastewater treatment systems. Front. Environ. Sci. 2018, 6, 8. [Google Scholar] [CrossRef] [Green Version]
- Al-Gheethi, A.A.; Efaq, A.N.; Bala, J.D.; Norli, I.; Abdel-Monem, M.O.; Kadir, M.A. Removal of pathogenic bacteria from sewage-treated effluent and biosolids for agricultural purposes. Appl. Water Sci. 2018, 8, 74. [Google Scholar] [CrossRef] [Green Version]
- Delanka-Pedige, H.M.; Munasinghe-Arachchige, S.P.; Cornelius, J.; Henkanatte-Gedera, S.M.; Tchinda, D.; Zhang, Y.; Nirmalakhandan, N. Pathogen reduction in an algal-based wastewater treatment system employing Galdieria sulphuraria. Algal Res. 2019, 39, 101423. [Google Scholar] [CrossRef]
- Dahiya, S.; Chowdhury, R.; Tao, W.; Kumar, P. Biomass and lipid productivity by two algal strains of Chlorella sorokiniana grown in hydrolysate of water hyacinth. Energies 2021, 14, 1411. [Google Scholar] [CrossRef]
- Cheng, X.; Delanka-Pedige, H.M.; Munasinghe-Arachchige, S.P.; Abeysiriwardana-Arachchige, I.S.; Smith, G.B.; Nirmalakhandan, N.; Zhang, Y. Removal of antibiotic resistance genes in an algal-based wastewater treatment system employing Galdieria sulphuraria: A comparative study. Sci. Total Environ. 2020, 711, 134435. [Google Scholar] [CrossRef]
- Wang, Q.; Shen, Q.; Wang, J.; Zhang, Y.; Zhang, Z.; Lei, Z.; Shimizu, K.; Lee, D.J. Fast cultivation and harvesting of oil-producing microalgae Ankistrodesmus falcatus var. acicularis fed with anaerobic digestion liquor via biogranulation in addition to nutrients removal. Sci. Total Environ. 2020, 741, 140183. [Google Scholar] [CrossRef]
- Wang, Q.; Yu, Z.; Wei, D. High-yield production of biomass, protein and pigments by mixotrophic Chlorella pyrenoidosa through the bioconversion of high ammonium in wastewater. Bioresour. Technol. 2020, 313, 123499. [Google Scholar] [CrossRef]
- Awuah, E.; Lubberding, H.J.; Asante, K.; Gijzen, H.J. The effect of pH on enterococci removal in Pistia-, duckweed-and algae-based stabilization ponds for domestic wastewater treatment. Water Sci. Technol. 2002, 45, 67–74. [Google Scholar] [CrossRef]
- El Hamouri, B. Rethinking natural, extensive systems for tertiary treatment purposes: The high-rate algae pond as an example. Desalin. Water Treat. 2009, 4, 128–134. [Google Scholar] [CrossRef] [Green Version]
- Rani, S.; Chowdhury, R.; Tao, W.; Srinivasan, A. Tertiary treatment of municipal wastewater using isolated algal strains: Treatment efficiency and value-added products recovery. Chem. Ecol. 2020, 36, 48–65. [Google Scholar] [CrossRef]
- Ma, X.; Zhou, W.; Fu, Z.; Cheng, Y.; Min, M.; Liu, Y.; Zhang, Y.; Chen, P.; Ruan, R. Effect of wastewater-borne bacteria on algal growth and nutrients removal in wastewater-based algae cultivation system. Bioresour. Technol. 2014, 167, 8–13. [Google Scholar] [CrossRef]
- Chen, X.; Hu, Z.; Qi, Y.; Song, C.; Chen, G. The interactions of algae-activated sludge symbiotic system and its effects on wastewater treatment and lipid accumulation. Bioresour. Technol. 2019, 292, 122017. [Google Scholar] [CrossRef]
- Nguyen, T.T.; Binh, Q.A.; Bui, X.T.; Ngo, H.H.; Vo, H.N.P.; Lin, K.Y.A.; Guo, W.; Lin, C.; Breider, F. Co-culture of microalgae-activated sludge for wastewater treatment and biomass production: Exploring their role under different inoculation ratios. Bioresour. Technol. 2020, 314, 123754. [Google Scholar] [CrossRef]
- Ji, X.; Jiang, M.; Zhang, J.; Jiang, X.; Zheng, Z. The interactions of microalga-bacteria symbiotic system and its effects on nutrients removal from synthetic wastewater. Bioresour. Technol. 2018, 247, 44–50. [Google Scholar] [CrossRef] [PubMed]
- El Hamouri, B.; Khallayoune, K.; Bouzoubaa, K.; Rhallabi, N.; Chalabi, M. High-rate algal pond performances in faecal coliforms and helminth egg removals. Water Res. 1994, 28, 171–174. [Google Scholar] [CrossRef]
- El Hafiane, F.; El Hamouri, B. Anaerobic reactor/high rate pond combined technology for sewage treatment in the Mediterranean area. Water Sci. Technol. 2005, 51, 125–132. [Google Scholar] [CrossRef]
- Munasinghe-Arachchige, S.P.; Delanka-Pedige, H.M.K.; Henkanatte-Gedera, S.M.; Tchinda, D.; Zhang, Y.; Nirmalakhandan, N. Factors contributing to bacteria inactivation in the Galdieria sulphuraria-based wastewater treatment system. Algal Res. 2019, 38, 101392. [Google Scholar] [CrossRef]
- Water Environment Federation; American Public Health Association. Standard Methods for the Examination of Water and Wastewater; American Public Health Association (APHA): Washington, DC, USA, 2005. [Google Scholar]
- Becker, E.W. Microalgae: Biotechnology and Microbiology; Cambridge University Press: Cambridge, UK, 1994; Volume 10. [Google Scholar]
- Suzuki, I.; Dular, U.; Kwok, S.C. Ammonia or ammonium ion as substrate for oxidation by Nitrosomonas europaea cells and extracts. J. Bacteriol. 1974, 120, 556–558. [Google Scholar] [CrossRef] [Green Version]
- Li, J.; Bin, H.; Lin, J.; Chen, F.; Miao, X. Effects of light-emitting diodes under capped daily energy consumption with combinations of electric power and photoperiod on cultivation of Chlorella pyrenoidosa. Bioresour. Technol. 2016, 205, 126–132. [Google Scholar] [CrossRef]
- Shriwastav, A.; Bose, P. Algal growth in photo-bioreactors: Impact of illumination strategy and nutrient availability. Ecol. Eng. 2015, 77, 202–215. [Google Scholar] [CrossRef]
- Bohutskyi, P.; Kligerman, D.C.; Byers, N.; Nasr, L.K.; Cua, C.; Chow, S.; Su, C.; Tang, Y.; Betenbaugh, J.M.; Bouwer, E.J. Effects of inoculum size, light intensity, and dose of anaerobic digestion centrate on growth and productivity of Chlorella and Scenedesmus microalgae and their poly-culture in primary and secondary wastewater. Algal Res. 2016, 19, 278–290. [Google Scholar] [CrossRef]
- Lee, K.; Lee, C.G. Effect of light/dark cycles on wastewater treatments by microalgae. Biotechnol. Bioprocess Eng. 2001, 6, 194–199. [Google Scholar] [CrossRef]
- Atta, M.; Idris, A.; Bukhari, A.; Wahidin, S. Wahidin, Intensity of blue LED light: A potential stimulus for biomass and lipid content in fresh water microalgae Chlorella vulgaris. Bioresour. Technol. 2013, 148, 373–378. [Google Scholar] [CrossRef] [PubMed]
- Selvaratnam, T.; Pegallapati, A.K.K.; Montelya, F.; Rodriguez, G.; Nirmalakhandan, N.; van Voorhies, W.; Lammers, P.J.J. Evaluation of a thermo-tolerant acidophilic alga, Galdieria sulphuraria, for nutrient removal from urban wastewaters. Bioresour. Technol. 2014, 156, 395–399. [Google Scholar]
- Su, Y. Revisiting carbon, nitrogen, and phosphorus metabolisms in microalgae for wastewater treatment. Sci. Total Environ. 2021, 762, 144590. [Google Scholar] [CrossRef] [PubMed]
- Lage, S.; Toffolo, A.; Gentili, F.G. Microalgal growth, nitrogen uptake and storage, and dissolved oxygen production in a polyculture based open pond fed with municipal wastewater in northern Sweden. Chemosphere 2021, 276, 130122. [Google Scholar] [CrossRef]
- Fallahi, A.; Rezvani, F.; Asgharnejad, H.; Nazloo, E.K.; Hajinajaf, N.; Higgins, B. Interactions of microalgae-bacteria consortia for nutrient removal from wastewater: A review. Chemosphere 2021, 272, 129878. [Google Scholar] [CrossRef]
- Lee, S.C.; Lee, S.-A.; Ko, S.-R.; Oh, H.-M.; Ahn, C.-Y. Effects of photoperiod on nutrient removal, biomass production, and algal -bacterial population dynamics in lab-scale photobioreactors treating municipal wastewater. Water Res. 2015, 68, 680–691. [Google Scholar] [CrossRef] [PubMed]
- Arcila, J.S.; Buitron, G. Influence of solar irradiance levels on the formation of microalgae-bacteria aggregates for municipal wastewater treatment. Algal Res. 2017, 27, 190–197. [Google Scholar] [CrossRef]
- Gonçalves, A.L.; Simões, M.; Pires, J.C.M. The effect of light supply on microalgal growth, CO2 uptake and nutrient removal from wastewater. Energy Convers. Manag. 2014, 85, 530–536. [Google Scholar] [CrossRef] [Green Version]
- Xin, L.; Hong-Ying, H.; Ke, G.; Jia, Y. Growth and nutrient removal properties of a freshwater microalga Scenedesmus sp. LX1 under different kinds of nitrogen sources. Ecol. Eng. 2010, 36, 379–381. [Google Scholar] [CrossRef]
- Zhu, L.; Wang, Z.; Shu, Q.; Takala, J.; Hiltunen, E.; Feng, P.; Yuan, Z. Nutrient removal and biodiesel production by integration of freshwater microalga cultivation with piggery wastewater treatment. Water Res. 2013, 47, 4294–4302. [Google Scholar] [CrossRef]
- Silva-Benavides, A.M.; Torzillo, G. Nitrogen and phosphorus removal through laboratory batch cultures of microalga Chlorella vulgaris and cyanobacterium Planktothrix isothrix grown as monoalgal and as co-cultures. J. Appl. Phycol. 2012, 24, 267–276. [Google Scholar] [CrossRef]
- Mohsenpour, S.F.; Hennige, S.; Willoughby, N.; Adeloye, A.; Gutierrez, T. Integrating micro-microalga into wastewater treatment: A review. Sci. Total Environ. 2021, 752, 142168. [Google Scholar] [CrossRef]
- Solovchenko, A.; Khozin-Goldberg, I.; Selyakh, I.; Semenova, L.; Ismagulova, T.; Lukyanov, A.; Mamedov, I.; Vinogradova, E.; Karpova, O.; Konyukhov, I.; et al. Phosphorus starvation and luxury uptake in green microalgae revisited. Algal Res. 2019, 43, 101651. [Google Scholar] [CrossRef]
- Simm, R.A.; Mavinic, D.S.; Ramey, W.D. Nitrifier population dynamics in a bench scale conventional activated sludge reactor following an induced perturbation. J. Environ. Eng. Sci. 2005, 4, 385–397. [Google Scholar] [CrossRef]
- Simm, R.A.; Mavinic, D.S.; Ramey, W.D. A targeted study on possible free ammonia inhibition of Nitrospira. J. Environ. Eng. Sci. 2006, 5, 365–376. [Google Scholar] [CrossRef]
- Meng, F.; Xi, L.; Liu, D.; Huang, W.; Lei, Z.; Zhang, Z.; Huang, W. Effects of light intensity on oxygen distribution, lipid production and biological community of algal-bacterial granules in photo-sequencing batch reactors. Bioresour. Technol. 2019, 272, 473–481. [Google Scholar] [CrossRef]
- Su, Y.; Mennerich, A.; Urban, B. Synergistic cooperation between wastewater-born microalga and activated sludge for wastewater treatment: Influence of microalga and sludge inoculation ratios. Bioresour. Technol. 2012, 105, 67–73. [Google Scholar] [CrossRef] [PubMed]
- Sepehri, A.; Sarrafzadeh, M.-H.; Avateffazeli, M. Interaction between Chlorella vulgaries and nitrifying-enriched activated sludge in the treatment of wastewater with low C/N ratio. J. Clean. Prod. 2020, 247, 119164. [Google Scholar] [CrossRef]
- Valero, M.A.C.; Mara, D.D. Nitrogen removal via ammonia volatilization in maturation ponds. Water Sci. Technol. 2007, 55, 87–92. [Google Scholar] [CrossRef] [PubMed] [Green Version]
- Blöch, H. European Union legislation on wastewater treatment and nutrients removal. In Proceedings of the IWA Special Conference “Nutrient Management in Wastewater Treatment and Recycle Streams”, Krakow, Poland, 18–21 September 2005. [Google Scholar]
- Mohamed, A.Y.A.; Welles, L.; Siggins, A.; Healy, M.G.; Brdjanovic, D.; Rada-Ariza, A.M.; Lopez-Vazquez, C.M. Effects of substrate stress and light intensity on enhanced biological phosphorus removal in a photo-activated sludge system. Water Res. 2021, 189, 116606. [Google Scholar] [CrossRef] [PubMed]
- Maurer, M.; Boller, M. Modelling of Phosphorus precipitation in wastewater treatment plants with enhanced biological phosphorus removal. Water Sci. Technol. 1999, 39, 147–163. [Google Scholar] [CrossRef]
- Manas, A.; Pocquet, M.; Biscans, B.; Sperandio, M. Parameters influencing calcium phosphate precipitation in granular sludge sequencing batch reactor. Chem. Eng. Sci. 2012, 77, 165–175. [Google Scholar] [CrossRef]
- Chowdhury, R. Using adsorption and sulphide precipitation as the principal removal mechanisms of arsenic from a constructed wetland—A critical review. Chem. Ecol. 2017, 33, 560–571. [Google Scholar] [CrossRef]
- Lim, S.L.; Chu, W.L.; Phang, S.M. Use of Chlorella vulgaris for bioremediation of textile wastewater. Bioresour. Technol. 2010, 101, 7314–7322. [Google Scholar] [CrossRef]
- Cho, S.; Luong, T.T.; Lee, D.; Oh, Y.K.; Lee, T. Reuse of effluent water from a municipal wastewater treatment plant in microalgae cultivation for biofuel production. Bioresour. Technol. 2011, 102, 8639–8645. [Google Scholar] [CrossRef]
- Osundeko, O.; Davies, H.; Pittman, J.K. Oxidative stress-tolerant microalgae strains are highly efficient for biofuel feedstock production on wastewater. Biomass Bioenergy 2013, 56, 284–294. [Google Scholar] [CrossRef]
- Halfhide, T.; Åkerstrøm, A.; Lekang, O.I.; Gislerød, H.R.; Ergas, S.J. Production of algal biomass, chlorophyll, starch and lipids using aquaculture wastewater under axenic and non-axenic conditions. Algal Res. 2014, 6, 152–159. [Google Scholar] [CrossRef]
- Hage, A.; Luckett, N.; Holbrook, G.P. Phycoremediation of municipal wastewater by the cold-adapted microalga Monoraphidium sp. Dek19. Water Environ. Res. 2018, 90, 1938–1946. [Google Scholar] [CrossRef] [PubMed]
- Schellenberg, T.; Subramanian, V.; Ganeshan, G.; Tompkins, D.; Pradeep, R. Wastewater discharge standards in the evolving context of urban sustainability—The case of India. Front. Environ. Sci. 2020, 8, 30. [Google Scholar] [CrossRef]
- Makut, B.B.; Das, D.; Goswami, G. Production of microbial biomass feedstock via co-cultivation of microalgae-bacteria consortium coupled with effective wastewater treatment: A sustainable approach. Algal Res. 2019, 37, 228–239. [Google Scholar] [CrossRef]
- Sun, L.; Zuo, W.; Tian, Y.; Zhang, J.; Liu, J.; Sun, N.; Li, J. Performance and microbial community analysis of an algal-activated sludge symbiotic system: Effect of activated sludge concentration. J. Environ. Sci. 2019, 76, 121–132. [Google Scholar] [CrossRef]
- Zhou, W.; Min, M.; Li, Y.; Hu, B.; Ma, X.; Cheng, Y.; Liu, Y.; Chen, P.; Ruan, R. A hetero-photoautotrophic two-stage cultivation process to improve wastewater nutrient removal and enhance algal lipid accumulation. Bioresour. Technol. 2012, 110, 448–455. [Google Scholar] [CrossRef]
- Tchinda, D.; Henkanatte-Gedera, S.M.; Abeysiriwardana-Arachchige, I.S.A.; Delanka-Pedige, H.M.K.; Munasinghe-Arachchige, S.P.; Zhang, Y.; Nirmalakhandan, N. Single-step treatment of primary effluent by Galdieria sulphuraria: Removal of biochemical oxygen demand, nutrients, and pathogens. Algal Res. 2019, 42, 101578. [Google Scholar] [CrossRef]
- Liu, L.; Hall, G.; Champagne, P. The role of microalga in the removal and inactivation of pathogenic indicator organisms in wastewater stabilization pond systems. Algal Res. 2020, 46, 101777. [Google Scholar] [CrossRef]
- Fallowfield, H.J.; Cromar, N.J.; Evison, L.M. Coliform die-off rate constants in a high-rate algal pond and the effect of operational and environmental variables. Water Sci. Technol. 1996, 34, 141–147. [Google Scholar] [CrossRef]
- Wu, S.; Carvalho, P.N.; Müller, J.A.; Manoj, V.R.; Dong, R. Sanitation in constructed wetlands: A review on the removal of human pathogens and fecal indicators. Sci. Total Environ. 2016, 541, 8–22. [Google Scholar] [CrossRef]
- Davies-Colley, R.J.; Donnison, A.M.; Speed, D.J.; Ross, C.M.; Nagels, J.W. Inactivation of faecal indicator microorganisms in waste stabilization ponds: Interactions of environmental factors with sunlight. Water Res. 1999, 33, 1220–1230. [Google Scholar] [CrossRef]
- Ouli, A.; Jupsin, H.; Vasei, J.L.; Ghrabi, A. Removal of E. coli and enterococci in maturation pond and kinetic modelling under sunlight conditions. Desalin. Water Treat. 2015, 53, 1068–1074. [Google Scholar]
- Park, J.B.K.; Weaver, L.; Davies-Coley, R.; Stott, R.; Williamson, W.; Mackenzie, M.; Mcgill, E.; Lin, S.; Webber, J.; Craggs, R.J. Comparison of faecal indicator and viral pathogen light and dark disinfection mechanisms in wastewater treatment pond mesocosms. J. Environ. Manag. 2021, 286, 112197. [Google Scholar] [CrossRef] [PubMed]


Publisher’s Note: MDPI stays neutral with regard to jurisdictional claims in published maps and institutional affiliations. |
© 2021 by the authors. Licensee MDPI, Basel, Switzerland. This article is an open access article distributed under the terms and conditions of the Creative Commons Attribution (CC BY) license (https://creativecommons.org/licenses/by/4.0/).