Article

A Study on the Development of Reduction Facilities’ Management Standards for Agricultural Drainage for Disaster Reduction

1
Department of Civil Engineering and Landscape Architectural, Daegu Technical University, Daegu 42734, Korea
2
Department of Aeronautics and Civil Engineering, Hanseo University, Seosan 31962, Korea
*
Author to whom correspondence should be addressed.
Sustainability 2021, 13(17), 9595; https://doi.org/10.3390/su13179595
Submission received: 15 July 2021 / Revised: 23 August 2021 / Accepted: 24 August 2021 / Published: 26 August 2021
(This article belongs to the Special Issue Risk Assessment and Sustainable Disaster Management)

Abstract

:
The agricultural drainage in rural area plays important roles in water supply and drainage for crop cultivation. Various kinds of debris near agricultural drainage, however, causes sedimentation in the drainage during rainfall. The debris introduced into the agricultural drainage moves out of the drainage under a high flow rate. This causes a reduction in the flow rate, which may affect the discharge capacity, resulting in crop damage. This study developed a reduction facility to reduce debris entering agricultural drainage and analyzed the performance by measuring the capture efficacy in the hydraulic experiment. A total of 648 runs were performed for 216 experiment conditions where three replications and error ranges were calculated depending on the inflow characteristics of debris. This study also evaluated the performance of the reduction facility and established the design criteria by developing a capture efficacy equation by flow rate and type of reduction facility.

1. Introduction

A drainage is a structure that is installed for rainwater to flow during rainfall, and it is used in various settings such as rural, mountainous and urban areas [1]. The agricultural drainage located in rural areas serves as waterways for supplying water or drainage, through which nearby trees and crops are introduced. Debris such as branches and crops, located around the agricultural drainage during rainfall, flows into the drainage along with rainwater, and sedimentation occurs in a slow flow. The inflow of debris into agricultural drainage causes sedimentation, while overflow due to lack of discharge capacity is a major cause of flooding of agricultural land. Despite these damages, the quantitative standards applied to offer guidelines for reducing facilities or maintenance of agricultural have been poorly established.
Agricultural drainage is important for water supply and drainage, and various studies such as crop production and cultivation techniques have been conducted. The problems of salinization due to inadequate drainage systems in agricultural areas were raised, and the solution was proposed by structural and engineering methods [2,3,4,5]. A method for maintaining soil-moisture conditions favorable to crop production according to the drainage capacity of the agricultural drainage was studied [6,7]. To provide continuous water supply in agricultural areas, it set up agricultural drainage for groundwater flow rate and suggested a plan for control and management [8,9,10,11,12,13,14,15]. It was explained that the efficiency of water use through the installation of agricultural drainage has an effect on harvesting by diversifying crops and reducing costs [16,17]. In addition, historical reviews of drainage channels in agriculture as well as methods of utilization based on ancient hydraulic technology were proposed [18]. Research on structural and utilization of agricultural drainage channels was mainly conducted to improve crop production and cultivation techniques. However, studies related to securing water-discharge capacity for smooth water supply and drainage to agricultural drainage channels were not conducted.
Most studies on drainage have focused on flow characteristics and change in flow rates by each parameter, through hydraulic experiments and numerical modeling. An empirical flow estimation equation was proposed, through hydraulic experiments, and based on the flow rate, road slope, and lateral slope of drainage and local constants, changes in the interception flow rate were analyzed [19,20]. An empirical equation was proposed considering the factors of topographical characteristics of flow rate emitted through the drainage system in the road area [21]. A varied flow analysis was performed for the flow rate into the drainage, considering the topography characteristics, and the safety related to the installation of reduction facilities was reviewed [22]. A reduction facility was developed for inflow of debris flowing into the drain, and the effect through flow rate and Fr was reviewed, and an equation was proposed [23]. The studies on drainage, through hydraulic experiments and numerical modeling, mainly addressed the flow characteristics and change in flow rates. Development of a reduction facility that blocks the deposition of transportation and sedimentation of debris entering into agricultural drainage is insufficient. In addition, only safety related to the installation of the reduction facility was reviewed, and there was no research on the improvement on the capture efficiency by flow rate to block the debris.
Since the quantitative definition of the size or shape of the debris is difficult, most of the previous studies focused on sedimentation characteristics and design methods through hydraulic experiments. A design method was presented for reduction facilities to reduce sedimentation of debris on bridges and culverts in rivers or hydraulic characteristics according to the size of the debris [24,25,26,27,28,29,30,31]. The reduction efficiency was measured using the capture efficiency for debris of the reduction facilities, or the effects of hydraulic changes such as friction co-efficient were analyzed [32,33,34,35,36]. In addition, the degree of debris accumulation was analyzed or the effects of piles installed on the bridge to block debris and scour reduction were presented by pile installation [25,26,37]. Reduction facilities or hydraulic properties to prevent debris sedimentation have been studied, but a focus on large-scale facilities and development of reduction facilities for debris reduction in small facilities such as agricultural drainage has not been addressed.
The studies on debris have presented a criterion for reducing flood damage, such as the number of piers, the length of spans, and the width of piers to improve the discharge capacity of rivers [37,38]. The design conditions were presented by analyzing hydraulic characteristics considering the debris for the bridge and the culvert [30,31]. Despite these studies, the necessity to design criteria for rivers and roads to block the debris was proposed by other studies. Studies on debris suggested the need for design criteria or related studies to reduce sedimentation in various structures. However, no studies on agricultural drainage have addressed the development of debris-reduction facilities or associated hydraulic characteristics.
The purpose of this study was to develop a reduction facility in consideration of the inflow characteristics of debris in agricultural drainage and to conduct performance evaluation of the capture efficiency. The research method was divided into three parts for development of reduction facility, hydraulic experiment and performance evaluation. The reduction facility is developed to be applicable to agricultural drainage by reviewing the design criteria of drainage, blocking facilities and current status of debris. The hydraulic experiment is established to include various conditions such as flow rate, velocity and debris by reviewing laboratory specifications. The performance test is to evaluate the performance of the capture efficiency of debris of the reduction facility and to propose design criteria by developing the regression equation.

2. Materials

2.1. Reduction Facilities

In 2005, the Federal Highway Administration (FHWA) proposed a deflection structure for debris flowing into the drainage [39]. The screen and deflector screen were proposed as reduction facilities for debris flowing into the drainage, and the design standard was provided for the deflector screen only. The reduction facilities for debris flowing into the drainage proposed by FHWA are designed as a screen or grid type. A design with a higher height and narrower width than the drainage has been proposed for the screen or grid to block debris flowing into the drainage (Figure 1). The debris may be classified into driftwood, stone and others; however, it is difficult to define it in terms of size and scale. Thus, reduction facilities for debris are designed in either screen or grid form.

2.2. Characteristics of Debris Entering Agricultural Drainage

The agricultural drainage to supply and drain the agricultural water is found in rural areas. The debris, such as crops or branches, near agricultural drainage enters into the drainage during rainfall. The debris entering the drainage moves along the agricultural drainage or sediment, results in charge capacity, and the long-term sedimentation may cause damage by flooding. Accordingly, this study defines the size of debris related to agricultural drainage. Debris such as branches and pieces of wood pieces were collected, as shown in Figure 2, at a rural area located near Daegu Metropolitan City in South Korea during a walk, at about one kilometer along the agricultural drainage.
About 350 items of debris such as crops and branches were collected in a section of about one kilometer near the agricultural drainage. The sizes and lengths of debris near agricultural drainage were different, although only the debris with a size that could pass into drainage was collected. The diameter and length of the debris near agricultural drainage was 1~2 mm and 90~250 mm, respectively, and about 70% had a diameter of 2~7 mm. The size characteristics are shown in Table 1.

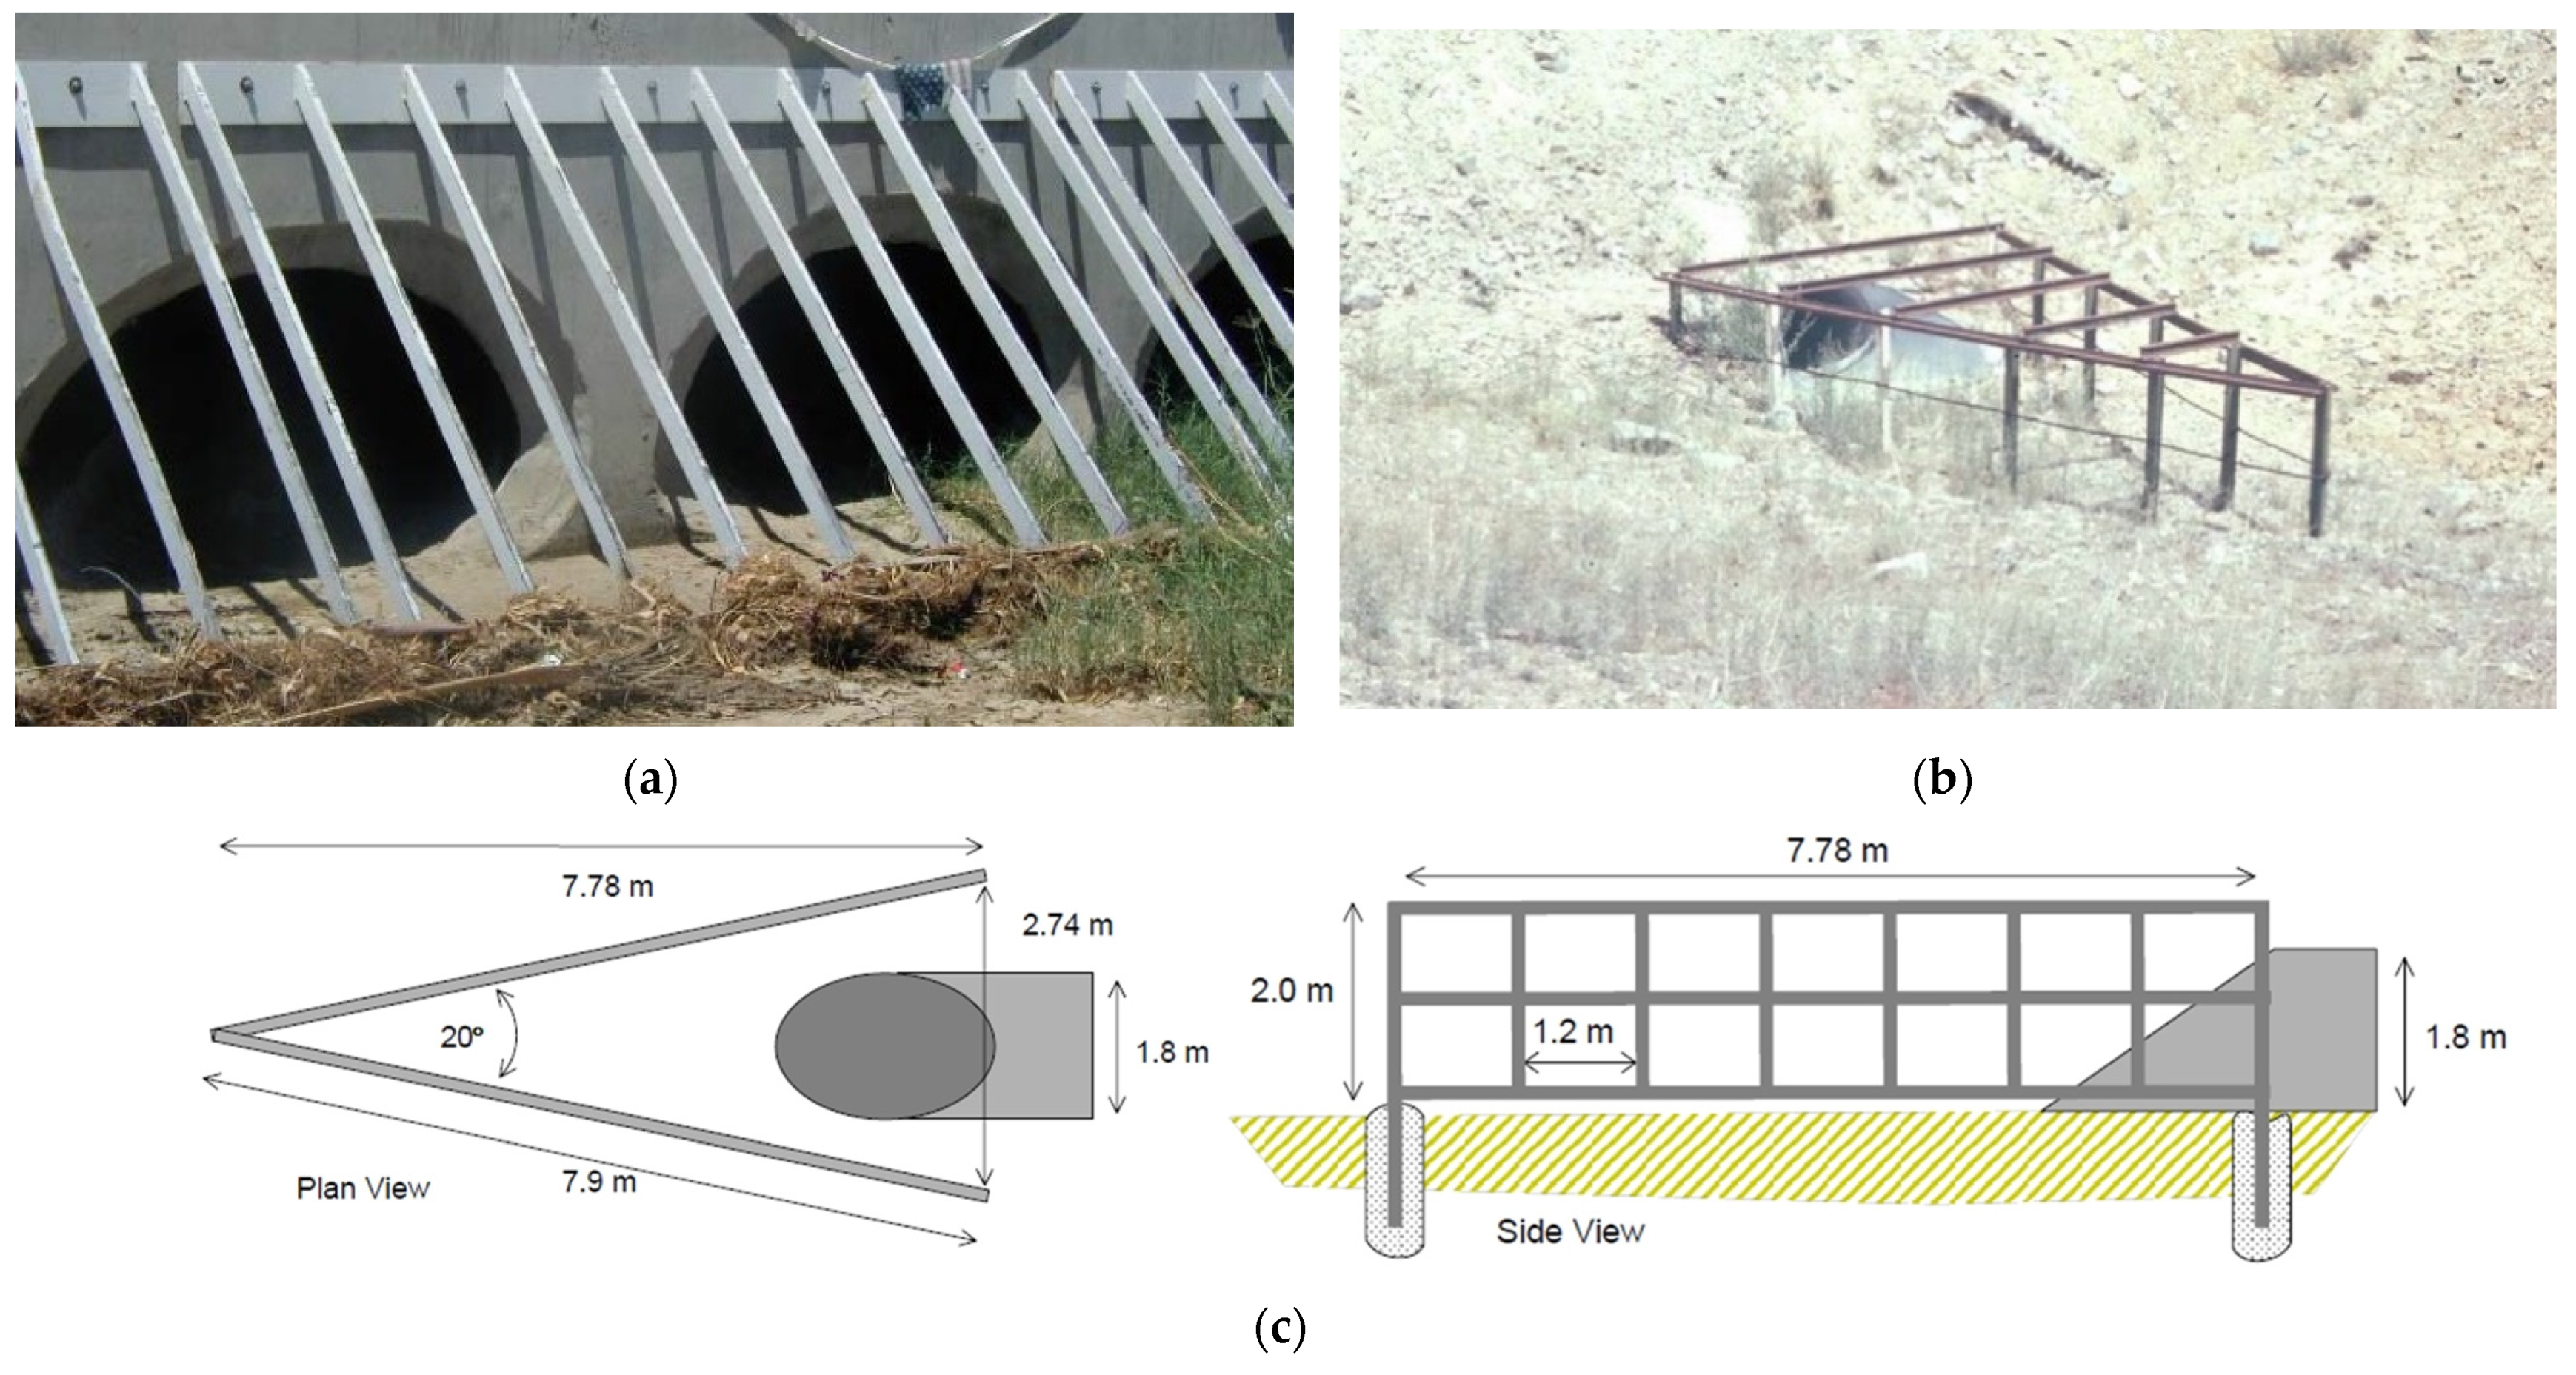
2.3. Development of Reduction Facilities for Agricultural Drainage

The reduction facilities that capture debris before agricultural drainage are small in size, and it is difficult to determine their size in reference to the debris. The development of reduction facilities for small-scale drainage has not been studied, and only the FHWA standard proposed in 2005 has been applied up to now. However, agricultural drainage causes damage to crops due to the lack of discharge capacity that results from debris sedimentation and the resultant overflow during rainfall.
Korean legislation classifies the installation location of drainage into mountain, plain and agricultural land, and sets the design frequency between 20 and 50 years. In addition, the debris in drainage and sedimentation of soils is suggested to add 20% of the design flood [40,41,42]. Overseas design criteria are classified according to the size and geographical characteristics of drains, and the United States has plans for 2 to 100 years, and Japan for 20 to 50 years [43,44].
This study develops a reduction facility, as shown in Figure 3, with the size of 400 mm most commonly used for agricultural drainage by considering the design criteria for debris-reduction facilities in Section 2.1. Moreover, the design considers the characteristics of debris near agricultural drainage that could flow into the drainage, and design criteria for drainage. The proposed reduction facility of the agricultural drainage is a square with a width of 400 mm (B), a height of 400 mm (H), and an overflow height (y) of 80 mm, which is 20% of the height. The overflow height was added to allow flow even after capturing the debris. The overall form is a grid with horizontal net distance (d1), vertical net distance (d2), and an effective cross-sectional area. The diameter (D) of the used circular grid bar is 5 mm.
Three kinds of reduction facilities were developed given the size of debris, d1 and d2. These reduction facilities had identical drainage B and y and have grid sizes of 4 × 4, 6 × 6, and 8 × 8, respectively. Table 2 shows the specifications of developed reduction facilities. The grid of the reduction facility is rectangular, and the spacing was determined by considering the diameter and length of the debris. Given that the maximum diameter and minimum length of the debris near the agricultural drainage is 25 mm and 90 mm, respectively, the maximum d2 for the vertical passage of debris and minimum d1 for the horizontal passage were calculated and applied. The d1, d2 and A were 96 mm, 75 mm and 7200 mm2 for 4 × 4 type; 63 mm, 48 mm and 3024 mm2 for 6 × 6 type; and 46 mm, 35 mm and 1610 mm2 for 8 × 8 type, respectively.

3. Methods

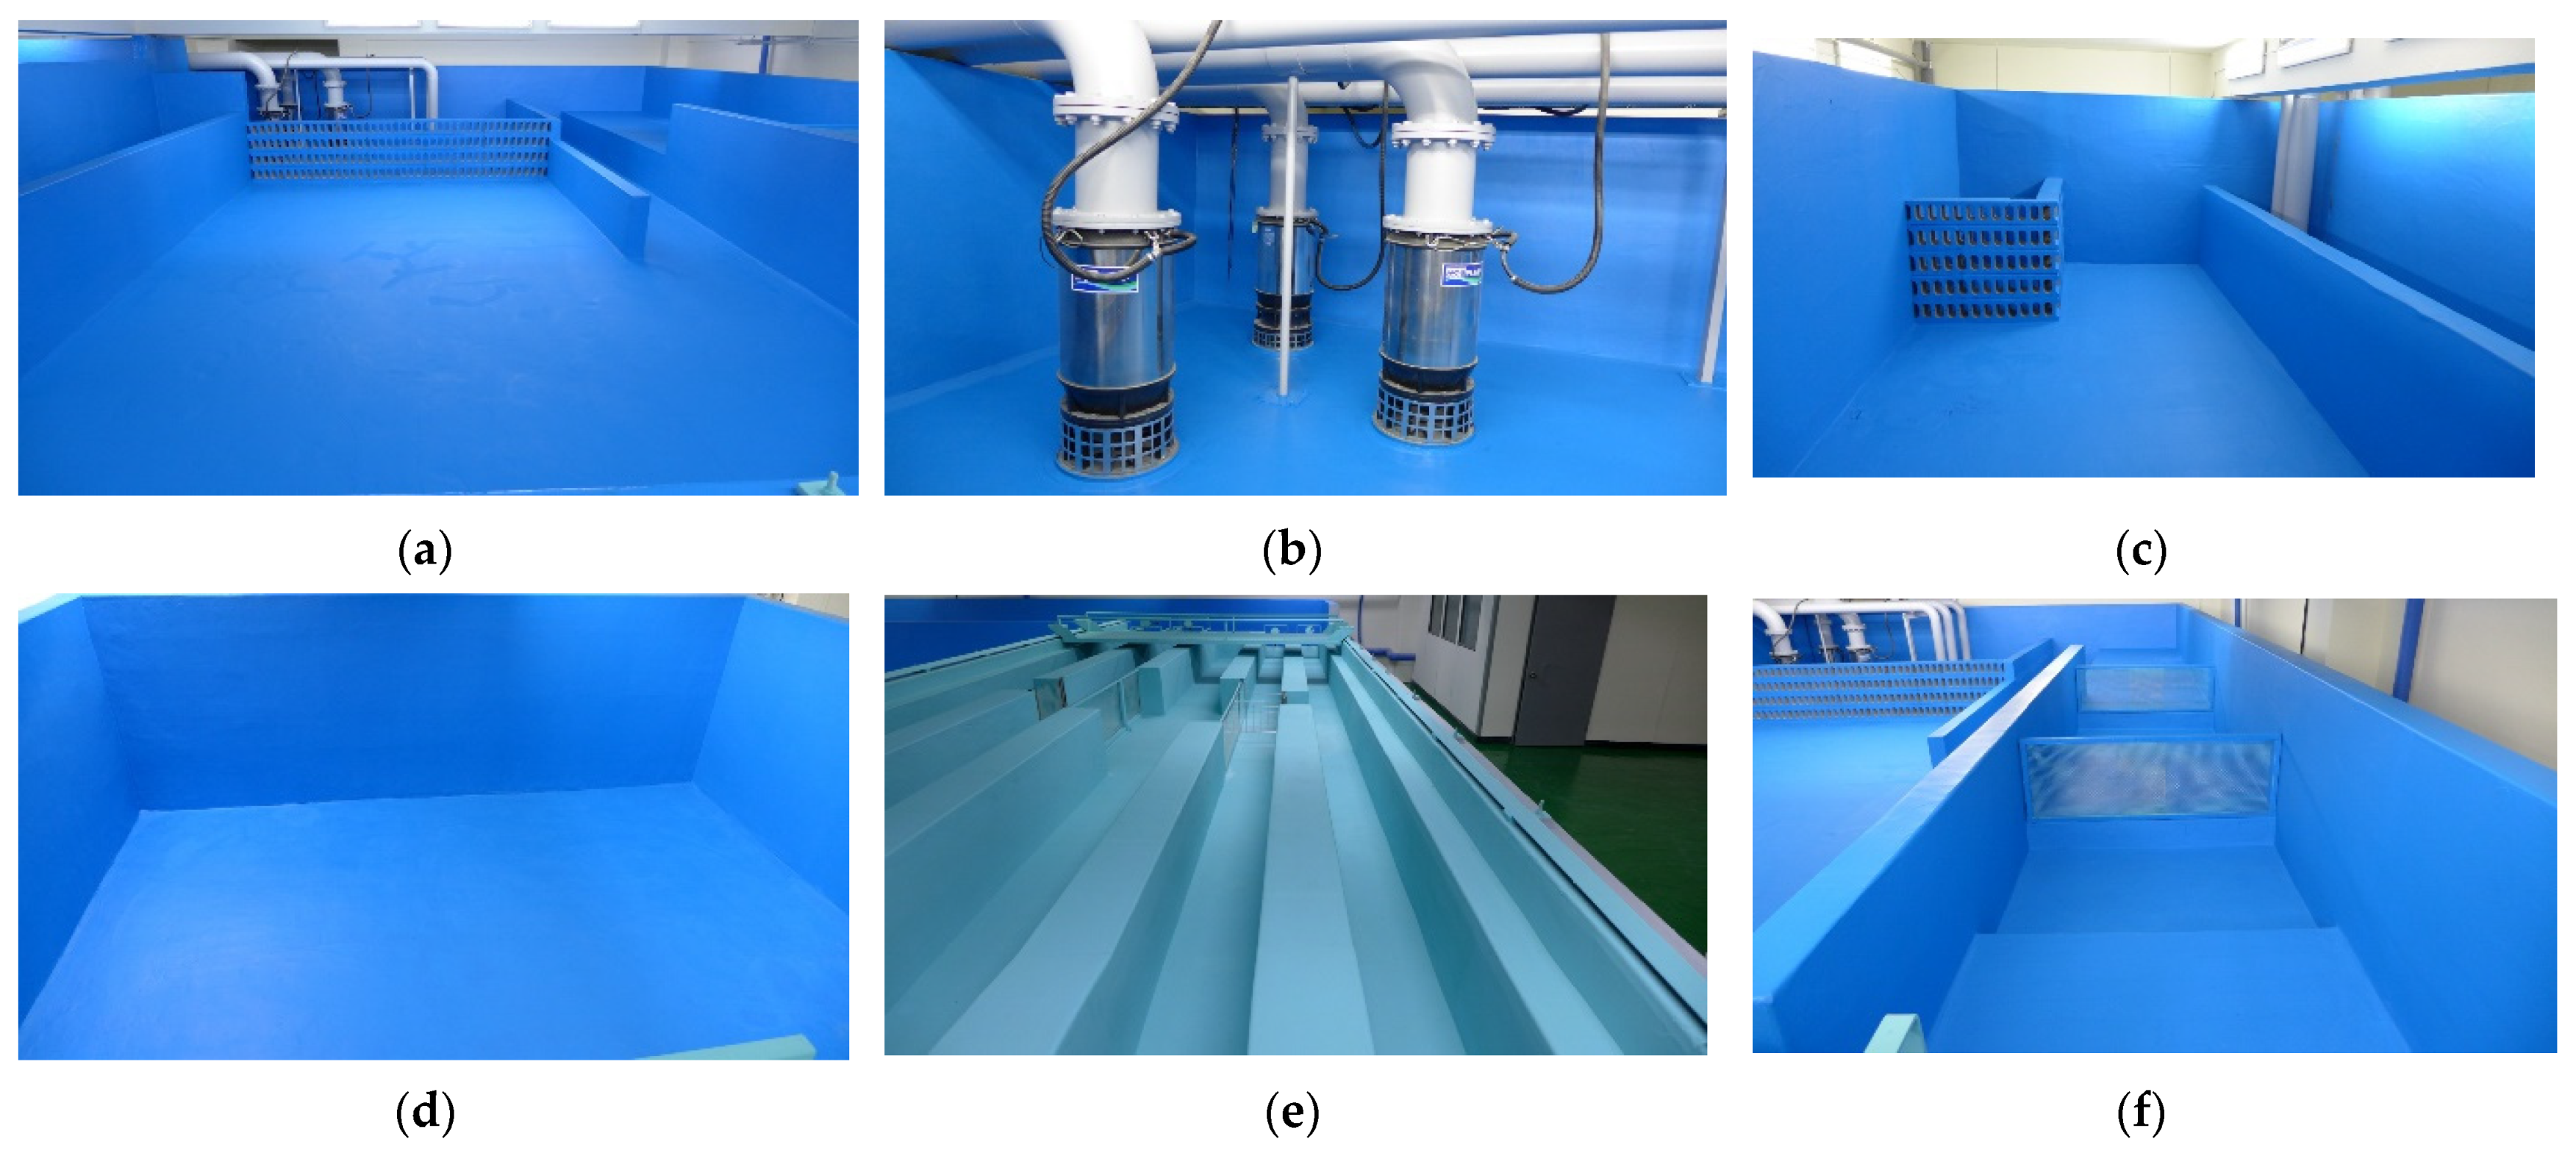
3.1. Hydraulic Experiment

The hydraulic experiment was performed to develop a reduction facility to reduce inflow of debris into agricultural drainage and for capture efficiency. For the hydraulic experiment of agricultural drainage, a 1:1 scale laboratory, the best size to test hydraulic characteristics, was constructed. The hydraulic laboratory consisted of a pump capable of supplying a sufficient flow to the agricultural drainage with size of 400 × 400 mm, a high water tank for stable water supply and a storage tank after the agricultural drainage for circulation (Figure 4).
In the 17.5 m × 17.5 m (306.25 m2) hydraulic laboratory, circulation proceeds to Water Tank, Pump Facilities, Head Tank, Rectifying Tank, Agricultural Drainage, Return Tank. The volume of the water stored in the hydraulic laboratory is about 114 m3 and is designed to maintain the maximum flow rate of the pump for about five minutes. The agricultural drainage was set to have a cross-section of 0.4 m × 0.4 m and a length of 8.75 m, so that the upstream and downstream boundaries through hydraulic experiments have no effect on the flow. Table 3 shows the specifications of each hydraulic laboratory facilities.

3.2. Experiment Conditions

The reduction facility to reduce debris entering the agricultural drainage was developed and the capture efficiency was measured. Three kinds of reduction facilities to reduce debris, 4 × 4, 6 × 6 and 8 × 8 types, were developed to be applied in the hydraulic experiment by considering the conditions in Section 2.3. The 4 × 4 type has 16 spaces with four vertical and horizontal spaces; the 6 × 6 type with 36 and six for each; and the 8 × 8 type with 64 and eight for each (Figure 5).
Although the optimal debris used in hydraulic experiments is the type collected near agricultural drainage, there are limitations to the application of the same-sized debris to various experimental conditions. Accordingly, the circular rods that are similar to the debris and are easy to secure were used for each diameter. The amount of debris added per session was calculated for an area of 64,000 mm2, which is 50% of the total effective cross-sectional area, excluding the overflow water level. The composition of debris was, as shown in Table 4, 12 of 3 mm, 12 of 5 mm, 12 of 7 mm, 10 of 10 mm, and 10 of 12 mm.
Reduction facilities for agricultural drainage are installed perpendicular to flow direction. The inflow direction of debris with a size of 160 mm is expected to have an effect on the capture efficiency. Two kinds of drop directions, those identical or perpendicular to flow directions, were applied as shown in Figure 6. The inflow characteristics of debris were also considered in measuring the capture efficiency of the reduction facility.
The conditions manipulated in the hydraulic experiment to measure the performance were the facility type, velocity, depth and the drop conditions. Based on 400 mm of agricultural drainage, the reduction-facility types used three cases of 4 × 4, 6 × 6, and 8 × 8; velocity was six cases of 0.3, 0.6, 0.9, 1.2, 1.5 and 1.8 m/s; depth was six cases of 0.08, 0.12, 0.16, 0.20, 0.24 and 0.28 m; and drop conditions used six cases, three for each horizontal and vertical drop, resulting in 648 runs with 216 conditions and three replications. The conditions of the hydraulic experiment are shown in Table 5.

4. Results

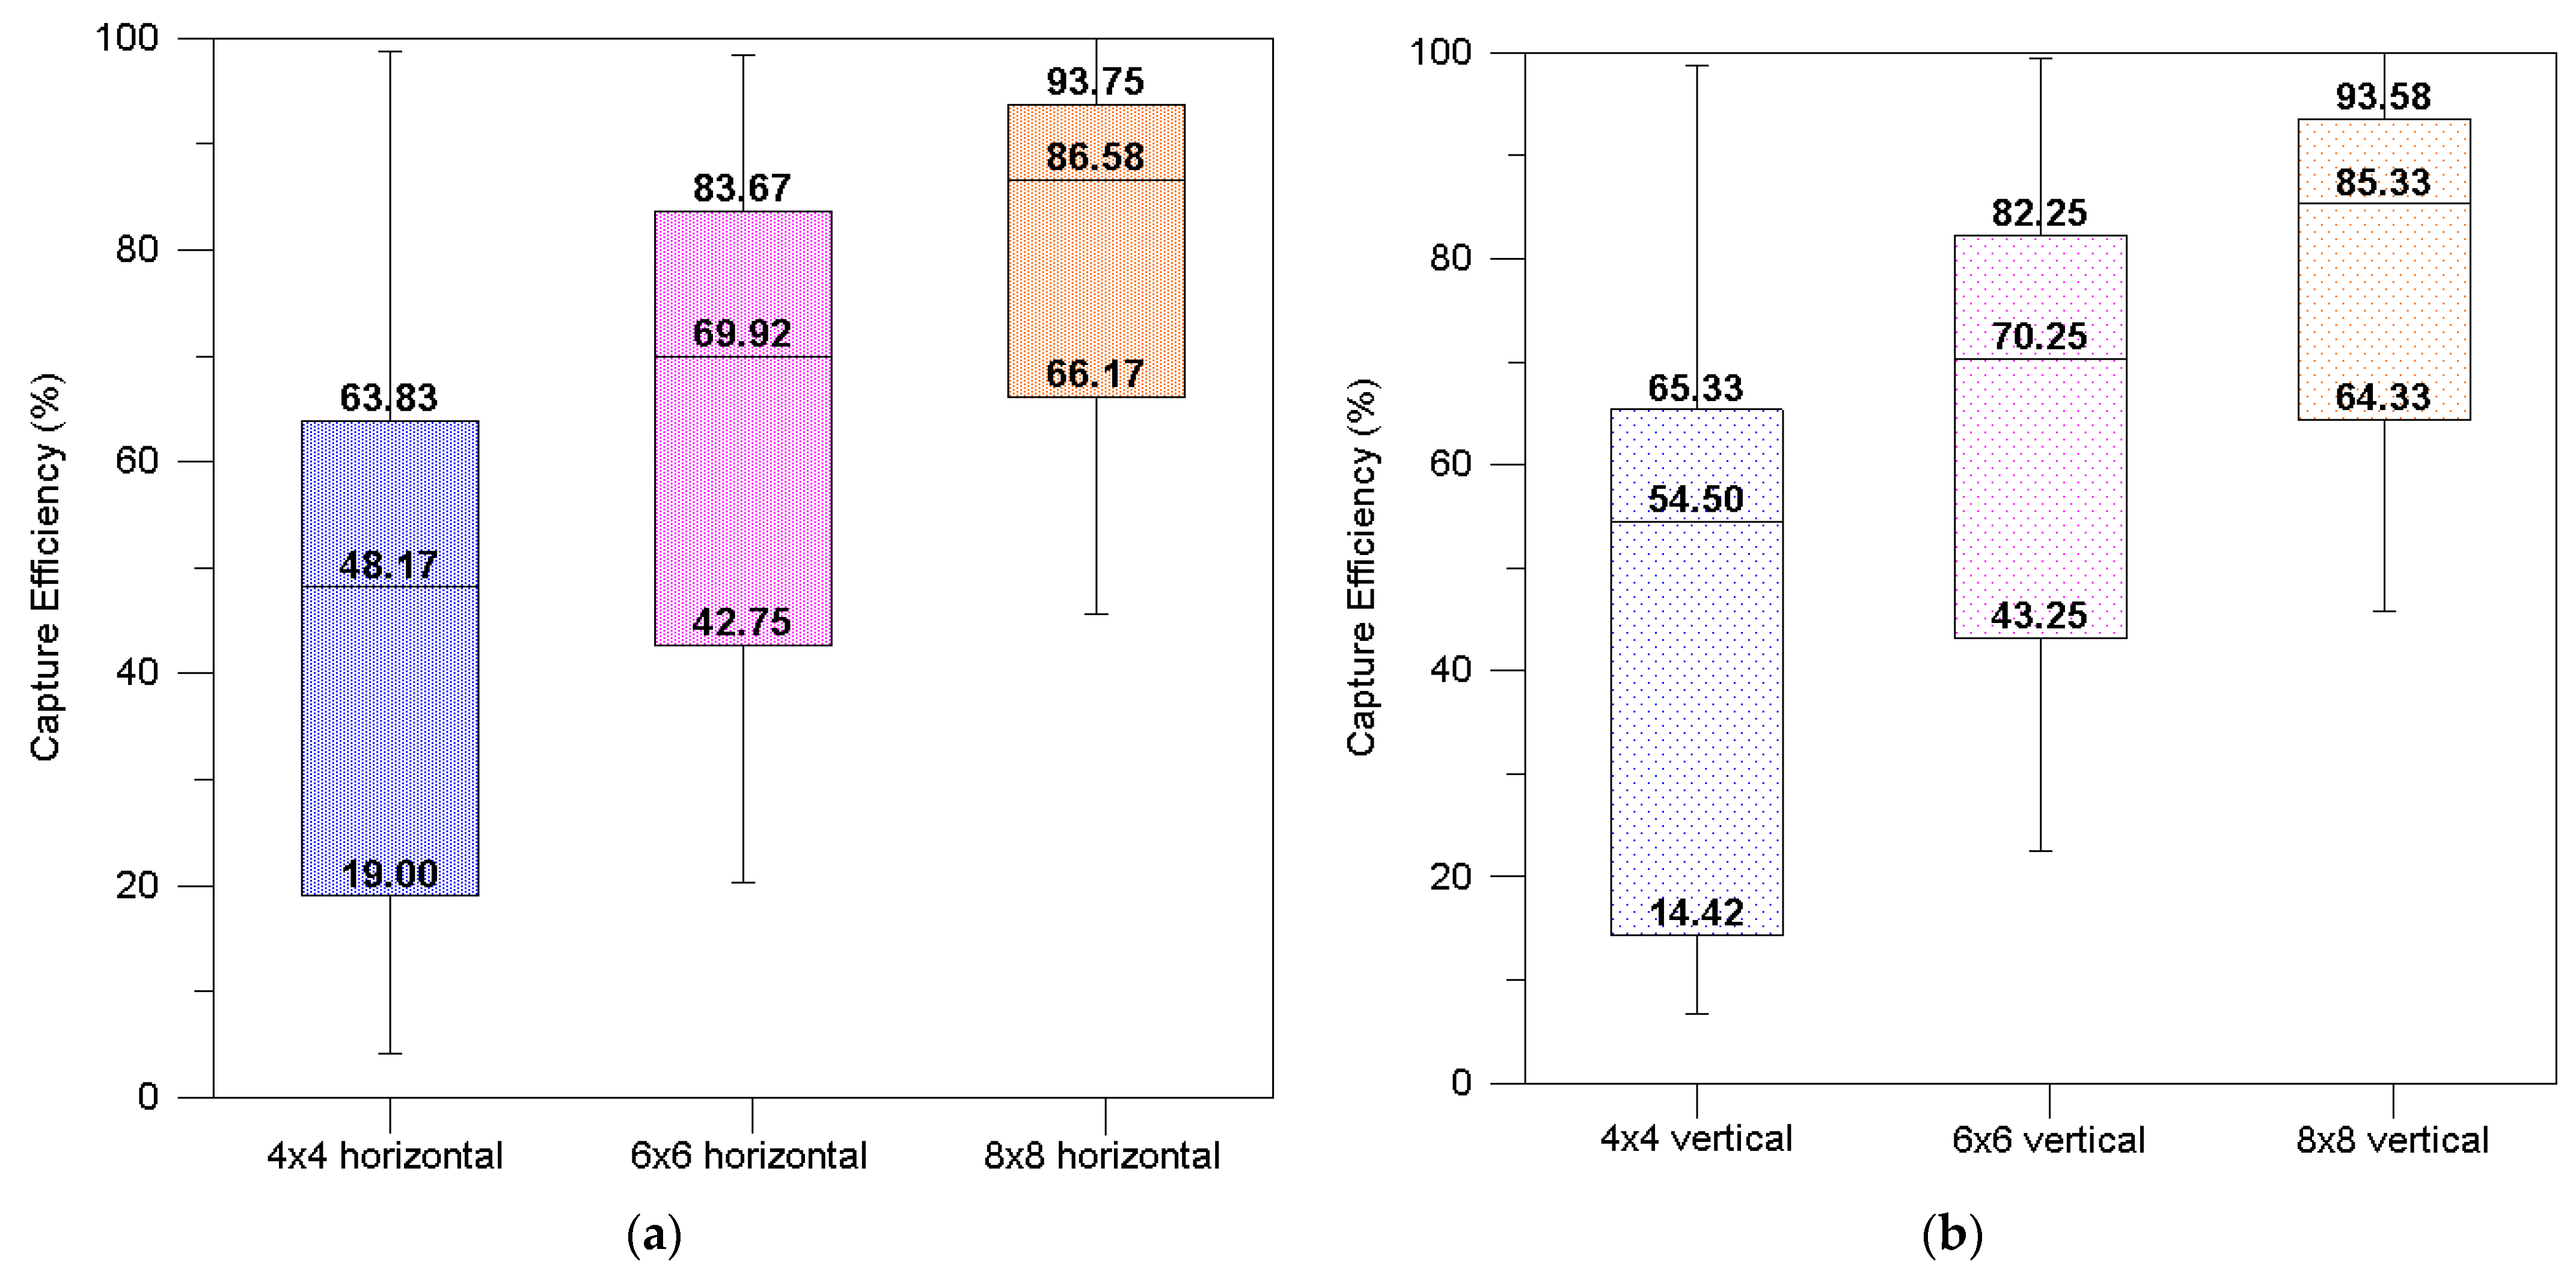
4.1. Efficiency Test for Each Inflow Characteristic of Debris

A total of 648 runs were performed in the hydraulic experiment, with three cases for facility type, six cases for velocity, six cases for depth, two cases for drop condition, and three replications. The conditions of depth 240 mm and velocity 1.8 m/s, depth 280 mm and velocity 1.5 m/s, and depth 280 mm and velocity 1.8 m/s caused an overflow damage due to the debris captured in the reduction facilities. All conditions resulting in an overflow damage due to the lack of discharge capacity due to the capture of debris had a flow rate of over 0.16 m3/s, where the installation of reduction facility is impossible. Figure 7 shows the capture efficiency of each type through the drop conditions of vertical and horizontal. A total of 207 velocity and depth conditions were run for the conditions from 0.01 m3/s to 0.144 m3/s, excluding the conditions resulting in overflow damage.
For the 4 × 4 type, the capacity efficiency was 4.1~98.8% with a first quartile of 19.00%, a median of 48.17% and a third quartile of 63.83% in horizontal drop conditions, and 6.7~98.8% with a first quartile of 14.42%, a median of 54.50% and a third quartile of 65.33% in vertical drop conditions. The range of difference in capture efficiency by inflow characteristics was −4.58% to 6.33%, where the first quartile value was higher in the horizontal one, while the median and third quartile values were higher in the vertical one. The quartile values that had less effect on the outlier of capture efficiency were 44.83% for horizontal and 50.91% for vertical, indicating that the vertical one had a higher variation by 6.08%.
For the 6 × 6 type, the capacity efficiency was 20.3~98.4% with a first quartile of 42.75%, a median of 69.92% and a third quartile of 83.67% in horizontal drop conditions, and 22.6~99.4% with a first quartile of 43.25%, a median of 70.25%, and a third quartile of 82.25% in vertical drop conditions. The range of difference in the capture efficiency by inflow characteristics was from −1.42 to 0.50%, where the first quartile value and median were higher in the vertical one, and the third quartile value was higher in the horizontal one. The quartile values that had less effect on outlier of capture efficiency were 40.92% for the horizontal one and 39.00% for the vertical one, indicating that the horizontal one had a higher variation by 1.92% point.
For the 8 × 8 type, the capacity efficiency was 45.7~100.0% with a first quartile of 66.17%, a median of 86.58% and a third quartile of 93.75% in horizontal drop conditions, and 45.8~100.0% with a first quartile of 64.33%, a median of 85.33% and a third quartile of 93.58% in vertical drop conditions. The range of difference in capture efficiency by inflow characteristics was −1.84 to −0.17%, where all the quartile values were higher in the horizontal one. The quartile values that had less effect on the outlier of capture efficiency were 27.58% for horizontal and 29.25% for vertical, indicating that the horizontal one had a higher variation by 1.67%.
The difference in capture efficiency between the horizontal and vertical drop conditions was found to be from −10~10%, depending on the experiment conditions. This difference reduced with the increase in flow rate, and Figure 8 shows that these differences obtained by regression analysis are from 2.54 to 1.05% in a positive value and from −3.92 to −1.42%. The difference in capture efficiency by inflow characteristics was higher in the negative range compared to the positive range, while for the increase in flow rate from 0 to 0.16 m3/s the occurrence rate was higher in the negative range compared to the positive one by 135~155%.
The difference in capture efficiency by flow rate was from −3.92% to 2.54% as shown in Table 6. The ranges were from 1.05% to 2.54% in the positive one and from −1.42% to −3.92 in the negative one, the mean and the range of capture efficiency by inflow characteristics were 6.5–4.5%. The error range of capture efficiency for inflow characteristics by flow rate is 6.5~4.5% for 0.00 m3/s to 0.05 m3/s, 4.5~3.3% for 0.05 m3/s to 0.10 m3/s, and 3.3~2.5% for 0.10 m3/s to 0.16 m3/s.

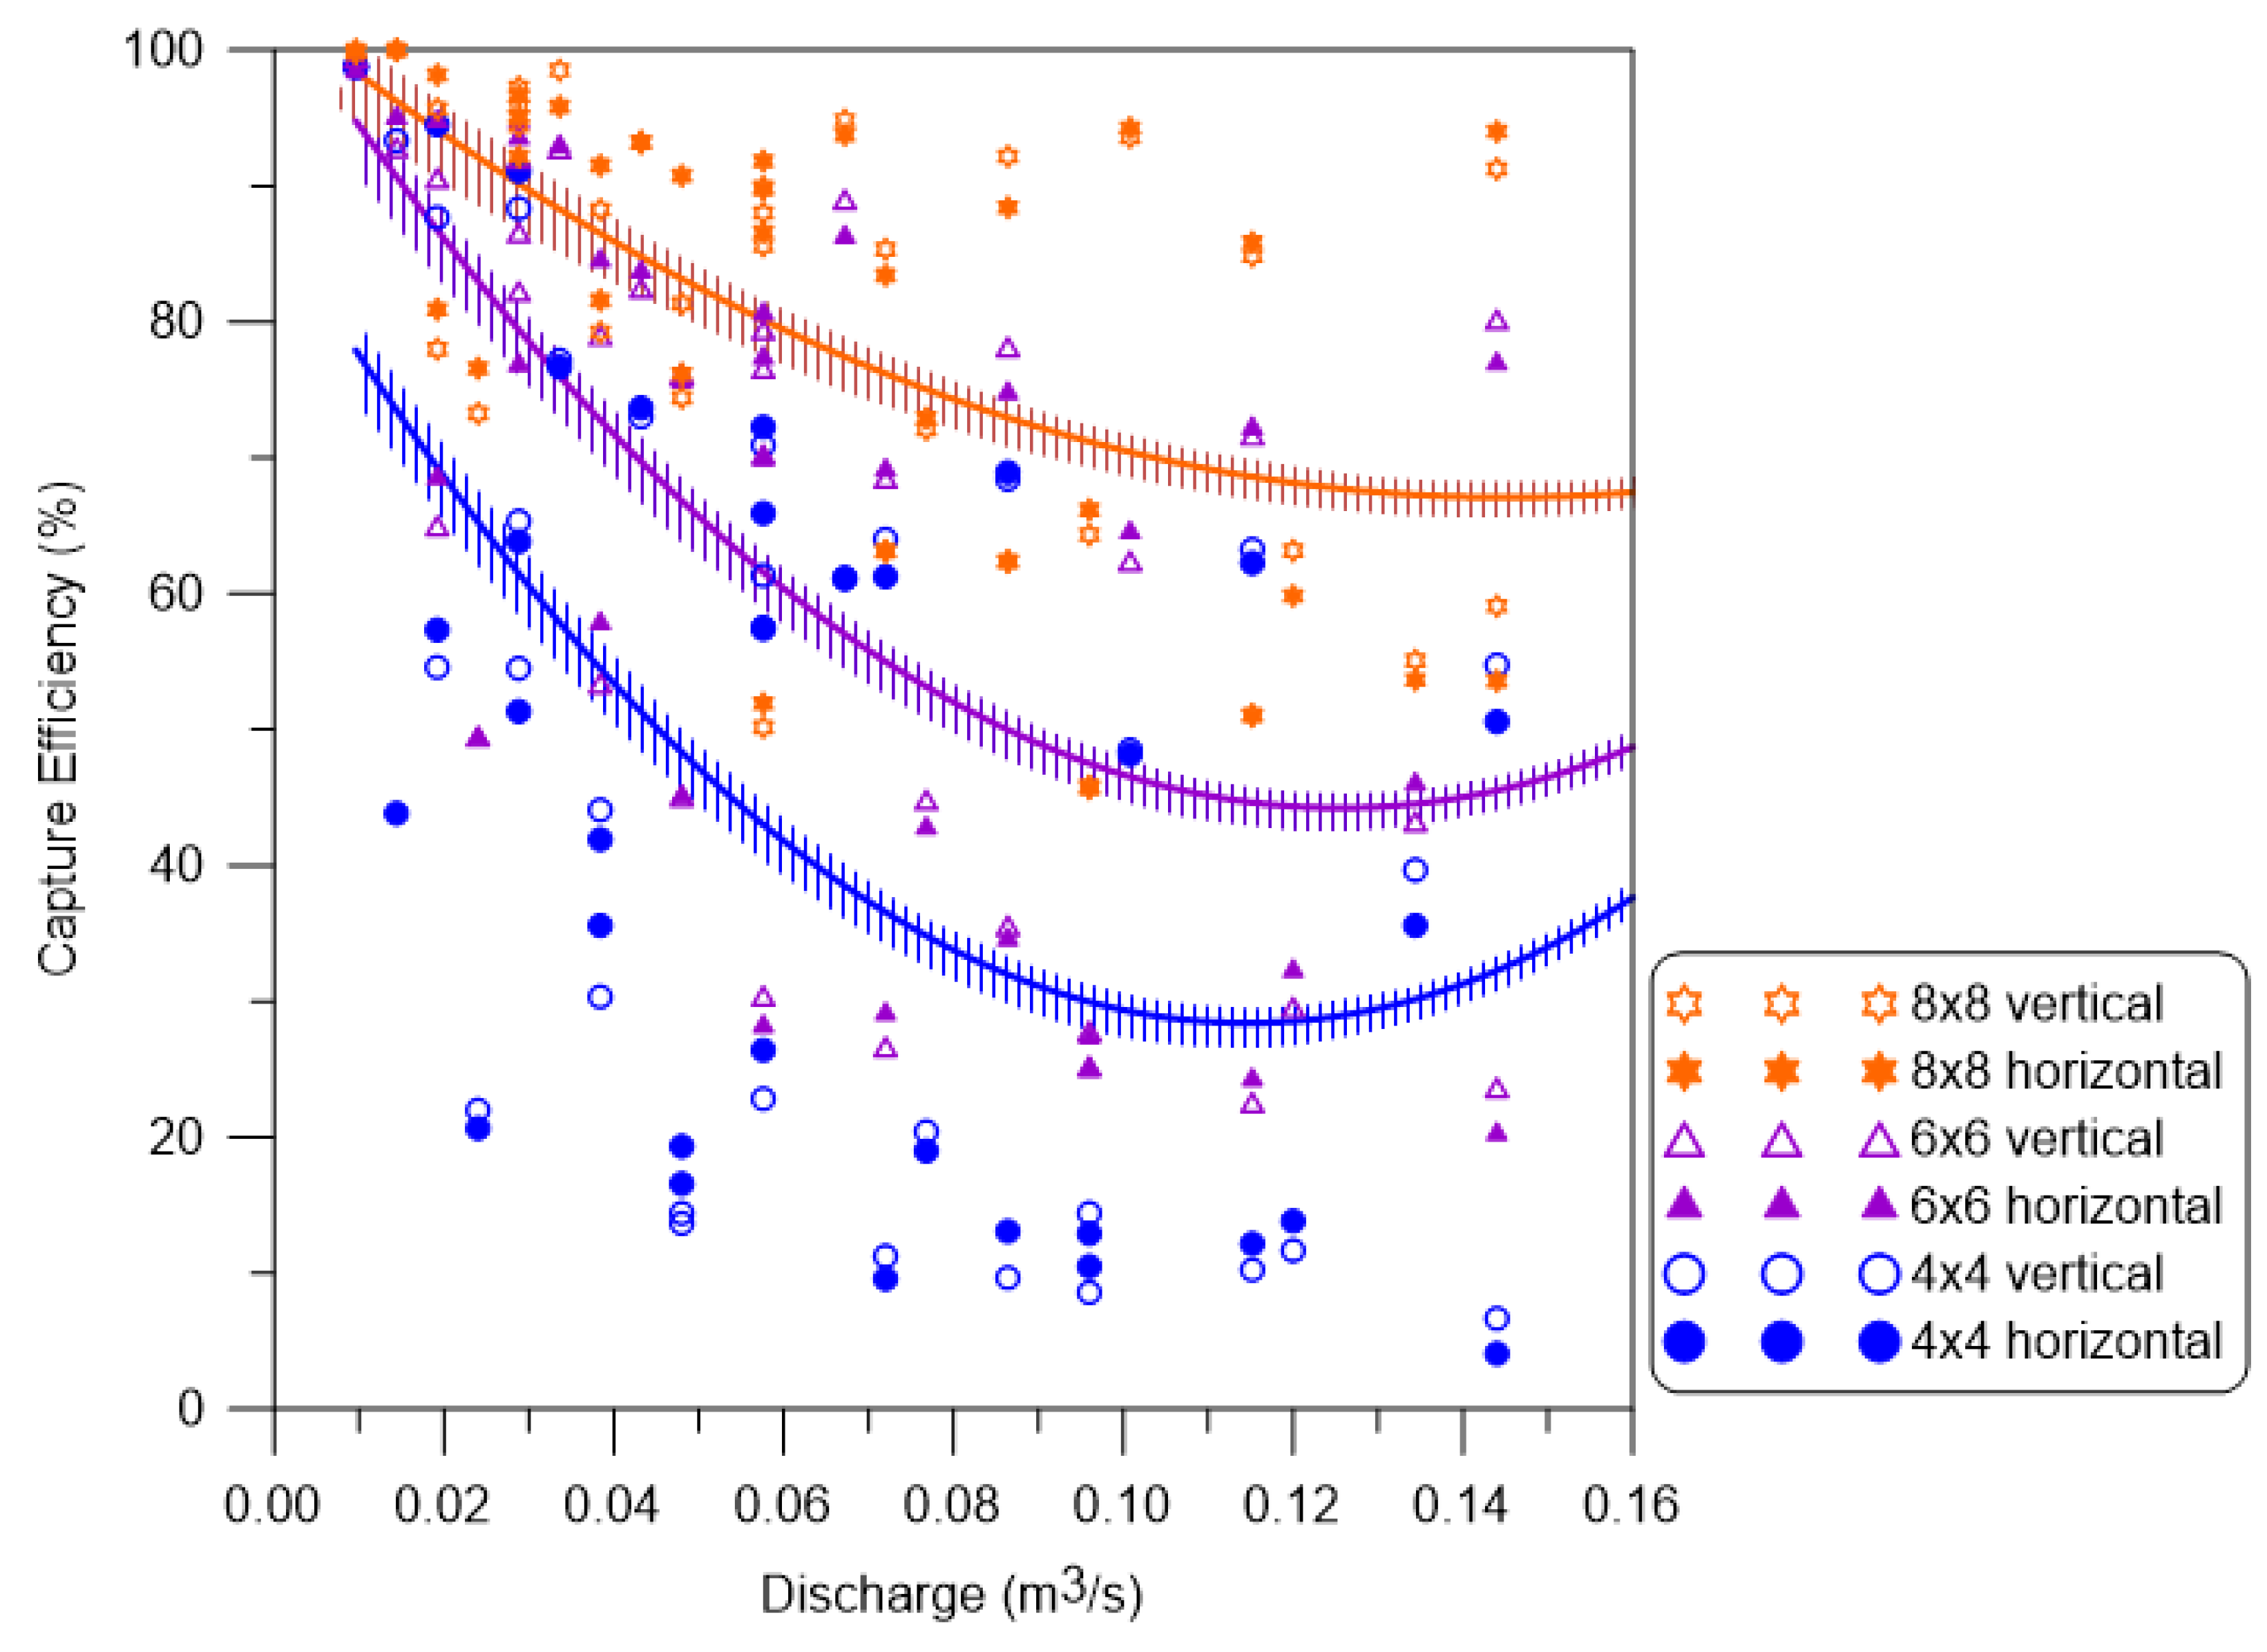
4.2. Deveopment of Capture Efficiency Equation for Debris in Reduction Facility

The capture efficiency was experimentally measured by inflow rates and the reduction facility types. The ranges of capture efficiency were 4.1~98.8% for 4 × 4 type, 20.3~99.4% for 6 × 6 type and 45.7~100.0% for 8 × 8 type. An appropriate reduction facility to reduce debris should be constructed by considering the drainage area or importance of agricultural drainage and following planned reduction. Figure 9 shows a 2D regression analysis to compute the capture efficiency by flow rates, considering all the inflow characteristics. This analysis showed that the capture efficiency decreased with the increasing flow rate, and increased or maintained under a flow rate over 0.12 m3/s. The minimum and maximum capture efficiencies obtained in the regression analysis were 20% and 80% for 4 × 4 type, 40% and 95% for 6 × 6 type, and 70% and 100% for 8 × 8 type, respectively. The regression analysis also considered the inflow characteristics by flow rate in Section 3.2.
In this study, the capture efficiency equation for reduction effect by flow rate was proposed through hydraulic experiments under various conditions for a reduction facility of agricultural drainage. It was shown that the design standard for the reduction facility is applicable when the cross-sectional area is under 0.16 m3/s. The capture efficiency and error ranges by flow rate were analyzed, and Table 7 shows the proposed capture efficiency for the reduction facility in agricultural drainage, where CE refers to the Capture Efficiency (%) and Q refers to the flow rate (m3/s).

5. Discussion

Agricultural drainage facilities are installed to manage the production of crops through water supply and drainage. Flow-rate control, cultivation methods and drainage systems were studied in various ways to improve crop production [2,3,4,5,6,7,8,9,10,11,12,13,14,15,16,17]. In spite of these efforts, if crops are flooded because of overflow damage due to the accumulation of debris in agricultural drainage, a huge amount of production is damaged. However, many studies have not been conducted on reduction facilities, design methods and management standards for disaster reduction in agricultural drainage.
In general drainage channels, related studies were performed on hydraulic experiments and numerical modeling for flow characteristics. Drainage mainly addressed the stability of the flow or change in the flow rate, but neglected damage reduction [19,20,21,22,23]. Disaster reduction of debris on sediment disaster and river disasters was studied through hydraulic experiments rather than small-scale drainage channels. Recently, the hydraulic experiment on a debris-reduction facility proposed by FHWA was performed, and the performance was tested by analyzing the aggregation level of debris [25,26,27,28,29,30,31,32,33,34,35,36,37,39].
In this study, a reduction facility was developed to reduce the accumulation of debris in agricultural drainage. The hydraulic experiment of a 1:1 scale, the best size to identify the hydraulic effect in agricultural drainage. The quantitative performance of the reduction facility as evaluated by measuring the capture efficiency in various inflow conditions. A reduction facility of agricultural drainage was constructed in three types according to the grid size, and experiments were conducted on various velocity and water levels.
The regression equation for capture efficiency was developed by including flow rate as an experiment condition to apply to various drainage areas. In addition, the regression equation was provided to construct a reduction facility that considers topography and debris characteristics by setting the design criteria and target-capture efficiency in agricultural drainage. Target-capture efficiency can be calculated based on the flow-rate condition according to the grid size of the reduction facility. However, the limit of the installation standard was made under the condition that the flow rate was 0.16 m3/s or less. The condition is to secure transportation capabilities and operate the reduced facilities safely even if transportation debris is deposited on farmland drains.
In this study, there are limitations in that it can be applied only to some subject areas due to the limitation of a reduction facility for agricultural drainage and the limitation of hydraulic experiments. In addition, conditions such as soil and gravel flowing into the agricultural drainage canal were not considered. In future studies, it is expected that the applicability of the reduction facility will be expanded if additional studies such as various reduction facilities and slope control of agricultural drainage are carried out.

6. Conclusions

In this study, a facility for the reduction of disasters caused by sedimentation of debris in agricultural drainage was developed, and its applicability was evaluated. The reduction facility was developed with reference to the FHWA and design criteria for a 400 mm agricultural drainage. Debris of crops, branches and other things were replaced by circular bars of various sizes and lengths. Three types of reduction facilities, 4 × 4, 6 × 6 and 8 × 8, were developed by considering the vertical and horizontal net distance of the agricultural drainage through which the debris passes and the hydraulic experiments performed on 216 conditions from velocity (six cases), depth (six cases) and drop conditions (two conditions).
The measured captures were 4.1~98.8% in 4 × 4 types, 20.3~99.4% in 6 × 6 types, and 45.7~100.0% in 8 × 8 types, respectively. The range of difference in capture efficiency depending on the inflow characteristics of the debris was found to be 1.67~6.08%. The error range of capture efficiency for all reduction facilities was −3.92~2.54%, which was calculated by the flow rate.
The regression equations were developed to construct the reduction facilities depending on the drainage area or importance, by considering all the inflow characteristics. The reduction facilities of the equation were CE = 87.38 − 1028.86 × Q + 4487.68 × Q2 for the 4 × 4 type, CE = 103.50 − 944.53 × Q + 3763.47 × Q2 for the 6 × 6 type, and CE = 103.01 − 459.38 × Q + 1707.52 × Q2 for the 8 × 8 type. The installation is possible only when the flow rate is over 0.16 m3/s and the error range of 2.5~6.5% should be considered depending on the inflow characteristics.
This study developed three types of reduction facilities to reduce the debris entering the agricultural drainage, tested the performance and developed the equation. Although the application of debris using hydraulic experiment has some limitation, the application of reduction facilities appropriate for various topographic characteristics and target-capture efficiency is expected.

Author Contributions

Conceptualization, M.P.; methodology, Y.S. and M.P.; validation, Y.S. and M.P.; formal analysis: Y.S.; resources, Y.S.; data curation, Y.S.; writing—original draft preparation, Y.S. and M.P.; writing—review and editing, M.P.; visualization, Y.S.; supervision, M.P.; project administration, M.P. All authors have read and agreed to the published version of the manuscript.

Funding

This research was funded by [the Fundamental Technology Development Program for Extreme Disaster Response] grant number [2019-MOIS31-010] And The APC was funded by [MOIS].

Informed Consent Statement

Informed consent was obtained from all subjects involved in the study.

Data Availability Statement

The data presented in this study are available on request from the corresponding author. The data are not publicly available due to [national policy research result].

Acknowledgments

This research was supported by a grant (2019-MOIS31-010) from the Fundamental Technology Development Program for Extreme Disaster Response funded by the Korean Ministry of Interior and Safety (MOIS).

Conflicts of Interest

The authors declare no conflict of interest.

References

  1. Zhu, Z.; Chen, Z.; Chen, X.; He, P. Approach for evaluating inundation risks in urban drainage systems. Sci. Total. Environ. 2016, 553, 1–12. [Google Scholar] [CrossRef] [PubMed]
  2. Singh, A. Poor-drainage-induced salinization of agricultural lands: Management through structural measures. Land Use Policy 2019, 82, 457–463. [Google Scholar] [CrossRef]
  3. Singh, A. Managing the environmental problems of irrigated agriculture through the appraisal of groundwater recharge. Ecol. Indic. 2018, 92, 388–393. [Google Scholar] [CrossRef]
  4. Bahçeci, I.; Dinc, N.; Tari, A.F.; Ağar, A.I.; Sönmez, B.; Tarı, A.F. Water and salt balance studies, using SaltMod, to improve subsurface drainage design in the Konya–Çumra Plain, Turkey. Agric. Water Manag. 2006, 85, 261–271. [Google Scholar] [CrossRef]
  5. Singh, A. Salinization of agricultural lands due to poor drainage: A viewpoint. Ecol. Indic. 2018, 95, 127–130. [Google Scholar] [CrossRef]
  6. Singh, A. Environmental problems of salinization and poor drainage in irrigated areas: Management through the mathematical models. J. Clean. Prod. 2019, 206, 572–579. [Google Scholar] [CrossRef]
  7. Schultz, B.; De Wrachien, D. Irrigation and drainage systems research and development in the 21st century. Irrig. Drain. 2002, 51, 311–327. [Google Scholar] [CrossRef]
  8. Sojka, M.; Kozłowski, M.; Stasik, R.; Napierała, M.; Kęsicka, B.; Wróżyński, R.; Jaskuła, J.; Liberacki, D.; Bykowski, J. Sustainable Water Management in Agriculture—The Impact of Drainage Water Management on Groundwater Table Dynamics and Subsurface Outflow. Sustainability 2019, 11, 4201. [Google Scholar] [CrossRef] [Green Version]
  9. Drury, C.F.; Tan, C.S.; Gaynor, J.D.; Oloya, T.O.; Welacky, T.W. Influence of Controlled Drainage-Subirrigation on Surface and Tile Drainage Nitrate Loss. J. Environ. Qual. 1996, 25, 317–324. [Google Scholar] [CrossRef]
  10. Jaynes, D.B. Changes in yield and nitrate losses from using drainage water management in central Iowa, United States. J. Soil Water Conserv. 2012, 67, 485–494. [Google Scholar] [CrossRef] [Green Version]
  11. Ritzema, H.; Stuyt, L. Land drainage strategies to cope with climate change in the Netherlands. Acta Agric. Scand. Sect. B-Plant Soil Sci. 2015, 65, 80–92. [Google Scholar] [CrossRef] [Green Version]
  12. Sunohara, M.D.; Gottschall, N.; Craiovan, E.; Wilkes, G.; Topp, E.; Frey, S.K.; Lapen, D.R. Controlling tile drainage during the growing season in Eastern Canada to reduce nitrogen, phosphorus, and bacteria loading to surface water. Agric. Water Manag. 2016, 178, 159–170. [Google Scholar] [CrossRef]
  13. Gunn, K.M.; Fausey, N.R.; Shang, Y.; Shedekar, V.S.; Ghane, E.; Wahl, M.D.; Brown, L.C. Subsurface drainage volume re-duction with drainage water management: Case studies in Ohio, USA. Agric. Water Manag. 2015, 149, 131–142. [Google Scholar] [CrossRef]
  14. Negm, L.M.; Youssef, M.A.; Jaynes, D.B. Evaluation of drainmod-dssat simulated eects of controlled drainage on crop yield, water balance, and water quality for a corn-soybean cropping system in central Iowa. Agric. Water Manag. 2017, 187, 57–68. [Google Scholar] [CrossRef] [Green Version]
  15. Youssef, M.A.; Abdelbaki, A.M.; Negm, L.M.; Skaggs, R.; Thorp, K.; Jaynes, D.B. Drainmod-simulated performance of controlled drainage across the U.S. Midwest. Agric. Water Manag. 2018, 197, 54–66. [Google Scholar] [CrossRef]
  16. Darzi-Naftchali, A.; Ritzema, H. Integrating Irrigation and Drainage Management to Sustain Agriculture in Northern Iran. Sustainability 2018, 10, 1775. [Google Scholar] [CrossRef] [Green Version]
  17. Darzi-Naftchali, A.; Shahnazari, A. Influence of subsurface drainage on the productivity of poorly drained paddy fields. Eur. J. Agron. 2014, 56, 1–8. [Google Scholar] [CrossRef]
  18. Valipour, M.; Krasilnikof, J.; Yannopoulos, S.; Kumar, R.; Deng, J.; Roccaro, P.; Mays, L.; Grismer, M.E.; Angelakis, A.N. The Evolution of Agricultural Drainage from the Earliest Times to the Present. Sustainability 2020, 12, 416. [Google Scholar] [CrossRef] [Green Version]
  19. Wong, T.S. Kinematic wave method for determination of road drainage inlet spacing. Adv. Water Resour. 1994, 17, 329–336. [Google Scholar] [CrossRef]
  20. Wong, T.S.W.; Moh, W.-H. Effect of maximum flood width on road drainage inlet spacing. Water Sci. Technol. 1997, 36, 241–246. [Google Scholar] [CrossRef]
  21. Tu, M.-C.; Traver, R.G. Optimal Configuration of an Underdrain Delivery System for a Stormwater Infiltration Trench. J. Irrig. Drain. Eng. 2019, 145, 05019007. [Google Scholar] [CrossRef]
  22. Liu, J.; Nakatani, K.; Mizuyama, T. Effect assessment of debris flow mitigation works based on numerical simulation by using Kanako 2D. Landslides 2013, 10, 161–173. [Google Scholar] [CrossRef]
  23. Song, Y.; Park, M. Development of Driftwood Capture Trellis for Capturing Driftwood in Agricultural Drainage Ditches. Appl. Sci. 2020, 10, 5805. [Google Scholar] [CrossRef]
  24. Johnson, P.A.; Hey, R.D.; Horst, M.W.; Hess, A.J. Aggradation at Bridges. J. Hydraul. Eng. 2001, 127, 154–157. [Google Scholar] [CrossRef]
  25. Schmocker, L.; Hager, W.H. Probability of Drift Blockage at Bridge Decks. J. Hydraul. Eng. 2011, 137, 470–479. [Google Scholar] [CrossRef]
  26. Schmocker, L.; Hager, W.H. Scale Modeling of Wooden Debris Accumulation at a Debris Rack. J. Hydraul. Eng. 2013, 139, 827–836. [Google Scholar] [CrossRef]
  27. Chin, D.A. Hydraulic Analysis and Design of Pipe Culverts: USGS versus FHWA. J. Hydraul. Eng. 2013, 139, 886–893. [Google Scholar] [CrossRef]
  28. Dasika, B. New Approach to Design of Culverts. J. Irrig. Drain. Eng. 1995, 121, 261–264. [Google Scholar] [CrossRef]
  29. Hager, W.H.; DEL Giudice, G. Generalized Culvert Design Diagram. J. Irrig. Drain. Eng. 1998, 124, 271–274. [Google Scholar] [CrossRef]
  30. Meselhe, E.A.; Hebert, K. Laboratory Measurements of Flow through Culverts. J. Hydraul. Eng. 2007, 133, 973–976. [Google Scholar] [CrossRef]
  31. Guven, A.; Hassan, M.; Sabir, S. Experimental investigation on discharge coefficient for a combined broad crested weir-box culvert structure. J. Hydrol. 2013, 500, 97–103. [Google Scholar] [CrossRef]
  32. Shields, F.D.; Gippel, C.J. Prediction of Effects of Woody Debris Removal on Flow Resistance. J. Hydraul. Eng. 1995, 121, 341–354. [Google Scholar] [CrossRef]
  33. Braudrick, C.; Grant, G.E. When do logs move in rivers? Water Resour. Res. 2000, 36, 571–583. [Google Scholar] [CrossRef] [Green Version]
  34. Manga, M.; Kirchner, J.W. Stress partitioning in streams by large woody debris. Water Resour. Res. 2000, 36, 2373–2379. [Google Scholar] [CrossRef] [Green Version]
  35. Wallerstein, N.P.; Alonso, C.V.; Bennett, S.J.; Thorne, C.R. Surface Wave Forces Acting on Submerged Logs. J. Hydraul. Eng. 2002, 128, 349–353. [Google Scholar] [CrossRef]
  36. Manners, R.B.; Doyle, M.W.; Small, M.J. Structure and hydraulics of natural woody debris jams. Water Resour. Res. 2007, 43, W06432. [Google Scholar] [CrossRef]
  37. Melville, B.W.; Dongol, D.M. Bridge Pier Scour with Debris Accumulation. J. Hydraul. Eng. 1992, 118, 1306–1310. [Google Scholar] [CrossRef]
  38. Gippel, C.J. Environmental Hydraulics of Large Woody Debris in Streams and Rivers. J. Environ. Eng. 1995, 121, 388–395. [Google Scholar] [CrossRef]
  39. Bradley, J.B.; Richards, D.L.; Bahner, C.D. Debris Control Structures: Evaluation and Countermeasures, 1st ed.; U.S. Department of Transportation: Washington, DC, USA, 2005.
  40. Ministry of Land, Transport and Maritime Affairs. Urban Roadway Design Guideline, 1st ed.; Ministry of Land, Transport and Maritime Affairs: Goyang-si, Korea, 2012.
  41. Korea Expressway Corporation. Design Criteria for the Roads in Mountain Area, 1st ed.; Korea Expressway Corporation: Sejong-si, Korea, 2006. [Google Scholar]
  42. Ministry of Land, Infrastructure and Transport. Slope Drainage Design Guideline, 1st ed.; Ministry of Land, Infrastructure and Transport: Jinju-si, Korea, 2016.
  43. Ministy of Agriculture, Forestry and Flsheries. Land Improvement Project Plan Design Standard Plan, 1st ed.; Ministy of Agriculture, Forestry and Flsheries: Tokyo, Japan, 2019.
  44. Town of Castle Rock. Storm Drainage Design and Technical Criteria Manual, 1st ed.; Town of Castle Rock: Castle Rock, CO, USA, 2019.
Figure 1. Debris Reduction Facility (FHWA): (a) Steel debris in urban area; (b) Steel rail debris deflector; (c) Debris deflector designed in example.
Sustainability 13 09595 g001
Figure 2. Debris with Size Allowing Entrance into Agricultural Drainage.
Sustainability 13 09595 g002
Figure 3. Design of Reduction Facility.
Sustainability 13 09595 g003
Figure 4. Hydraulic Lab for Agricultural Drainage: (a) Water Tank; (b) Pump Facilities; (c) Head Tank; (d) Rectifying Tank; (e) Agricultural Drainage; (f) Return Tank.
Sustainability 13 09595 g004
Figure 5. Reduction Facilities for Agricultural Drainage: (a) 4 × 4; (b) 6 × 6; (c) 8 × 8.
Sustainability 13 09595 g005
Figure 6. Flow Characteristics by Inflow of Debris into Agricultural Drainage.
Sustainability 13 09595 g006
Figure 7. Range of Capture Efficiency by Inflow Characteristics: (a) Horizontal Drop Conditions; (b) Vertical Drop Conditions.
Sustainability 13 09595 g007
Figure 8. Error Range by Inflow Characteristics of Reduction Facilities.
Sustainability 13 09595 g008
Figure 9. Analysis of Capture Efficiency Performance in Consideration of Error Range.
Sustainability 13 09595 g009
Table 1. Characteristics of Debris by Size.
RangeCountRatio (%)
Diameter > 1 mm00.0
1 mm < Diameter > 2 mm164.6
2 mm < Diameter > 3 mm4613.1
3 mm < Diameter > 4 mm6518.6
4 mm < Diameter > 5 mm5916.9
5 mm < Diameter > 6 mm4412.6
6 mm < Diameter > 7 mm349.7
7 mm < Diameter > 8 mm164.6
8 mm < Diameter > 9 mm164.6
9 mm < Diameter > 10 mm92.6
10 mm < Diameter > 11 mm72.0
11 mm < Diameter > 12 mm82.3
12 mm < Diameter > 13 mm61.7
13 mm < Diameter > 14 mm51.4
14 mm < Diameter > 15 mm61.7
15 mm < Diameter > 16 mm20.6
16 mm < Diameter > 17 mm10.3
17 mm < Diameter > 18 mm30.9
18 mm < Diameter > 19 mm20.6
19 mm < Diameter > 20 mm10.3
20 mm < Diameter41.1
Sum350100.0
Length90 mm~250 mm
Table 2. Specification of Reduction Facility.
Agricultural Drainage (B)Overflow Height (y)Reduction FacilityHorizontal Net Distance (d1)Vertical Net Distance (d2)Effective Cross-Sectional Area (A)
400 mm80 mm4 × 496 mm75 mm7200 mm2
6 × 663 mm48 mm3024 mm2
8 × 846 mm35 mm1610 mm2
B, y, d1, d2, A is a parameter for the reduction facility for agricultural drainage of Figure 3.
Table 3. Specifications of Laboratory Facilities.
ContentsFacilitiesDimension
(Width × Depth × Height)
Capacity
(a)Water Tank11 m × 6.85 m × 0.7 m52.8 m3
(b)Pump Facilities15 HP × 2, 10 HP × 10.33 m3/s
(c)Head Tank4 m × 6 m × 2 m48.0 m3
(d)Rectifying Tank5 m × 4 m × 0.7 m14.0 m3
(e)Agricultural Drainage0.4 m × 8.75 m × 0.4 m1.4 m3
(f)Return Tank14 m × 1.5 m × 0.2 m4.2 m3
Table 4. Specification of Debris for Hydraulic Experiment.
DebrisLength (mm)Diameter (mm)CountEffective Cross Sectional Area (mm2)
Sustainability 13 09595 i0011603125760
5129600
71213,440
101016,000
121019,200
Sum4164,000
Table 5. Conditions of Hydraulic Experiment.
Agricultural Drainage (m)Reduction FacilityVelocity (m/s)Depth (m)No. of Debris Drops
4004 × 4 grid
6 × 6 grid
8 × 8 grid
0.30.08Horizontal drop conditions: 3 times
Vertical drop condition: 3 times
(1 drop of debris = 41 pieces, ø 3 mm~ø 12 mm in diameter)
0.60.12
0.90.16
1.20.20
1.50.24
1.80.28
Number of Experiment RunsHorizontal drop conditions: 324
Vertical drop condition: 324
Table 6. Error Range Analysis by Inflow Characteristics and Flow Rate.
Flow Rate (m3/s)Error Range of Capture Efficiency (%)
PositiveNegativeError Range
0.0002.54−3.926.47
0.0102.34−3.696.03
0.0142.24−3.585.83
0.0192.15−3.485.63
0.0242.06−3.375.43
0.0291.98−3.275.24
0.0341.89−3.175.06
0.0381.82−3.074.89
0.0431.74−2.974.72
0.0481.67−2.884.55
0.0581.54−2.704.24
0.0671.42−2.543.96
0.0721.37−2.453.82
0.0771.32−2.383.70
0.0861.23−2.233.46
0.0961.16−2.093.25
0.1011.13−2.023.15
0.1151.06−1.842.90
0.1201.04−1.792.83
0.1341.02−1.642.65
0.1441.02−1.552.56
Table 7. Development of Capture Efficiency Equation by Reduction Facility.
Reduction FacilityEquation
4 × 4CE = 87.38 − 1028.86 × Q + 4487.68 × Q2
6 × 6CE = 103.50 − 944.53 × Q + 3763.47 × Q2
8 × 8CE = 103.01 − 459.38 × Q + 1707.52 × Q2
Application CriteriaQ ≥ 0.16 m3/s
Error RangeQ ≤ 0.05 m3/s = 4.5%~6.5%, 0.05 m3/s ≤ Q ≥ 0.10 m3/s = 3.3%~4.5%, 0.10 m3/s ≤ Q ≥ 0.16 m3/s = 2.5%~3.3%
Publisher’s Note: MDPI stays neutral with regard to jurisdictional claims in published maps and institutional affiliations.

