Article

Measurement of Indoor Air Pollution in Bhutanese Households during Winter: An Implication of Different Fuel Uses

by
Thipsukon Khumsaeng
1,2 and
Thongchai Kanabkaew
3,*
1
Department of Physics and Materials Science, Faculty of Science, Chiang Mai University, Chiang Mai 50200, Thailand
2
Environmental Science Research Center (ESRC), Faculty of Science, Chiang Mai University, Chiang Mai 50200, Thailand
3
Faculty of Public Health, Thammasat University, Pathum Thani 12120, Thailand
*
Author to whom correspondence should be addressed.
Sustainability 2021, 13(17), 9601; https://doi.org/10.3390/su13179601
Submission received: 5 August 2021 / Revised: 19 August 2021 / Accepted: 23 August 2021 / Published: 26 August 2021

Abstract

:
Measurements of indoor air pollution in Bhutanese households were conducted in winter with regards to the use of different fuels. These measurements were taken in Thimphu, Bhutan, for PM1, PM2.5, PM10, CO, temperature, air pressure and relative humidity in houses and offices with various fuels used for heaters and classified as the hospital, NEC, kerosene, LPG and firewood. The objective of this study was to measure the pollutant concentrations from different fuel uses and to understand their relationship to the different fuel uses and meteorological data using a time series and statistical analysis. The results revealed that the average values for each pollutant for the categories of the hospital, NEC, kerosene, LPG and firewood were as follows: CO (ppm) were 6.50 ± 5.16, 3.65 ± 1.42, 31.04 ± 18.17, 33.93 ± 26.41, 13.92 ± 17.58, respectively; PM2.5 (μg·m−3) were 7.24 ± 4.25, 4.72 ± 0.71, 6.01 ± 3.28, 5.39 ± 2.62, 18.31 ± 11.92, respectively; PM10 (μg·m−3) was 25.44 ± 16.06, 10.61 ± 4.39, 11.68 ± 6.36, 22.13 ± 9.95, 28.66 ± 16.35, respectively. Very coarse particles of PM10 were identified by outdoor infiltration for the hospital, NEC, kerosene and LPG that could be explained by the stable atmospheric conditions enhancing accumulation of ambient air pollutions during the measurements. In addition, high concentrations of CO from kerosene, LPG and firewood were found to be mainly from indoor fuel combustion. Firewood was found to the most polluting fuel for particulate matter concentrations. For the relationships of PM and meteorological data (Temp, RH and air pressure), they were well explained by linear regression while those for CO and the meteorological data, they were well explained by polynomial regression. Since around 40% of houses in Thimphu, Bhutan, use firewood for heating, it is recommended that ventilation should be improved by opening doors and windows in houses with firewood heaters to help prevent exposure to high concentrations of PM1, PM2.5, and PM10.

1. Introduction

The World Health Organization (WHO) has advised that certain pollutants can cause adverse effects on human health when indoors. These pollutants are formaldehyde, carbon monoxide (CO), benzene, naphthalene, nitrogen oxides (NOx), polycyclic aromatic hydrocarbons (PAHs), radon, trichloroethylene and tetrachloroethylene [1,2,3]. CO is one of the major indoor air pollutants which has a threshold limit value of CO of 100 ppm for 15 min [4]. Normally, indoor air emissions from households are from cooking and heating activities with coal, wood, liquid petroleum gas (LPG) and natural gas etc. Furthermore, particulate matter (PM) such as ultrafine particles (UFPs) and secondary organic aerosol (SOA) were released after burning [5,6,7]. People living in houses where they are exposed to such pollutants for more than 6 h per day can be affected by them both at night and during the day [8] leading to increased risks of morbidity and mortality. Opening doors and windows can help dilute indoor pollution with significant rates of ventilation. The better the air quality inside the houses, the lower the air pollution concentrations which can affect health [9].
In Bhutan, there are four types of energy consumption in urban areas which are firewood (91%), electricity (4%), kerosene (3%) and LPG (2%). The population in the capital city, Thimphu, is around 113,669 as estimated in 2014 by the National Statistics Bureau of Bhutan. There are 432 households in Thimphu. For cooking, it was found that 1% of Thimphu households use kerosene, 3% use firewood, 81% use LPG and 1% use other fuels. For heating, 55% of Thimphu households use electricity, 42% use firewood and 3% use other fuels. For other cities, kerosene is mostly used for heating in Trashigang (15%) and Paro (7%). For heating water, around 3% of Paro households use kerosene and 20% use firewood and 33% of Thimphu households also firewood [10,11,12,13].
Kerosene is a liquid mixture of chemicals produced from crude oil. It is used in lamps and airplanes. It is also used in households in other developing countries as fuel for lighting and heating. However, there are by-products from heating kerosene which are CO, NOx, sulfur dioxide (SO2) and fine PM [14]. Black carbon is also emitted from kerosene lamps in households globally that are estimated at around 270,000 tons per year [15]. These pollutants affect not only human health, but also the climate [16]. LPG produces emissions from fuel combustion such as particulate matter with a diameter of less than 2.5 μm (PM2.5), as well as SO2, NOx, CO and volatile organic compounds (VOCs). Wood heaters/stoves generate PM, PAHs, CO, CO2, etc. [17,18,19]. The combustion of firewood, kerosene and LPG generates toxic air pollutants into the environment and can cause transboundary movement from one place to another [20]. Thus, ambient air monitoring should be regularly conducted together with indoor air sampling, particularly in winter, to investigate and understand the relationship between indoor and outdoor pollutants, and to mitigate the effects on human health.
In addition to different indoor fuel uses, meteorological data affect the distribution of air pollution concentrations both indoors and outdoors. With regards to outdoor air pollution, the environmental parameters that affect the concentration of pollutants are wind speed, temperature (Temp), relative humidity (RH), mixing height (MH) and air pressure, etc. [21]. On the other hand, the most effective parameters of indoor air pollution which are also linked to outdoor pollution are air pressure, Temp, number of ventilation sites, location of the sources of emission and the design of rooms and buildings [22]. In addition, meteorological parameters have been found to be important in influencing and interacting with air pollutants [23,24,25,26,27]. Favorable meteorological conditions can induce the diffusion of air pollutants to improve air quality. However, there are not many studies which focus on indoor air pollution in relation to meteorological parameters. Thus, the correlation between air pollutants and meteorological data needs to be considered [28].
In Bhutan, there have been several studies investigating indoor and outdoor air pollutions. Wangchuk et al. [29] investigated associations between indoor air pollution and human exposures in school children in the dry season (October to November 2013) and found that the highest contribution to the total daily ultrafine particles (unit: particles.cm−3) exposure was during times of cooking and eating at home. Seasonal variations were found to be a key parameter influencing the higher level of ultrafine particles exposure in the dry season than the wet season in Bhutan [30]. Ambient annual average PM10 concentrations in Thimphu recorded at NEC station were 28, 47, 43, 42 µg.m−3 in 2005, 2010, 2014 and 2015, respectively. High PM10 concentrations were found in the winter months. The main emission sources were from transportation, industry, residential activity, waste generation, agriculture activity, forest fire and transboundary [31].
As a result of recent developments in sensor technology, high temporal resolution of the data is available. This present research study emphasizes the high temporal resolution measurement of indoor air particles including PM1, PM2.5, PM10, and CO concentrations produced by kerosene, LPG, firewood and electric heaters in Bhutanese households in December 2016 and it further investigates the relationship of the contributions of different fuels and meteorological data on indoor pollutant concentrations.

2. Materials and Methods

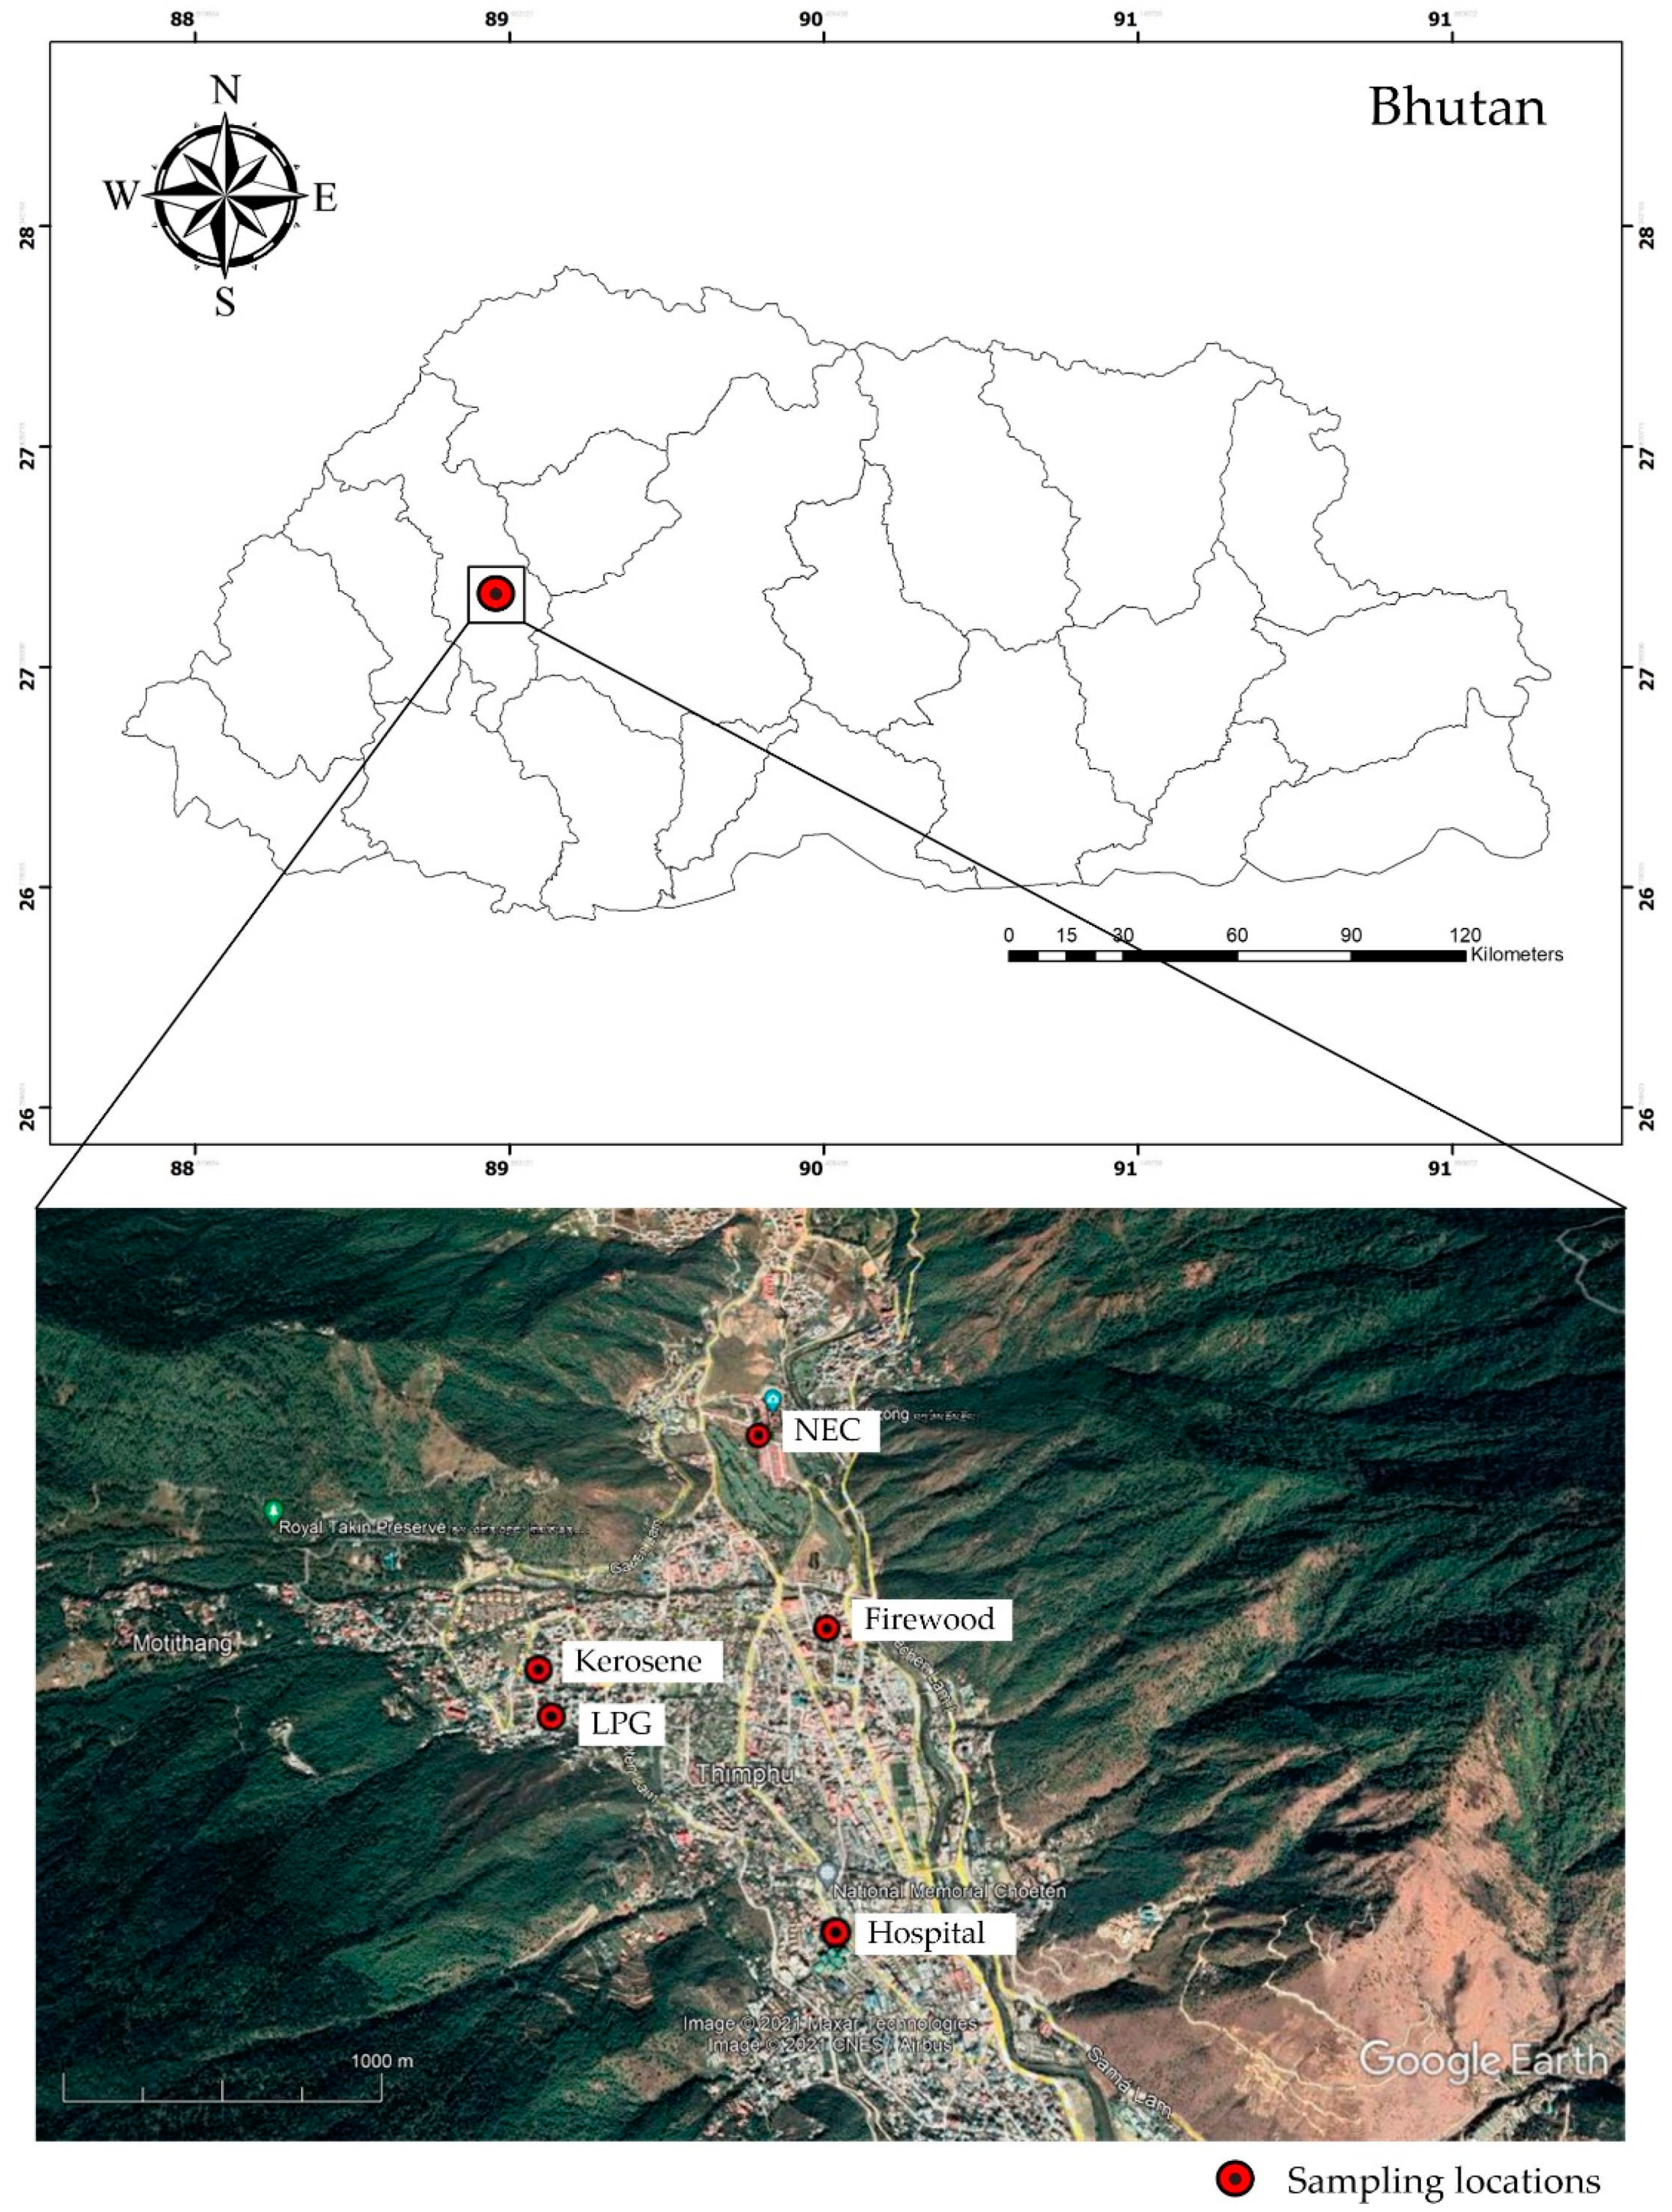
2.1. Data Collection

Microcontroller sensors were used to collect indoor particles and CO in Bhutanese houses and offices. A microcontroller can measure PM1, PM2.5, PM10, CO, Temp, air pressure and RH with the use of one board (Table 1). The board contains sensors that collect all of the pollutants at different times depending on the time delay of each sensor. The data were transferred from the sampling equipment to a personal computer by 3G network through a mobile phone. The equipment used in this study was waspmote plug and sense (Smart Environment Pro, 3G model: SEP-3G-E; https://www.libelium.com/iot-products/plug-sense/#smart-environment-pro, accessed on 9 July 2021). All sensors were calibrated by the manufacturer.
There are four types of heaters used in Bhutan including kerosene, LPG, firewood and electric heaters. In this study, each location used a different type of fuel, and this was duplicated for sampling (Table 2). The starting time for the experiment depended on the normal use of each house. However, the finishing time of each experiment was approximately 8 h after the starting time. The location of the house that used the kerosene heater is at 27°47′49″ N and 89°62′46″ E. The house that used LPG is located at 27°47′27″ N and 89°62′54″ E. The house that used firewood is at 27°47′76″ N and 89°63′78″ E. Two electric heaters were used in this study that were located, firstly, at the NEC office at 27°48′79″ N and 89°63′42″ E and, secondly, is at the hospital at 27°46′41″ N and 89°63′82″ E (see also Figure 1).
The measurements were conducted under the normal operation of heaters by owners. The starting time of sampling data depended on the time that owners started to use their heaters. Normally, the heaters (kerosene, LPG and firewood) were started in the afternoon until the owners slept, except electrical heaters used at office time. Most times for the experiment periods were from 13:00 to 21:00 (local time) for the houses with kerosene, LPG and firewood heaters, but the government sites with electric heaters (hospital and NEC) were sampled during the daytime (approximately 9:00 to 17:00).
At NEC office, Day 1: sampling location was in the monitoring division room with the size of 3 m × 5 m × 8 m and Day 2: sampling location was in the climate change division room with the size of 3.5 m × 11 m × 3 m. The officers used their individual heaters near their feet.
At the house with kerosene heater, the sampling location was in a bedroom with the size of 3.5 m × 4 m × 3.5 m. The kerosene heater was placed at the middle location of the room.
At the house with the LPG heater, the sampling location was in the living room with the size of 4 m × 4.5 m × 3.5 m. The LPG heater was placed at the middle location of the room.
At the house with firewood heater, the sampling location was in the living room with the size of 6.5 m × 7 m × 3.5 m. The firewood heater was placed at the middle location of the room and continuous supplied by 2 years dried wood.
At the hospital, the sampling room size was around 8 m × 16 m × 3.5 m, and it was openly connected with other rooms in the building. The electric heaters were fixed on the walls.

2.2. Data Analysis

In this study, the time for the retrieval of data from each sensor, i.e., CO, PM1, PM2.5, PM10, Temp, air pressure and RH was averaged for 15 min intervals before being further analyzed. Several techniques of statistical analysis were used to understand the different impacts of fuel uses on the level of CO and the PM concentrations. The relationships between the pollutants and the meteorological parameters were also explored. An open-source software, R package, which has been widely used for statistical analysis in various works on air pollution was used [21,32].

2.2.1. Time-Series Analysis

Fifteen minute data of indoor CO, PM1, PM2.5 and PM10 were plotted for each day and each sampling location of heaters with different fuels: kerosene, LPG, firewood and electric heaters.

2.2.2. Impacts of Different Fuel Uses

During the winter season, Bhutanese’s households keep themselves warm using various fuels [13]. Low quality fuels can induce high levels of indoor air pollution that subsequently affect human health [33,34]. Thus, it is important to understand how different sources of fuel impact on the levels of indoor air pollution. Boxplot and analysis of variance (ANOVA) from R package were used to show the impacts and identify the confidence levels in the statistical analyses, respectively.

2.2.3. The Relationship between Air Pollutants and Meteorological Parameters

Interactions between air pollutants and meteorological parameters are complex [35]; however, the meteorological data can help us to understand the formation and destruction of the pollutants both by temporal and spatial distribution [36]. Correlation matrices were used for both linear and polynomial regressions for all air pollutants and meteorological data to explore their relationships [37].

3. Results and Discussion

3.1. Time-Series Analysis

Results from the measurement of indoor air pollutants in Thimphu, Bhutan, included CO, PM1, PM2.5 and PM10 for different types of fuel uses in households as shown in Table 3. Levels of CO concentrations were found to be highest in households with LPG (34 ppm) followed by kerosene (33 ppm) and firewood (14 ppm). For fine PM, PM1 and PM2.5, households using firewood showed the highest values of 15 μg·m−3 and 18 μg·m−3 while those for coarse particles, PM10, were also the highest in households using firewood (29 μg·m−3) and, remarkably, the second highest values of PM10 were in the hospital (25 μg·m−3). The average ratios of PM1/PM2.5 were 0.66–0.68 for electric heaters in the hospital and NEC and 0.80–0.81 for kerosene and firewood. The PM2.5/PM10 fine to coarse ratio were 0.28, 0.44, 0.51, 0.24 and 0.64 for the hospital, NEC, kerosene, LPG and firewood, respectively.
To visualize and explore the temporal variation of each pollutant, 15 min data were plotted in Figure 2. We found fine particles, PM1 and PM2.5 concentrations were quite stable for hospital, NEC, kerosene and LPG whereas they were fluctuated for firewood. For coarse particles, PM10, the concentrations for all sources were largely fluctuated, except for NEC. Similar to PM10, CO concentrations were also largely altered, except also for NEC. It is remarkable that the time series plots of all indoor air pollutants (PM1, PM2.5, PM10 and CO) from firewood were in the similar trend.
Fluctuating and high concentrations of PM10 in heaters with cleaner fuels, in terms of particle emissions, such as electricity, kerosene and LPG [38] could be affected by outdoor emission sources. For instance, as located in the city and tourist area, high PM10 concentrations at the hospital could be from traffic and worship activity. In addition, during the sampling period in December 2016, the weather in Thimphu was stable under a strong inversion layer; thus, high concentrations of outdoor pollutants could be moved to indoor. The analysis and discussion of meteorological and atmospheric conditions were highlighted at the last paragraph of this section. In many studies, outdoor air quality was found to be a main source for indoor air quality [39]. Indoor and outdoor ratio (I/O) of PM10 in the room without source of PM emissions and low human activity was reported to be about 0.7 [40] that implicate effects of outdoor sources. In the opposite directions, the I/O of PM10 in the room with high activity of human and indoor sources was reported to be more than 1.0 [41]. For house with firewood heater, levels on PM1, PM2.5 and PM10 concentrations were in the similar variation pattern and could be affected by indoor sources. Wood burning emits high concentrations of PM due to its incomplete combustion and ash contents [38].
For CO, high concentrations were found in houses with kerosene, LPG and firewood heaters whereas low CO concentrations were found in electric heaters (see Figure 2). CO is a product of incomplete combustion and found in similar ranges of emissions for kerosene and LPG, but could vary for wood burning which depends on its type and moisture content [38]. Naeher et al. [42] reported higher concentrations of CO were found in indoor than in outdoor. I/O of CO is significantly higher than 1.0 and was reported to be as high as 13.0 [43].
For outdoor meteorological conditions, the atmosphere in Thimphu, Bhutan during the measurement (December 2016) was mostly stable at all times, except during 06z (12:00 local time) which induced a chance to happen marginal instability about 3 days among 10 days. This occurrence was in accordance with the change of RH from day to day. With the high RH (>60%), water vapor made the air weigh lighter than a common condition of low RH (<40%) causing disturbances in the vertical air movement. Wind system in this basin, especially along north to south direction had changed direction rapidly from day to day due to its geographical terrain (see also Figure 1). The terrain lays like a rectangular shape from north to south. Thus, the effect of valley and mountain breeze was dominated to the vertical wind profile. During December 2016, atmospheric inversion was found on the bottom air layer during daytime from 6:00 to 12:00 and from 18:00 through the whole night. These layers (every sampling day) were thick enough to cover all people living in this area and the neighborhood. This inhibited air to vertically rise from the surface up to 3086–3172 m height.

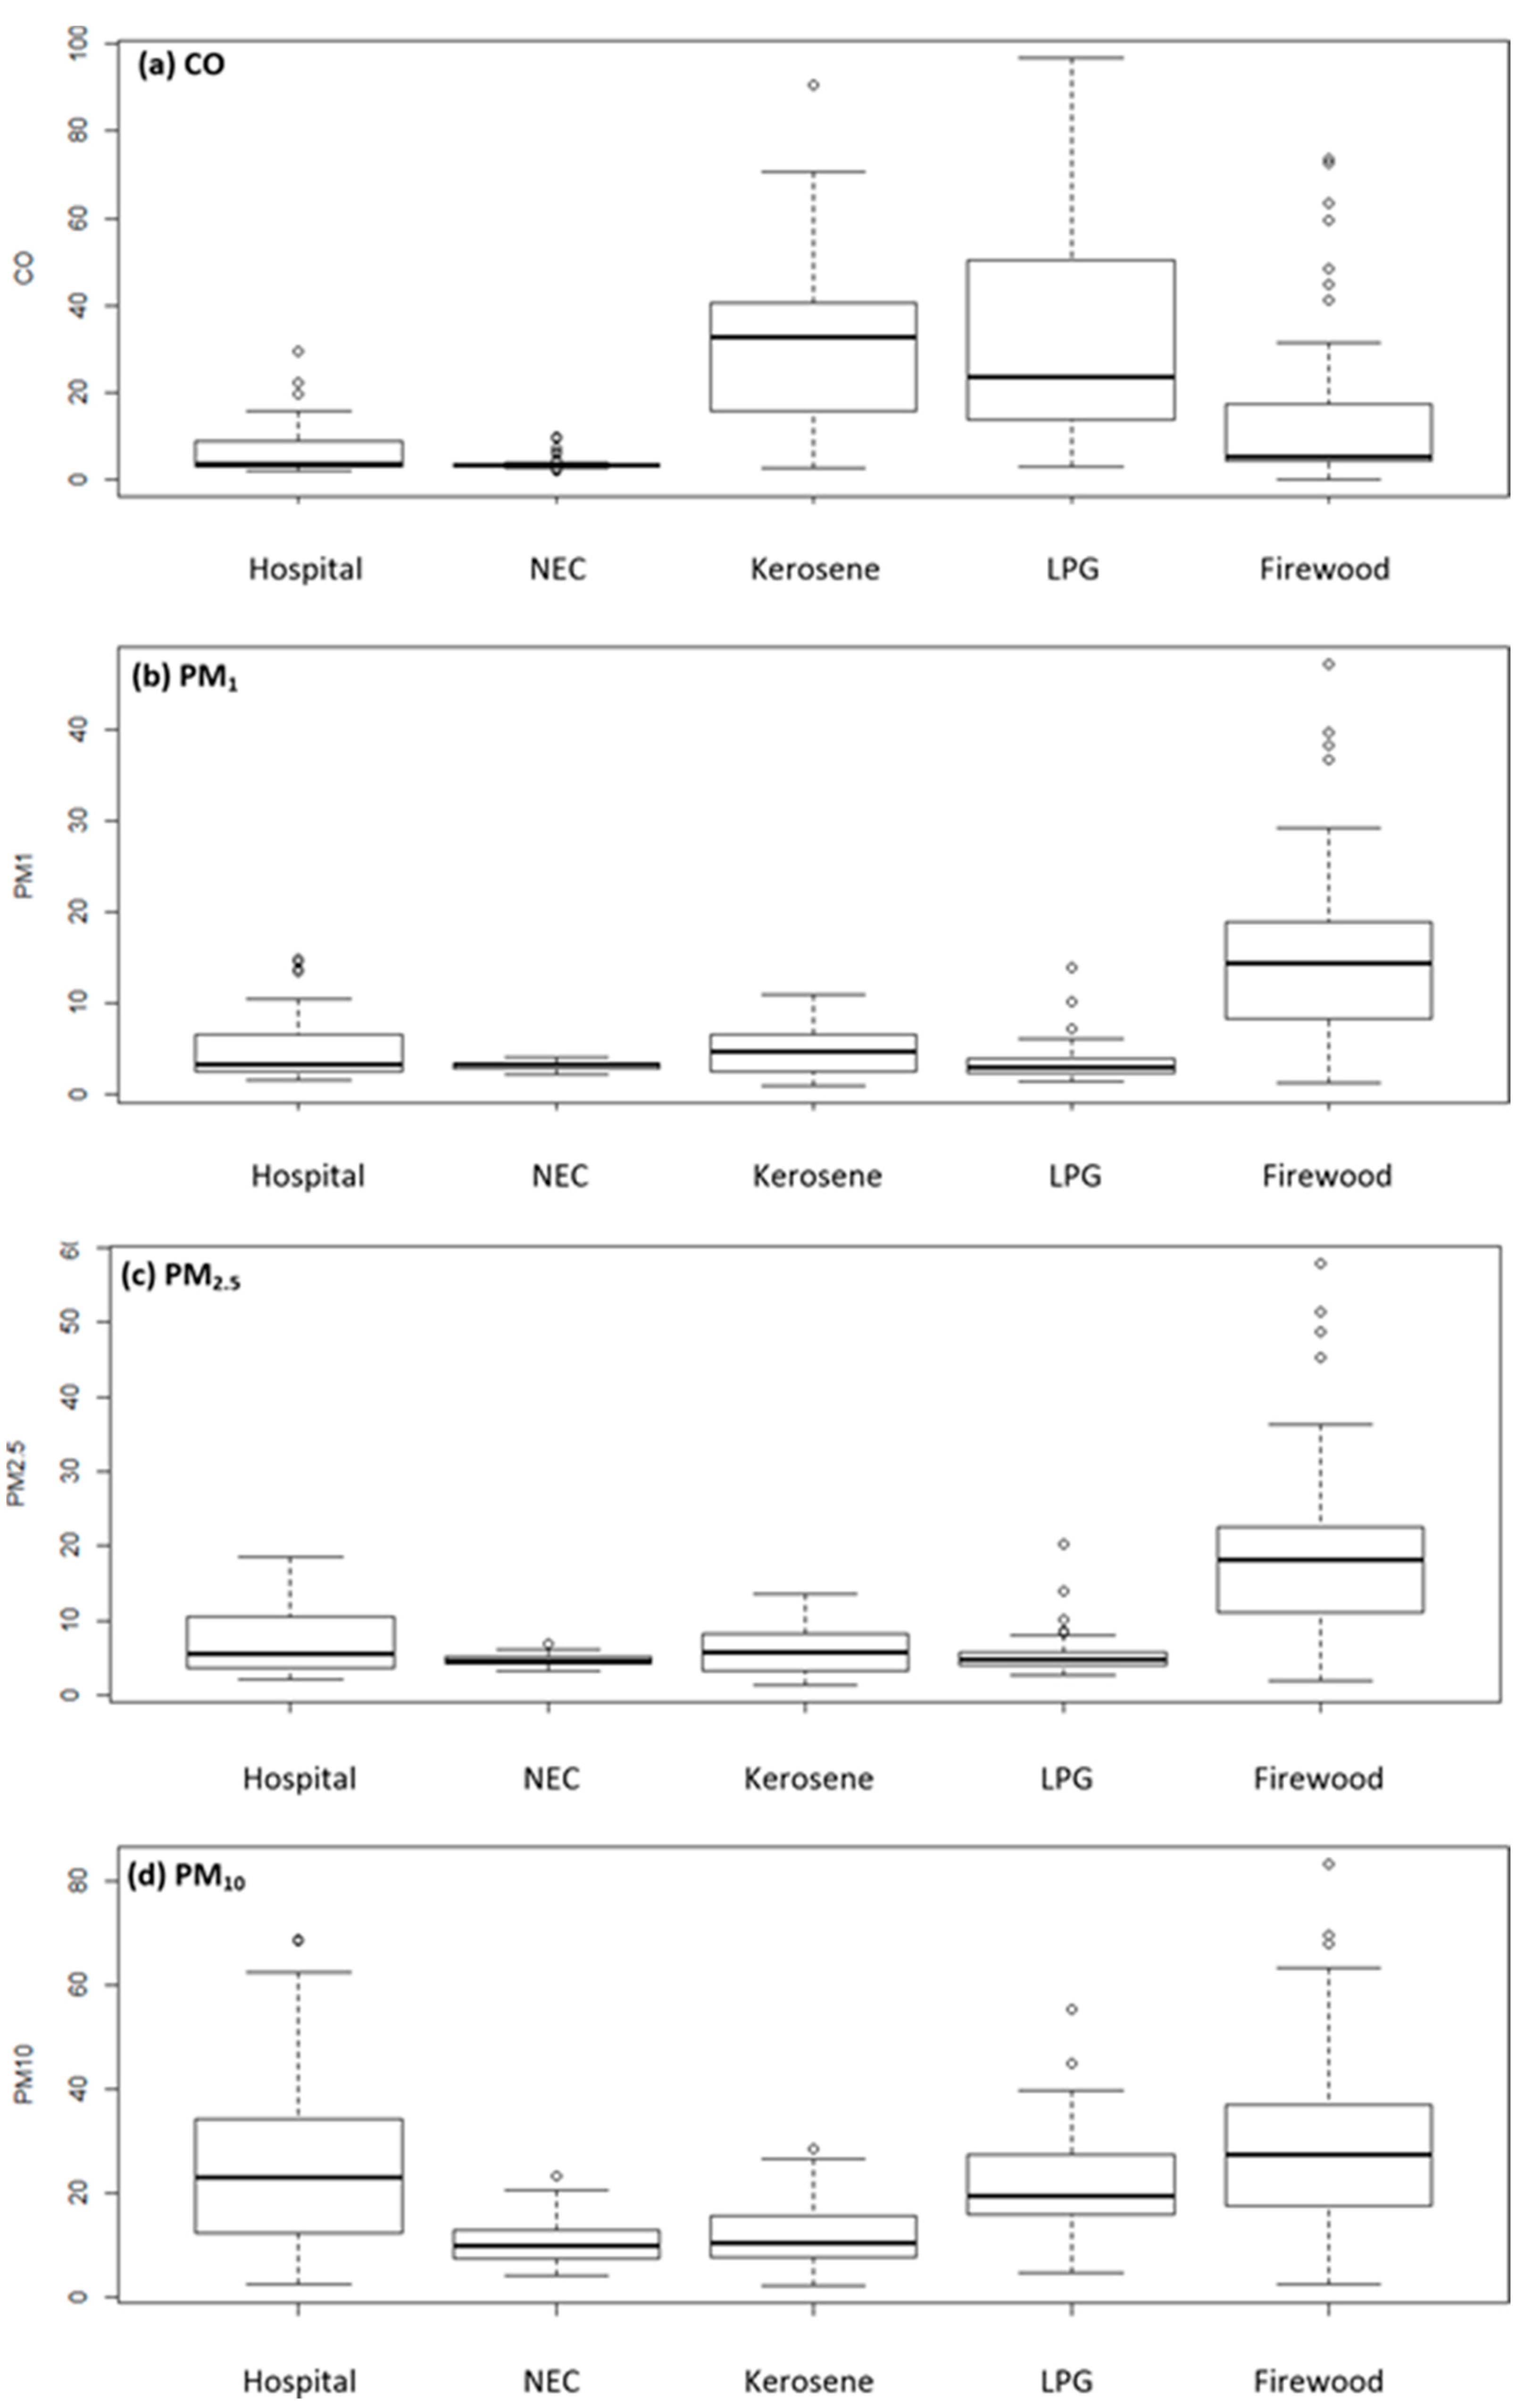
3.2. Impacts of Different Fuel Uses

The electric heater at NEC produced the lowest concentrations of all indoor air pollutants with a narrow range of data records whereas firewood was observed to produce high concentrations for all pollutants (see Figure 3). The electric heater at NEC and those households using kerosene and LPG produced less PM. However, PM, particularly PM10 from another electric heater at the hospital showed high values with large interquartile ranges.
The impacts of different fuels on indoor air pollution in Thimphu, Bhutan, were confirmed by ANOVA in Table S1 (supplementary). The concentrations from firewood were significantly higher than those of other fuels, i.e., electric (NEC), kerosene and LPG heaters (p < 0.01). With respect to concentrations of fine particles (PM1 and PM2.5), there were no significant differences between the hospital, NEC, LPG and kerosene heaters (p > 0.01). With respect to coarse particles (PM10), the concentrations were significantly lower from the electric heater (NEC) than others (LPG and firewood) (p < 0.01). PM10 concentrations from the other electric heater at the hospital were also significantly higher than those from the NEC heater (p < 0.01), but they were not significantly different compared to those of the LPG and firewood heaters (p > 0.01). CO concentrations were significantly higher for kerosene and LPG heaters than the hospital, NEC and firewood heaters (p < 0.01).
Ruiz et al. [44] found similar ranges of PM2.5 from LPG and kerosene heaters that were 61.3 and 86.3 μg·m−3, respectively. Firewood was found to be one of the most polluting fuels used in indoor combustion [38,45]. As reported earlier, 42% of households in Thimphu use firewood for heating. Thus, it is recommended that the health risks related to indoor exposure to pollutants should be studied in the future.

3.3. Relationship between Air Pollutants and Meteorological Parameters

We analyzed the linear and polynomial correlation matrices of indoor pollutants and meteorological parameters according to their sources. Polynomial regression is considered to be a special case of multiple linear regression. Details of the results of the analysis are shown in Table S2 (supplementary).
A correlation between RH and air pressure for the emissions from the electric heaters in the NEC office and in the hospital showed positive linear values with R = +0.9656, +0.0866, +0.6685, and +0.5081, respectively. However, the results for the fuel and wood heaters were negative. The results for the kerosene heaters were R = −0.8916 and −0.3491, while those for the LPG heaters, were R = −0.0866 and −0.4096 and those for the wood heaters were R = −0.6974 and −0.5550.
A correlation was found between RH and Temp in which most of the R values were negative from kerosene (−0.3223, −0.0346), from wood (−0.7158, −0.6498), from NEC (−0.9611, −0.5367) and from the hospital (−0.7896, −0.5419). However, R from LPG heaters had positive values that were +0.2550 and +0.6103. This implies that RH values (59, 60) in the LPG household affect the correlation while those of the other households are also affected: kerosene (29, 38), wood (34, 31), electricity at NEC (52, 54) and at the hospital (32, 42), respectively. It should be noted that average Temp in all places was between 17 and 22 °C.
The correlation between CO and air pressure and RH and Temp were calculated from polynomial regression which showed strong and medium R from NEC (0.5 to 0.7), kerosene (0.4 to 0.5), wood (0.4 to 0.7) and the hospital (0.3 to 0.6) and weak R from LPG (0.2 to 0.4).
The correlation between PM1, PM2.5, PM10 and Temp revealed negative linear values at NEC with R = −0.5011 and −0.2704, −0.4891 and −0.1533, and at the hospital with R = −0.4083 and −0.5100, −0.2963 and −0.1396, respectively. This implies that electric heaters do not generate PM into indoor rooms; they just increase the Temp. However, with regards to the other heaters, especially wood, the more PM there is, the higher the Temp in the rooms. They showed positive linear values for wood with R = (+0.4261, +0.7721), PM1, (+0.4266, +0.7596), PM2.5, and PM10 (+0.4226, +0.5426). Moreover, any others of the fuel heaters showed polynomial regression.
The correlations between Temp and air pressure at NEC and the hospital were treated as taking place in an open-air conditioning system. The values of R were negative linear that were at NEC (−0.9204, −0.5110) and (−0.7896, −0.3477) at the hospital. The higher the air pressure, the lower the temperature. On the other hand, the houses that used fuel heaters were treated as air isolated systems. Most of the R values were positive linear except LPG: kerosene (+0.4741, +0.0173), LPG (−0.2112, −0.4072), and wood (+0.5516, +0.6941). These values show that the quality, quantity and types of fuels have a positive effect on the heating of the rooms. On the second day of sampling the houses that used kerosene and LPG showed values of R which were quite different from those on the first day. These results might have been a result of lower amounts of fuel in the tanks. In the houses with wood fired heaters they used two year dried wood and a continuous supply of boiling water to heat up the rooms. The temperatures in the houses that used wood heaters were stable during the two days of sampling. For the house that used LPG heater, we could imply that the R values showed both negative ones as NEC office. IT could BE implied that these heaters both electricity and LPG had not enough heat to whole room up. People had to stay nearby the heaters to keep them warm.
The correlation between PM1 and PM2.5 showed that for all types of heaters, most of the PM2.5 was from PM1 with very strong R values (+0.80 to +0.99). The correlation between PM2.5 and PM10, showed low R values (+0.14 to +0.40) from the electric heater at NEC and the LPG heater. This suggests that these heaters did not generate most of the PM2.5 in the office or the houses. It is possible that there were other sources of PM2.5 which affected PM10 in the NEC office and the house with the LPG heater. For example, in the house with a LPG heater, the kitchen was opposite the sampling room that contained the LPG heater. Furthermore, the sampling time, they were cooking twice. The PM from the kitchen could easily have affected the total PM in this house. However, they showed medium to strong R values (+0.42 to + 0.82) for kerosene, wood and in the hospital.
The kerosene and wood heaters showed medium R (+0.56, +0.62) and strong R (+0.72, +0.82), respectively. This suggests that these heaters could have affected the PM produced from kerosene and wood. Although the hospital used electric heaters, R between PM1 and PM2.5 (+0.96, +0.98) and to PM10 (+0.42, +0.66) were high because of the location of this hospital. It was close to Thimphu Chorten (less than 200 m) that always used lighted candles and burnt incense to worship the Buddha all day and night. Furthermore, the open doors and windows of the hospital allowed PM to be transferred to the indoor air from any direction.

4. Conclusions

The results from this study revealed that concentrations of PM1, PM2.5 and PM10 were found to be the highest for firewood heaters in comparison with electric heaters (the hospital and NEC), LPG and kerosene heaters. High PM10 was observed in clean fuel in terms of less particle emissions, for example with electric, LPG and kerosene heaters which could be infiltrated from outdoor sources, i.e., traffic in the city and incense smoke from worship activity due to the favorable stable conditions for ambient pollution accumulation. High concentrations of CO were found in LPG, kerosene and firewood from indoor combustion. Elevated concentrations of PM1, PM2.5 and PM10 from firewood heaters which are commonly used in Thimphu households during winter may result in adverse health impacts on the residents. Improving indoor air quality by opening doors and windows is of importance to prevent health risks, particularly in those houses that use wood fired heaters.
The relationship of indoor air pollutants to indoor meteorological parameters, correlations between CO and Temp, CO and RH, and CO and air pressure were polynomial regression for all types of heaters. Negative linear correlations for PM1 and PM2.5 to Temp were found for electric heaters (NEC and the hospital) while positive linear correlations were found for kerosene, LPG and firewood heaters.

Supplementary Materials

The following are available online at https://www.mdpi.com/article/10.3390/su13179601/s1, Table S1: Analysis of variance (ANOVA) of pollutants for different fuel uses, Table S2: Correlation (R) metrics of PM, CO and meteorological parameters separated by sources.

Author Contributions

Conceptualization, T.K. (Thipsukon Khumsaeng) and T.K. (Thongchai Kanabkaew); methodology, T.K. (Thipsukon Khumsaeng) and T.K. (Thongchai Kanabkaew); resources, T.K. (Thipsukon Khumsaeng); data curation, T.K. (Thipsukon Khumsaeng); writing—original draft preparation, T.K. (Thipsukon Khumsaeng) and T.K. (Thongchai Kanabkaew); writing—review and editing, T.K. (Thongchai Kanabkaew). All authors have read and agreed to the published version of the manuscript.

Funding

This research received no external funding.

Institutional Review Board Statement

Not applicable.

Informed Consent Statement

Not applicable.

Data Availability Statement

Not applicable.

Acknowledgments

This research work was partially supported by Chiang Mai University. We also thank The National Environmental Commission of Bhutan (NECs) organization in Bhutan for their help in collecting the data and The National Centers for Environmental Prediction (NCEP)/National Center for Atmospheric Research (NCAR) and the NOAA/ESRL Physical Sciences Division for meteorological information.

Conflicts of Interest

The authors declare no conflict of interest.

References

  1. World Health Organization (WHO). Role of Human Exposure Assessment in Air Quality Management. Report on the Joint Workshop of World Health Organization Joint Research Center European Concerted Action “Urban Air, Indoor Environment and Human Exposure”. Available online: https://apps.who.int/iris/handle/10665/107488 (accessed on 8 June 2020).
  2. World Health Organization (WHO). WHO Guidelines for Indoor Air Quality: Selected Pollutants. Available online: https://apps.who.int/iris/bitstream/handle/10665/260127/9789289002134-eng.pdf?sequence=1&isAllowed=y (accessed on 8 June 2020).
  3. Bruce, N.; Smith, K.R.; Balmes, J.; Pope, D.; Dherani, M.; Zhang, J.; Duan, X.; Bates, M.; Lin, W.; Adair-Rohani, H.; et al. WHO IAQ Guidelines: Household Fuel Combustion—Review 4: Health Effects of Household Air Pollution (HAP) Exposure. Available online: https://www.who.int/airpollution/household/guidelines/Review_4.pdf?ua=1 (accessed on 5 June 2020).
  4. Carrer, P.; de Fernandes, E.O.; Santos, H.; Hänninen, O.; Kephalopoulos, S.; Wargocki, P. On the development of health-based ventilation guidelines: Principles and framework. Int. J. Environ. Res. Public Health 2018, 15, 1360. [Google Scholar] [CrossRef] [PubMed] [Green Version]
  5. Haneke, B.H. A National Methodology and Emission Inventory for Residential Fuel Combustion. Available online: https://www3.epa.gov/ttnchie1/conference/ei12/area/haneke.pdf (accessed on 15 July 2021).
  6. Cheng, Y.-S.; Zhou, Y.; Chow, J.; Watson, J.; Frazier, C. Chemical composition of aerosols from kerosene heaters burning jet fuels. Aerosol Sci. Technol. 2010, 35, 949–957. [Google Scholar] [CrossRef]
  7. Xue, J.; Li, Y.; Peppers, J.; Wan, C.; Kado, N.Y.; Green, P.G.; Young, T.M.; Kleeman, M.J. Ultrafine particle emissions from natural gas, biogas, and biomethane combustion. Environ. Sci. Technol. 2018, 52, 13619–13628. [Google Scholar] [CrossRef]
  8. Tichenor, B.A.; Sparks, L.A.; White, J.B.; Jackson, M.D. Evaluating sources of indoor air pollution. J. Air Waste Manag. Assoc. 1990, 40, 487–492. [Google Scholar] [CrossRef] [Green Version]
  9. World Health Organization (WHO). Assessment of Exposure to Indoor Air Pollutants. WHO Regional Publications European Series, No. 78. Available online: https://apps.who.int/iris/handle/10665/107300 (accessed on 8 June 2020).
  10. Wakelin, T. Emissions from Wood-Fired Combustion Equipment. Available online: https://www2.gov.bc.ca/assets/gov/environment/waste-management/industrial-waste/industrial-waste/pulp-paper-wood/emissions_report_08.pdf (accessed on 9 August 2020).
  11. Lhendup, T.; Lhundup, S.; Wangchuk, T. Domestic energy consumption patterns in urban Bhutan. Energy Sustain. Dev. 2010, 14, 134–142. [Google Scholar] [CrossRef]
  12. Bruce, N.; Dora, C.; Krzyzanowski, M.; Adair-Rohani, H.; Wangchuk, T.; Morawska, L. Tackling the health burden from household air pollution (HAP): Development and implementation of new WHO Guidelines. Air Qual. Clim. Chang. 2013, 47, 32–38. [Google Scholar]
  13. Wangchuk, S.; Siebert, S.; Belsky, J. Fuelwood use and availability in Bhutan: Implications for national policy and local forest management. Hum. Ecol. 2014, 42, 127–135. [Google Scholar] [CrossRef]
  14. Lam, N.L.; Smith, K.R.; Gauthier, A.; Bates, M.N. Kerosene: A review of household uses and their hazards in low-and middle-income countries. J. Toxicol. Environ. Health Part B Criteria Rev. 2012, 15, 396–432. [Google Scholar] [CrossRef] [Green Version]
  15. Tedsen, E. Black Carbon Emissions from Kerosene Lamps Potential for a New CCAC Initiative. Available online: http://ecologic.eu/sites/files/publication/2014/black-carbon-and-kerosene-lamps-study.pdf (accessed on 15 July 2021).
  16. Edwards, R.; Karnani, S.; Fisher, E.M.; Johnson, M.; Naeher, L.; Smith, K.R.; Morawska, L. WHO Indoor Air Quality Guidelines: Household Fuel Combustion Review 2: Emissions of Health-Damaging Pollutants from Household Stoves. Available online: https://www.who.int/airpollution/guidelines/household-fuel-combustion/Review_2.pdf (accessed on 5 July 2020).
  17. Houck, J.E.; Crouch, J.; Huntley, R.H. Review of Wood Heater and Fireplace Emission Factors. Available online: http://www.bioenergylists.org/stovesdoc/Environment/houck.pdf (accessed on 9 June 2020).
  18. Orasche, J.; Seidel, T.; Hartmann, H.; Schnelle-Kreis, J.; Chow, J.C.; Ruppert, H.; Zimmermann, R. Comparison of emissions from wood combustion. Part 1: Emission factors and characteristics from different small-scale residential heating appliances considering particulate matter and polycyclic aromatic hydrocarbon (pah)-related toxicological potential of particle-bound organic species. Energy Fuels 2012, 26, 6695–6704. [Google Scholar]
  19. Bartington, S.E.; Bakolis, I.; Devakumar, D.; Kurmi, O.P.; Gulliver, J.; Chaube, G.; Manandhar, D.S.; Saville, N.M.; Costello, A.; Osrin, D.; et al. Patterns of domestic exposure to carbon monoxide and particulate matter in households using biomass fuel in Janakpur, Nepal. Environ. Pollut. 2017, 220, 38–45. [Google Scholar] [CrossRef] [Green Version]
  20. Sabariah, M.S.; Nabilah, A.S.S.; Rosli, A.B.; Junaidi, Z.Z.; Mustafar, M.T. Analysis and simulation of combustion and emission on small engine. IOP Conf. Ser. Mater. Sci. Eng. 2019, 469, 012076. [Google Scholar] [CrossRef]
  21. Vitolo, C.; Scutari, M.; Ghalaieny, M.; Tucker, A.; Russel, A. Modeling air pollution, climate, and health data using Bayesian networks: A case study of the English regions. Earth Space Sci. 2018, 5, 76–88. [Google Scholar] [CrossRef] [Green Version]
  22. American Society for Testing and Materials (ASTM) International. Design and Protocol for Monitoring Indoor Air Quality; ASTM International: West Conshohocken, PA, USA, 1989. [Google Scholar]
  23. Huang, C.H.; Lin, H.C.; Tsai, C.D.; Huang, H.K.; Lian, I.B.; Chang, C.C. The interaction effects of meteorological factors and air pollution on the development of acute coronary syndrome. Sci. Rep. 2017, 7, 44004. [Google Scholar] [CrossRef] [Green Version]
  24. Radaideh, J.A. Effect of meteorological variables on air pollutants variation in arid climates. J. Environ. Anal. Toxicol. 2017, 7, 478. [Google Scholar] [CrossRef]
  25. Argunhan, Z.; Avci, A.S. Statistical evaluation of indoor air quality parameters in classrooms of a university. Adv. Meteorol. 2018, 2018, 1–10. [Google Scholar] [CrossRef]
  26. Qiao, Z.; Wu, F.; Xu, X.; Yang, J.; Liu, L. Mechanism of spatiotemporal air quality response to meteorological parameters: A national-scale analysis in China. Sustainability 2019, 11, 3957. [Google Scholar] [CrossRef] [Green Version]
  27. Dahari, N.; Latif, M.T.; Muda, K.; Hussein, N. Influence of meteorological variables on suburban atmospheric PM2.5 in the southern region of peninsular Malaysia. Aerosol Air Qual. Res. 2020, 20, 14–25. [Google Scholar] [CrossRef]
  28. Klasen, E.M.; Wills, B.; Naithani, N.; Gilman, R.H.; Tielsch, J.M.; Chiang, M.; Khatry, S.; Breysse, P.N.; Menya, D.; Apaka, C.; et al. Low correlation between household carbon monoxide and particulate matter concentrations from biomass-related pollution in three resource-poor settings. Environ. Res. 2015, 142, 424–431. [Google Scholar] [CrossRef] [PubMed] [Green Version]
  29. Wangchuck, T.; Mazaheri, M.; Clifford, S.; Dudzinska, M.R.; He, C.; Buonanno, G.; Morawska, L. Children’s personal exposure to air pollution in rural villages in Bhutan. Environ. Res. 2015, 140, 691–698. [Google Scholar] [CrossRef]
  30. Wangchuck, T. Seasonal variations of children’ personal exposure to ultrafine particles in different microenvironments in Bhutan. Int. J. Sci. Res. 2017, 6, 396–400. [Google Scholar]
  31. Sharma, G.P.; Sapgota, R.P.; Mool, E.; Gurung, T.; Byanju, R.M. Status of air pollution over the last three decades in Thimphu city, Bhutan. J. Inst. Sci. Technol. 2021, 26, 119–127. [Google Scholar] [CrossRef]
  32. Carslaw, D.C.; Ropkins, K. Openair-An R package for air quality data analysis. Environ. Model. Softw. 2012, 27, 52–61. [Google Scholar] [CrossRef]
  33. Mendell, M.J. Indoor residential chemical emissions as risk factors for respiratory and allergic effects in children: A review. Indoor Air J. 2007, 17, 259–277. [Google Scholar] [CrossRef] [PubMed]
  34. Tran, V.V.; Park, D.; Lee, Y.C. Indoor air pollution, related human diseases, and recent trends in the control and improvement of indoor air quality. Int. J. Environ. Res. Public Health 2020, 17, 2927. [Google Scholar] [CrossRef] [PubMed] [Green Version]
  35. Ruttanawongchai, S.; Raktham, C.; Khumsaeng, T. The influence of meteorology on ambient PM2.5 and PM10 concentration in Chiang Mai. J. Phys. Conf. Ser. 2018, 1144, 012088. [Google Scholar] [CrossRef]
  36. Kanabkaew, T.; Mekbungwan, P.; Raksakietisak, S.; Kanchanasut, K. Detection of PM2.5 plume movement from IoT ground level monitoring data. Environ. Pollut. 2019, 252, 543–552. [Google Scholar] [CrossRef]
  37. Kayes, I.; Shahriar, S.A.; Hasan, K.; Akhter, M.; Kabir, M.M.; Salam, M.A. The relationships between meteorological parameters and air pollutants in an urban environment. Glob. J. Environ. Sci. Manag. 2019, 5, 265–278. [Google Scholar]
  38. Shrestha, R.M.; Kim Oanh, N.T.; Shrestha, R.P.; Rupakheti, M.; Rajbhandari, S.; Permadi, D.A.; Kanabkaew, T.; Iyngararasan, M. Atmospheric Brown Cloud (ABC) Emission Inventory Manual; United Nations Environment Programme: Nairobi, Kenya, 2012. [Google Scholar]
  39. Leung, D.Y.C. Outdoor-indoor air pollution in urban environment: Challenges and opportunity. Front. Environ. Sci. 2015, 2, 1–7. [Google Scholar] [CrossRef]
  40. Monn, C.; Fuchs, A.; Högger, D.; Junker, M.; Kogelschatz, D.; Roth, N.; Wanner, H.U. Particulate matter less than 10 μm (PM10) and fine particles less than 2.5 μm (PM2.5): Relationships between indoor, outdoor and personal concentrations. Sci. Total Environ. 1997, 208, 15–21. [Google Scholar] [CrossRef]
  41. Diapouli, E.; Chaloulakou, A.; Mihalopoulos, N. Indoor and outdoor PM mass and number concentrations at schools in the Athens area. Environ. Monit. Assess. 2008, 136, 13–20. [Google Scholar] [CrossRef] [PubMed]
  42. Naeher, L.; Smith, K.; Leaderer, B.; Mage, D.; Grajeda, R. Indoor and outdoor PM2.5 and CO in high- and low- density Guatemalan villages. J. Expo. Sci. Environ. Epidemiol. 2000, 10, 544–551. [Google Scholar] [CrossRef] [PubMed] [Green Version]
  43. Fazlzadeh, M.; Rostami, R.; Hazrati, S.; Rastgu, A. Concentrations of carbon monoxide in indoor and outdoor air of Ghalyun cafes. Atmos. Pollut. Res. 2015, 6, 550–555. [Google Scholar] [CrossRef] [Green Version]
  44. Ruiz, P.A.; Toro, C.; Cáceres, J.; López, G.; Oyola, P.; Koutrakis, P. Effect of gas and kerosene space heaters on indoor air quality: A study in homes of Santiago, Chile. J. Air Waste Manag. Assoc. 2010, 60, 98–108. [Google Scholar] [CrossRef]
  45. Vicente, E.D.; Vicente, A.M.; Evtyugina, M.; Oduber, F.I.; Amato, F.; Querol, X.; Alves, C. Impact of wood combustion on indoor air quality. Sci. Total. Environ. 2020, 705, 135769. [Google Scholar] [CrossRef] [PubMed]
Figure 1. Study area and sampling locations.
Sustainability 13 09601 g001
Figure 2. Time series plots of pollutant concentrations with different fuel uses.
Sustainability 13 09601 g002
Figure 3. Boxplots of pollutant concentrations from different fuels (box: median and whisker: outliers).
Sustainability 13 09601 g003
Table 1. Summary of sensors employed in Smart Environmental Pro Model.
ParametersSensorMeasurement Range
CO (ppm)4-CO-500Nominal Range: 0 to 500 ppm
Maximum Overload: 2000 ppm
PM1/PM2.5/PM10 (μg·m−3)OPC-N2Particle range (μm): 0.38 to 17 spherical equivalent size
Max particle count rate: 10,000 particles/second
Temp (°C)BME2800~+65 °C
Air pressure (kPa)30~110 kPa
RH (%)0~100%
Table 2. Location and site descriptions.
PlaceFuelSite CharacteristicsModes of VentilationCollection
Period
Hours
(Approx.)
(Lat and Long)
NECElectric heaterValley, Ground
floor
One gate, windows
were closed
1–2 December 20169:00–17:00(27.4879,
89.6343)
HouseKeroseneUphill, 2nd floor2 ventilators (in
kitchen and restroom)
6 December, 8 December 201613:00–21:00(27.4749,
89.6246)
HouseLPGUphill, Ground floor2 ventilators (in kitchen and restroom)12–13 December 201613:00–21:00(27.4727,
89.6254)
HouseFirewoodValley, 1st floorOpen door but covered with cloth, windows were closed14 December, 16 December 201613:00–21:00(27.4776,
89.6378)
HospitalElectric heaterValley, Ground floorOpen doors15 December, 19 December 20169:00–17:00(27.4642,
89.6382)
Table 3. Summary of measurement data.
ParametersHospitalNECKeroseneLPGFirewood
Means.d.Means.d.Means.d.Means.d.Means.d.
CO (ppm)6.505.163.651.4231.0418.1733.9326.4113.9217.58
PM1 (μg·m−3)4.933.283.200.484.832.733.541.9514.789.73
PM2.5 (μg·m−3)7.244.254.720.716.013.285.392.6218.3111.92
PM10 (μg·m−3)25.4416.0610.614.3911.686.3622.139.9528.6616.35
Temp (°C)18.161.6919.971.6522.101.6717.892.1220.352.45
Air pressure (Pa)76,63128176,81493473,781300174,054160875,8993400
RH (%)37.017.5652.703.2937.8912.3259.743.1733.345.63
Note: The sampling size (n) for each group was approximately 64 and s.d. is the standard deviation.
Publisher’s Note: MDPI stays neutral with regard to jurisdictional claims in published maps and institutional affiliations.

