Article

Influence of Wind Turbines on Farmlands’ Value: Exploring the Behaviour of a Rural Community through the Decision Tree

by
Giovanni Ottomano Palmisano
1,
Annalisa De Boni
2,*,
Rocco Roma
2 and
Claudio Acciani
2,*
1
International Centre for Advanced Mediterranean Agronomic Studies of Bari, CIHEAM Bari, 70010 Valenzano, Italy
2
Department of Agricultural and Environmental Science (DISAAT), University of Bari Aldo Moro, 70126 Bari, Italy
*
Authors to whom correspondence should be addressed.
Sustainability 2021, 13(17), 9630; https://doi.org/10.3390/su13179630
Submission received: 19 July 2021 / Revised: 17 August 2021 / Accepted: 22 August 2021 / Published: 27 August 2021

Abstract

:
The relationship between wind energy and rural areas leads to the controversial debate on the effects declared by rural communities after wind farms or single turbines are operative. The literature on this topic lacks dedicated studies analysing how the behaviour of rural communities towards wind turbines can affect the market value of farmlands. This research aims to examine to the extent to which the easement of wind turbines can influence the market value of farmlands in terms of willingness to pay (WTP) by a small rural community, and to identify the main factors affecting the WTP. Starting from data collected via face-to-face interviews, a decision tree is then applied to investigate the WTP for seven types of farmland in a rural town of Puglia Region (Southern Italy) hosting a wind farm. Results of the interviews show a broad acceptance of the wind farm, while the decision tree classification shows a significant reduction of WTP for all farmlands. The main factors influencing the WTP are the education level, the possibility to increase the income, the concerns for impacts on human health and for maintenance workmen. National and local policy measures have to be put in place to inform rural communities about the ‘magnitude’ of the effects they identified as crucial, so that policy-makers and private bodies will contribute to make the farmland market more equitable.

1. Introduction

Rural areas cover about 75% of the European Union populated mainland and host nearly a quarter of the total population [1]. Here, the need to tackle climate change and CO2 emissions poses several challenges, such as the exploration of endogenous energy potential. As almost low-density territories, rural areas have a greater potential than cities to develop renewable energy sources. As a consequence, the deployment of renewable energy represents an opportunity for rural sustainable development [2]. Besides the reduction of greenhouse gas emissions, renewable energy can increase and stabilize rural incomes, foster the use of new products, technologies, and policy approaches, thus increasing the innovation capacity in rural areas, and empower local communities, supplying them with cheaper sources of energy [3].
In this context, wind energy is more deployed than other energy sources, because it is considered a relatively mature technology, which is not likely to experience big evolutions that can leave new turbines suddenly obsolete [3]. Furthermore, the widespread nature of wind energy is also due to its better cost-effectiveness and feasibility in terms of energy production, technical implementation, land occupation, and waste disposal, particularly with respect to solar energy [2].
It is also important to underline that the capital cost of on-shore wind plants has seen a strong reduction in the last 30 years, against the background of greater efficiency and reliability [3]. Wind energy is a source of clean electricity and it is local, reliable, and affordable. It adds significant value to the European economy while contributing to the objectives of energy independence and security. With 192 GW installed across the EU-28, wind energy today supplies already 15% of the total European electricity demand and helps save 10 billion €/year in fossil fuel imports. The bulk of wind power (98%) in Europe is provided by onshore wind farms [4] and more than 5% of the European wind power is in Italy. At the end of 2019, national wind installations amounted to 10.5 GW corresponding to about 7100 turbines [5]. In this country, the wind energy sector is acknowledged to offer important development opportunities in view of the Climate Target Plan 2030 [6]. Moreover, favourable national regulatory frameworks and financial incentives are crucial for the development of wind energy. In Italy, especially in Puglia and Sicilia regions, the incentive system regulated by the Ministerial Decree of 6 July 2012 has provided a feed-in tariff equal to 268€ for each MWh of wind energy, leading to a strong boost for wind turbine development [7]. It is also to be noted that private investments in wind energy are playing a key role in promoting the energy transition process [8]. Despite the great financial efforts put in place by the policy makers and private bodies (e.g., energy companies), the realization of wind farms or even single turbines may encounter strong opposition from local communities, especially in low population density areas like rural territories [9,10,11].
In this sense, on-shore wind technology has to face more obstacles than its off-shore counterpart, related mainly to social, institutional, economic, and financial aspects, such as market failures and distortions [12] and the loss of property value or limitations to tourism activity [11,13]. Rural communities are involved in wind energy production as they provide land for the installation of wind turbines and benefit from the economic compensation (generally higher than the lease prices for farmlands), the reduction of electricity costs, the creation of new job opportunities, and farm business diversification. Nevertheless, for both single turbines and wind farms, impacts have been observed on farmland property value and market dynamics, with a spatial relationship between farms providing land and neighboring farms and properties [14]. In addition, the relationship between wind energy and rural areas leads to the controversial debate on the effects declared by rural communities after wind farms or single turbines are operative [15,16,17]. Indeed, these effects are very complex and go beyond the “not in my back yard” (NIMBY) tendency [18], since they arise from the combination of various factors after the installation of wind turbines, including the economic, social, and demographic features of these communities [19,20,21], their knowledge on wind energy, and the views in terms of both positive and negative consequences [22,23,24]. In fact, several studies investigated the effects of wind farms or single turbines in rural areas from different perspectives. These include effects on job increase [15,25]; income growth in terms of rent payments to farmland owners, farm business diversification, reduction of electricity costs, and local community benefit provisions [17,26,27,28]; impacts on farmland occupation and use, and recovery of marginal areas [2,29,30]; visual impact on landscape [31,32,33] and alteration of agro-ecosystems [21]; effects on rural tourism [34,35,36]; social acceptance as a whole [23,37,38,39]; impacts on human health [40,41,42]; and variation of property values with focus on houses and residential land [43,44,45,46].
Nevertheless, the scientific literature on the link between wind energy and rurality is scarce in research deeply analysing how the behaviour of rural communities towards wind farms or turbines can affect the market value of farmlands both burdened by these installations and located in the surrounding areas, namely farmlands subject to wind turbines [14,47,48,49,50]. Several questions still arise about the opportunities and capacities of these rural actors to ‘plug into’ the complex, supra-local system of wind energy provision, regulated by policy arrangements and corporate actors often acting at broader spatial levels [51].
The aim of this research is two-fold. The first aim is to evaluate the extent to which the easement of wind turbines can influence the farmland value in terms of willingness to pay (WTP) by a small rural community. Then, the second aim is to identify the main factors affecting the WTP for seven types of farmland. The achievement of these aims can contribute to filling the knowledge gap on the tangible effects of wind turbines on farmland value, thus providing insights to policymakers and private bodies to make the farmland market more equitable, and suggestions to people in rural communities involved in these transactions.
The research is carried out by using the data collected via face-to-face interviews through the application of a decision tree [52]. Basically, the decision tree is one of the most intuitive and frequently used technique in data science capable to analyse in depth a course of actions and various outcomes [53] and to provide classification rules for understanding the behaviour and the decision-making process [54,55]. In particular, a decision tree is chosen due to its capability to take into account simultaneously the demographic, economic, and social features of rural communities, together with their knowledge on wind energy and the views on positive and negative effects in the rural territory. Moreover, a decision tree is suitable to identify the factors influencing the choices of these actors involved in different farmland transactions. In fact, complex decisions on wind energy have to be tackled by suitable approaches dealing with multiple conflicting aspects through involvement of social actors, so that decision-making capabilities are improved [33,56,57,58].
The research is realized in the rural town of Villa Castelli (Puglia Region, Southern Italy), which hosts a wind farm consisting of 10 turbines, 80 m in height, having a rotor diameter of 90 m and a power of 2 MW each, to provide a total energy output of 20 MW. Southern Italy provides the highest quota of national wind energy supply with more than 97% of installations, and 66% of total installations in Southern Italy are located in the regions of Puglia, Basilicata, Campania, and Sicilia [32]. Among these regions, Puglia has the highest number of installations (35% of national installations) and the largest energy capacity (24% of national renewable energy capacity). However, the high concentration of on-shore wind farms in this region has posed various issues over time, including the consequences of expansion and redevelopment of existing wind farms in the rural territory.
The paper is organized as follows. After describing the methodology for the data collection, the decision tree is illustrated both from the theoretical and the empirical perspectives (Section 2). Then, Section 3 shows the results about the description of the sample and the decision tree classification. Section 4 provides the discussion of the results with a focus on those obtained from the decision tree application. Finally, concluding remarks are reported in Section 5.

2. Materials and Methods

2.1. Data Collection

A questionnaire to investigate the WTP for 7 types of farmland subject to wind turbines was circulated from December 2019 to February 2020 through face-to-face interviews by an expert living in the same area and with deep knowledge about the local rural community and farmland market. In order to obtain a sample tailored to the research goal and actually involved in wind energy, the following inclusion criteria were used: to be resident in the town of Villa Castelli within 5 km from the windfarm; to be willing to buy farmlands subject to wind turbines; age ≥18 years old; to be employed in agriculture as farmer or agricultural entrepreneur, freelance professional, and worker in agriculture. The questionnaire was supplied together with the definition of wind energy, a brief description of the wind farm including pictures, and the technical features of the turbines. The questionnaire consisted of 23 questions organized into the following 3 parts:
  • Part 1: Demographic, social, and economic features of the respondents. This section aimed to obtain specific information regarding gender, age, education level, category of employment, type of knowledge on wind energy, and the perception about the attention paid by the energy companies to public opinion before the installation of wind turbines. Furthermore, this section investigated if the respondents own farmland and if this land accommodates wind turbines.
  • Part 2: Effects of wind turbines on rural community. This section aimed to investigate both the positive and negative effects of wind turbines declared by the local rural community. Among the positive effects, the possible job increase in the study area, the income increase of farmland owners, and the opportunities of recovery of marginal areas (e.g., rural areas that cannot be used for cost-effective agriculture) were investigated. On the contrary, the analysis of negative effects regarded the impacts of wind turbines on human health, the impacts on the landscape and agroecosystems, the cultivation and building constraints arising from the easement, the presence of maintenance workmen in the farmland, and the depreciation of the farmland also caused by the easement.
  • Part 3: Willingness to pay farmland owners subject to wind turbines. The last section of the questionnaire looked to get the WTP of the respondents for 7 types of farmland: sowable crops, vineyard, olive grove, orchard, livestock farm, rural facilities, and woodland. These farmlands reflect the features of the study area, which include extensive farming of sowable crops and orchards; specialized viticulture and olive growing; small livestock farms; woodlands with deciduous trees and Mediterranean scrub; rural facilities, such as small houses, sheds, warehouses for machinery and equipment.
The elicitation of the WTP follows the payment scale (PS) approach [59], where the respondents choose a value from a pre-specified and ordered list. Thus, the respondents were asked to choose the WTP, in relation to the current market value, for each farmland from a list of percentage shares ranging from 40% to 100% at intervals of 5%. It is to be noted that the market values of farmlands were not shown to the respondents because they had in depth knowledge of the local market trend.

2.2. The Decision Tree

The decision tree, also known as a classification tree, is one of the most intuitive and frequently used techniques in data science [52]. At its core, a decision tree can be defined as a tool that helps to make decisions by exploring a course of actions and various outcomes [53]. The popularity of decision trees in data science is due to their capability in handling complex problems by providing an understandable representation and an easy interpretation, and also because of their flexibility in the inference process by supplying logical rules of classification [60]. More specifically, decision trees show the following advantages [55]: (i) Variable selection: decision trees can be used to select the most relevant input variables to formulate decisions. Indeed, certain variables could be of marginal importance, and thus should not be included in the data mining. (ii) Variable importance: once a set of relevant variables is identified, it is possible to know which are the key variables. Generally, the more records (i.e., the objects) a variable has an effect on, the greater the importance of the variable. (iii) Data mining: decision trees can deal with both numerical (i.e., continuous) and nominal (i.e., categorical) variables. Mining numerical variables may require discretization before or during the model building. In this respect, the decision tree algorithms can discretize numerical data into a more manageable number of categories (e.g., binarization). (iv) Handling missing values: decision trees can manage missing data either by classifying these data as a separate category to analyse with the other categories, or by using a decision tree that sets the missing values as target variables in order to replace these values with those predicted. (v) Prediction: when decision trees are built from historical data, it is possible to predict the results for future records in a straightforward way.
A decision tree takes the shape of a decision flowchart or an inverted tree, where an attribute (i.e., variable) is tested in each node [61,62]. The main elements of a decision tree are nodes and branches. There are three types of nodes [55,63,64]: (i) A root node, also called decision node, represents the first question that involves to make a choice between two or more options. A root node has no incoming edges and zero or more outgoing edges. (ii) Chance nodes, also named child nodes, are the result of splitting a node into new nodes, and thus they are one of the possible choices at a certain point of the tree structure. Each chance node has one incoming edge and two or more outgoing edges. (iii) Leaf nodes, also defined end nodes, represent the final answer to a combination of decisions or events. Each leaf node does not split any further, so it has one incoming edge and no outgoing edges.
A branch, also called edge, can be defined as a subsection of the tree that connects the nodes. Each branch represents one of the possible alternatives or courses of action available at that point of the tree [53,54,63]. Each pathway from the root node, through the chance nodes, and to a leaf node identifies a classification decision rule. These pathways can be represented also as “if-then” rules. For instance, “if condition 1 and condition 2 and condition … and condition k occur, then outcome j occurs” [55].
The main steps for building a decision tree are splitting, stopping and pruning. Splitting is the process of dividing a node into two or more purer subsets (i.e., child nodes); purity is a metric used by a decision tree algorithm to set the splitting order of the nodes [53]. Only the input variables linked to the target outcome are used to split the nodes into purer child nodes; in some cases, not all the input variables will appear in the decision tree, while a certain input variable may occur several times at different levels of the decision tree [55]. The splitting procedure ends when each child node is made of homogeneous records (i.e., the pure child node) or when certain stopping or pruning criteria are met [54,65]. According to the type of decision tree algorithm, there are different methods to carry out the splitting, such as information gain, Gini index, DKM criterion, normalized impurity based criteria, gain-ratio and Twoing criterion [65,66,67].
It is to be noted that a very complex decision tree can show each leaf node 100% pure [61,65]. This kind of tree is over fitted to the data, thus making the interpretation of results difficult, and it also lacks robustness, especially when the decision tree is used for prediction [52]. Therefore, stopping or pruning procedures can be applied to prevent the decision tree from becoming overly complex. Stopping is the most common procedure used to determine when to end splitting [53]. There are several parameters to perform the stopping according to the goal of the research and the features of the dataset: (i) the minimum number of records in a leaf; (ii) the minimum number of records in a node prior to split; (iii) the number of steps (depth) of any leaf from the root node [55,67].
However, the use of tightly stopping criteria tends to create small and under-fitted decision trees, while loosely stopping criteria leads to large decision trees that are over-fitted to the training set. Therefore, pruning methods were developed for solving this issue [65]. Furthermore, another key motivation of using pruning is the ‘trading accuracy for simplicity’: when the goal is to produce an accurate but smart description, pruning is highly useful [54]. Pruning is defined as a procedure that reduces the size of decision trees by removing sections of the tree (e.g., child nodes) with little energy of classification or importance [53]. The goals of pruning are to reduce the complexity of the final classification and to obtain a better predictive accuracy by reducing over-fitting and removing sections of a tree that may be based on noisy or erroneous data [66]. There are a variety of pruning techniques based on the decision tree algorithm, such as cost-complexity pruning, reduced error pruning, minimum error pruning, pessimistic pruning, error-based pruning, optimal pruning, and minimum description length pruning [54]. Many variations of the decision tree algorithm were developed [62]. These include chi-squared automatic interaction detector (CHAID) [68], classification and regression tree (CART) [69], iterative dichotomizer 3 (ID3) [70] and its evolution C4.5 [71,72], and conditional inference trees [73].
Among these algorithms, C4.5 is a landmark decision tree algorithm widely used as workhorse in machine learning [67]. Furthermore, C4.5 ranked #1 in a survey paper titled “Top 10 Algorithms in Data Mining” [74]. According to various scholars [53,54,63], C4.5 shows the following strengths. (i) It can handle both continuous and discrete attributes. This means that C4.5 can be used for classification or regression and work with categorical and numerical data. Handling of continuous attributes is done by splitting the attribute’s value range into two subsets (binary split). Specifically, C4.5 searches for the best threshold that maximizes the gain ratio criterion. All values above the threshold form the first subset, while all other values form the second subset. (ii) It can work with missing data (marked as ?), which are simply not used in gain and entropy calculations. (iii) It uses a pruning procedure to remove branches not contributing to the accuracy and replace them with leaf nodes. However, C4.5. has some drawbacks, including the construction of empty branches with zero values, the tendency to construct very large trees with many subsets, and the susceptibility to overfitting [53,63].
In this research, the C4.5 algorithm is applied by following the stepwise procedure described by [71,72,74]. Moreover, the data mining, the subsequent building of the decision trees and the extraction of the classification rules are carried out by using the “Konstanz Information Miner” (KNIME) analytics platform, developed by the University of Konstanz [75]. Specifically, the data collected from the questionnaires are a set of discrete and continuous variables. Each farmland is the target variable (expressed by the WTPs declared by the respondents), while the features of the respondents and the declared positive and negative effects of wind turbines are the independent variables. Given a certain target variable, the C4.5 algorithm induces a decision tree, 7 decision trees are created according to the number of farmlands. The C4.5 parameters set for building the decision trees into KNIME are: 3 records per node, gain-ratio method for the splitting procedure, and reduced error pruning for reducing over-fitting [71,72,76]. Finally, in order to evaluate the classification accuracy of the decision trees, the confusion matrix is also computed in KNIME. Basically, the confusion matrix summarizes the classification performance of a classifier algorithm with respect to a dataset. This is a two-dimensional matrix, where each row represents the instances in an actual class while each column represents the instances in a predicted class [77]. The analysis of the confusion matrix enables to obtain the overall accuracy of classification, as the ratio between the correct classified instances (reported along the diagonal of the matrix) and all the instances, and it can be expressed as a percentage [78].

3. Results

3.1. Description of the Sample

The initial sample consisted of 175 observations, but the questionnaires with protest and inconsistent answers and those wrongly filled in by the data collector were excluded from the analysis. The final sample consists of 100 observations. The number of questionnaires with inconsistent answers was 67. In particular, 45 respondents declared a very high WTP (between 90% and 100%), although they also declared several negative impacts of wind turbines, such as those related to human health, cultivation and building constraints, and depreciation of the farmland. On the contrary, 22 respondents declared a very low WTP (between 40% and 50%) but they also stated positive impacts of wind turbines, like the income increase of farmland owners and the opportunities to recover marginal areas. Three questionnaires were wrongly completed by the data collector, because some demographic and economic features of respondents as well as data on the positive and negative effects of wind turbines were not recorded. In addition, five respondents refused to complete the questionnaire, showing a protest attitude.
The results of Section 1 of the questionnaire (Table 1) show that 64% of the sample is made up of women and about half (48%) are aged between 41 and 60 years old. Over 60% of the respondents have secondary school (31%) and high school (33%) degrees, while one fourth are graduates. Most of the respondents (68%) are workers in agriculture, while 16% are farmers or agricultural entrepreneurs, and the remaining 16% are freelance professionals in agriculture. With regard to the level of knowledge on wind energy, more than half of the sample (57%) stated that they have not any knowledge on this topic, 36% got information in an autonomous way and only 7% of the respondents obtained some evidences by taking part in public meetings or debates. The sample was also asked if the energy companies paid attention to the opinion of the local rural community before the installation of wind turbines, and almost the entire sample (96%) answered negatively. Moreover, most of the respondents (73%) own farmlands and only 8% own farmlands subject to wind turbines.
In the second section of the questionnaire, the respondents also declared which possible effects (positive or negative) could arise from the installation of wind turbines (Table 2). Regarding the positive effects, only 2% of the sample believes that there may be effects regarding an increase of jobs. Few respondents (12%) believe their income will increase due to a rent fee for the installation of turbines on their farmland or due to a reduction of electricity costs. Additionally, almost all the respondents believe that the wind farm can be an important intervention to recover marginal areas that do not ensure cost-effective agriculture. Concerning the potential negative effects, only 13% of the respondents are concerned by impacts on human health. A third of the sample are afraid of visual impacts on the landscape and on the alteration of the agroecosystem, while 38% are worried about possible constraints for the management of farmlands, such as realizing new arboreal plants or new rural artefacts or facilities. Finally, 22% of the respondents are concerned about the presence of workers involved in the maintenance of wind turbines, while 31% are worried about a depreciation of farmlands as a result of the construction of such installations.
Regarding the Section 3 of the questionnaire that investigated the WTP for a farmland subject to wind turbines, the results summarized in Table 3 show a general strong WTP reduction regardless of the type of farmland, but there are no significant WTP variations among the different types of farmland. In fact, the most frequent WTP (the mode) is 60% in almost all the types of farmland except in olive grove and orchard where the modal WTP is equal to 50%. In addition, there are also no significant variations within the average WTP (the mean), where the values ranges from 63.1% in rural facilities to 66.5% in woodland. It is to be noted that Table 3 shows only the answers about the WTP without going into the detail of the decision process, which is presented in Section 3.2.

3.2. Decision Tree Classification

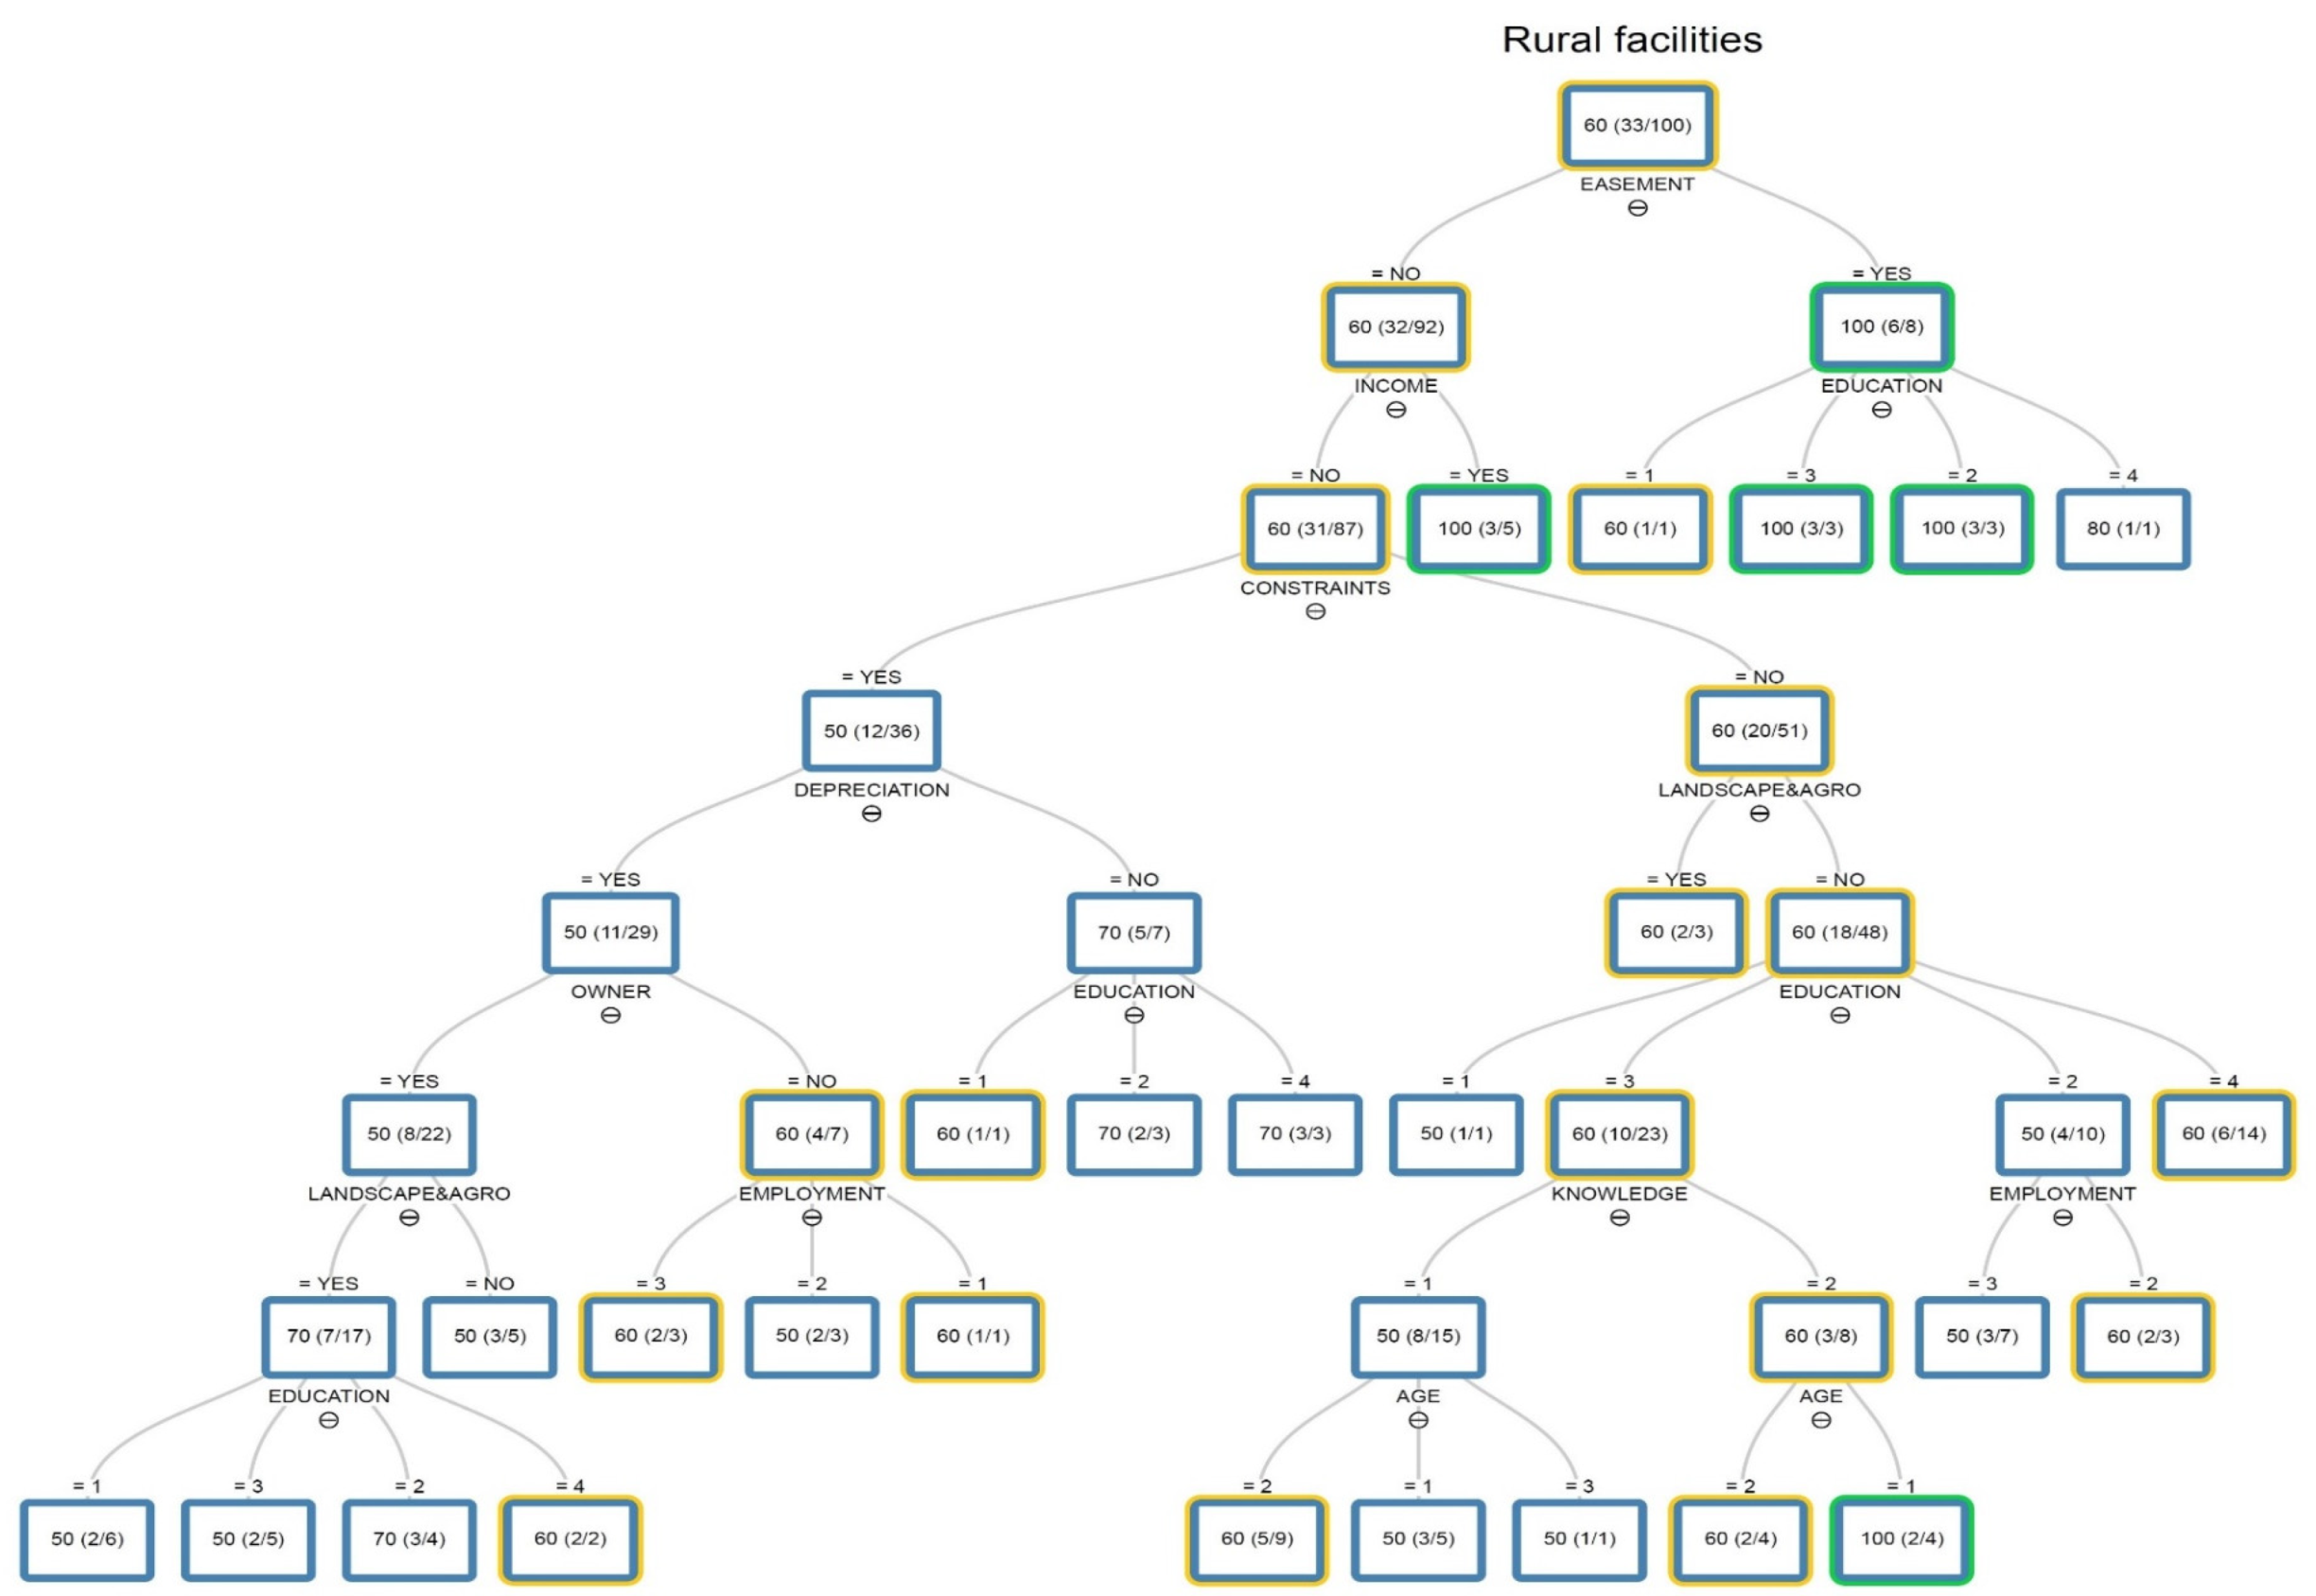
The decision trees are shown in Figure A1, Figure A2, Figure A3, Figure A4, Figure A5, Figure A6 and Figure A7. In order to provide a concise description of each tree, the results follow the path of the most frequent WTP across the highest number of nodes (i.e., variables), particularly from the root node, through the child nodes and up to the leaf node. However, both the nodes with the most frequent and the highest WTPs are marked respectively in yellow and green in all the decision trees.
There are five farmlands showing an income increase as root node, namely sowable crops, olive grove, orchard, livestock farm and woodland. Regarding the sowable crops (Figure A1), the most frequent WTP is 60% and relates to 28 respondents out of 100. This WTP is linked to respondents declaring that wind turbines cannot increase their income, they are not concerned about the presence of maintenance workmen in the farmland, they hold a high school degree and are not worried about the impacts of wind turbines on human health. Moreover, these respondents are workers in agriculture, they are not concerned about the farmland depreciation caused by wind turbines, they have no knowledge on wind energy, and are between 41 and 60 years old.
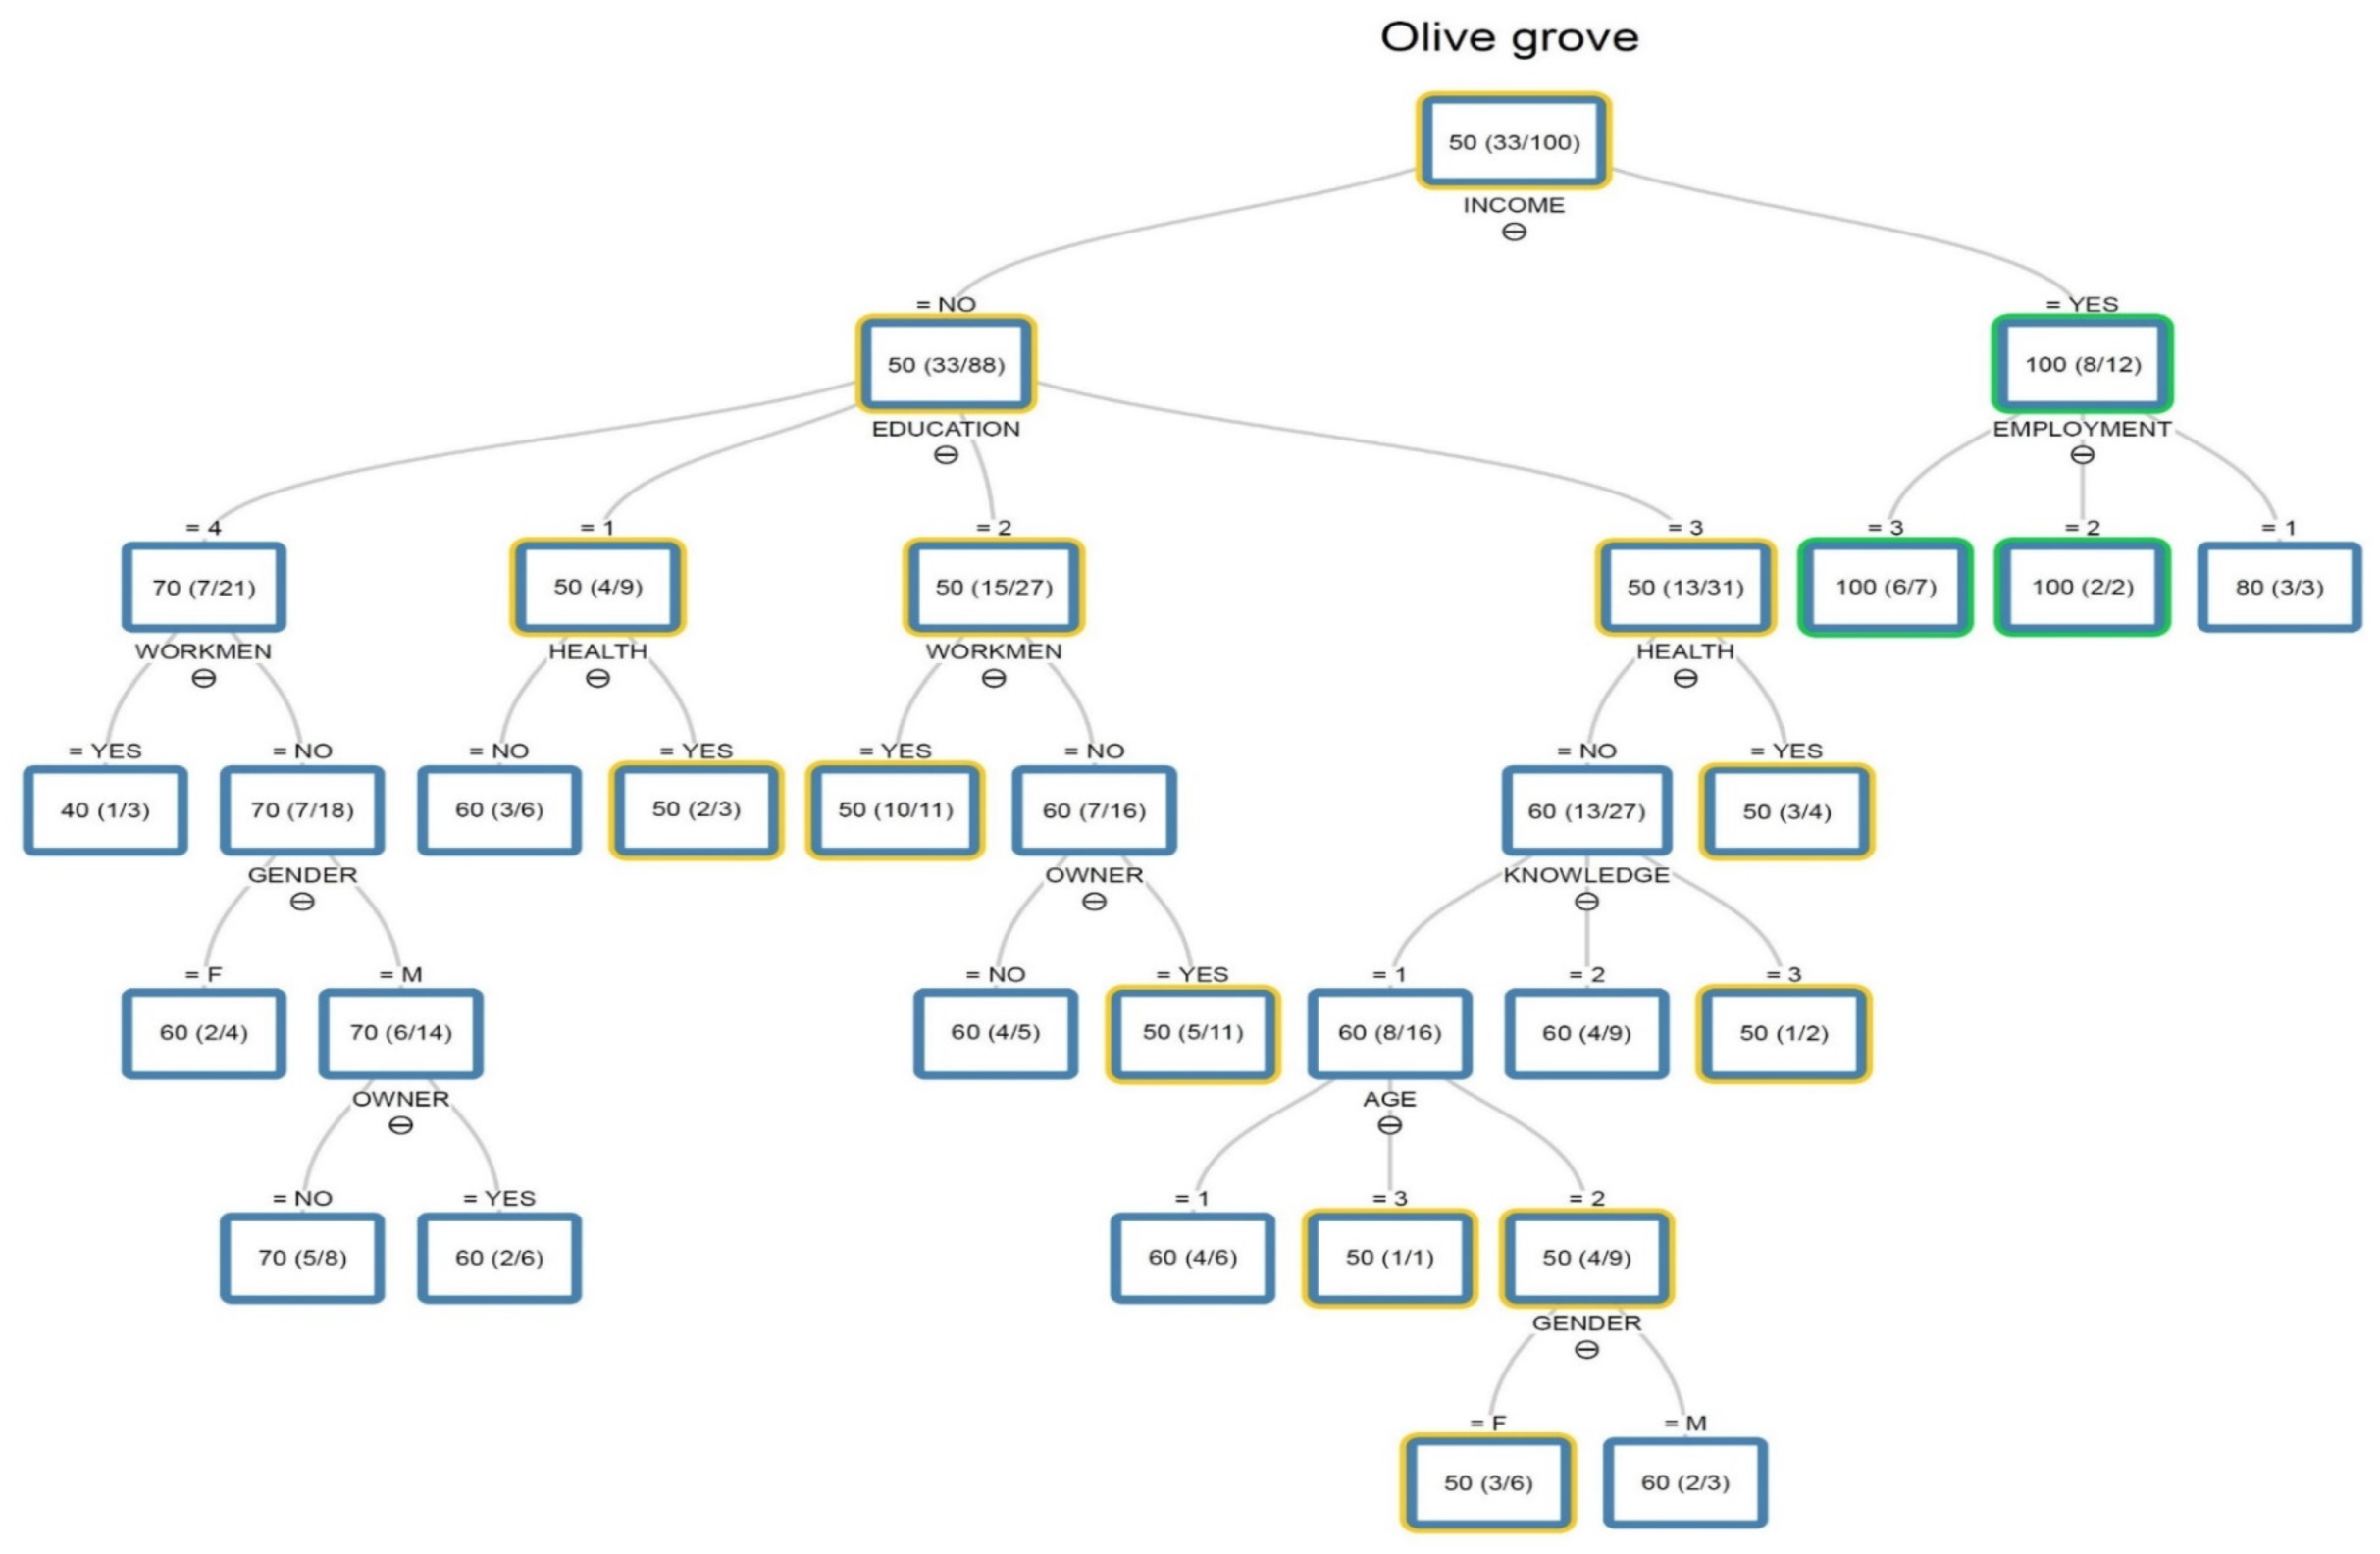
The decision tree describing the WTP for the olive grove (Figure A2) shows that the most frequent WTP is 50% and observed in 33 respondents out of 100. Even for this farmland, the respondents think that wind turbines cannot lead to an income increase, they hold a high school degree and are not afraid of impacts on their health. In addition, these respondents are not informed on wind energy, and they are female between 41 and 60 years old.
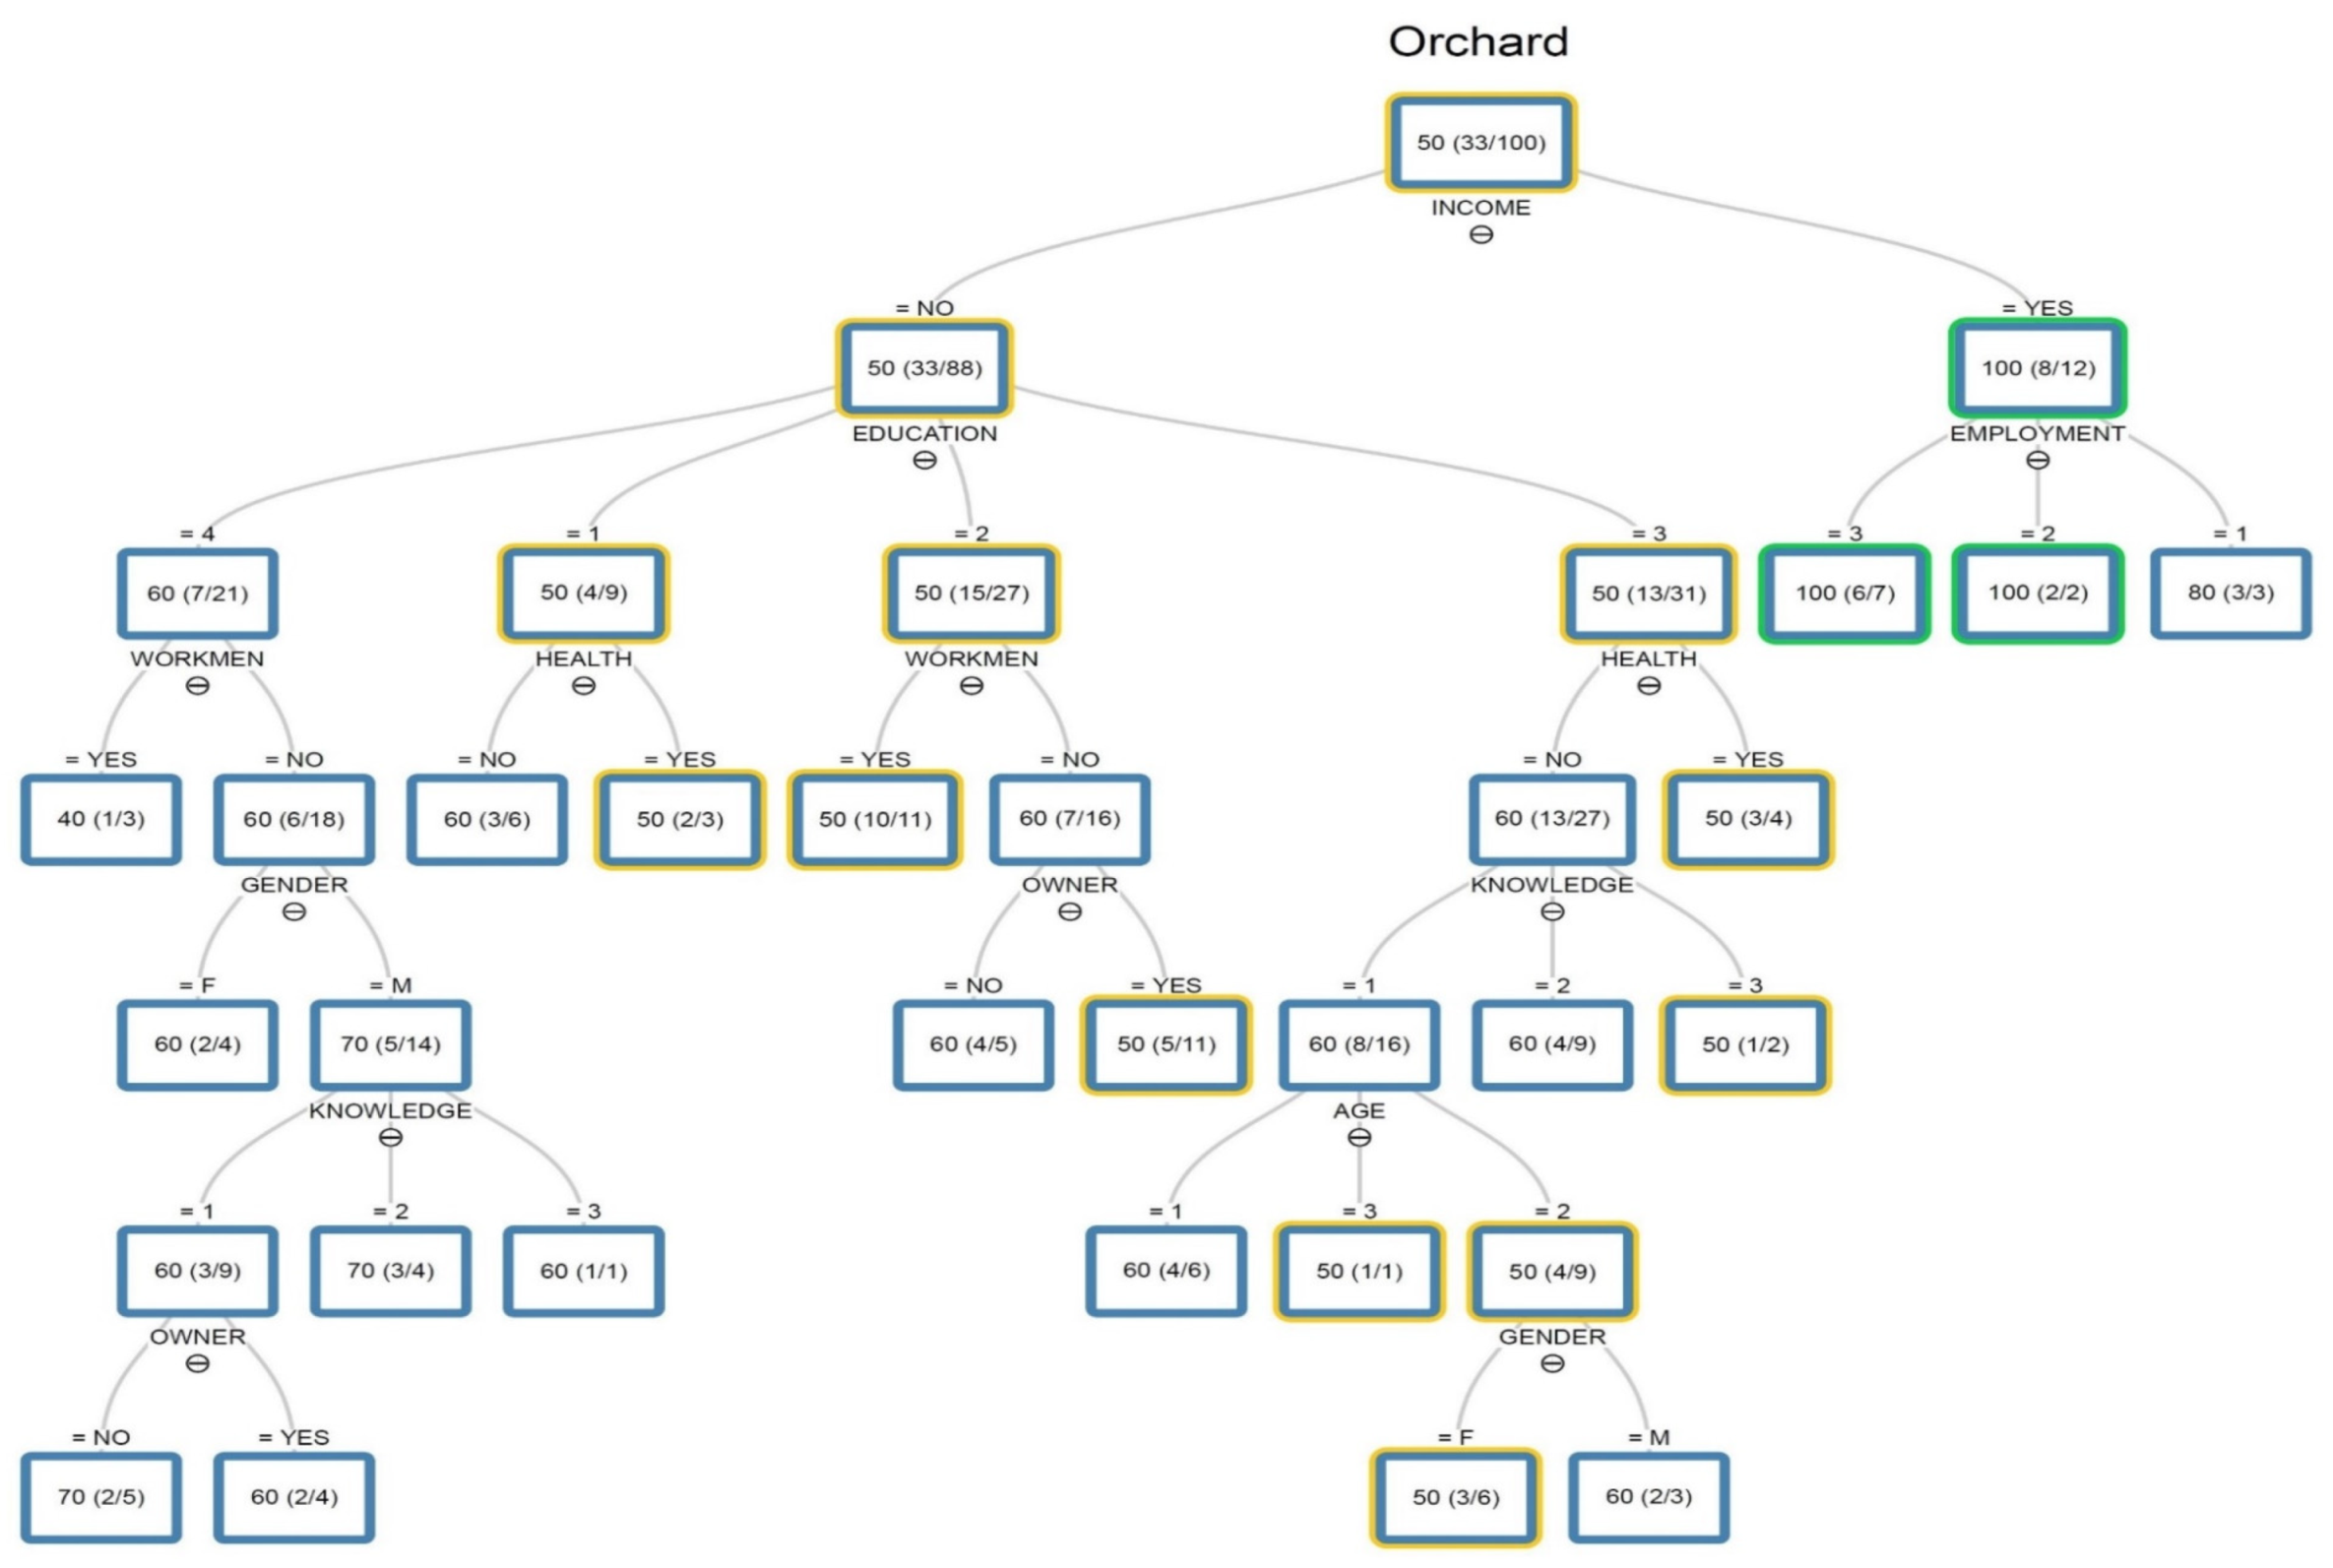
The decision tree exploring the WTP for the orchard (Figure A3) is almost equal to the decision tree that analyse the behaviour of the local rural community towards the olive grove. Consequently, 33 respondents showed nearly the same features as described above and declared a WTP equal to 50%.
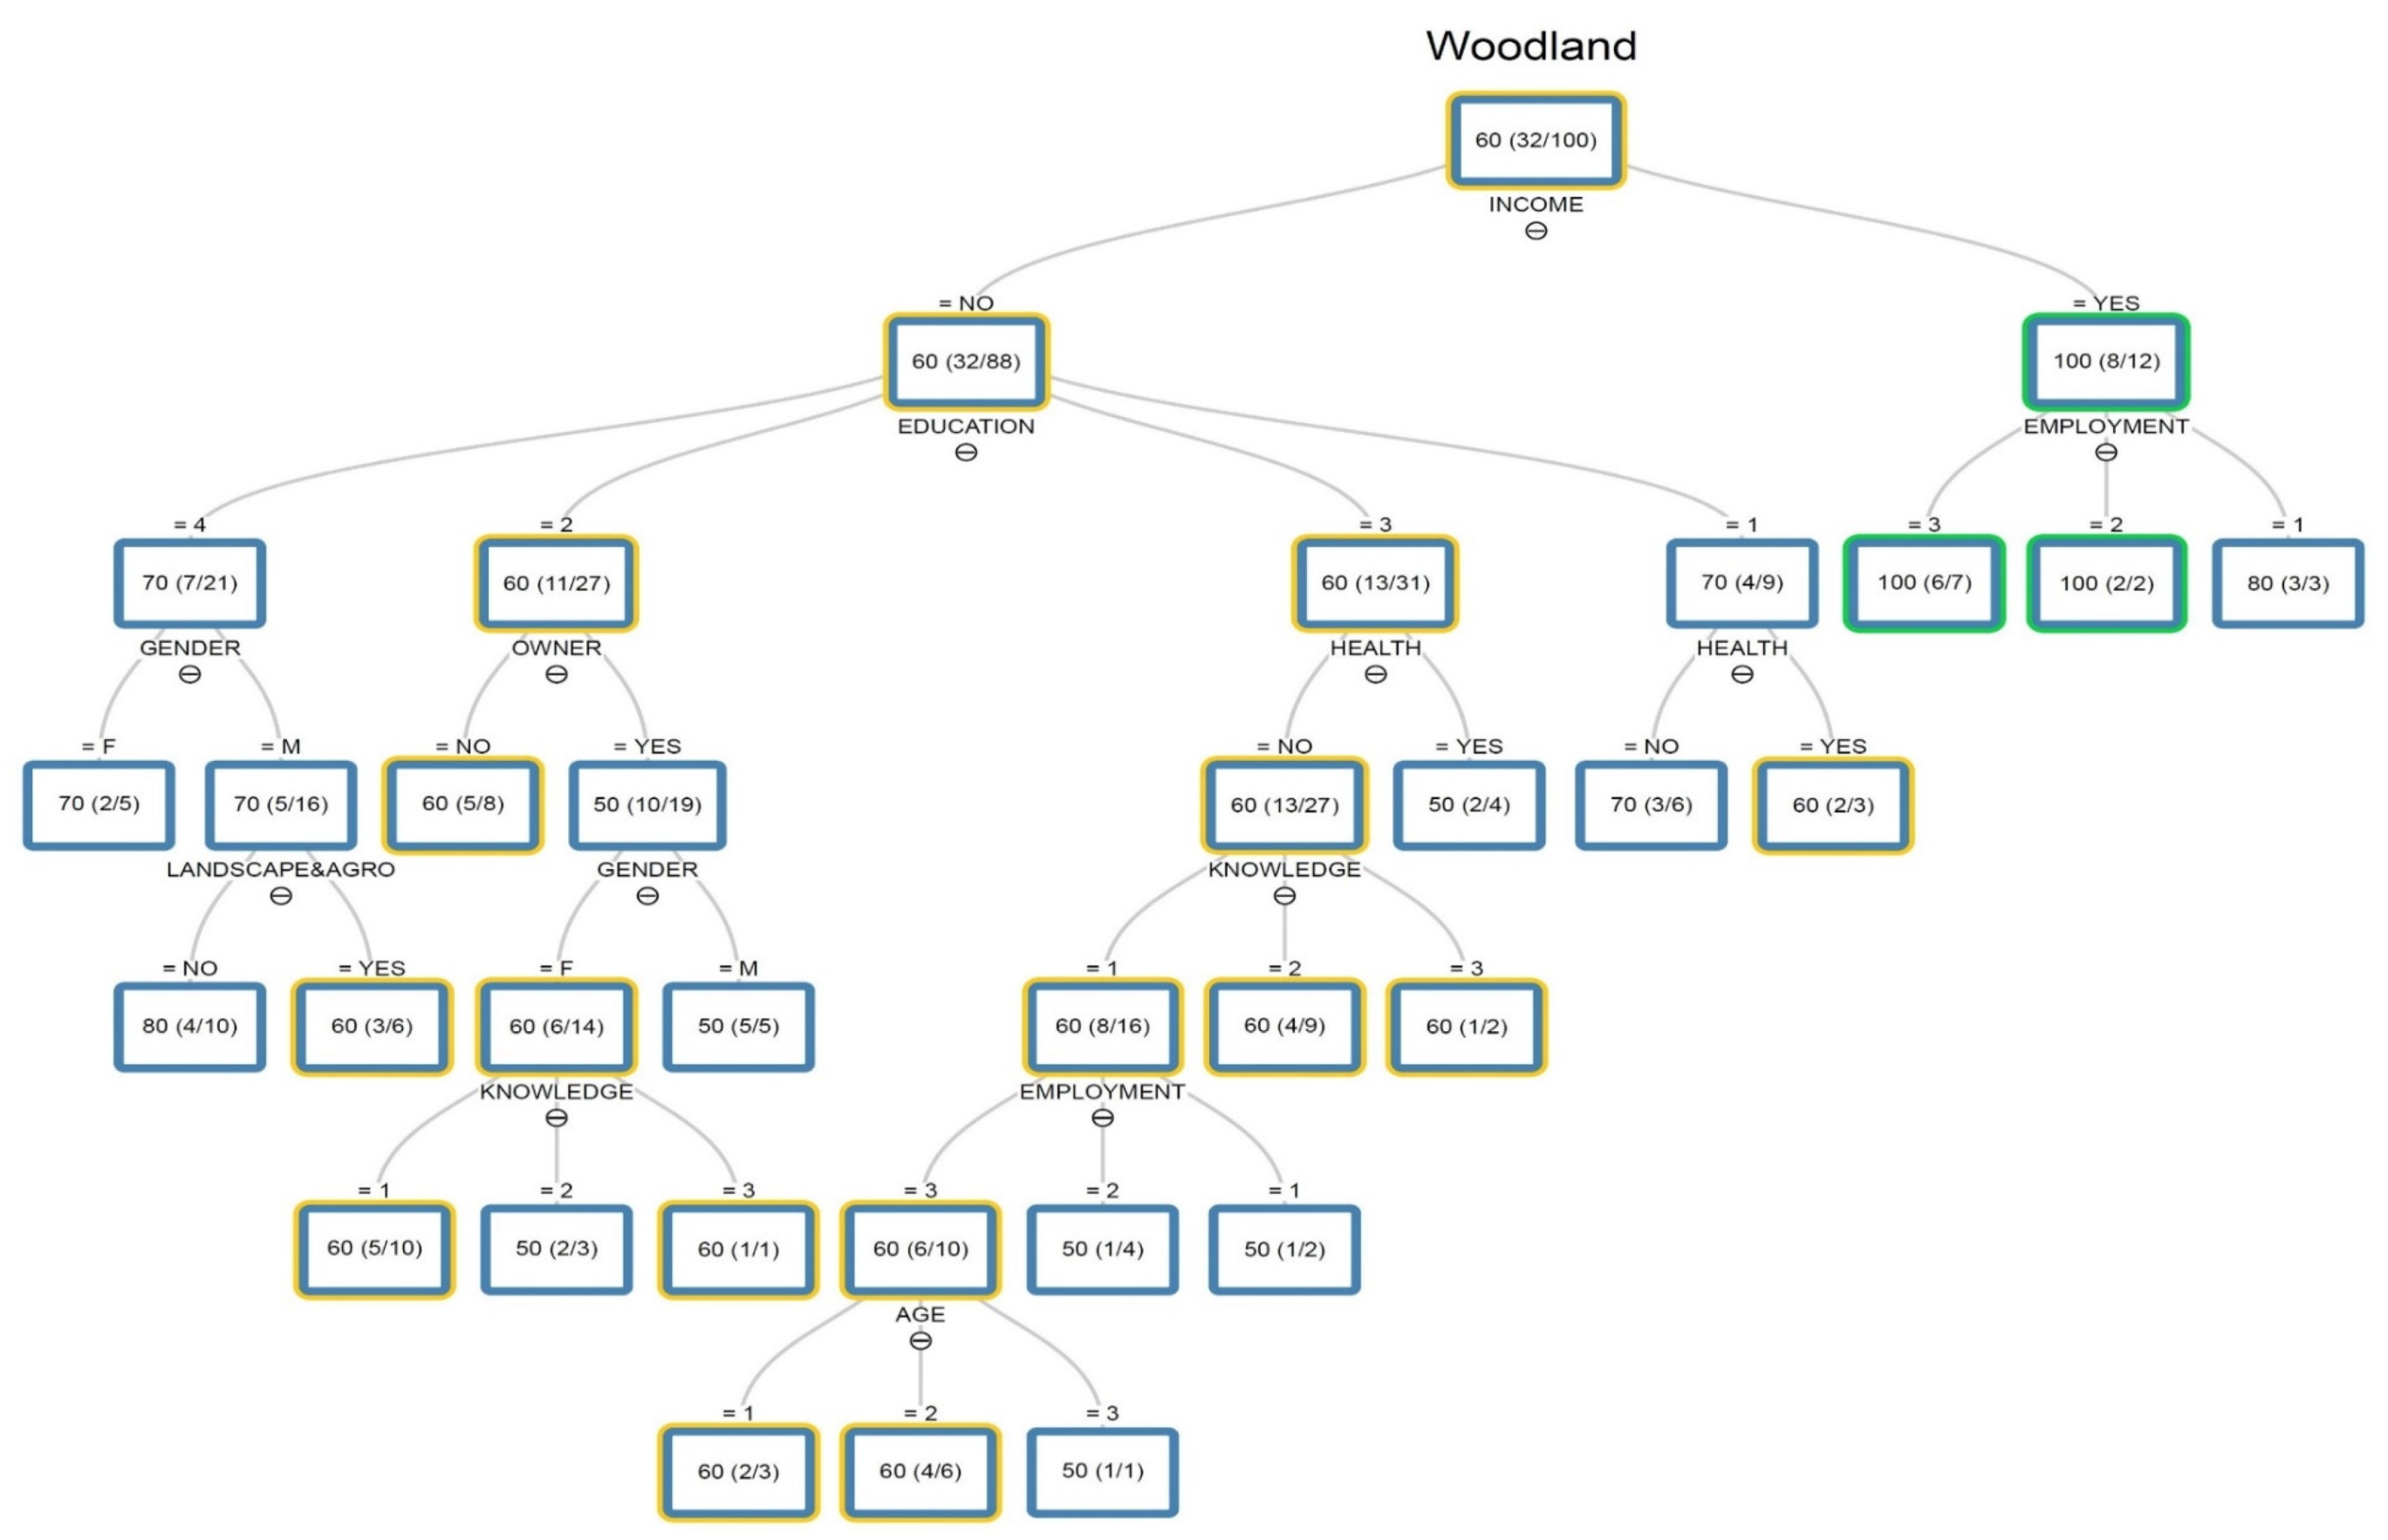
Regarding the woodland (Figure A4), it is observed that the main WTP is 60% and it is declared by 32 respondents, who do not believe that wind turbines may increase their income. Additionally, they hold a high school degree and are not worried about impacts on health, they have not any knowledge on wind energy, they are workers in agriculture, and between 41 and 60 years old.
The decision tree investigating the WTP for the livestock farm (Figure A5) is the last showing the income increase as root node. Here, the main WTP is 60% and refers to 32 respondents out of 100 who think that the income increase is not possible, they hold a secondary school degree, and they are not concerned by the damage to human health that turbines may cause. Furthermore, these respondents are workers in agriculture, they are not informed on wind energy and they believe that the wind turbines do not affect the visual quality of landscaper, nor cause alteration of the agroecosystem.
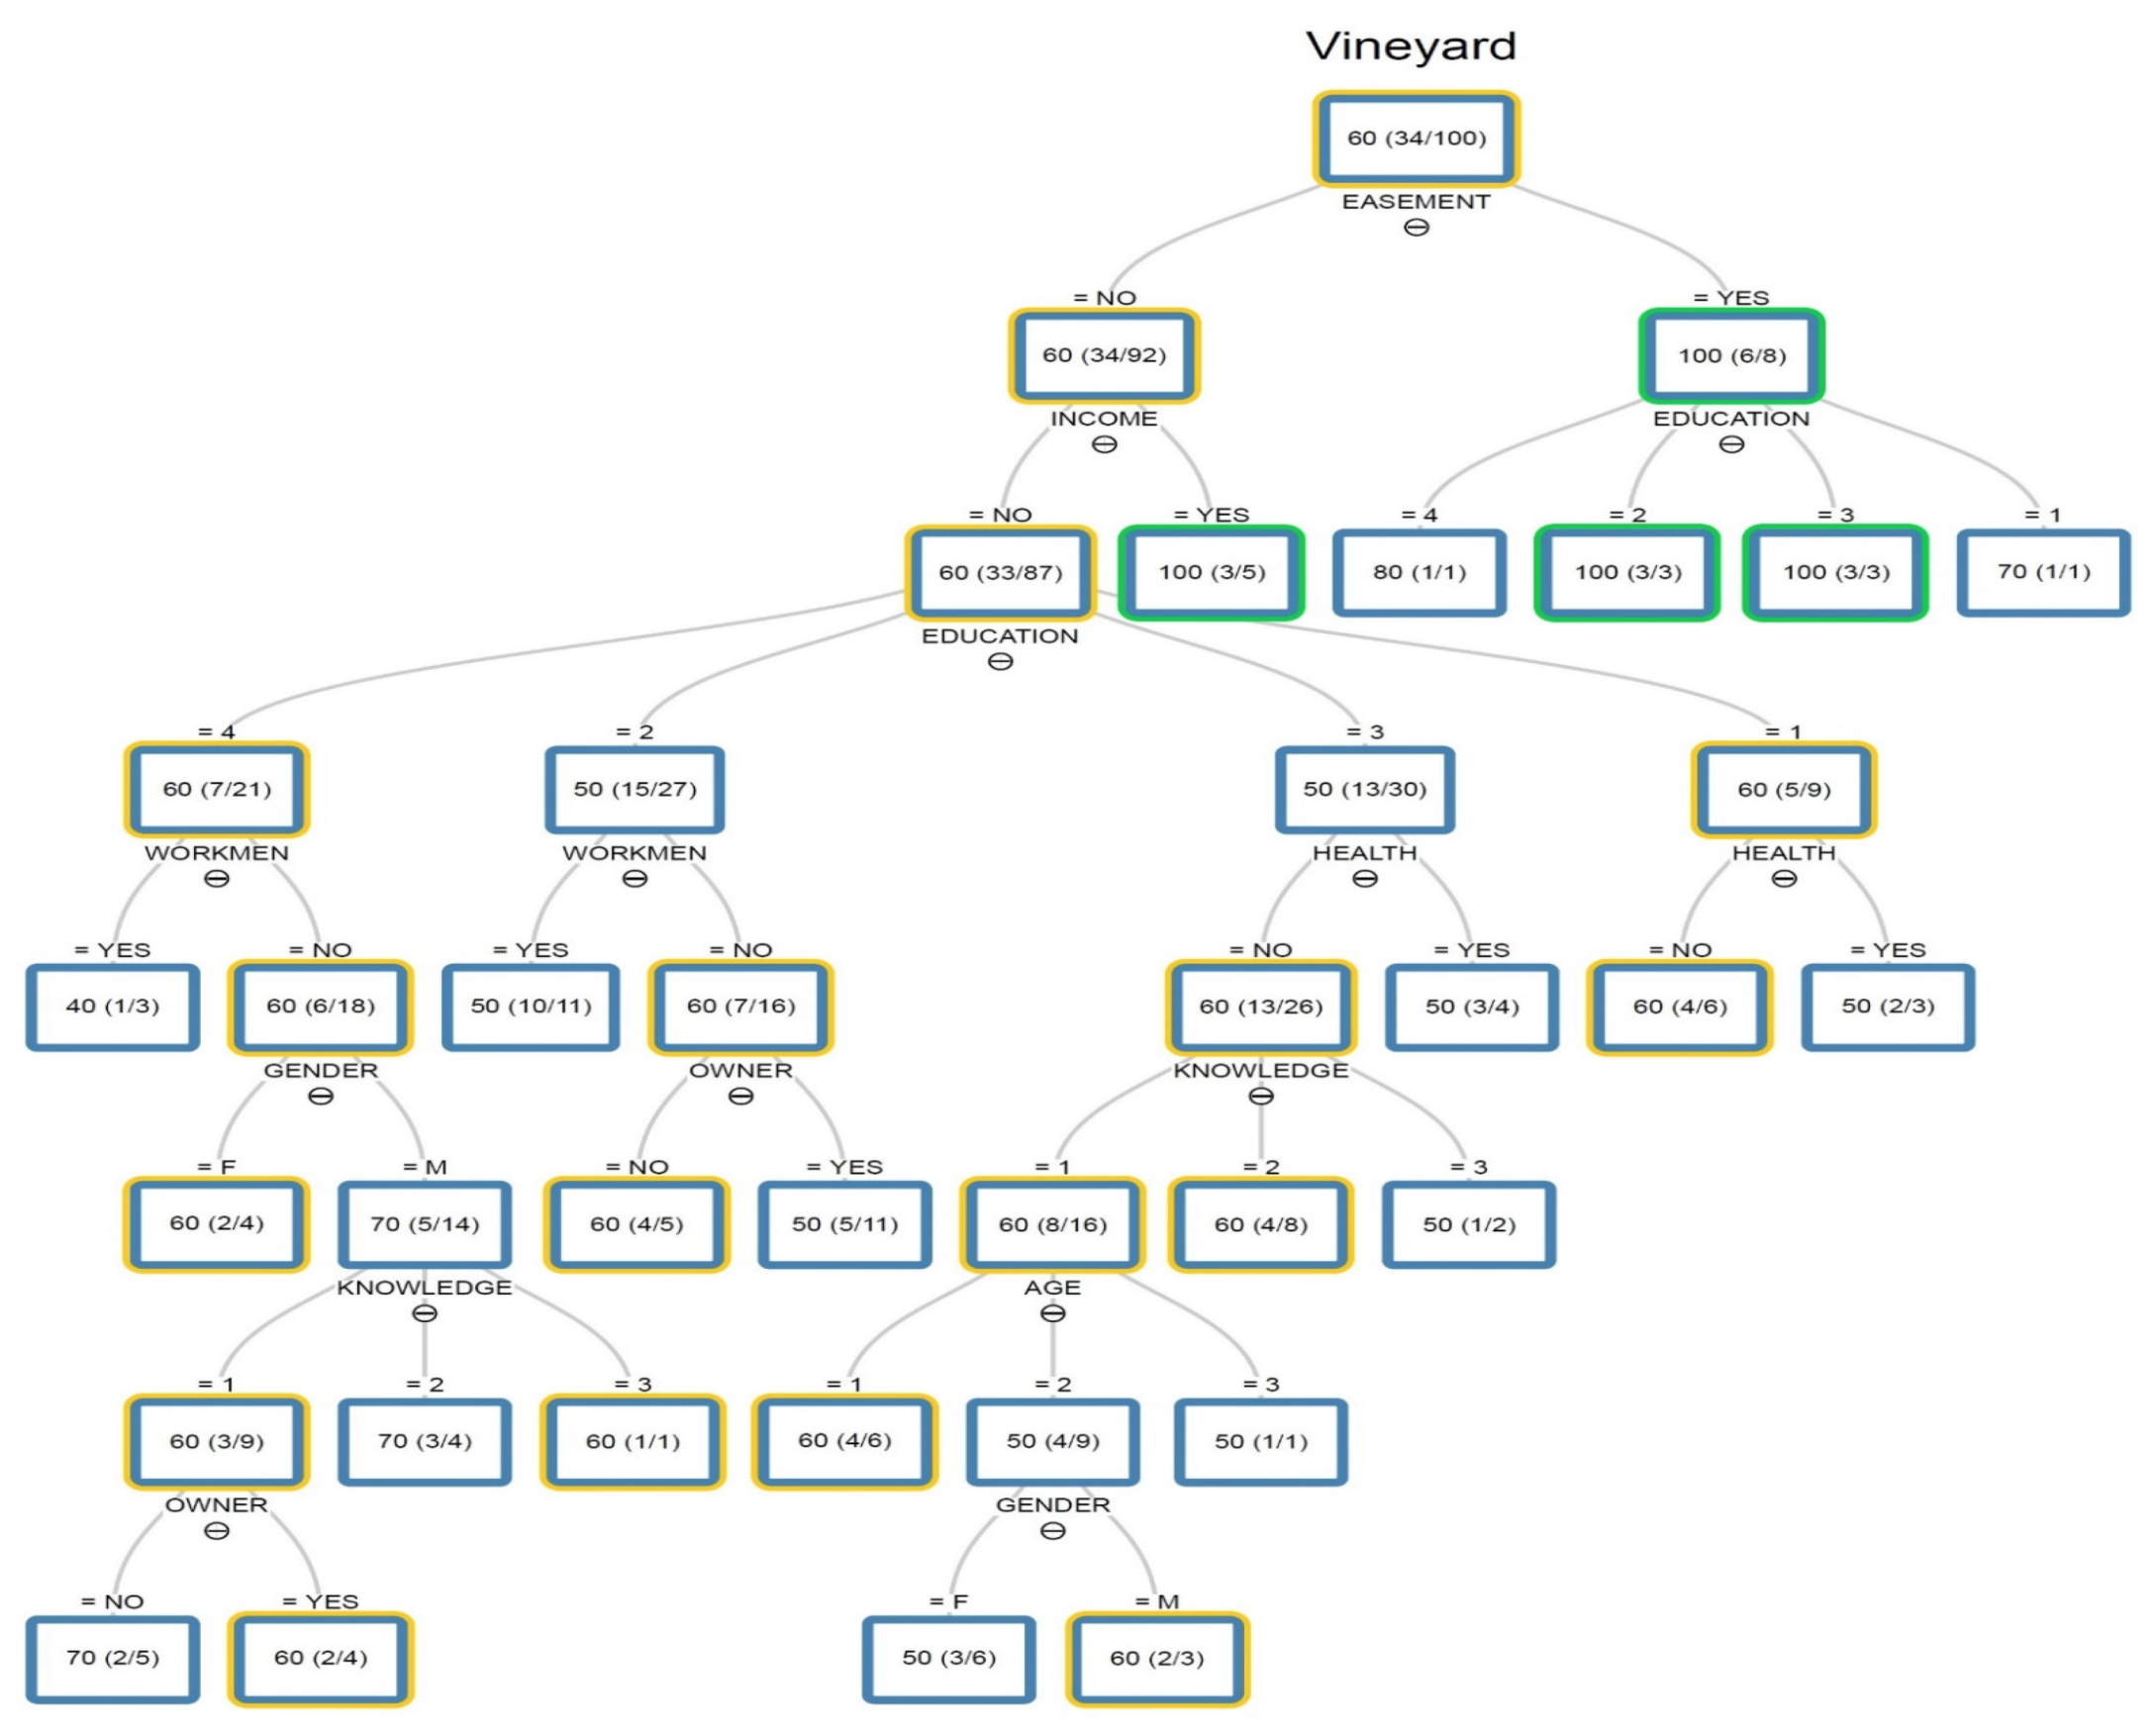
Concerning the last two decision trees, namely vineyard and rural facilities, the root node indicates the owners of farmlands subject to wind turbines. Moreover, in the case of vineyards (Figure A6), the prevailing WTP is 60% and relates to 34 respondents. They do not own farmlands subject to wind turbines and do not expect to increase their income thanks to this technology. In addition, they are graduate or postgraduate and they are not bothered by the maintenance workmen in the farmland. Moreover, these respondents are male without knowledge on wind energy, and they already own a farmland in the study area.
Finally, even for the rural facilities (Figure A7) the most frequent WTP is 60% and it is observed in 33 respondents out of 100. They do not own farmlands subject to wind turbines and do not expect any income increase. Moreover, they do not care about cultivation and/or building constraints and believe that the turbines do not threat both the visual quality of landscape and the agroecosystem. Lastly, these respondents hold a high school degree, they are not informed on wind energy, and are between 41 and 60 years old.
Table 4 reports the number of records (i.e., objects) split by the nodes (i.e., variables) for each type of farmland and the global influence of the variables on the WTP in the study area expressed as average percentage. In particular, the education level is the most important variable within the demographic, social, and economic features of respondents, showing an average percentage of 87.6% and the highest influence of this variable is observed in the vineyard with 95 records. Additionally, the possibility to increase the income thanks to the installation of wind turbines is the most important variable within the positive effects of wind turbines declared by the local rural community, with an average percentage of 97.7% and the highest influence is observed in five farmlands out of seven with 100 records each, except in vineyard and rural facilities. Lastly, the variables indicating concern for the impacts of wind turbines on human health and for maintenance workmen in the farmland are the most important within the negative effects of turbines declared by the local rural community. Specifically, the former variable has an average percentage of 36.3% and the highest influence occurs in livestock farm (58 records). The last variable shows an average percentage of 36.1% with the greatest influence in sowable crops with a total of 88 records. The variables that do not influence the WTP at all are the effects of wind turbines on job increase, the perception about the attention paid by energy companies to public opinion, and the possibility to use wind turbines to recover marginal areas. These variables do not occur in any decision tree, because they have no relevance to the final decision based on the parameters set for building the trees (i.e., three records per node, gain-ratio method, and reduced error pruning) [79].
The C4.5 algorithm made it possible to generate also the set of classification rules for each type of farmland after the creation of the decision trees. These rules provide a sort of linguistic interpretation of the decision trees from the root node, through the chance nodes until the leaf node. Thus, they represent a valuable support tool to better understand the behaviour of the respondents in making the decision on the WTP. The number of classification rules for each type of farmland are as follows: 22 rules for sowable crops; 23 rules for vineyard; 19 rules for olive grove; 21 rules for orchard; 24 rules for livestock farm; 26 rules for rural facilities; and 21 rules for woodland. Table 5 shows some exemplary rules for all the types of farmland, particularly the rules classifying the respondents on the basis of the most frequent and the highest WTPs. These exemplary rules were selected among those rules having the highest number of nodes (i.e., variables), and in the case of rules with an equal number of nodes the preference was given to the rules supporting the highest number of records (i.e., observations). The interpretation of the rules follows a general structure where the root and child nodes are in the first part of the rule (If …), while a certain leaf node is reported in the second part of the rule (then …). For instance, the first classification rule should be interpreted as follows: “If the potential buyers are between 41 and 60 years old, they hold a high school degree, they are workers in agriculture, they have no knowledge on wind energy, they are not concerned by impacts on human health, nor by the presence of maintenance workmen and the depreciation of farmland, and they believe that the wind turbines cannot increase their income, then they are willing to pay for farmland with sowable crops at 60% of its market value”.
Finally, Table 6 shows the classification accuracy of the decision tree obtained by the confusion matrices of the farmlands. Although the sample size is not large because of the sample inclusion criteria and the questionnaires is not valid, the C4.5 algorithm returned a fairly reliable classification. Indeed, the overall classification accuracy ranges between 60% and 65% in almost all the farmlands, except in woodland where this accuracy is equal to 59%.

4. Discussion

The overall findings of the sample description highlight a broad acceptance towards the wind farm in the study area, in agreement with the findings by other scholars [80,81]. However, most of the scientific literature is focused on residential properties, and only few studies have investigated the impacts of wind turbines on farmland value. Moreover, these studies did not report similar results, since they underlined both a reduction and increase of farmland value [14,47,48,49,50,82]. Although the availability of wind energy could boost the development of sustainable rural activities, such as greenhouses, grain mills, oil mills, and dairies, this research shows that the presence of turbines is not always considered a strong economic driver in terms of job creation and income growth, though the contribution of turbines to recover the marginal areas could represent a key factor to ensure cost-effective agriculture. Furthermore, regarding the environmental and social aspects, it is to be noted that these installations are not seen as strong element compromising the visual quality of landscape and causing the alteration of agroecosystem, neither as harmful factor for human health. Subsequently, the results related to the negative effects on farming activity do not show significant issues. Actually, neither the cultivation and/or building constraints, nor the concerns regarding maintenance workmen are seen as a limiting factor. These last aspects explain why there are not severe concerns also on farmland depreciation. As a consequence, this stated wide acceptance can be linked to the “please in my back yard” (PIMBY) attitude [83,84], which takes place when rural actors have adopted a sustainable model viewing wind turbines as isolated technologies conferring distinct and verbalized benefits [85]. In addition, the PIMBY attitude may not necessarily be driven solely by the direct economic benefits of turbines, but also by a strong rural cultural tendency to implant values such as prosperity and modernity within all technologies used for productive purposes [85].
Even though a general broad acceptance of wind turbines emerges from the local rural community, it is to be noted that the data from the interviews and the decision tree classification show a significant reduction of the WTP for all the types of farmland. These findings are in line with some studies that pointed to a decrease of farmland value [49,86], while other scholars highlighted that wind turbines lead to higher farmland transaction prices, though with a minimum effect [14]. Further research found that wind turbines have not significant impact on the value of these properties [47,48,50]. In order to identify the factors affecting the WTP in the study area, the following discussion focuses on the variables that mostly influence WTP (Table 4) without going into the detail of each farmland, since there are not significant variations of both the average and the most frequent WTPs among the types of farmland.
Specifically, it is to be noted that the variable describing the education level occurs in all the farmlands as well as several times within each decision tree starting for the first group of child nodes, except in sowable crops where it occurs in the second group. Nevertheless, the different levels of education cannot be clearly linked to a specific WTP variation, which means that this variable cannot provide homogeneous insight. For instance, in the decision tree of rural facilities, the respondents holding secondary school degree are willing to pay both 50% and 100% of the market value. In this regard, the effect of education has been examined in several studies with inconclusive results [87,88,89]. Hence, it can be assumed that the ambiguous behaviour in the study area may be influenced by the interaction of the education level with other variables, such as the presence of impacts on landscape and agroecosystem and the variable indicating the owner of farmland subject to wind turbines.
The income increase is a key factor too, because it occurs in all the farmlands and it is also a root node in five decision trees out of seven (except in vineyard and rural facilities). When it is supposed that the wind turbines can actually increase the income of farmland owners, then the WTP can be equal to the entire market value (i.e., 100%). Otherwise, the WTP decreases up to 60% except in olive grove and orchard where it further decreases to 50%. This specific finding is consistent with other authors’ insights [87,90,91], which underlined how ensuring some benefits or subsidy as compensation measure to people living in areas subject to wind energy may increase their income, thus positively affecting their attitude towards wind farms or turbines. Moreover, [28] found that rural communities undertake wind energy production mainly to ‘future proof’ the farms, thus increasing the long-term economic viability of rural areas through profitable capital investment and business diversification.
The variable indicating the concerns for impacts on human health occurs in six decision trees out of seven (except in rural facilities) and it is observed the first time between the second and the third groups of child nodes and always after the income increase. The WTP is between 60% and 70% when respondents are not worried by impacts on health. Otherwise, there is a WTP reduction up to 50%. In this case, it is to be noted that reduction of 50% is declared by few respondents, and thus it can be assumed that the influence of this specific variable on the farmland value is high, but less important than the influence exerted by the variable expressing the possibility to increase the income. As other authors underlined [41,42], there are several potential negative effects for human health, such as noise, low-frequency sounds, shadow flicker induced by rotating blades and stroboscopic effects, and high fear of turbine crashing. All these effects may cause annoyance and the so-called wind turbine syndrome (e.g., sleep disturbance, tiredness, headache, memory and concentration loss, depression, migraine, anxiety), leading to a reduction of well-being [92,93,94]. However, regarding rural facilities, it is reasonable to assume that the presence of buildings makes it useful to use electricity, and that only in this case the availability of wind energy may be perceived as an advantage, making the respondents less sensitive with respect to the possible negative effects on health. This assumption is consistent with [42,95], who underlined how the acceptance of wind farm projects is strictly linked to the social and cultural attitudes, and thus to the belief that this energy is a resource improving the common well-being.
Lastly, the variable expressing the concerns about the presence of maintenance workmen in the farmland occurs in almost all the farmlands, except in rural facilities and woodland. When respondents are concerned by maintenance operations, then the WTP decreases up to 40%. On the contrary, this is between 60% and 70%. As a consequence, it can be assumed that the potential farmland buyers see the presence of maintenance workmen as a strong disturbance factor for agricultural activities. For instance, [96] highlighted that wind turbines usually require several maintenance operations, such as inspection, repairment, and replacement of various parts (e.g., anemometer, main bearing, blades, tower, converter, brake pumps), but also gates, fences, paths, signs, and other access infrastructures that require periodic maintenance [97]. On the other hand, it is reasonable to assume that respondents are not bothered by maintenance workmen in woodland due to the short time spent annually in this farmland. Moreover, concerning rural facilities, it may be stated that maintenance workmen are considered very important to keep the turbines properly efficient in such an anthropic environment, where they can also supply electricity for rural buildings [28,98].

5. Conclusions

In this research, the decision tree was applied to examine the extent to which the easement of wind turbines can influence the WTP of a small rural community for different types of farmland, and to clearly identify the main factors influencing the WTP. The obtained results highlighted a significant reduction of WTP for all farmlands and enabled to clearly identify the main factors that influence the WTP for the farmlands in the study area. These factors are the education level, the possibility to increase income, as well as the concerns for impacts on human health and for the maintenance workmen, although the different levels of education cannot provide homogeneous insight. European and Italian policymakers and public bodies are making great investments to promote the energy transition process through the wind energy, but the development of this source of renewable energy in rural areas is still affected by communities’ perceptions, which often lead to a sharp reduction of the WTP for farmlands. In the light of the results of this research, national and local policy measures targeted to rural communities have to be put in place, in order to inform residents about the ‘magnitude’ of the effects they identified as crucial. In this way, the policymakers and private bodies will contribute concretely to making the farmland market more equitable.
Although the results cannot be extended to the entire local rural community due to the sample inclusion criteria and the consequently limited dataset, this research can be considered a first step for future extensive studies, since it provides new insight to policymakers and private bodies about the mechanisms and capacities of this community to plug into such a complex context. It is also important to highlight that this research identified the variation of farmland value in terms of WTP through an original and comprehensive approach. Actually, the existing studies used data from farmland transaction prices and applied methods like appraisal by chartered surveyors, hedonic regression, price comparison and spatial econometric approaches. Moreover, these studies took into account few aspects, such as visual and noise inconveniences, as well as the distance, height, and capacities of wind turbines.
It is also to be noted that the flexibility and the user friendliness of both the C4.5 algorithm and the KNIME analytics platform suggest that the proposed approach can be replicated in diverse rural territories, taking into account that the results may vary in relation to the farmlands under analysis and the communities’ features and perceptions. Moreover, the obtained decision trees and classification rules required efforts to analyse the results due to their complexity. Thus, the further regulation of splitting, stopping, and pruning steps on a wider dataset could lead to the creation of less complex trees and then to fewer rules.
Despite some drawbacks, this research offers a new viewpoint, but there remains a need for further studies dealing with the same topic and method in order to build a common ground for discussion. Hence, the involvement of more categories of rural actors and the broad exploration of decision tree algorithms have to be encouraged.

Author Contributions

Conceptualization, C.A.; methodology, C.A. and G.O.P.; software, G.O.P.; validation, C.A., A.D.B., R.R. and G.O.P.; formal analysis, C.A. and G.O.P.; investigation, C.A., A.D.B., R.R. and G.O.P.; data curation, A.D.B. and R.R.; writing—original draft preparation, G.O.P. and C.A.; writing—review and editing, G.O.P., A.D.B. and R.R.; supervision, C.A. All authors have read and agreed to the published version of the manuscript.

Funding

This research received no external funding.

Institutional Review Board Statement

Not applicable as this study does not involve humans or animals.

Informed Consent Statement

Informed consent was obtained from all subjects involved in the study.

Data Availability Statement

The data presented in this study are available on request from the corresponding author. The data are not publicly available due to privacy.

Acknowledgments

The authors would like to thank Enza Campanella for text and tables formatting, and Antonia D’Amico for providing support in data collection. They both agreed to be mentioned in this manuscript.

Conflicts of Interest

The authors declare no conflict of interest.

Appendix A

Figure A1. The decision tree describing the WTP for the sowable crops.
Sustainability 13 09630 g0a1
Figure A2. The decision tree describing the WTP for the olive grove.
Sustainability 13 09630 g0a2
Figure A3. The decision tree describing the WTP for the orchard.
Sustainability 13 09630 g0a3
Figure A4. The decision tree describing the WTP for the woodland.
Sustainability 13 09630 g0a4
Figure A5. The decision tree describing the WTP for the livestock farm.
Sustainability 13 09630 g0a5
Figure A6. The decision tree describing the WTP for the vineyard.
Sustainability 13 09630 g0a6
Figure A7. The decision tree describing the WTP for the rural facilities.
Sustainability 13 09630 g0a7

References

  1. European Commission; Joint Research Centre. Territorial Facts and Trends in the EU Rural Areas within 2015–2030; Publications Office of the European Union: Luxembourg, 2018. [Google Scholar]
  2. Poggi, F.; Firmino, A.; Amado, M. Planning Renewable Energy in Rural Areas: Impacts on Occupation and Land Use. Energy 2018, 155, 630–640. [Google Scholar] [CrossRef]
  3. OECD. Linking Renewable Energy to Rural Development; Green Growth Studies; OECD Publishing: Paris, France, 2012; ISBN 978-92-64-18042-0. [Google Scholar]
  4. Wind Europe. Wind Energy in Europe in 2019. Trends and Statistics; Wind Europe: Brussels, Belgium, 2020. [Google Scholar]
  5. Serri, L.; Colle, L.; Vitali, B.; Bonomi, T. Floating Offshore Wind Farms in Italy beyond 2030 and beyond 2060: Preliminary Results of a Techno-Economic Assessment. Appl. Sci. 2020, 10, 8899. [Google Scholar] [CrossRef]
  6. European Commission. Communication from the Commission to the European Parliament, the Council, the European Economic and Social Committee and the Committee of the Regions. Stepping up Europe’s 2030 Climate Ambition. Investing in a Climate-Neutral Future for the Benefit of Our People; European Commission: Brussels, Belgium, 2020. [Google Scholar]
  7. Morano, P.; Tajani, F.; Locurcio, M. GIS Application and Econometric Analysis for the Verification of the Financial Feasibility of Roof-Top Wind Turbines in the City of Bari (Italy). Renew. Sustain. Energy Rev. 2017, 70, 999–1010. [Google Scholar] [CrossRef]
  8. Pellerin-Carlin, T.; Vinois, J.A.; Rubio, E.; Fernandes, S.; Delors, J.; Letta, E. Making the Energy Transition a European Success. Tackling the Democratic, Innovation, Financing and Social Challenges of the Energy Union; Notre Europe Jacques Delors Institut, Studies & Reports: Paris, France, 2017. [Google Scholar]
  9. Liebe, U.; Dobers, G.M. Decomposing Public Support for Energy Policy: What Drives Acceptance of and Intentions to Protest against Renewable Energy Expansion in Germany? Energy Res. Soc. Sci. 2019, 47, 247–260. [Google Scholar] [CrossRef] [Green Version]
  10. Azarova, V.; Cohen, J.; Friedl, C.; Reichl, J. Designing Local Renewable Energy Communities to Increase Social Acceptance: Evidence from a Choice Experiment in Austria, Germany, Italy, and Switzerland. Energy Policy 2019, 132, 1176–1183. [Google Scholar] [CrossRef] [Green Version]
  11. Diógenes, J.R.F.; Claro, J.; Rodrigues, J.C.; Loureiro, M.V. Barriers to Onshore Wind Energy Implementation: A Systematic Review. Energy Res. Soc. Sci. 2020, 60, 101337. [Google Scholar] [CrossRef]
  12. Sadorsky, P. Wind Energy for Sustainable Development: Driving Factors and Future Outlook. J. Clean. Prod. 2021, 289, 125779. [Google Scholar] [CrossRef]
  13. Toke, D. Explaining Wind Power Planning Outcomes. Energy Policy 2005, 33, 1527–1539. [Google Scholar] [CrossRef]
  14. Myrna, O.; Odening, M.; Ritter, M. The Influence of Wind Energy and Biogas on Farmland Prices. Land 2019, 8, 19. [Google Scholar] [CrossRef] [Green Version]
  15. Mulvaney, K.K.; Woodson, P.; Prokopy, L.S. Different Shades of Green: A Case Study of Support for Wind Farms in the Rural Midwest. Environ. Manag. 2013, 51, 1012–1024. [Google Scholar] [CrossRef]
  16. Wheeler, R. Reconciling Windfarms with Rural Place Identity: Exploring Residents’ Attitudes to Existing Sites. Sociol. Rural. 2017, 57, 110–132. [Google Scholar] [CrossRef]
  17. Copena, D.; Simón, X. Wind Farms and Payments to Landowners: Opportunities for Rural Development for the Case of Galicia. Renew. Sustain. Energy Rev. 2018, 95, 38–47. [Google Scholar] [CrossRef]
  18. Mills, S. Wind Energy and Rural Community Sustainability. In Handbook of Sustainability and Social Science Research; Leal Filho, W., Marans, R.W., Callewaert, J., Eds.; Springer International Publishing: Berlin, Germany, 2018; pp. 215–225. [Google Scholar]
  19. Bergmann, A.; Colombo, S.; Hanley, N. Rural versus Urban Preferences for Renewable Energy Developments. Ecol. Econ. 2008, 65, 616–625. [Google Scholar] [CrossRef]
  20. Williams, K. Relative Acceptance of Traditional and Non-Traditional Rural Land Uses: Views of Residents in Two Regions, Southern Australia. Landsc. Urban Plan. 2011, 103, 55–63. [Google Scholar] [CrossRef]
  21. Guan, J.; Zepp, H. Factors Affecting the Community Acceptance of Onshore Wind Farms: A Case Study of the Zhongying Wind Farm in Eastern China. Sustainability 2020, 12, 6894. [Google Scholar] [CrossRef]
  22. Van der Horst, D.; Toke, D. Exploring the Landscape of Wind Farm Developments; Local Area Characteristics and Planning Process Outcomes in Rural England. Land Use Policy 2010, 27, 214–221. [Google Scholar] [CrossRef]
  23. D’Souza, C.; Yiridoe, E.K. Social Acceptance of Wind Energy Development and Planning in Rural Communities of Australia: A Consumer Analysis. Energy Policy 2014, 74, 262–270. [Google Scholar] [CrossRef]
  24. Groth, T.M.; Vogt, C.A. Rural Wind Farm Development: Social, Environmental and Economic Features Important to Local Residents. Renew. Energy 2014, 63, 1–8. [Google Scholar] [CrossRef]
  25. Phimister, E.; Roberts, D. The Role of Ownership in Determining the Rural Economic Benefits of On-Shore Wind Farms: The Rural Economic Benefits of Wind Farms. J. Agric. Econ. 2012, 63, 331–360. [Google Scholar] [CrossRef]
  26. Cowell, R.; Bristow, G.; Munday, M. Acceptance, Acceptability and Environmental Justice: The Role of Community Benefits in Wind Energy Development. J. Environ. Plan. Manag. 2011, 54, 539–557. [Google Scholar] [CrossRef]
  27. Cerroni, S.; Venzi, L. Rural Communities and Wind Farms: A Contingent Valuation Investigation. Riv. Econ. Agrar. 2013, 23–40. [Google Scholar] [CrossRef]
  28. Sutherland, L.-A.; Holstead, K.L. Future-Proofing the Farm: On-Farm Wind Turbine Development in Farm Business Decision-Making. Land Use Policy 2014, 36, 102–112. [Google Scholar] [CrossRef]
  29. Milbrandt, A.R.; Heimiller, D.M.; Perry, A.D.; Field, C.B. Renewable Energy Potential on Marginal Lands in the United States. Renew. Sustain. Energy Rev. 2014, 29, 473–481. [Google Scholar] [CrossRef]
  30. Rudolph, D.; Kirkegaard, J.K. Making Space for Wind Farms: Practices of Territorial Stigmatisation in Rural Denmark. Antipode 2019, 51, 642–663. [Google Scholar] [CrossRef]
  31. Vecchiato, D. How Do You like Wind Farms? Understanding People’s Preferences about New Energy Landscapes with Choice Experiments. Aestimum 2014, 15–37. [Google Scholar] [CrossRef]
  32. Caporale, D.; De Lucia, C. Social Acceptance of On-Shore Wind Energy in Apulia Region (Southern Italy). Renew. Sustain. Energy Rev. 2015, 52, 1378–1390. [Google Scholar] [CrossRef]
  33. Bernetti, I.; Bambi, L.; Barbierato, E.; Borghini, T.; Capecchi, I. A Decision Support System for Assessing the Perception and Acceptance of WTs in High-Value Landscapes: The Case of Chianti Classico (Italy). Aestimum 2020, 19–42. [Google Scholar] [CrossRef]
  34. De Sousa, A.J.G.; Kastenholz, E. Wind Farms and the Rural Tourism Experience–Problem or Possible Productive Integration? The Views of Visitors and Residents of a Portuguese Village. J. Sustain. Tour. 2015, 23, 1236–1256. [Google Scholar] [CrossRef]
  35. Silva, L.; Delicado, A. Wind Farms and Rural Tourism: A Portuguese Case Study of Residents’ and Visitors’ Perceptions and Attitudes. Morav. Geogr. Rep. 2017, 25, 248–256. [Google Scholar] [CrossRef] [Green Version]
  36. Mordue, T.; Moss, O.; Johnston, L. The Impacts of Onshore-Windfarms on a UK Rural Tourism Landscape: Objective Evidence, Local Opposition, and National Politics. J. Sustain. Tour. 2020, 28, 1882–1904. [Google Scholar] [CrossRef]
  37. Shaw, H.; Ashworth, P.; Hall, N. Exploring Community Acceptance of Rural Wind Farms in Australia: A Snapshot; CSIRO: Camberra, Australia, 2012. [Google Scholar] [CrossRef]
  38. European Commission; Joint Research Centre. The Social Acceptance of Wind Energy: Where We Stand and the Path Ahead; Publications Office of the European Union: Luxembourg, 2016. [Google Scholar]
  39. Leiren, M.D.; Aakre, S.; Linnerud, K.; Julsrud, T.E.; Di Nucci, M.-R.; Krug, M. Community Acceptance of Wind Energy Developments: Experience from Wind Energy Scarce Regions in Europe. Sustainability 2020, 12, 1754. [Google Scholar] [CrossRef] [Green Version]
  40. Farboud, A.; Crunkhorn, R.; Trinidade, A. ‘Wind Turbine Syndrome’: Fact or Fiction? J. Laryngol. Otol. 2013, 127, 222–226. [Google Scholar] [CrossRef]
  41. Jeffery, R.D.; Krogh, C.; Horner, B. Adverse Health Effects of Industrial Wind Turbines. Can. Fam. Physician 2013, 59, 473–475. [Google Scholar] [PubMed]
  42. Simos, J.; Cantoreggi, N.; Christie, D.; Forbat, J. Wind Turbines and Health: A Review with Suggested Recommendations. Environ. Risques Santé 2019, 18, 1–11. [Google Scholar]
  43. McCarthy, I.; Balli, H.O. Windfarms and Residential Property Values. Int. J. Strateg. Prop. Manag. 2014, 18, 116–124. [Google Scholar] [CrossRef] [Green Version]
  44. Gibbons, S. Gone with the Wind: Valuing the Visual Impacts of Wind Turbines through House Prices. J. Environ. Econ. Manag. 2015, 72, 177–196. [Google Scholar] [CrossRef] [Green Version]
  45. Sunak, Y.; Madlener, R. The Impact of Wind Farm Visibility on Property Values: A Spatial Difference-in-Differences Analysis. Energy Econ. 2016, 55, 79–91. [Google Scholar] [CrossRef]
  46. Jensen, C.U.; Panduro, T.E.; Lundhede, T.H.; Nielsen, A.S.E.; Dalsgaard, M.; Thorsen, B.J. The Impact of On-Shore and off-Shore Wind Turbine Farms on Property Prices. Energy Policy 2018, 116, 50–59. [Google Scholar] [CrossRef]
  47. Sims, S.; Dent, P. Property Stigma: Wind Farms Are Just the Latest Fashion. J. Prop. Investig. Financ. 2007, 25, 626–651. [Google Scholar] [CrossRef]
  48. Sims, S.; Dent, P.; Oskrochi, G.R. Modelling the Impact of Wind Farms on House Prices in the UK. Int. J. Strateg. Prop. Manag. 2008, 12, 251–269. [Google Scholar] [CrossRef] [Green Version]
  49. Heintzelman, M.D.; Tuttle, C.M. Values in the Wind: A Hedonic Analysis of Wind Power Facilities. Land Econ. 2012, 88, 571–588. [Google Scholar] [CrossRef]
  50. Vyn, R.J.; McCullough, R.M. The Effects of Wind Turbines on Property Values in Ontario: Does Public Perception Match Empirical Evidence? Can. J. Agric. Econ. Can. Agroecon. 2014, 62, 365–392. [Google Scholar] [CrossRef]
  51. Munday, M.; Bristow, G.; Cowell, R. Wind Farms in Rural Areas: How Far Do Community Benefits from Wind Farms Represent a Local Economic Development Opportunity? J. Rural Stud. 2011, 27, 1–12. [Google Scholar] [CrossRef]
  52. Kotu, V.; Deshpande, B. Classification. In Data Science Conceps and Practice; Morgan Kaufmann: Burlington, MA, USA, 2018; pp. 65–163. ISBN 978-0-12-814761-0. [Google Scholar]
  53. Smith, C. Decision Trees and Random Forests: A Visual Introduction for Beginners; Blue Windmill Media: Sheffield, UK, 2017. [Google Scholar]
  54. Rokach, L.; Maimon, O. Data Mining with Decision Trees: Theory and Applications, 2nd ed.; World Scientific: Hackensack, NJ, USA, 2015; ISBN 978-981-4590-07-5. [Google Scholar]
  55. Song, Y.; Lu, Y. Decision Tree Methods: Applications for Classification and Prediction. Shanghai Arch. Psychiatry 2015, 27, 130–135. [Google Scholar] [PubMed]
  56. Gorsevski, P.V.; Cathcart, S.C.; Mirzaei, G.; Jamali, M.M.; Ye, X.; Gomezdelcampo, E. A Group-Based Spatial Decision Support System for Wind Farm Site Selection in Northwest Ohio. Energy Policy 2013, 55, 374–385. [Google Scholar] [CrossRef]
  57. Villacreses, G.; Gaona, G.; Martínez-Gómez, J.; Jijón, D.J. Wind Farms Suitability Location Using Geographical Information System (GIS), Based on Multi-Criteria Decision Making (MCDM) Methods: The Case of Continental Ecuador. Renew. Energy 2017, 109, 275–286. [Google Scholar] [CrossRef]
  58. Sagbansua, L.; Balo, F. Decision Making Model Development in Increasing Wind Farm Energy Efficiency. Renew. Energy 2017, 109, 354–362. [Google Scholar] [CrossRef]
  59. Frew, E.J.; Whynes, D.K.; Wolstenholme, J.L. Eliciting Willingness to Pay: Comparing Closed-Ended with Open-Ended and Payment Scale Formats. Med. Decis. Mak. 2003, 23, 150–159. [Google Scholar] [CrossRef]
  60. Ben Amor, N.; Benferhat, S.; Elouedi, Z. Qualitative classification and evaluation with possibilistic decision trees. In Modem Information Processing: From Theory to Applications; Bouchon-Meunier, B., Coletti, G., Yager, R.R., Eds.; Elsevier: Amsterdam, The Netherlands, 2006; pp. 159–169. [Google Scholar]
  61. Kotu, V.; Deshpande, B. Predictive Analytics and Data Mining: Concepts and Practice with RapidMiner; Morgan Kaufmann: Amsterdam, The Netherlands, 2015; ISBN 978-0-12-801460-8. [Google Scholar]
  62. Cherfi, A.; Nouira, K.; Ferchichi, A. Very Fast C4.5 Decision Tree Algorithm. Appl. Artif. Intell. 2018, 32, 119–137. [Google Scholar] [CrossRef]
  63. Singh, S.; Gini, M. Comparative Study Id3, Cart And C4.5 Decision Tree Algorithm: A Survey. Int. J. Adv. Inf. Sci. Technol. 2014, 3, 47–52. [Google Scholar]
  64. Tan, P.N.; Steinbach, M.; Kumar, V. Classification: Basic Concepts, Decision Trees, and Model Evaluation. In Introduction to Data Mining; Pearson Education Limited: London, UK, 2014. [Google Scholar]
  65. Rokach, L.; Maimon, O. (Eds.) Decision Trees. In Data Mining and Knowledge Discovery Handbook; Springer: New York, NY, USA, 2005; pp. 165–192. ISBN 978-0-387-24435-8. [Google Scholar]
  66. Hssina, B.; Merbouha, A.; Ezzikouri, H.; Erritali, M. A Comparative Study of Decision Tree ID3 and C4.5. Int. J. Adv. Comput. Sci. Appl. 2014, 4. [Google Scholar] [CrossRef] [Green Version]
  67. Witten, I.H.; Witten, I.H. Data Mining: Practical Machine Learning Tools and Techniques, 4th ed.; Elsevier: Amsterdam, The Netherlands, 2017; ISBN 978-0-12-804291-5. [Google Scholar]
  68. Kass, G.V. An Exploratory Technique for Investigating Large Quantities of Categorical Data. Appl. Stat. 1980, 29, 119. [Google Scholar] [CrossRef]
  69. Breiman, L.; Friedman, J.H.; Olshen, R.A.; Stone, C.J. Classification And Regression Trees, 1st ed.; Routledge: London, UK, 2017; ISBN 978-1-315-13947-0. [Google Scholar]
  70. Quinlan, J.R. Induction of Decision Trees. Mach. Learn. 1986, 1, 81–106. [Google Scholar] [CrossRef] [Green Version]
  71. Quinlan, J.R. Improved Use of Continuous Attributes in C4.5. J. Artif. Intell. Res. 1996, 4, 77–90. [Google Scholar] [CrossRef] [Green Version]
  72. Salzberg, S.L. C4.5: Programs for Machine Learning by J. Ross Quinlan. Morgan Kaufmann Publishers, Inc., 1993. Mach. Learn. 1994, 16, 235–240. [Google Scholar] [CrossRef] [Green Version]
  73. Hothorn, T.; Hornik, K.; Zeileis, A. Unbiased Recursive Partitioning: A Conditional Inference Framework. J. Comput. Graph. Stat. 2006, 15, 651–674. [Google Scholar] [CrossRef] [Green Version]
  74. Wu, X.; Kumar, V.; Ross Quinlan, J.; Ghosh, J.; Yang, Q.; Motoda, H.; McLachlan, G.J.; Ng, A.; Liu, B.; Yu, P.S.; et al. Top 10 Algorithms in Data Mining. Knowl. Inf. Syst. 2008, 14, 1–37. [Google Scholar] [CrossRef] [Green Version]
  75. Berthold, M.R.; Cebron, N.; Dill, F.; Di Fatta, G.; Gabriel, T.R.; Georg, F.; Meinl, T.; Ohl, P.; Sieb, C.; Wiswedel, B. KNIME: The Konstanz Information Miner. In Proceedings of the 4th Annual Industrial Simulation Conference (ISC), Palermo, Italy, 5–7 June 2006; pp. 58–61. [Google Scholar]
  76. Quinlan, J.R. Simplifying Decision Trees. Int. J. Man-Mach. Stud. 1987, 27, 221–234. [Google Scholar] [CrossRef] [Green Version]
  77. Ting, K.M. Confusion Matrix. In Encyclopedia of Machine Learning; Sammut, C., Webb, G.I., Eds.; Springer International Publishing: Berlin, Germany, 2011. [Google Scholar]
  78. Li, Y.; Zhu, X.; Pan, Y.; Gu, J.; Zhao, A.; Liu, X. A Comparison of Model-Assisted Estimators to Infer Land Cover/Use Class Area Using Satellite Imagery. Remote Sens. 2014, 6, 8904–8922. [Google Scholar] [CrossRef] [Green Version]
  79. Fürnkranz, J. Decision Tree. In Encyclopedia of Machine Learning and Data Mining; Sammut, C., Webb, G.I., Eds.; Springer: New York, NY, USA, 2017; pp. 330–334. [Google Scholar]
  80. Graham, J.B.; Stephenson, J.R.; Smith, I.J. Public Perceptions of Wind Energy Developments: Case Studies from New Zealand. Energy Policy 2009, 37, 3348–3357. [Google Scholar] [CrossRef]
  81. Dugstad, A.; Grimsrud, K.; Kipperberg, G.; Lindhjem, H.; Navrud, S. Acceptance of Wind Power Development and Exposure–Not-in-Anybody’s-Backyard. Energy Policy 2020, 147, 111780. [Google Scholar] [CrossRef]
  82. Oikonomou, E.K.; Kilias, V.; Goumas, A.; Rigopoulos, A.; Karakatsani, E.; Damasiotis, M.; Papastefanakis, D.; Marini, N. Renewable Energy Sources (RES) Projects and Their Barriers on a Regional Scale: The Case Study of Wind Parks in the Dodecanese Islands, Greece. Energy Policy 2009, 37, 4874–4883. [Google Scholar] [CrossRef]
  83. Cousse, J.; Wüstenhagen, R.; Schneider, N. Mixed Feelings on Wind Energy: Affective Imagery and Local Concern Driving Social Acceptance in Switzerland. Energy Res. Soc. Sci. 2020, 70, 101676. [Google Scholar] [CrossRef]
  84. Szulecki, K.; Overland, I. Energy Democracy as a Process, an Outcome and a Goal: A Conceptual Review. Energy Res. Soc. Sci. 2020, 69, 101768. [Google Scholar] [CrossRef]
  85. Brinkman, J.T.; Hirsh, R.F. Welcoming Wind Turbines and the PIMBY (“Please in My Backyard”) Phenomenon: The Culture of the Machine in the Rural American Midwest. Technol. Cult. 2017, 58, 335–367. [Google Scholar] [CrossRef]
  86. Khatri, M. Impact of Wind Farms on the Value of Residential Property and Agricultural Land; Royal Institute of Chartered Surveyors: London, UK, 2004. [Google Scholar]
  87. Dimitropoulos, A.; Kontoleon, A. Assessing the Determinants of Local Acceptability of Wind-Farm Investment: A Choice Experiment in the Greek Aegean Islands. Energy Policy 2009, 37, 1842–1854. [Google Scholar] [CrossRef]
  88. Du Preez, M.; Menzies, G.; Sale, M.C.; Hosking, S.G. Measuring the indirect costs associated with the establishment of a wind farm: An application of the Contingent Valuation Model. J. Energy S. Afr. 2012, 23, 1–9. [Google Scholar] [CrossRef]
  89. Ladenburg, J.; Dahlgaard, J.-O. Attitudes, Threshold Levels and Cumulative Effects of the Daily Wind-Turbine Encounters. Appl. Energy 2012, 98, 40–46. [Google Scholar] [CrossRef]
  90. Devine-Wright, P. Local Aspects of UK Renewable Energy Development: Exploring Public Beliefs and Policy Implications. Local Environ. 2005, 10, 57–69. [Google Scholar] [CrossRef] [Green Version]
  91. Zaunbrecher, B.S.; Arning, K.; Özalay, B.; Natemeyer, H.; Ziefle, M. Pitfalls when placing electricity pylons—The influence of age on acceptance. In Human Aspects of IT for the Aged Population. Design for Aging; ITAP, Lecture Notes in Computer Science; Zhou, J., Salvendy, G., Eds.; Springer International Publishing: Berlin, Germany, 2015; Volume 9193, pp. 282–283. [Google Scholar]
  92. Martin, C.L. Your Guide to Wind Turbine Syndrome … a Roadmap to This Complicated Subject; National Wind Watch, Inc.: Pittsfield, MA, USA, 2010. [Google Scholar]
  93. Bowdler, D. Acoustics Australia; Springer International Publishing: Berlin, Germany, 2012; pp. 67–71. [Google Scholar]
  94. Knopper, L.D.; Ollson, C.A.; McCallum, L.C.; Whitfield Aslund, M.L.; Berger, R.G.; Souweine, K.; McDaniel, M. Wind Turbines and Human Health. Front. Public Health 2014, 2. [Google Scholar] [CrossRef] [Green Version]
  95. Firestone, J.; Bates, A.; Knapp, L.A. See Me, Feel Me, Touch Me, Heal Me: Wind Turbines, Culture, Landscapes, and Sound Impressions. Land Use Policy 2015, 46, 241–249. [Google Scholar] [CrossRef] [Green Version]
  96. Tautz-Weinert, J.; Yürüşen, N.Y.; Melero, J.J.; Watson, S.J. Sensitivity Study of a Wind Farm Maintenance Decision-A Performance and Revenue Analysis. Renew. Energy 2019, 132, 93–105. [Google Scholar] [CrossRef] [Green Version]
  97. Tanaka, A.M.; Anastasopoulos, P.C.; Carboneau, N.; Fricker, J.D.; Habermann, J.A.; Haddock, J.E. Policy Considerations for Construction of Wind Farms and Biofuel Plant Facilities: A Guide for Local Agencies. State Local Gov. Rev. 2012, 44, 140–149. [Google Scholar] [CrossRef]
  98. Leary, J.; Schaube, P.; Clementi, L. Rural Electrification with Household Wind Systems in Remote High Wind Regions. Energy Sustain. Dev. 2019, 52, 154–175. [Google Scholar] [CrossRef]
Table 1. The demographic, social and economic features of the sample.
Feature and CodeScale of MeasurementFrequency (%)
Gender
(GENDER)
F = Female64%
M = Male36%
Age
(AGE)
1 = 18–40 years old39%
2 = 41–60 years old48%
3 = >60 years old13%
Education level
(EDUCATION)
1 = Elementary school11%
2 = Secondary school31%
3 = High school33%
4 = University degree or postgraduate25%
Employment
(EMPLOYMENT)
1 = Freelance professional in agriculture16%
2 = Farmer or agricultural entrepreneur16%
3 = Worker in agriculture 68%
Knowledge on wind energy
(KNOWLEDGE)
1 = None57%
2 = Autonomous36%
3 = Public meetings or debates7%
Attention to public opinion
(ATTENTION)
NO = No attention96%
YES = attention4%
Owner of farmland
(OWNER)
NO = Not owner27%
YES = Owner73%
Owner of farmland subject to wind turbines (EASEMENT)NO = Not owner92%
YES = Owner8%
Table 2. The positive and negative effects of wind turbines on farmlands declared by the local rural community.
Positive Effect and CodeScale of MeasurementFrequency (%)
Job increase
(JOB)
NO = No increase98%
YES = Increase2%
Income increase
(INCOME)
NO = No increase88%
YES = Increase12%
Recovery of marginal areas
(MARGINAL AREAS)
NO = No recovery4%
YES = Recovery96%
Negative Effect and CodeScale of MeasurementFrequency (%)
Impacts on human health
(HEALTH)
NO = No impacts87%
YES = Impacts13%
Impacts on landscape and agroecosystem
(LANDSCAPE&AGRO)
NO = No impacts67%
YES = Impacts33%
Cultivation and/or building constraints
(CONSTRAINTS)
NO = No constraints62%
YES = Constraints38%
Concerns on maintenance workmen
(WORKMEN)
NO = No concerns78%
YES = Concerns22%
Concerns on depreciation of farmland
(DEPRECIATION)
NO = No concerns69%
YES = Concerns 31%
Table 3. The most frequent WTP and the average WTP for each type of farmland.
Farmland and CodeAverage WTP (%)Most Frequent WTP (%)
Sowable crops (SC)65.7%60%
Vineyard (VY)64.0%60%
Olive grove (OG)64.3%50%
Orchard (OR)64.2%50%
Livestock farm (LF)65.6%60%
Rural facilities (RF)63.1%60%
Woodland (WO)66.5%60%
Table 4. The number of objects for each farmland and variable, and the influence of each variable on the WTP (average percentage).
Objects Per Farmland (No.)Average %
SCVYOGORLFRFWO
Demographic, Social and Economic Features
GENDER02727272102117.6%
AGE2016161610231015.9%
EDUCATION8895888888788887.6%
EMPLOYMENT0001262172817.0%
KNOWLEDGE1740274132234131.6%
ATTENTION00000000%
OWNER34253090292722.0%
EASEMENT0100000100028.6%
Positive Effects
JOB00000000%
INCOME100921001001009210097.7%
MARGINAL AREAS00000000%
Negative Effects
HEALTH373940405804036.3%
LANDSCAPE &
AGRO
000029731616.9%
CONSTRAINTS0000087012.4%
WORKMEN88484848210036.1%
DEPRECIATION200002036010.9%
Table 5. The exemplary classification rules for each type of farmland.
Classification RuleFarmland Code
If Age = 2 AND Knowledge = 1 AND Depreciation = NO AND
Employment = 3 AND Health = NO AND Education = 3 AND
Workmen = NO AND Income = NO then WTP = 60%
SC
If Knowledge = 2 AND Depreciation = NO AND Employment = 3 AND Health = NO AND Education = 3 AND Workmen = NO AND
Income = NO then WTP = 100%
SC
If Owner = YES AND Knowledge = 1 AND Gender = M AND
Workmen = NO AND Education = 4 AND Income = NO AND
Easement = NO then WTP = 60%
VY
If Income = YES AND Easement = NO then WTP = 100%VY
If Gender = F AND Age = 2 AND Knowledge = 1 AND Health = NO AND Education = 3 AND Income = NO then WTP = 50%OG
If Employment = 3 AND Income = YES then WTP = 100%OG
If Gender = F AND Age = 2 AND Knowledge = 1 AND Health = NO AND Education = 3 AND Income = NO then WTP = 50%OR
If Employment = 3 AND Income = YES then WTP = 100%OR
If Landscape&Agro = NO AND Knowledge = 1 AND Employment = 3 AND Health = NO AND Education = 2 AND Income = NO
then WTP = 60%
LF
If Knowledge = 2 AND Depreciation = NO AND Employment = 3 AND Health = NO AND Education = 3 AND Income = NO then WTP = 100%LF
If Age = 2 AND Knowledge = 1 AND Education = 3 AND
Landscape&Agro = NO AND Constraints = NO AND Income = NO AND Easement = NO then WTP = 60%
RF
If Age = 1 AND Knowledge = 2 AND Education = 3 AND
Landscape&Agro = NO AND Constraints = NO AND Income = NO AND Easement = NO then WTP = 100%
RF
If Age = 2 AND Employment = 3 AND Knowledge = 1 AND
Health = NO AND Education = 3 AND Income = NO then WTP = 60%
WO
If Employment = 3 AND Income = YES then WTP = 100%WO
Table 6. The classification accuracy for each type of farmland.
Farmland and CodeObjects (No.)Overall
Accuracy (%)
Correctly ClassifiedWrongly Classified
Sowable crops (SC)653565%
Vineyard (VY)653565%
Olive grove (OG)633763%
Orchard (OR)643664%
Livestock farm (LF)604060%
Rural facilities (RF)613961%
Woodland (WO)594159%
Publisher’s Note: MDPI stays neutral with regard to jurisdictional claims in published maps and institutional affiliations.