Article

The Effectiveness of Selected Devices to Reduce the Speed of Vehicles on Pedestrian Crossings

by
Maciej Kruszyna
1,* and
Marta Matczuk-Pisarek
2
1
Faculty of Civil Engineering, Wrocław University of Science and Technology, 50-370 Wrocław, Poland
2
Urząd Miasta Jelenia Góra, Referat Komunikacji Miejskiej i Zarządzania Ruchem, 58-500 Jelenia Góra, Poland
*
Author to whom correspondence should be addressed.
Sustainability 2021, 13(17), 9678; https://doi.org/10.3390/su13179678
Submission received: 21 July 2021 / Revised: 16 August 2021 / Accepted: 25 August 2021 / Published: 28 August 2021

Abstract

:
Accidents involving pedestrians often result in serious injury or death. The main goal of this conducted research is to evaluate selected devices that will help reduce the speed of vehicles on pedestrian crossings. Many devices from a group of “speed control measures” and “mid block tools” (refugee islands, speed tables, and raised pedestrian crossings) are examined to find the most effective ones. In our research, the range of reduction of a vehicle’s speed is used as a main measure of effectiveness, but a wider statistical analysis was conducted as well. One of the results of the research is the identification of three categories of devices referred to as high effectives (good), medium effectives (intermediate), and low or lack of effectives (bad). The content of the paper starts by highlighting the reasons to reduce the vehicle’s speed on pedestrian crossings (as an introduction). Next, we present the description of devices used to reduce the vehicle’s speed with a presentation of the research of their effectiveness. The studies that have been conducted are described in the following chapters: first, the characteristic of method and location, second, with discussion, the results of research and identification of the three categories of devices. The paper is then summarized by conclusions and comments. The research only covered the issues of road traffic engineering. The research was made in Poland, but the conclusions could be useful worldwide due to similar traffic rules and technical solutions.

1. Introduction—Reasons to Reduce the Vehicles Speed on Pedestrian Crossings

The main goal of the conducted research is an evaluation of selected devices in the aspect of reducing vehicles’ speed on pedestrian crossings. Highlighting the reasons to reduce the vehicles speed on pedestrian crossings as a background to the next parts of the research is done first.
Accidents involving pedestrians often result in serious injury or death to these “less protected road users”. There is an increase in the number of accidents involving pedestrians [1]. About 1/3 of fatalities are pedestrians [2]. About ¼ of pedestrian deaths in Europe occur on crossings [3]. In India, 22% of road deaths are related to pedestrians [4], and in North Carolina, 10–20% of pedestrian accidents are fatal [5]. In the Dhaka metropolitan area (Bangladesh), about 65% of fatal collisions are with pedestrians [6]. In Louisiana, there was a greater increase in the number of accidents involving pedestrians than the increase in the total number of accidents [7], although the “safety-in-numbers” effect (i.e., an increase in safety with an increase in the number of pedestrians) has also been reported [8].
Various factors influencing pedestrian accidents have been identified: travel time—it is more dangerous to return home [9] or go at night [4,10,11]; place and population, e.g., student campus [12], the elderly [13,14], young pedestrians [15,16], young drivers [17]; visibility of the crossing [18]; perception and listening including mobile phone using [19,20]; the impact of weather [21]; waiting time for the possibility of the cross [22] also at the access to public transport stops [23,24]; the occurrence of autonomous vehicles [25]; density and differences in the road’s environment [26,27,28].
Sun et al. [7] identify three factors influencing accident rates: location, time, and visibility, whereas Lee et al. [29] listed a number of factors influencing pedestrian behavior, such as: the presence of schools, car ownership, pavement condition, pavement width, bus driving, traffic organization, and the presence of barriers. Solmazer et al. [30] showed significant differences in pedestrian behavior, and other studies show local differences in the perception of pedestrian and driver behavior [31] and the fact that crossing the road also means delays [32]. Ahangar et al. [33] considered the influence of rural drivers’ mental patterns for the reasons for the accidents. Herrero-Fernandez et al. [34] studied the influence of the emotional state of pedestrians.
The following research and descriptions have been undertaken: how drivers react to pedestrians and when they reduce speed [3,35]; prediction of threats through models taking into account the speed limit, distance, lighting, visibility, geometry [36]; uncertainties in pedestrian movement [37]; pedestrian-vehicle (driver) interaction based on an advanced pattern-based approach [38]; the impact of MLS data on the assessment of infrastructure safety [39]; similarities and differences on road and rail pedestrian crossings [40]. The perception of the driver and pedestrian as well as other psychological aspects means the occurrence of one of three situations: the vehicle will stop just before crossing, stop earlier, will not stop—there will be a collision [41].
The above observations result in the fact that studies are also undertaken to assess the risk of pedestrian mortality [42]. The speed of pedestrians was also studied [43]. There is a dependence on the probability of a pedestrian’s death and the vehicle speed (V). When V = 30 km/h, the risk is 5%, when V = 59 km/h—50%, and when V = 80 km/h—90% [44]. This dependency was previously overestimated [45]. A 1% increase in vehicle speed means an 11% increase in pedestrian mortality [46]. Accordingly, it can be considered that V = 30 km/h is a relatively safe speed. Obtaining such a speed value at a pedestrian crossing by a significant group of drivers would allow limiting the consequences of accidents. Such a goal is possible to achieve through the appropriate selection of traffic calming measures, causing the entry to the pedestrian crossing at a speed close to 30 km/h.
In the above description, the limit (critical) values of the instantaneous speed were used. In the analysis of the traffic flow of vehicles, different speed values will appear. Statistical analysis and the use of specific measures such as minimum, maximum and mean value, median, quantiles, skewness, or kurtosis are necessary. For example, the V85 quantile (percentile) of speed was used by Wilmots et al. [47]. Some of these measures will be defined in this paper later. However, more commonly used measures (such as mean value) will not be defined.
As “traffic calming measures”, we understand a wide range of solutions (activities) aimed at, inter alia, for speed reduction. These can be activities related to the organization of the transport network (e.g., introducing one-way roads, using specific markings). Vehicle speed reduction “devices” are specific solutions in the field of traffic calming measures consisting of introducing building objects (elements) into the road’s environment. Examples of such devices are speed tables/bumps, mid-blocks (refugee islands), or raised crossings considered in this paper.

2. The Description of Devices Used to Reduce the Vehicles Speed with a Presentation of the Research of Their Effectiveness

Studies on the effectiveness of speed reduction devices are conducted all over the world. Examples of recent works come from: the USA [48], Philippines [49], New Zealand [50], UK [51], Iran [52], China [53,54], Italy [55,56], Turkey [57], and India [58,59]. Some of the studies were carried out in models [57] or in a virtual environment [17,55]. Zeeger and Bushell [60], based on a review and statistics from Europe and the USA, presented examples of devices that improve pedestrian safety. The frequently analyzed ones include: refugee islands [61] or raised crossings [2].
The introduction of new crossing markings has a positive effect on the behavior of drivers [53]. The perception and acceptance of distances between vehicles depend on the length of the pedestrian crossing and its configuration—people who stay on the refugee island accept shorter intervals. The effectiveness of traffic calming devices varies in confrontation with “drivers’ psychological risk profiles” [56]. The four solutions for multi-lane roads tested there proved their effectiveness with the exception of the configuration: mid-block plus additional color marking. The number of lanes also affects the behavior of pedestrians. When there are six lanes, there are almost six times more collisions than when there are two lanes and twice as many as when there are four lanes [62]. The refugee islands give a greater reduction of speed when connected with lane removal or narrowings. The single rising of the road has a similar effect as the island [48].
The conducted tests of traffic calming devices show that on raised pedestrian crossings: a road’s width has a large impact on speed, mean speed, V ¯ = 26 km/h, and speed reduction, ΔV = 43% [63]. In this work, the standard deviation of the speed, σ = 7.1 km/h, was identified, and in Aronsson [64], σ = 5 km/h. The highest speed reduction applies to speed tables, and then to speed bumps. Barbosa et al. [51] paid attention not to the final value of the speed, but to the range of its reduction. For raised pedestrian crossings, reduction of V85 is by 10%, ΔV is less by 3%, the number of accidents is less by 10% [65], and the median of V is less by 6.5–19.3 km/h [66]. The strongest reduction in speed is with the rising by H = 15 cm [67]. The optimal dimensions of the speed bump were also tested in Turkey using a 1/6 scale model [57]. The study indicated that the optimal dimensions of the speed bump are: 5.0 cm wide and 2.8 cm high. Taking into account the scale of the model, these values should be converted to 30 cm wide and 16.8 cm high.
Alavi [63] presented the following conclusions based on the geometric data of raised pedestrian crossings and on measurements of speed in 96 locations:
  • The mean speed is 26 km/h and mean geometric parameters, length, L = 8.96 m and height, H = 10.82 cm,
  • The logarithmic function is the most appropriate to describe the relationship between the geometric parameters and the reduction of speed,
  • There is a large impact of the road width on speed,
  • The following geometric parameters have a significant effect on the speed: ramp gradient, table length, and height.
Basil et al. [68] take into account the mean speed, V ¯ and the quantile V85. For the symmetrical narrowings, no speed reduction was found, and for speed bumps and directional narrowings—a reduction by 21.1 and 19.9 km/h, respectively. The high homogeneity of the reduction was found, standard deviation, σ = 10 km/h. The quantile V85 is also considered in Ewing [69] and Roess et al. [70]. In these tests, the maximum reduction of speed occurs for the speed bumps (20%) and the minimum reduction is for raised junctions and narrowings.
The results of the Basil et al. research [68] allow estimating the optimal distance between speed reduction devices placed in a series. The optimal distance allows maintaining the recommended speed value along the entire road section. These are the following values:
  • 170 m between the speed bumps and 145 m between the speed tables, for a speed of min. 50 km/h;
  • 85 m between the speed bumps and 70 m between the speed tables, for a speed of max. 40–45 km/h.
Domenichini et al. [55] showed that it is possible to effectively reduce the speed without discomfort to drivers. Before testing the solutions, it was expected that the design would be able to reduce the speed by 8 km/h. The goal was achieved by introducing frequent devices, spaced on average every 200 m, in the form of raised junctions, raised pedestrian crossings, narrowings, and reduction of the width of traffic lanes. In the case of raised crossings, a speed reduction of 15 km/h was achieved.
In each case, the dominant influence of the geometric parameters of the devices and the manner of their arrangement was found. Geometric parameters determine the value of the speed at which an obstacle is overcome, and the distance between successive devices defines the speed reduction area. For example, for roads with the speed, V85 = 40 km/h recorded before the traffic-calming section, on the section equipped with speed reduction devices, the following values were measured: at the site of the deceleration device V85 = 27 km/h, 30 m in front of this device V85 = 33 km/h, and 30 m behind this device V85 = 30 km/h.
Too long speed tables result in a lower reduction of speed [52]. The bigger their height, the lower the speed [58]. The speed tables are characterized by higher speed values than the speed bumps. The devices in the form of single markings fulfill their purpose to a small extent so that the observed speed values are still above the established limit. Similar effects are achieved when the devices are located too far away, i.e., above 225 m [71].
Therefore, the number (density) of devices is important. The spacing of the bumps should be less than 150 m [72]. However, according to Sundo and Diaz [49], drivers accelerate at intervals of more than 100 m. According to Zeeger [73], there are no effects above 200 m, and when the bumps are every 90 m, then V ¯ = 35.8 km/h along the entire road.
The speed is lower when the ratio of the bump’s width (WH) to the road’s width (WR) is lower [68]. In conducted measurements, the speed range was from 21.9 km/h to 33.9 km/h, the average speed V ¯ = 22.3 km/h, a maximum speed equals 51.3 km/h, and minimum speed equals 6.1 km/h.
Falamarzi and Rahmat [52] presented a proposal for the selection of the length of the speed table at a fixed height depending on the assumed speed value. The data from the experiment allowed us to determine the speed (quantile V85) and the scope of application for individual lengths of the speed table, i.e., 6.5 m for the speed of 41.5 km/h and 8.5 m for 47.5 km/h. The conducted observations showed that when the table’s length was increased by 2 m, the speed increased by about 3 km/h. Due to the comfort of driving and ensuring the safety of people in vehicles, the length of the table should not be less than 2 m for local roads with a speed limit of 40 km/h.
The subject of the research of Gupta [58] was the determination of speed changes at bumps of 75 mm and 100 mm high. The most important research results are as follows:
  • 80% of the vehicles slowed down at the hump by 65% compared to the speed on the preceding section,
  • The speed at the bump decreases with the increase of its height.
Resuming, a set of geometrical parameters is important to describe the specific devices. Characterizing the most popular (and considered in the next part of the paper) devices, the following parameters are used (see Figure 1): according to the refugee island, La—length of refugee island, Da—distance between the beginning of the mid-block and pedestrian crossing, Ha—width of asylum in refugee island, S—slope of narrowing, Wa—width of refugee island, Wl—width of lane, W—width of road; according to the speed table, Lh—length of table, Dh—distance between table and pedestrian crossing, Hh—height of table, Wh—width of table, Wl—width of lane; according to the raised pedestrian crossing, Lrc—length of the raised part of the road, Rrc—length of ramp (between raised and non-raised part of road), Hrc—height of raising, Wrc—width of pedestrian crossing, and W—width of road.

3. The Studies That Have Been Conducted—Method and Location

This paper presents the assessment of the effectiveness of selected traffic calming devices in terms of reducing the speed of vehicles at pedestrian crossings. Three types of devices are considered: refugee island, speed table, and raised crossing. Measurements were carried out in several locations in Lower Silesia (south-western Poland, Figure 2). There, 105 places were selected, in four areas of different characters of spatial development: rural, small towns, medium-sized towns, and the large city (Wrocław). In each of these places were selected: 5 refugee islands, 10 speed tables, 10–15 raised pedestrian crossings (10 in urbanized areas and 15 in rural areas) while maintaining the necessary size of the measurement sample.
The first part of the research included the identification of the basic characteristic of traffic (speed and volume) using the SR4 device (Figure 3), which enables the measurement of instantaneous speed, time intervals between vehicles, vehicle length, and, additionally, registration of traffic direction, date and time of measurement. Vehicles are assigned to one of four groups: (1) bicycle, (2) passenger or delivery car, (3) truck or bus, and (4) truck with trailer. The SR4 device is placed in a box mounted directly next to the road, e.g., on a road signpost. The SR4 device collects and processes the data and then sends it electronically to a defined address. The software designed to operate the device provides preliminary statistical processing of the measurement’s data, providing information on the values of speed: mean ( V ¯ ), maximum, quantile V15, and quantile V85 in all the samples and divided into groups of vehicles. Knowing the value of the quantile V85 allows us to identify the problem of moving a significant group of drivers at high speed. The value of quantile V15 is used to identify the slowest vehicles that are causing traffic disruption.
The instantaneous speed of the vehicles towards the pedestrian crossing in two cross sections of the road was measured (Figure 4). The first cross section (P0) is located at the access point to the pedestrian crossing, and the second cross section (P1)—at a distance of 60 m from the crossing. This is the stopping distance in front of a hypothetical obstacle. It is determined assuming that 85% of drivers do not exceed the speed of 60 km/h when approaching a pedestrian crossing.
The speed limits set for urbanized areas apply in most places (in Poland it is 50 km/h); however, there are cases of a local speed limitation of 40 km/h. The speed limits of 30 km/h are introduced in front of the speed bumps and pedestrian crossings. For further analysis, a sample was selected that included 100 passenger cars in each of the designated places with free traffic conditions (the time intervals between vehicles are at least 6 s).
The analyses were performed taking into account: traffic characteristics, constructional details of traffic calming devices, road features, road environment features, and instantaneous speed, in accordance with the measurements taken. This will allow us to start the evaluation of the effectiveness of individual devices (described in the next chapter of the paper).

4. The Results of Research and Identification of the Three Categories of Devices

To assess the effectiveness of traffic-calming devices in the context of reducing vehicle speed a several descriptive statistics tools were used. This makes it possible to identify the variability of traffic and the tendency to drive faster or slower than the average. The most important thing is the evaluation of speed differences, the value of which indicates the effectiveness of the selected traffic-calming device. The subject of the analyzes was a comparison of the speed measurement results obtained in two cross sections (P0 and P1) on the places selected for the tests. Here, the results of descriptive analyzes for all the traffic-calming devices selected for testing are presented, without taking into account the division into areas.
The presented summary of measurement’s results (Table 1) includes quantile V98, quantile V85, mean speed, V ¯ and relative rate of speed’s change, ZV defined according to Formula (1). Additionally are shown: standard deviation, σ, coefficient of variation, WZV—Formula (2), skewness, A—Formula, (3) and kurtosis, K—Formula (4).
Z V = ( V i P 1 V i P 0 ) V i P 1
where:
ZV—relative rate of speed’s change,
V i P 0 —mean speed in cross section P0 [km/h],
V i P 1 —mean speed in cross section P1 [km/h].
W Z V = σ V ¯
where:
WZV—coefficient of variation,
V ¯ —mean speed [km/h],
σ—standard deviation [km/h].
A = M 3 σ 3
where:
A—skewness,
M3—third central moment (the expected value of a third power of the deviation of the random variable from the mean) [km/h].
K = M 4 σ 4 3
where:
K—kurtosis,
M4—fourth central moment (the expected value of a fourth power of the deviation of the random variable from the mean) [km/h].
A large difference in speed values was identified for individual traffic calming devices. The lowest speed values were recorded on the places with speed tables, the highest on those with refugee islands. The highest reduction of speed values, with high statistical significance, was found for raised pedestrian crossings. This is evidenced by a high positive value of the relative rate of speed’s change (ZV). The different values of the coefficient of variation (WZV) indicate a change in driving style in the neighborhood of a raised crossing, while similar low values for the speed tables indicate a homogeneous driving style and slight speed variation between both cross sections. Similarly, higher WZV values indicate the presence of speed modifying factors. Positive values of the skewness (A) and kurtosis (K) are associated with the tendency to drive at below mean speed and with lower speed dispersion.
The analyses above make it possible to classify the tested traffic calming devices into one of three categories: high, medium, and low (or no) effectiveness. The classification is based on the range of speed’s reduction of quantile 85 (ΔV85). For high-effective devices, ΔV85 ≥ 20 km/h, for medium-effective devices, 20 ≥ ΔV85 ≥ 5 km/h, and for low-effective devices, ΔV85 ≤ 5 km/h. Two examples of devices from each group are shown further. The range of obtained measurement results is given. Important technical parameters of each device were described. The presented solutions can be found in various areas. The place markings (HE1, HE2, ME1, ME2, LE1, LE2) correspond to the symbols in Figure 2.
The first example of a high-effective device (HE1, Figure 5) is a raised pedestrian crossing located near the school along a county road in a town adjacent to a large city (surroundings of the agglomeration’s core). There is a speed limit for the entire area of the town of 40 km/h, and 30 km/h in the vicinity of the pedestrian crossing. The parameters that characterize this traffic-calming device are:
  • Lrc = 6 m—length of the raised part of the road,
  • Rrc = 1 m—length of ramp (between raised and non-raised part of road),
  • Hrc = 0.15 m—height of raising,
  • Wrc = 6 m—width of pedestrian crossing,
  • W = 6.5 m—width of road.
Figure 6 shows the speed distribution function for place HE1. For the so-shaped traffic-calming device, the speed reduction was obtained, determined for the quantile V85 in the cross section P0 in relation to the cross section P1, ΔV85 = 25 km/h. The cross section P0 has the value of speed very close to the permissible marking (31 vs. 30 km/h), while the cross section P1 has the value of speed much higher than the applicable in the area of the town (56 vs. 40 km/h).
The second high-effective device (HE2, Figure 7) is a combination of refugee island and speed table located along a county road in a small town (approx. 15,000 inhabitants) near the sports facility. There is a speed limit for the town area (50 km/h during the day), and 30 km/h in the vicinity of the pedestrian crossing. The parameters that characterize this traffic-calming device are:
  • Lh = 3.7 m—length of table,
  • Dh = 6 m—distance between table and pedestrian crossing,
  • Hh = 0.08 m—height of table,
  • Wh = 2 m—width of table,
  • Wl = 3.5 m—width of lane,
  • La = 2.5 m—length of refugee island,
  • Wa = 2.5 m—width of refugee island.
Figure 8 shows the speed distribution function for place HE2. In the case of this traffic-calming device, the speed reduction determined for the quantile V85 in the cross section P0 in relation to the cross section P1, ΔV85 = 21 km/h was obtained. In cross section P0, the value of speed is slightly higher than the limit (35 vs. 30 km/h), while in cross section P1, the speed value is higher than the applicable (56 vs. 50 km/h), with a dangerous value in the event of an accident.
An example of a site with medium efficiency (ME1, Figure 9) is a raised pedestrian crossing located near the school along a county road in a town adjacent to a large city (surroundings of the agglomeration’s core). There is a speed limit for the entire area of the town of 40 km/h and 30 km/h in the vicinity of a raised pedestrian crossing. The parameters that characterize this traffic-calming device are:
  • Lrc = 7 m—length of the raised part of the road,
  • Rrc = 1.8 m—length of ramp (between pedestrian crossing and non-raised road),
  • Hrc = 0.09 m—height of raising,
  • Wrc = 6.5 m—width of crossing,
  • W = 7 m—width of road.
Figure 10 shows the speed distribution function for place ME1. For such a shaped traffic-calming device, the speed reduction determined for the quantile V85 in the cross section P0 in relation to the cross section P1, ΔV85 = 15 km/h. It was found that the value of speed in the cross section P0 exceeds the permissible with the marking by 12 km/h, and the value of speed in the cross section P1 is close to those diagnosed in the place HE1.
The second example of a medium-effective device (ME2, Figure 11) is a series of speed tables located along a municipal road in a large city (approx. 700,000 inhabitants) near the school, at a 30 km/h speed zone. The parameters that characterize these traffic-calming devices are:
  • Lh = 3.7 m—length of table,
  • Dh = 25 m—distance between table and pedestrian crossing,
  • Hh = 0.07 m—height of table,
  • Wh = 5.5 m—width of table,
  • W = 6 m—width of road,
  • D = 100 m—distance between tables.
Figure 12 shows the speed distribution function for place ME2. In the case of the series of speed tables preceding the pedestrian crossing, the speed reduction determined for the quantile V85 in the cross section P0 in relation to the cross section P1, ΔV85 = 10 km/h. It was found, that the value of speed in the cross section P0 and in the cross section P1 is close to these determined by the markings.
An example of a low-effective device (LE1, Figure 13) is refugee island located along the municipal road separating the housing estate from allotments in a large city (approx. 700,000 inhabitants). The traffic calming device is located adjacent to the bus stop. There is a road-signs speed limit of 40 km/h. The parameters that characterize this traffic-calming device are:
  • La = 2 m—length of refugee island,
  • Ha = 0.1 m—width of asylum in refugee island,
  • S = 1/10—slope of narrowing,
  • Wa = 2 m—width of refugee island,
  • Wl = 3 m—width of lane,
  • W = 8 m—width of road.
Figure 14 shows the speed distribution function for place LE1. In the case of refugee island, the speed reduction determined for the quantile V85 in the cross section P0 in relation to the cross section P1, ΔV85 = 1 km/h was obtained, which is within the measurement’s error limit. It was found that the speeds in both cross sections exceed the value specified with the road signs.
The second example of a low-effective device (LE2, Figure 15) is also refugee island located along the former national road, which is the main transport axis in a small town (approx. 15,000 inhabitants). There is a speed limit of 40 km/h. The pedestrian crossing has additional markings above the road to increase its visibility. The parameters that characterize this traffic-calming device are:
  • La = 2 m—length of refugee island,
  • Ha = 0.1 m—width of asylum in refugee island,
  • Da = 3 m—distance between the beginning of the mid-block and pedestrian crossing,
  • S = 1/3—slope of narrowing,
  • Wa = 2 m—width of refugee island,
  • Wl = 3 m—width of lane,
  • W = 9 m—width of road.
Figure 16 shows the speed distribution function for place LE2. In the second case of the refugee island, the speed reduction determined for the quantile V85 in the cross section P0 in relation to the cross section P1, ΔV85 = 1 km/h was obtained, which is within the measurement error limit. It was found that both speeds’ values in both cross sections exceed the limits specified by the road signs.
Conducting research on a selected, relatively homogeneous sample, including three types of devices in 105 precisely selected locations, allowed for the observation and description of general relationships and the introduction of the classification of road safety devices according to their geometrical parameters. The conducted research shows a large variety of geometric and location parameters of the traffic-calming devices used, and thus their effectiveness. Thanks to the adopted research methodology, traffic calming devices were ranked according to their effectiveness in reducing speed. High, medium, and low-effective measures have been identified. The use of low-effective devices is justified solely for purposes other than speed reduction.

5. Discussion

The research was conducted in order to obtain a homogeneous sample. For this reason, the measurement conditions were standardized in terms of time, weather conditions, and generic structure, which allowed to eliminate the influence of distracting factors on the measurement results. Measurements were carried out during off-peak hours in conditions similar to non-congested traffic. The measurement of geometrical parameters of devices, including height, width, distance, slope, etc., was carried out before starting the traffic measurements.
The research on speed in the vicinity of pedestrian crossings without a traffic light was conducted with specific limitations. The topic covered only road traffic engineering issues without considering the impact on the vehicle and the behavior of pedestrians. The research was conducted in the daytime at pedestrian crossings located outside intersections, on sections of roads prohibited from heavy goods vehicles. The research was carried out in areas with different spatial development features, different cross-sections of the road (with sidewalks, with roadsides). The specific speed parameters, which reflect the driver’s reaction to the road, were adopted as the measure of driving behavior. Other aspects could be considered in the next potential researches.
Analyzing the results of speed measurements in 105 locations, no significant differences in speed were observed in areas with different spatial characteristics. Therefore, the classification of devices in each of the areas is the same, which indicates that it is not the spatial features, but the parameters of the device that have a key impact on the behavior of drivers. The conducted research indicates a large variety of geometric and location parameters of the traffic-calming devices used, and thus their effectiveness in reducing speed. Thanks to the adopted research methodology, traffic calming measures were ranked according to their effectiveness in reducing speed. Highly effective and medium-performing ones have been identified.

6. Conclusions and Comments

Based on the results of the measurements conducted in all 105 places, the six key conclusions were drawn.
  • There is a wide difference in the impact of the tested devices on speed, and so alters the effectiveness and legitimacy of their use in order to improve pedestrian safety.
  • The greatest reduction of speed in the cross-section P0 is caused by raised pedestrian crossing, as evidenced by positive values of the relative rate of the change of speed ZV.
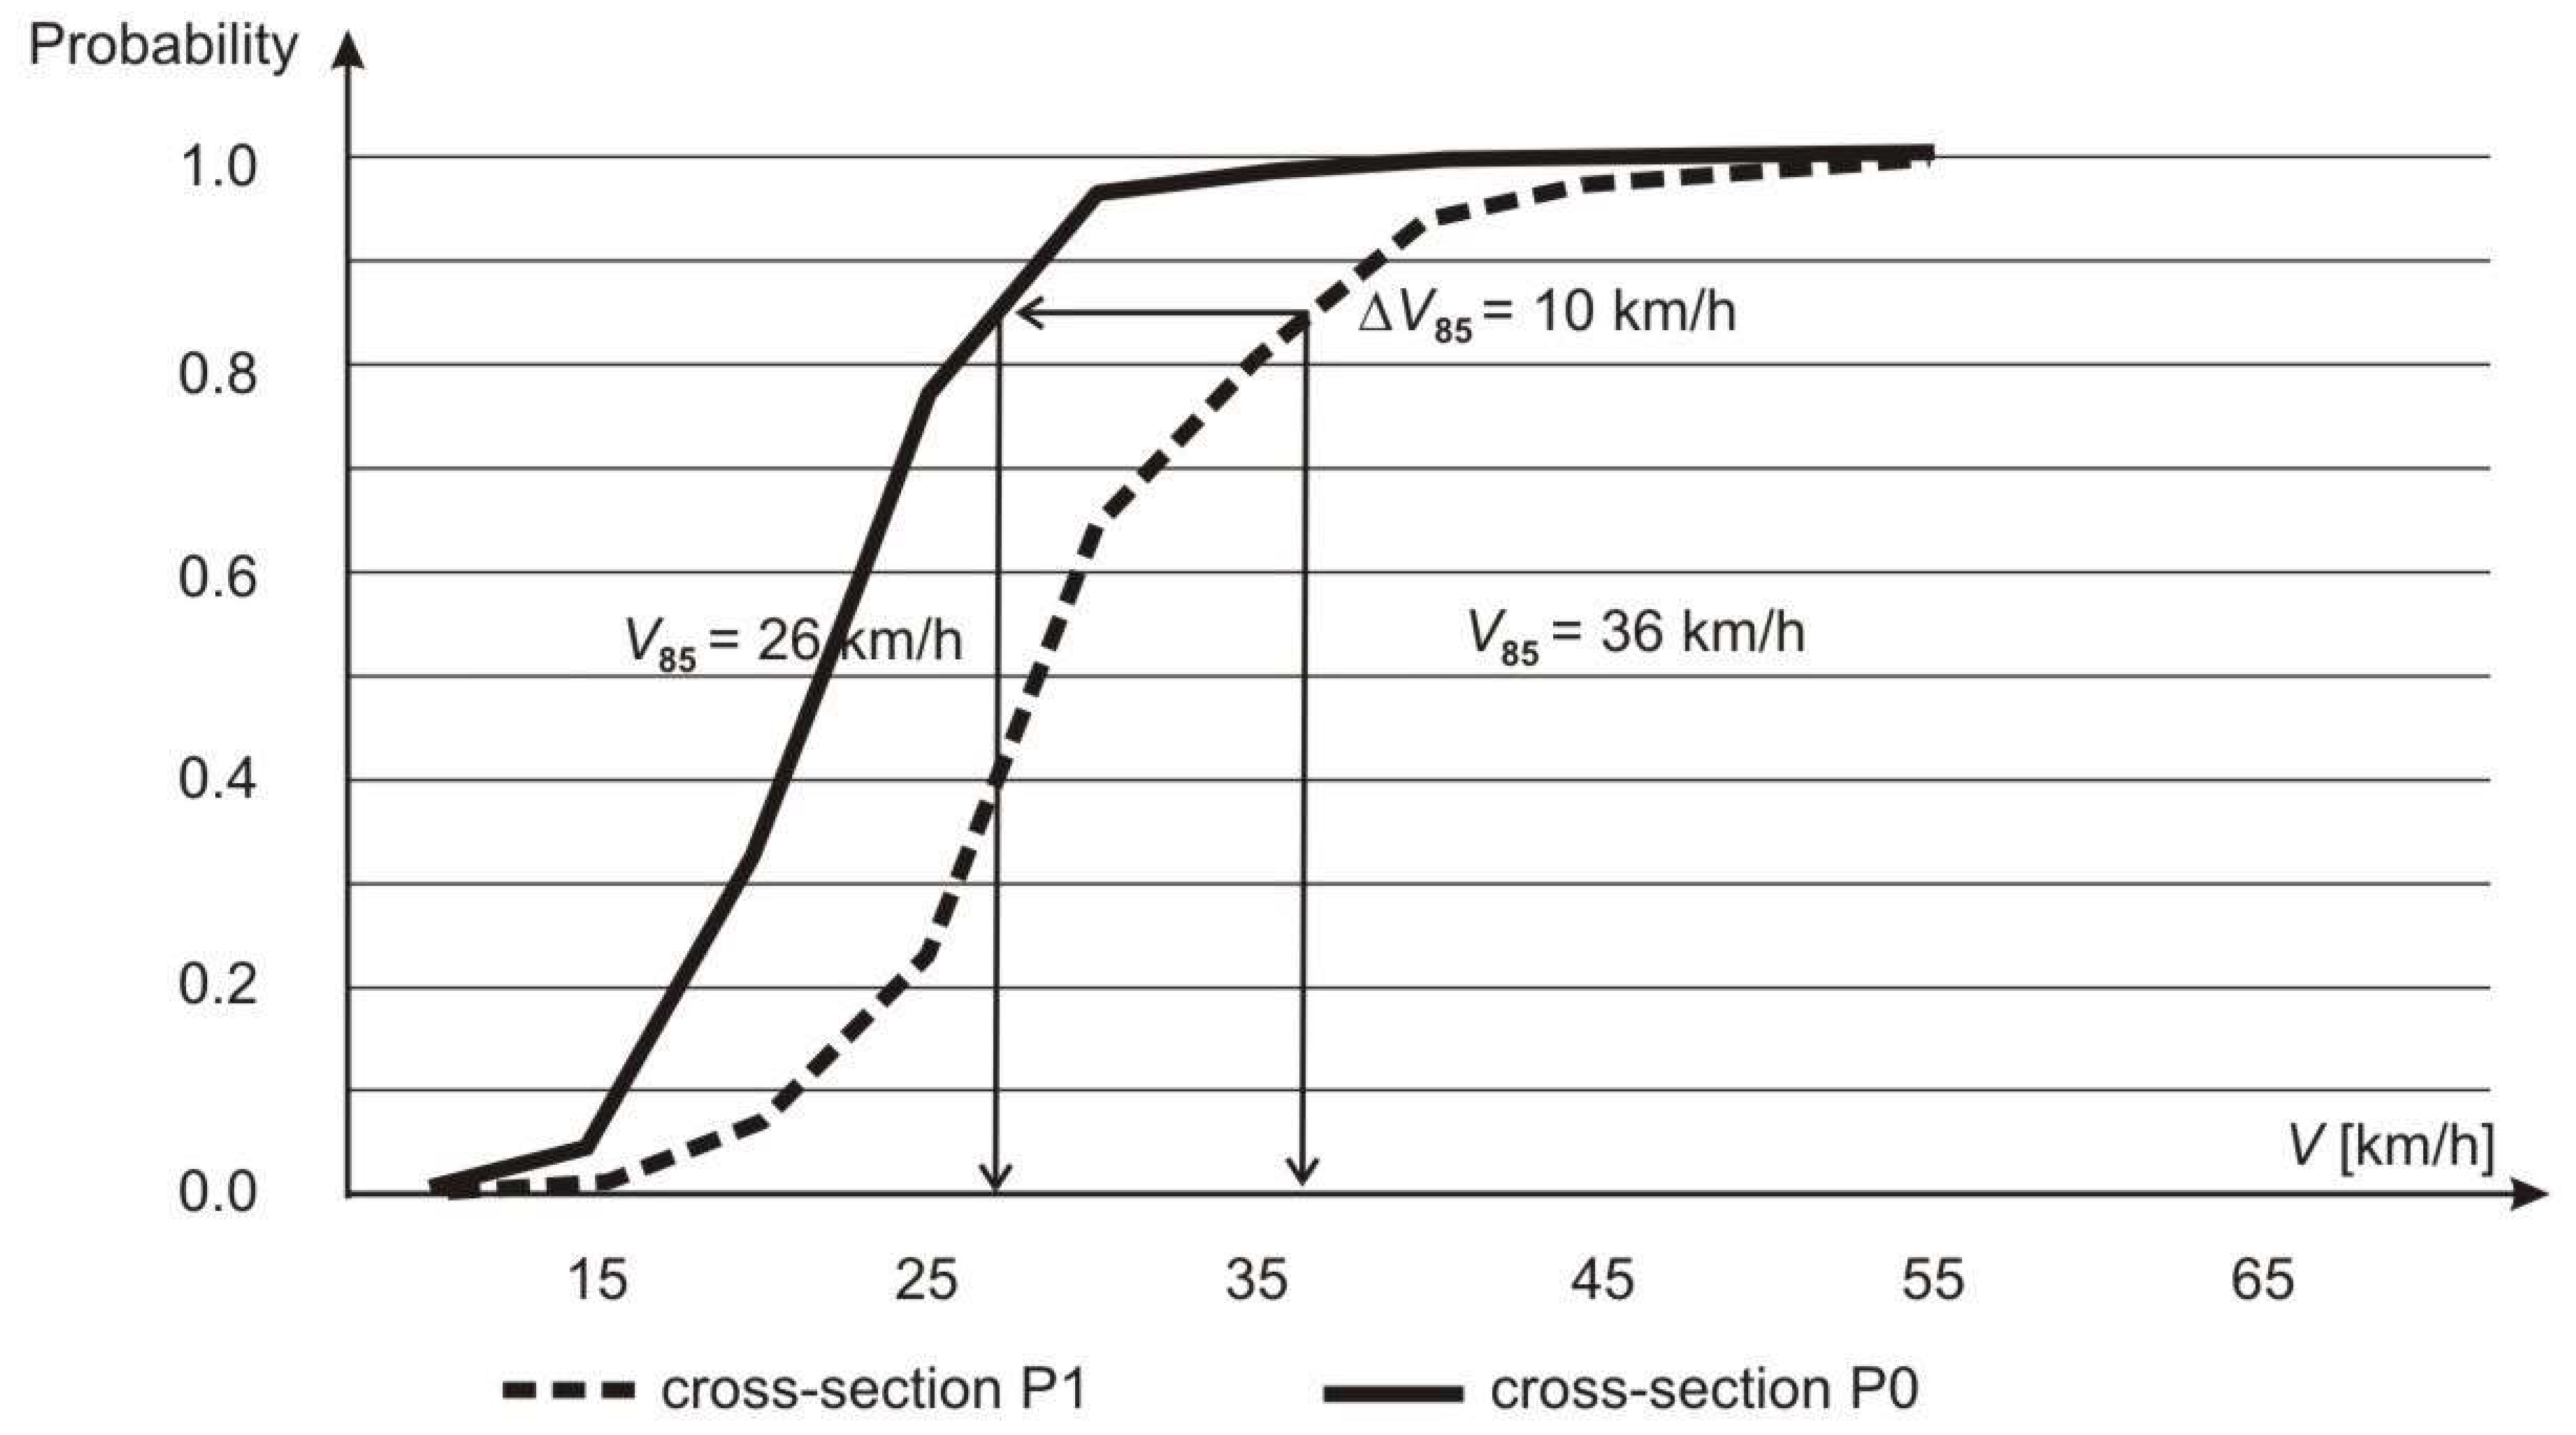
  • The speed reduction effect along the longer segment of the road (from cross section P1 to cross section P0) is observed when the road is equipped with speed tables.
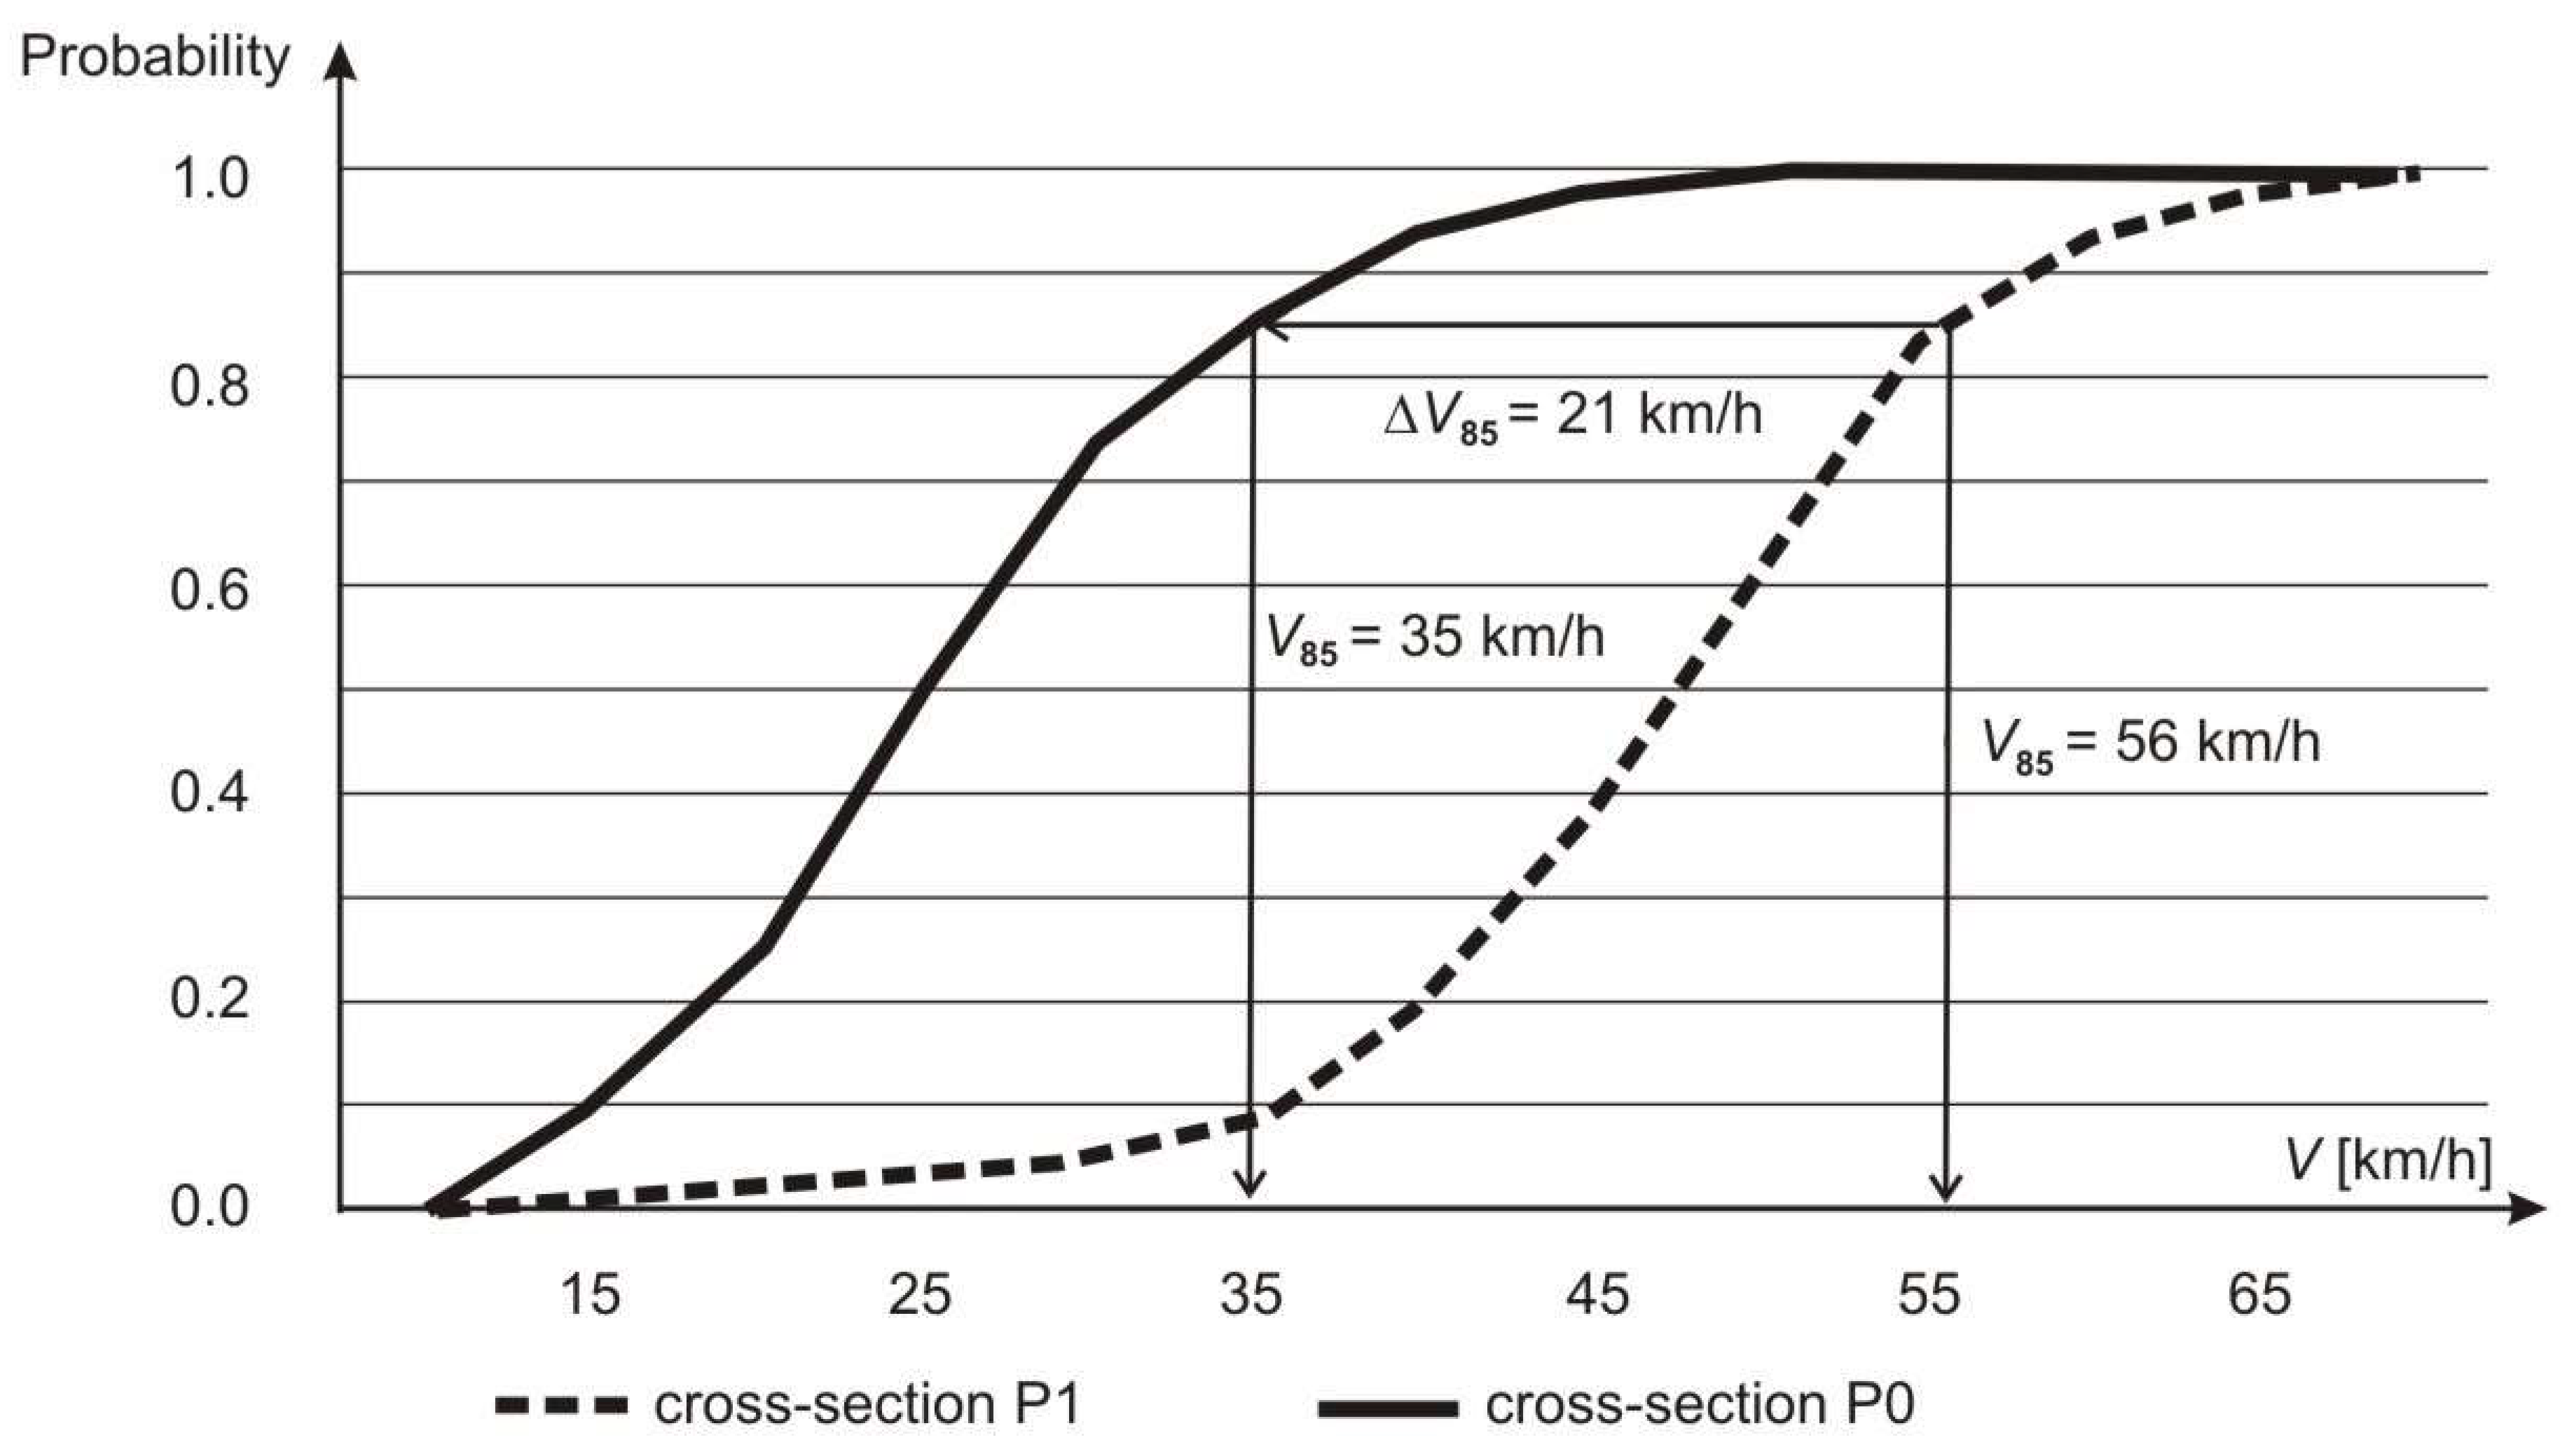
  • The presence of the refugee island themselves does not significantly reduce the speed of vehicles, the speed value at pedestrian crossings with the island exceeds the (safe) speed limit.
  • Similar values of the coefficient of variation WZv in cross section P0 in relation to cross section P1 obtained for speed tables and refugee islands indicate a smaller (than for raised pedestrian crossings) impact of these devices on the change of driving style (including speed) near pedestrian crossings.
  • The majority of drivers reach the value of speed only slightly higher than the safe value (30 km/h) in places equipped with raised pedestrian crossings and speed tables.
The detailed results quoted for selected places show a large difference in the effectiveness of traffic-calming devices depending on their type, location, and geometric parameters. The highest efficiency of raised pedestrian crossings is emphasized even more clearly, both in terms of the speed reduction and its reduction to the values safe for pedestrians in the event of an accident. The effectiveness of devices used in a series and with specific values of geometric parameters (raised parts should be long, but not too long) was also demonstrated.
The above conclusions can be compared with those presented so far in the literature. First of all, the conducted research confirms the high efficiency of raised pedestrian crossings compared to other devices. As in Alavi [63], a speed reduction of 40–45% was achieved with similar geometric parameters. The comparison of the results for the places: HE1 and HE2 confirm the previous observations about the influence of the height of the device on the range of speed’s reduction [65,67].
The influence of the density of the devices in a series (and the distance between the device and the pedestrian crossing) was also confirmed. Optimal distances presented in Basil et al. [50], and the observations of Domenichini et al. [55] and Jorgensen et al. [72] were confirmed by comparing the results obtained in the places: HE2 and ME2 (reduction of speed’s values at the level of 40% vs. 25%).
Low effectiveness of the refugee island noted, among others, in [48,55] confirm the results obtained at the places: LH1 and LH2 (almost imperceptible reductions of speed’s value). It is also one of the most important conclusions of the research carried out for practical applications: refugee islands are not a safe solution for pedestrians due to the lack of influence on the reduction of vehicle’s speed and thus maintaining the risk to pedestrians caused by excessive vehicle speed. The similarity of the observations made for research carried out in different countries allows us to generalize the conclusions and postulate their use in a wider range.

Author Contributions

Conceptualization, M.K. and M.M.-P.; methodology, M.K. and M.M.-P.; software, M.K. and M.M.-P.; validation, M.K. and M.M.-P.; formal analysis, M.K. and M.M.-P.; investigation, M.K. and M.M.-P.; resources, M.M.-P.; data curation, M.M.-P.; writing—original draft preparation, M.K. and M.M.-P.; writing—review and editing, M.K.; visualization, M.K.; supervision, M.K.; project administration, M.M.-P. Both authors have read and agreed to the published version of the manuscript.

Funding

This research received no external funding.

Informed Consent Statement

Not applicable.

Data Availability Statement

Not applicable.

Conflicts of Interest

The authors declare no conflict of interest.

References

  1. McKinley, T.; Williams, T.M.; Jones, J. The epidemiology of pedestrian fatalities and substance use in Georgia, United States, 2007–2016. Accid. Anal. Prev. 2020, 134, 105329. [Google Scholar]
  2. Gaca, S.; Kieć, M. Assessment of pedestrian risk at crossings using kinematic- probabilistic model. Transp. Res. Board 2015, 2514, 129–137. [Google Scholar] [CrossRef]
  3. Guéguen, N.; Meineri, S.; Eyssartier, C. A pedestrian’s stare and drivers’ stopping behavior: A field experiment at the pedestrian crossing. Saf. Sci. 2015, 75, 87–89. [Google Scholar] [CrossRef]
  4. Balasubramanian, V.; Bhardwaj, R. Pedestrians’ perception and response towards vehicles during road-crossing at nighttime. Accid. Anal. Prev. 2018, 110, 128–135. [Google Scholar] [CrossRef] [PubMed]
  5. Li, Y.; Fan, W. Modelling severity of pedestrian-injury in pedestrian-vehicle crashes with latent class clustering and partial proportional odds model: A case study of North Carolina. Accid. Anal. Prev. 2019, 131, 284–296. [Google Scholar] [CrossRef]
  6. Debnath, M.; Hasanat-E-Rabbi, S.; Hamim, O.F.; Hoque, M.d.S.; McIlroy, R.C.; Plant, K.L.; Stanton, N.A. An investigation of urban pedestrian behaviour in Bangladesh using the Perceptual Cycle Model. Saf. Sci. 2021, 138, 105214. [Google Scholar] [CrossRef]
  7. Sun, M.; Sun, X.; Shan, D. Pedestrian crash analysis with latent class clustering method. Accid. Anal. Prev. 2019, 124, 50–57. [Google Scholar] [CrossRef]
  8. Lee, J.; Abdel-Aty, M.; Xu, P.; Gong, Y. Is the safety-in-numbers effect still observed in areas with low pedestrian activities? A case study of a suburban area in the United States. Accid. Anal. Prev. 2019, 125, 116–123. [Google Scholar] [CrossRef] [PubMed]
  9. Sze, N.N.; Su, J.; Bai, L. Exposure to pedestrian crash based on household survey data: Effect of trip purpose. Accid. Anal. Prev. 2019, 128, 17–24. [Google Scholar] [CrossRef]
  10. Kummeneje, A.M.; Rundmo, T. Risk perception, worry, and pedestrian behaviour in the Norwegian population. Accid. Anal. Prev. 2019, 133, 105294. [Google Scholar] [CrossRef]
  11. Babi’c, D.; Babi’c, D.; Fioli´c, M.; Ferko, M. Factors affecting pedestrian conspicuity at night: Analysis based on driver eye tracking. Saf. Sci. 2021, 139, 105257. [Google Scholar] [CrossRef]
  12. Medury, A.; Grembek, O.; Loukaitou-Sideris, A.; Shafizadeh, K. Investigating the underreporting of pedestrian and bicycle crashes in and around university campuses—a crowdsourcing approach. Accid. Anal. Prev. 2019, 130, 99–107. [Google Scholar] [CrossRef]
  13. Guo, M.; Yuan, Z.; Janson, B.; Peng, Y.; Yang, Y.; Wang, W. Older Pedestrian Traffic Crashes Severity Analysis Based on an Emerging Machine Learning XGBoost. Sustainability 2021, 13, 926. [Google Scholar] [CrossRef]
  14. Haule, H.J.; Sando, T.; Kitali, A.E.; Richardson, R. Investigating proximity of crash locations to aging pedestrian residences. Accid. Anal. Prev. 2019, 122, 215–225. [Google Scholar] [CrossRef]
  15. Tapiro, H.; Oron-Gilad, T.; Parmet, Y. The effect of environmental distractions on child pedestrian’s crossing behavior. Saf. Sci. 2018, 106, 219–229. [Google Scholar] [CrossRef]
  16. Gitelman, V.; Levi, S.; Carmel, R.; Korchatov, A.; Hakkert, S. Exploring patterns of child pedestrian behaviors at urban intersections. Accid. Anal. Prev. 2019, 122, 36–47. [Google Scholar] [CrossRef] [PubMed]
  17. Ābele, L.; Haustein, S.; Møller, M. Young drivers’ perception of adult and child pedestrians in potential street-crossing situations. Accid. Anal. Prev. 2018, 118, 263–268. [Google Scholar] [CrossRef] [Green Version]
  18. Lehsing, C.h.; Ruch, F.; Kölsch, F.M.; Dyszak, G.N.; Bowers, A.R. Effects of simulated mild vision loss on gaze, driving and interaction behaviors in pedestrian crossing situations. Accid. Anal. Prev. 2019, 125, 138–151. [Google Scholar] [CrossRef] [PubMed]
  19. Pešic, D.; Antic, B.; Glavic, D.; Milenkovic, M. The effects of mobile phone use on pedestrian crossing behaviour at unsignalized intersections–Models for predicting unsafe pedestrians behavior. Saf. Sci. 2016, 82, 1–8. [Google Scholar] [CrossRef]
  20. Pugliese, B.J.; Barton, B.K.; Davis, S.J.; Lopez, G. Assessing pedestrian safety across modalities via a simulated vehicle time-to-arrival task. Accid. Anal. Prev. 2020, 134, 105344. [Google Scholar] [CrossRef]
  21. Wu, J.; Xu, H.; Zheng, Y.; Tian, Z. A novel method of vehicle-pedestrian near-crash identification with roadside LiDAR data. Accid. Anal. Prev. 2018, 121, 238–249. [Google Scholar] [CrossRef]
  22. Mukherjee, D.; Mitra, S. A comparative study of safe and unsafe signalized intersections from the view point of pedestrian behavior and perception. Accid. Anal. Prev. 2019, 132, 105218. [Google Scholar] [CrossRef]
  23. Kruszyna, M.; Rychlewski, J. Influence of approaching tram on behaviour of pedestrians in signalised crosswalks in Poland. Accid. Anal. Prev. 2013, 55, 185–191. [Google Scholar] [CrossRef]
  24. Li, H.; Wu, D.; Graham, D.J.; Sze, N.N. Comparison of exposure in pedestrian crash analyses: A study based on zonal origin-destination survey data. Saf. Sci. 2020, 131, 104926. [Google Scholar] [CrossRef]
  25. Gupta, A. Study on Speed Profiles Across Speed Bumbs, Department of Civil Engineering, National Institute of Technology Rourkela. 2014. Available online: http://ethesis.nitrkl.ac.in/5881/1/e-74.pdf (accessed on 30 November 2015).
  26. Ding, C.; Chen, P.; Jiao, J. Non-linear effects of the built environment on automobile-involved pedestrian crash frequency: A machine learning approach. Accid. Anal. Prev. 2018, 112, 116–126. [Google Scholar] [CrossRef]
  27. Avinash, C.h.; Jiten, S.; Arkatkar, S.; Gaurang, J.; Manoranjan, P. Investigating effect of surrounding factors on human behaviour at uncontrolled mid-block crosswalks in Indian cities. Saf. Sci. 2019, 119, 174–187. [Google Scholar] [CrossRef]
  28. Kraidi, R.; Evdorides, H. Pedestrian safety models for urban environments with high roadside activities. Saf. Sci. 2020, 130, 104847. [Google Scholar] [CrossRef]
  29. Lee, J.; Abdel-Aty, M.; Shah, I. Evaluation of surrogate measures for pedestrian trips at intersections and crash modeling. Accid. Anal. Prev. 2019, 130, 91–98. [Google Scholar] [CrossRef]
  30. Solmazer, G.; Azık, D.; Fındık, G.; Üzümcüoğlu, Y.; Xheladini, G. Cross-cultural differences in pedestrian behaviors in relation to values: A comparison of five countries. Accid. Anal. Prev. 2020, 138, 105459. [Google Scholar] [CrossRef]
  31. McIlroy, R.C.; Kokwaro, G.O.; Wu, J.; Jikyong, U.; Stanton, N.A. How do fatalistic beliefs affect the attitudes and pedestrian behaviours of road users in different countries? A cross-cultural study. Accid. Anal. Prev. 2020, 139, 105491. [Google Scholar] [CrossRef] [PubMed]
  32. Zhang, Y.; Qiao, Y.; Fricker, J.D. Investigating pedestrian waiting time at semi-controlled crossing locations: Application of multi-state models for recurrent events analysis. Accid. Anal. Prev. 2020, 137, 105437. [Google Scholar] [CrossRef]
  33. Ahangar, A.N.; Arghand, E.; Ahangar, H.B.; Ganji, S.R.S. Recognizing the reasons of the accidents based on the rural drivers’ mental patterns using Q analytical method. Saf. Sci. 2020, 125, 104649. [Google Scholar] [CrossRef]
  34. Herrero-Fernández, D.; Parada-Fernández, P.; Oliva-Macías, M.; Jorge, R. The influence of emotional state on risk perception in pedestrians: A psychophysiological approach. Saf. Sci. 2020, 130, 104857. [Google Scholar] [CrossRef]
  35. Rasch, A.; Panero, G.; Boda, C.-N.; Dozza, M. How do drivers overtake pedestrians? Evidence from field test and naturalistic driving data. Accid. Anal. Prev. 2020, 139, 105494. [Google Scholar] [CrossRef]
  36. Nishimoto, T.; Kubota, K.; Ponte, G. A pedestrian serious injury risk prediction method based on posted speed limit. Accid. Anal. Prev. 2019, 129, 84–93. [Google Scholar] [CrossRef]
  37. Huang, Z.; He, Y.; Wen, Y.; Song, X. Injured probability assessment in frontal pedestrian-vehicle collision counting uncertainties in pedestrian movement. Saf. Sci. 2018, 106, 162–169. [Google Scholar] [CrossRef]
  38. Kathuria, A.; Vedagiri, P. Evaluating pedestrian vehicle interaction dynamics at un-signalized intersections: A proactive approach for safety analysis. Accid. Anal. Prev. 2020, 134, 105316. [Google Scholar] [CrossRef] [PubMed]
  39. Soilán, M.; Riveiro, B.; Sánchez-Rodríguez, A.; Arias, P. Safety assessment on pedestrian crossing environments using MLS data. Accid. Anal. Prev. 2018, 111, 328–337. [Google Scholar] [CrossRef]
  40. Larue, G.S.; Naweed, A.; Rodwell, D. The road user, the pedestrian, and me: Investigating the interactions, errors and escalating risks of users of fully protected level crossings. Saf. Sci. 2018, 110, 80–88. [Google Scholar] [CrossRef]
  41. Fu, T.; Miranda-Moreno, L.; Saunier, N. A novel framework to evaluate pedestrian safety at non-signalized locations. Accid. Anal. Prev. 2018, 111, 23–33. [Google Scholar] [CrossRef]
  42. Mansfield, T.J.; Peck, D.; Morgan, D.; McCann, B.; Teicher, P. The effects of roadway and built environment characteristics on pedestrian fatality risk: A national assessment at the neighborhood scale. Accid. Anal. Prev. 2018, 121, 166–176. [Google Scholar] [CrossRef] [PubMed]
  43. Bastien, C.; Wellings, R.; Burnett, B. An evidence based method to calculate pedestrian crossing speeds in vehicle collisions (PCSC). Accid. Anal. Prev. 2018, 118, 66–76. [Google Scholar] [CrossRef]
  44. Rosén, E.; Sander, U. Pedestrian fatality risk as a function of car impact speed. Accid. Anal. Prev. 2009, 41, 536–542. [Google Scholar] [CrossRef]
  45. Rosen, E.; Sander, U.; Stigson, H. Literature review of pedestrian facility risk as a function of car impact speed. Accid. Anal. Prev. 2011, 43, 25–33. [Google Scholar] [CrossRef]
  46. Hussain, Q.; Feng, H.; Grzebieta, R.; Brijs, T.; Olivier, J. The relationship between impact speed and the probability of pedestrian fatality during a vehicle-pedestrian crash: A systematic review and meta-analysis. Accid. Anal. Prev. 2019, 129, 241–249. [Google Scholar] [CrossRef] [PubMed]
  47. Wilmots, B.; Hermans, E.; Brijs, T.; Wets, G. Speed control with and without advanced warning sign on the field: An analysis of the effect on driving speed. Saf. Sci. 2016, 85, 23–32. [Google Scholar] [CrossRef]
  48. Kang, B. Identifying street design elements associated with vehicle-to-pedestrian collision reduction at intersections in New York City. Accid. Anal. Prev. 2019, 122, 308–317. [Google Scholar] [CrossRef]
  49. Sundo, M.B.; Diaz, C.E.D. Effect of hump spacing on speed selection of isolated vehicles: The case of exclusive villages in metro manila. In Proceedings of the Eastern Asia Society for Transportation Studies, Hanoi City, Vietnam, 24–27 October 2001; Volume 3. [Google Scholar]
  50. Basil, D.D.; Nicholson, A.; Koorey, G. Investigating Speed Patterns and Estimating Speed on Traffic-Calmed Streets, IPENZ Transportation Group Conference Auckland. 2011. Available online: http://www.nzta.govt.nz/assets/resources/research/reports/521/docs/rr521.pdf (accessed on 30 November 2015).
  51. Barbosa, H.M.; Tight, M.R.; May, A.D. A model of speed profiles for traffic calmed roads. Transp. Res. Part. A. 2000, 34, 103–123. [Google Scholar] [CrossRef]
  52. Falamarzi, A.; Rahmat, O.K. Using Appropriate Speed Tables Regarding to the Speed Limit of Streets Research Journal of Applied Sciences. Eng. Technol. 2014, 7, 2741–2746. [Google Scholar]
  53. Bian, Y.; Liang, K.; Zhao, X.; Li, H.; Yang, L. Evaluating the effectiveness of new-designed crosswalk markings at intersections in China considering vehicle-pedestrian interaction. Accid. Anal. Prev. 2020, 139, 105498. [Google Scholar] [CrossRef]
  54. Ma, Y.; Gu, X.; Yu, Y.; Khattakc, A.J.; Chen, S.; Tang, K. Identification of Contributing Factors for Driver’s Perceptual Bias of Aggressive Driving in China. Sustainability 2021, 13, 766. [Google Scholar] [CrossRef]
  55. Domenichini, L.; Branzi, V.; Meocci, M. Virtual testing of speed reduction schemes on urban collector roads. Accid. Anal. Prev. 2018, 110, 38–51. [Google Scholar] [CrossRef]
  56. Domenichini, L.; Branzi, V.; Smorti, M. Influence of drivers’ psychological risk profiles on the effectiveness of traffic calming measures. Accid. Anal. Prev. 2019, 123, 243–255. [Google Scholar] [CrossRef] [PubMed]
  57. Lav, A.H.; Bilgin, E.; ALav, H. A fundamental experimental approach for optimal design of speed bumps. Accid. Anal. Prev. 2018, 116, 53–68. [Google Scholar] [CrossRef]
  58. Gupta, S.; Vasardani, M.; Lohani, B.; Winter, S. Pedestrian’s risk-based negotiation model for self-driving vehicles to get the right of way. Accid. Anal. Prev. 2019, 124, 163–173. [Google Scholar] [CrossRef] [PubMed]
  59. Avinash, C.; Jiten, S.; Arkatkar, S.; Gaurang, J.; Manoranjan, P. Evaluation of pedestrian safety margin at mid-block crosswalks in India. Saf. Sci. 2019, 119, 188–198. [Google Scholar] [CrossRef]
  60. Zeeger, C. Pedestrian Facilities User Guide-Providing Safety and Mobility; UNC Highway Safety Reasearch Center: Chapel Hill, NC, USA, 2000. [Google Scholar]
  61. Bąk, R.; Kieć, M. Influence of various types of mid- block pedestrian crossings on urban street capacity, Transportation Research Record. J. Transp. Res. Board 2012, 2316, 76–83. [Google Scholar] [CrossRef]
  62. Zhang, C.; Chen, F.; Wei, Y. Evaluation of pedestrian crossing behavior and safety at uncontrolled mid-block crosswalks with different numbers of lanes in China. Accid. Anal. Prev. 2019, 123, 263–273. [Google Scholar] [CrossRef]
  63. Alavi, S.H. Analyzing raised crosswalks dimensions influence on speed reduction in urban streets. In Proceedings of the 3rd Urban Street Symposium, Seattle, WA, USA, 24–27 June 2007; Available online: https://www.researchgate.net/publication/273687736_Pedestrian_RPC_Influence_on_Speed_Reduction (accessed on 1 December 2015).
  64. Aronsson, K.F.M. Speed Characteristics of Urban Streets Based on Driver Behaviour Studies and Simulation. Doctoral Thesis, Infrastructure Royal Institute of Technology, Stockholm, Sweden, 2006. [Google Scholar]
  65. Bjarnason, S. Round Top and Flat Top Humps-The Influence of Design of the Effects Thesis 125; Department of Technology and Society, Lund Insitute of Technology Lund Sweden. 2004. Available online: https://www.tft.lth.se/fileadmin/tft/dok/publ/5000/Thesis125SBscr.pdf (accessed on 3 January 2016).
  66. Huang, H.F.; Cynecki, M.J. The Effects of Traffic Calming Measures on Pedestrian and Motorist Behaviour; FHWA-RD-00-104; Fedaral Highway Administration U.S.: McLean, VA, USA, 2001.
  67. Pratelli, A.; Pratali, R.; Rossi, M. Raised Crosswalks Efficacy on the Lowering of Vehicle Speeds; WIT Transactions on The Built Environment; 116 WIT Press: Southampton, UK, 2011; Available online: www.witpress.com (accessed on 28 November 2015).
  68. Basil, D.D. The Influence of Width of Road Humps on Operating Speed; Talent Management Symposium in Australia. 2012. Available online: http://eprints.uthm.edu.my/2819/ (accessed on 30 November 2015).
  69. Ewing, R. Impacts of traffic calming, Urban Street Symposium. Available online: http://www.urbanstreet.info/1st_symp_proceedings/Ec019_i1.pdf (accessed on 15 January 2016).
  70. Roess, R.P.; Prassas, E.S. McShane, W.R. Traffic Engineering; Pearson: London, UK, 2004. [Google Scholar]
  71. Johnson, L.T.; Nedzesky, A.J.A. Comparative Study of Speed Humps, Speed Slots and SpeedCushions. 2003. Available online: http://nacto.org/docs/usdg/study_speed_humps_speed_slots_and_speed_cushions_johnson.pdf (accessed on 28 November 2015).
  72. Jorgensen, M.; Agerholm, N.; Lahrmann, H.; Araghi, B. Driving Speed on Throughfares in Minor. Towns in Denmark; Aalborg University: Aalborg Ost, Denmark, 2014; Available online: http://www.ictct.org/migrated_2014/ictct_document_nr_1020_Agerholm.pdf (accessed on 19 November 2015).
  73. Zegeer, C.V.; Bushell, M. Pedestrian crash trends and potential countermeasures from around the World. Accid. Anal. Prev. 2012, 44, 3–11. [Google Scholar] [CrossRef]
Figure 1. Basic parameters of considered devices: (a)—refugee island, (b)—speed table, (c)—raised pedestrian crossing.
Sustainability 13 09678 g001
Figure 2. Lower Silesia as a part of Poland and location of selected places of measurements.
Sustainability 13 09678 g002
Figure 3. SR4 device used in measurements.
Sustainability 13 09678 g003
Figure 4. The configuration of measurements place.
Sustainability 13 09678 g004
Figure 5. The first example of a high-effective device (HE1).
Sustainability 13 09678 g005
Figure 6. The speed distribution function for place HE1.
Sustainability 13 09678 g006
Figure 7. The second example of a high-effective device (HE2).
Sustainability 13 09678 g007
Figure 8. The speed distribution function for place HE2.
Sustainability 13 09678 g008
Figure 9. The first example of a medium-effective device (ME1).
Sustainability 13 09678 g009
Figure 10. The speed distribution function for place ME1.
Sustainability 13 09678 g010
Figure 11. The second example of a medium-effective device (ME2).
Sustainability 13 09678 g011
Figure 12. The speed distribution function for place ME2.
Sustainability 13 09678 g012
Figure 13. The first example of a low-effective device (LE1).
Sustainability 13 09678 g013
Figure 14. The speed distribution function for place LE1.
Sustainability 13 09678 g014
Figure 15. The second example of a low-effective device (LE2).
Sustainability 13 09678 g015
Figure 16. The speed distribution function for place LE2.
Sustainability 13 09678 g016
Table 1. Values of the most important speed characteristics and their changes for the tested traffic calming devices.
Cross
Section
Speed Characteristics
V98
[km/h]
ZV98
[–]
V85
[km/h]
ZV85
[–]
V ¯
[km/h]
Z V ¯
[km/h]
σ
[km/h]
WZV
[–]
A
[–]
K
[–]
Refugee islands
P065.20.03456.50.02648.20.0298.40.1740.0390.124
P167.758.350.08.40.1690.1790.020
Speed tables
P044.10.04036.40.06330.40.0636.30.2080.3110.383
P146.439.533.06.60.1990.2060.328
Raised crossings
P041.70.25034.70.22827.70.2866.60.2380.3140.245
P154.747.039.67.30.1850.2140.381
Publisher’s Note: MDPI stays neutral with regard to jurisdictional claims in published maps and institutional affiliations.

