Article

Effect of Intensification Practices, Lambing Period and Environmental Parameters on Animal Health, and Milk Yield and Quality in Dairy Sheep Production Systems on Crete

by
Nikolaos Voutzourakis
1,2,
Alexandros Stefanakis
1,
Sokratis Stergiadis
3,
Leonidas Rempelos
2,
Nikolaos Tzanidakis
1,
Mick Eyre
2,
Gillian Butler
2,
Carlo Leifert
4,5 and
Smaragda Sotiraki
1,*
1
Laboratory of Parasitology, Veterinary Research Institute, Hellenic Agricultural Organization Demeter, Thermi, 57001 Thessaloniki, Greece
2
School of Natural and Environmental Science, Newcastle University, Newcastle upon Tyne NE3 2SF, UK
3
Department of Animal Sciences, School of Agriculture, Policy and Development, University of Reading, Earley Gate, P.O. Box 237, Reading RG6 6AR, UK
4
Centre for Organics Research, Southern Cross University, Lismore, NSW 2480, Australia
5
Department of Nutrition, IMB, University of Oslo, 0372 Oslo, Norway
*
Author to whom correspondence should be addressed.
Sustainability 2021, 13(17), 9706; https://doi.org/10.3390/su13179706
Submission received: 28 June 2021 / Revised: 21 August 2021 / Accepted: 24 August 2021 / Published: 30 August 2021
(This article belongs to the Special Issue Sustainable Livestock Production)

Abstract

:
Due to increasing demand, many traditional, grazing-based Mediterranean sheep production systems have introduced intensified feeding regimes, increased investments in infrastructure and drug use to increase milk yields. However, compared to bovine milk production systems, there is limited knowledge about the impact of these intensification practices on animal welfare and health and on the quality of dairy products. The aim of this study was therefore to quantify the effects of management practices and environmental conditions background on udder health, parasitism and milk quantity and quality in Cretan traditional production systems. Milk yields were higher in semi-intensive production systems while concentrations of several nutritionally desirable compounds such as omega-3 fatty acids were found to be higher in milk from extensive systems. Antibiotic and anthelmintic use was relatively low in both extensive and semi-intensive production systems. There was no substantial difference in parasitic burden, somatic cell counts, and microbiological parameters assessed in milk. Recording of flock health parameters showed that animal health and welfare was high in both extensive and semi-intensively managed flocks, and that overall, the health status of extensively managed ewes was slightly better. In contrast, environmental conditions (temperature and rainfall) had a substantial effect on parasitism and milk quality.

1. Introduction

Small ruminants are reared all over the world, but for Mediterranean countries, the sector is of special importance. More than 50% of the world’s sheep milk and almost 20% of goat milk is produced in the area, with Turkey, Greece and Italy being the leader producers [1]. Traditionally, sheep milk produced in this region has mainly been used for the production of high “sensory quality” artisan and often “Protected Designations of Origin” (PDO) cheeses as for example, Pecorino Romano (Italy) and Feta (Greece) [2]. The distinct sensory and nutritional quality characteristics of these products are the main drivers for demand for these cheese products and are known to be closely linked to the traditional breeds, grazing-based extensive management systems and local environmental conditions, including the botanical composition of the semi-natural pasture and shrub vegetation used for grazing [3]. Demand for sheep milk and cheese products is expected to continue to increase, especially in Northern Europe and North America and due to increasing consumer awareness about their high nutritional value compared to bovine milk [4].
As a result, there has been a trend to intensify traditional sheep production systems in the region, where currently, the most common systems are (i) the traditional, extensive, all year-round grazing system and (ii) the so called semi-intensive system. The semi-intensive system is known to have higher yields and is thought to be more economically viable. Semi-intensive systems are often characterized by (a) increased stocking densities, (b) strong within breed selection for milk yield, (c) use of more productive improved grassland and concentrate feeds, (d) machine rather than hand milking, (e) higher replacement rates, (f) off-season mating, and (g) longer milking periods [5,6]. There is also evidence that semi-intensive sheep production systems rely more on veterinary drug treatments to maintain flock health [7,8], but this has not been confirmed in many Mediterranean regions.
It has been observed that the criteria based on which farmers select and implement management practices rarely include considerations such as economic or environmental sustainability [9].
As an example, lambing and lactation periods in Mediterranean dairy production were traditionally determined by reproduction seasonality and pasture availability. Therefore, lambing mostly occurs in early winter (rainy season) to utilise fresh pasture. However, yearlings (primiparous ewes) are lambing later (in January and February) since they only reach sexual maturity after August. The latter extends the period of milk production into June and July or August, and results in milk yield and quality being more uniform during the peak production period between January and May [10]. Moreover, in the Mediterranean, due to increased daylight duration, the anestrus period is shorter than in the north of Europe and especially in locations such as Crete, local breeds can mate all year around [11]. Currently, farmers tend to abandon traditional practices ignoring the above specificities without considering that by applying new practices they disturb local environment balance [12].
At the same time, as lessons learned by bovine milk production systems [13,14,15] the introduction of semi-intensive production systems may have a negative effect on milk quality and animal health and welfare status. Specifically, there is concern that changes in production protocols may affect (a) sensory or processing quality (e.g., protein and fat content, and cheese yield) [16], (b) microbial safety (e.g., total microbial and enteric pathogen loads), and (c) nutritional quality parameters (e.g., concentrations of nutritionally desirable omega-3 fatty acids) of dairy production [16,17,18]. Furthermore, any change in milk processing or microbial quality will also affect the dairy industry, where the many small scale artisan cheese factories do not have the necessary knowledge or equipment to properly stabilize raw material composition and accordingly adjust their hygiene protocols [19,20,21].
Although veterinary regimens should be based on a specific and regularly updated risk-based assessment [22], many farmers follow empirical protocols ignoring diseases epidemiology and dynamics. This becomes more dangerous when various management interventions, such as changes in stocking densities, housing conditions or milking systems are applied [15]. The above is mainly the case for the silent infections not threatening animals’ health, however, affecting their productivity (production-limiting diseases) such as the gastrointestinal nematodes (GIN) infections and subclinical mastitis [23]. For both of the above, not targeted treatments may lead to veterinary drug (anthelmintics, antibiotics) abuse, and development of drug resistance [7]. It is therefore important to determine to what extent intensification has resulted in an increased incidence of livestock diseases and use of veterinary medicines, information that is currently not available for most Mediterranean countries.
Therefore, management protocols have to consider a great amount of variables as well as their interactions to avoid resulting in low productivity, poor health status, environmental deterioration and profit losses [24,25]. Thus, when drawing recommendations for management system planning, it is important to refer to areas with similar climatic conditions and related breeding practices, an example being the Mediterranean basin, while taking into consideration the within-farm variations due to individual variability and heritability.
Considering these, the objectives of the study reported here were therefore to assess the combined impact of intensification practices (by comparing two different management systems) and environmental background conditions (by comparing contrasting production seasons) on (a) animal health and welfare, (b) veterinary medicine use, and (c) milk yield and quality parameters for ewes that lamb early and late in the year.

2. Materials and Methods

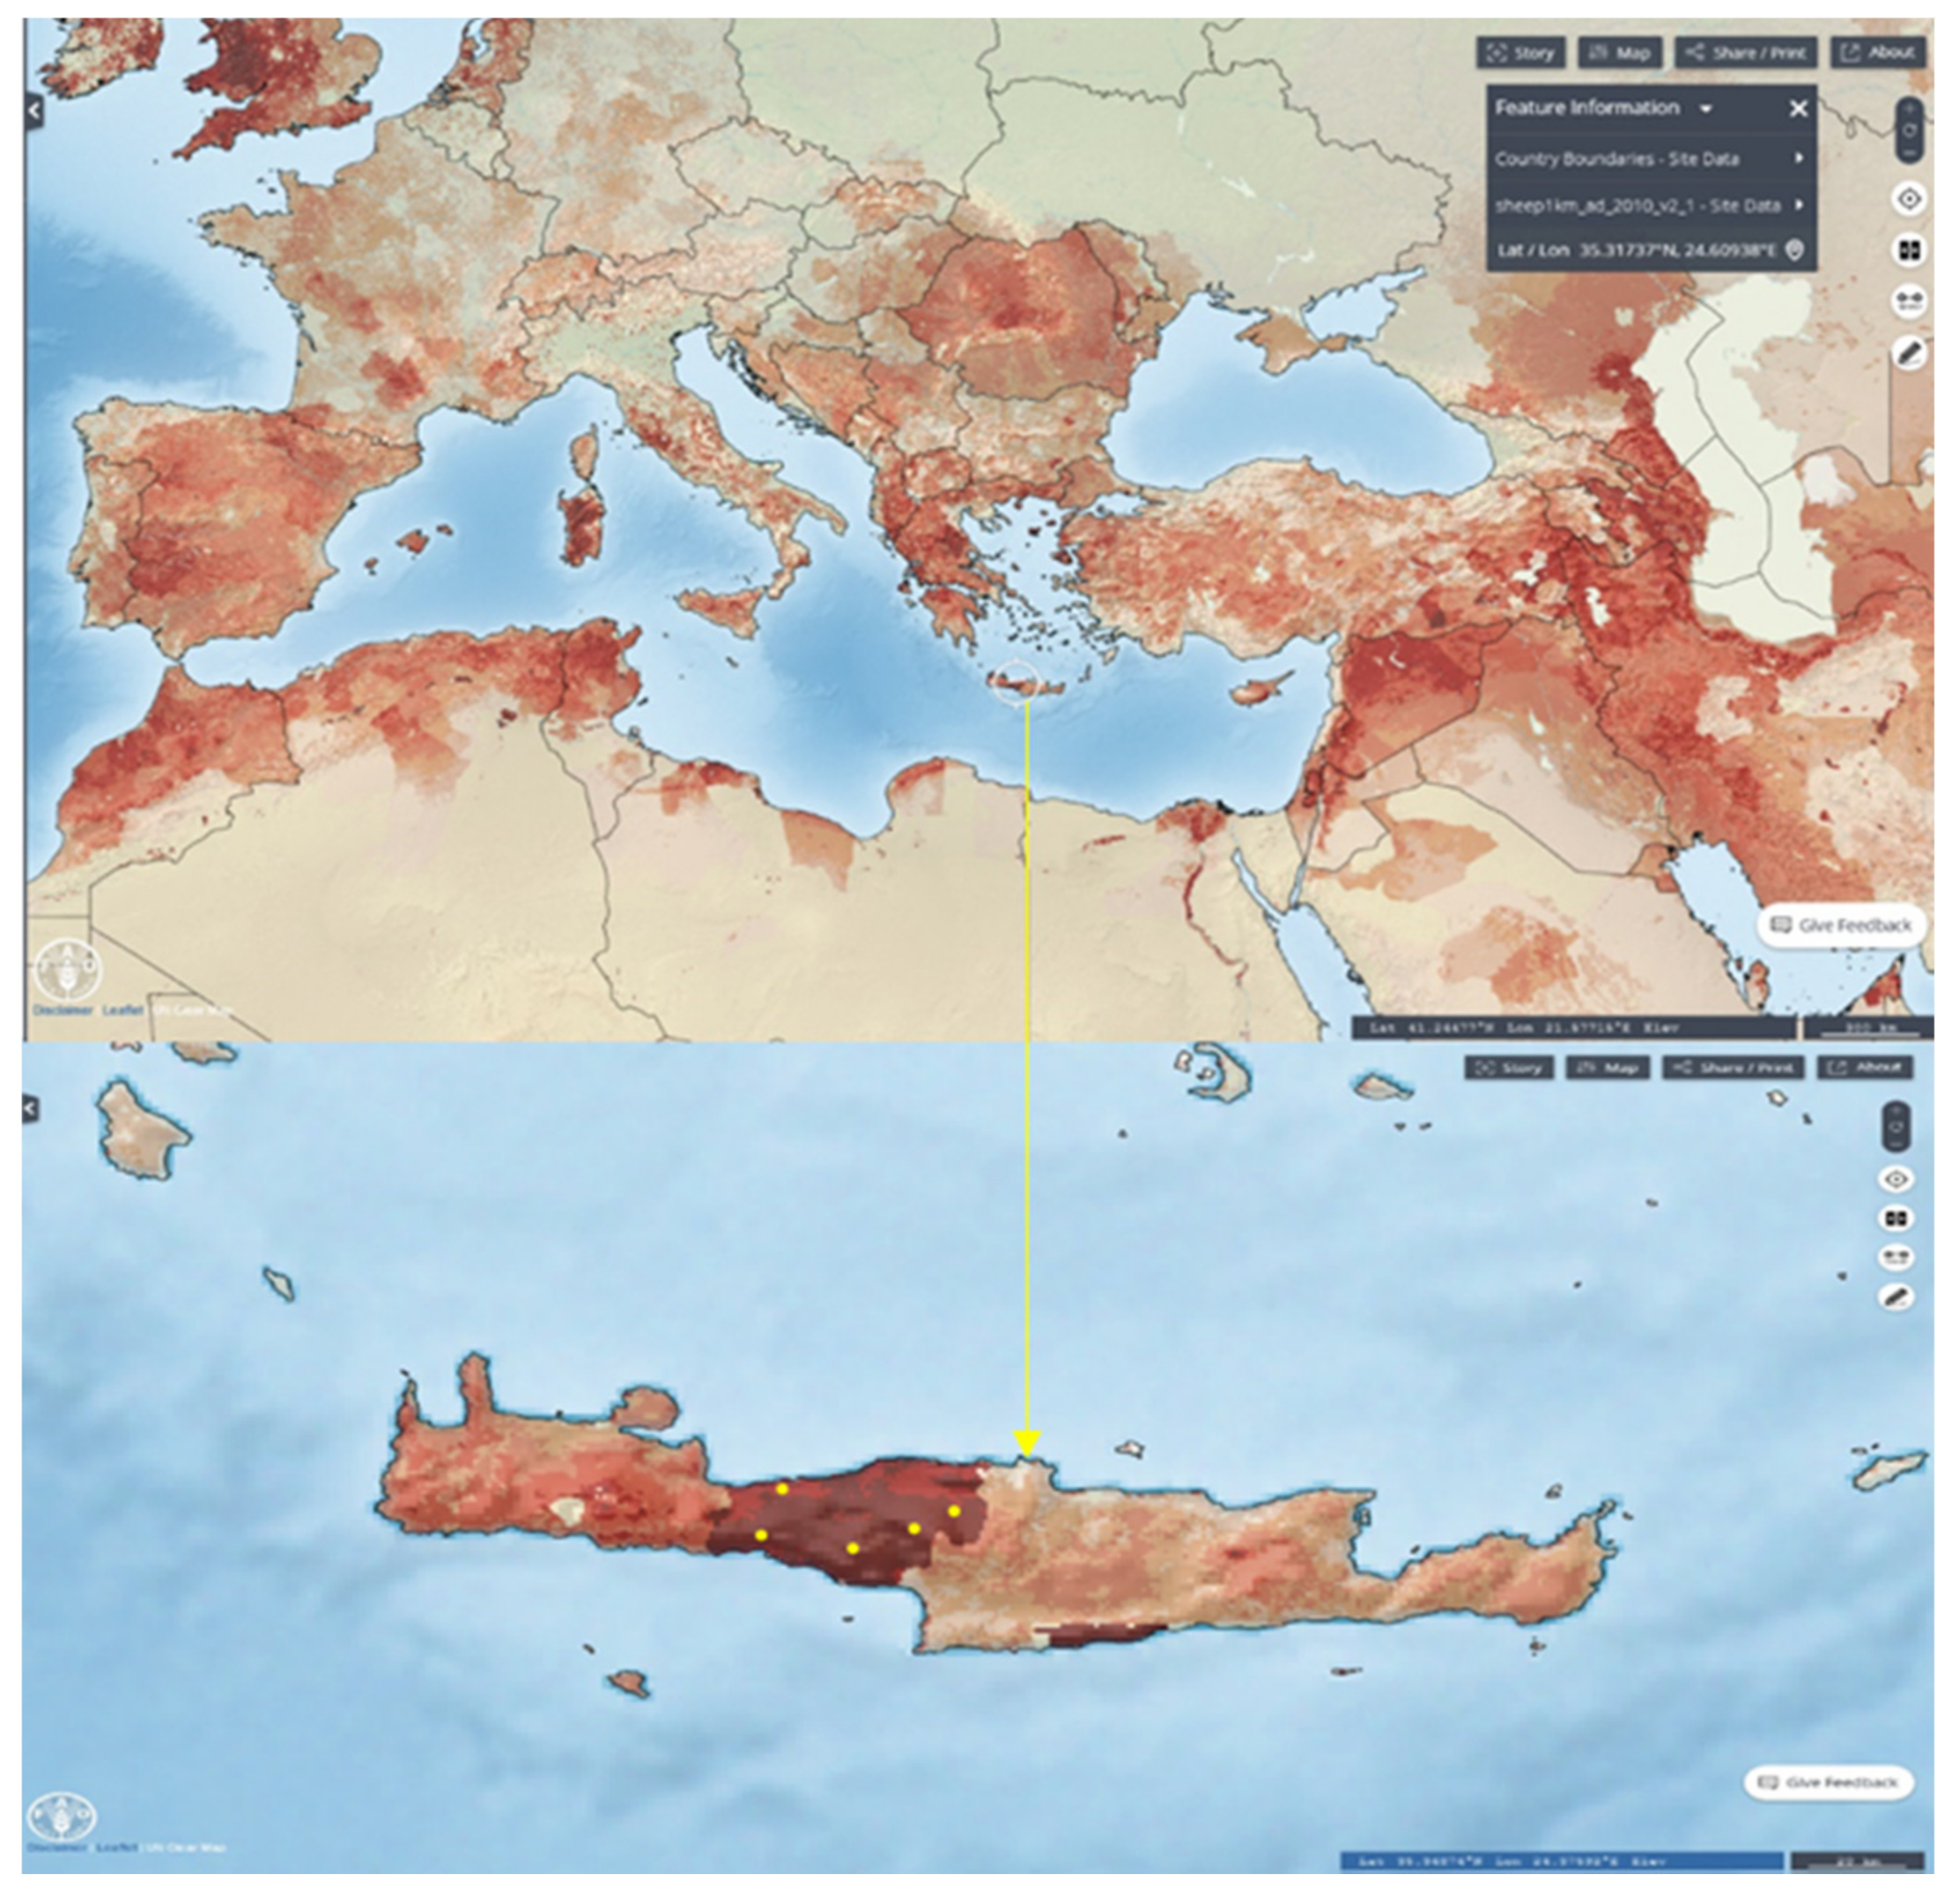
2.1. Study Area, Animals and Systems

This study was conducted in Crete, which has a homogenous genetic population of approximately 1.74 million sheep (21.2% of the national flock) [26], 80% of which belong to the local Greek Sfakion breed [27] and milk production in Crete accounts for approximately 13.3% of total Greek sheep milk production [28]. In Crete, there are a large number of both extensive [29] and semi-intensive farms and flocks [24], with distinct lambing periods, which allows the effect of intensification to be studied with minimum confounding effects of breed and genetics and within seasonal climatic variation. Farms enrolled in the study were located in the provinces of Rethymno and Chania, where the highest sheep population density on the island is found (Figure 1).
A total of 20 commercial sheep flocks were included in the study. All farms reared pure-bred sheep of the local Sfakion breed [30]. The farms included in the study lambed mature ewes in October or November (early lambing period) while the 20–25% ewes-lambs were lambed later in January or February (late lambing period). Suckling lasted for 30 to 60 days. After weaning, ewes were milked twice a day until early to mid-summer, either by hand (still widely practiced in extensively managed flocks) or by semi-automatic or automatic milking machines (typical for semi-intensive systems).
Ten farms represented typical semi-intensive production systems (SI) and ten represented typical extensive production systems (EX) used in Crete. Systems were classified as extensive when flocks had low stocking densities (>0.5 ha/ewe), spent at least 300 days each year grazing marginal land with semi-natural vegetation, used less than 200 kg supplementary concentrates per ewe per year and had limited investment facilities (<2 m2 per animal). In contrast, semi-intensive systems were characterised by higher stocking densities (0.25 ha/ewe), with more than 200 days grazing on improved grassland per year, feeding more than 250 kg supplementary concentrate per ewe per year and had high invested capital in facilities (>2.5 m2 per animal) and earlier lambing periods than the extensive farms [24].

2.2. Experimental Design

The experimental design is presented in Figure 2. The selected flocks were monitored for two consecutive lactation periods on monthly intervals. At each visit, information about (a) flock health status, (b) nutrition, (c) interventions made in the flock and (d) productivity was collected using a standard questionnaire (Figure S1).
In addition, records of the environmental conditions (T and RH) were retrieved from recorders placed in outside housing facilities (T&D Recorder, RTR-53) on each farm. Rainfall data from the local National Observatory of Athens weather stations in the area were also collected. Detailed information characterizing each farm (flock characteristics, pedigree information, agronomical characteristics of each farm, health issues and prevalence of diseases, health management, udder health management, flock management during mating, lambing and milking) was collected at the beginning of each lactation/production year with a more detailed farm questionnaire. The botanical composition of grazing areas was classified using an altitude-based estimate of sward composition, which allocated values of between 1 and 5 with plant communities at sites of higher elevation in the hills being allocated higher values [31].
Considering the between-animal variations that may exist for milk production, milk quality and animal health, twenty lactating ewes were selected within each flock in order to further investigate, at an individual animal level, the effect of management systems on milk yield and quality as well as the incidence on important production reducing diseases such as mastitis and infection by GINs. Moreover, since there are two different lambing periods and two different, but overlapping milking periods, not including animals from both lambing/milking periods would result in not assessing an important, potentially confounding factor. Thus, ten of the ewes were from the late lambing period (LL) and were primiparous (ewe lambs) and ten of them were from the early lambing period (EL) and were multiparous (second or third lactation specifically). The animals selected during the 2nd year of the study had to be different from the ones selected the 1st year, since replacement ewes are the ones lambing late in winter and it was important to assess animals with a similar age in both years.
On each sampling date we collected individual rectal faecal samples and assessed body condition using a standard protocol [32]. During the lactation, sampling occurred in the evening prior to milking, and for each ewe, milk yield was assessed with the use of a volumetric canister. From each animal, we aseptically collected three milk samples for further analysis. The 1st set was collected directly from the udder (2 half-udder samples) and used for assessment of mastitis related pathogens, and the 2nd and 3rd set from the canister for milk chemical composition (fat, protein, lactose, solids non-fat) and for somatic cell counts and total bacterial counts, respectively.
In addition, we collected milk samples on two sampling dates in each lactation period for milk fatty acid (FA) profile analysis. The first sampling data for FA-profile analysis was conducted at the beginning of March when both lambing groups had a stable feeding regime, which included grazing and supplementary concentrate feed. The second was in the beginning of May before the mating season.
The study was conducted in compliance with the national animal welfare regulations. Diagnostic veterinary procedures are not within the context of relevant EU legislation for animal experimentations (Directive 86/609/EC) and may be performed in order to diagnose animal diseases and improve animal welfare. Samples were collected by registered veterinarians and caused no suffering. Samples were collected only after the farmers’ consent had been obtained. The experimental protocol was approved by the responsible institutional committee (VRI Committee for Approval of Experimental protocols as appointed at 26/5/2014, Decision nr 972).

2.3. Climatic Conditions in the Two Production Season

Climatic conditions differed considerably between the two production seasons (Table S1).
The first production season rainfall was mainly in December and February and there were relatively high temperatures in January (Table S1). In the second production season, the winter was generally cooler and there was more rainfall in January, similar rainfall in February and then again, more rainfall in March, April, and May, compared to the first production season. When the period in which the samplings for FA analyses occurred was compared, the average monthly temperature in the first production season was similar between March and April and only slightly higher in May and June, while in the second production season, temperatures gradually increased from March to June. (Table S1).
Climatic conditions, especially temperature and rainfall, are known to affect the amount of forage available, forage quality, and animal performance and health [33,34] and we therefore either (i) included production season as a factor in factorial ANOVAs or (ii) analysed data from the two production seasons separately (see below).

2.4. Feeding Regimes Used in Extensive and Semi-Intensive Flocks

The feeding regimes recorded in semi-intensive and extensive flock/farms were similar in both years and are summarised in Figure 3.
The semi-intensive (SI) farms used more concentrate feed (270 ± 23 vs. 162 ± 18 kg ewe−1) and hay (82 ± 6 vs. 60 ± 10 kg ewe−1) compared to extensive (EX) farms, although the difference is only significant for concentrate feed.
In both the EX and SI systems most hay was fed to ewes during the two lambing periods, which was in October and November and in January and February (Figure 3). During the lactation, the SI farms relied more on grazing on improved/cultivated pastures (grassland sown after cultivation) and on home-produced whole crop oat, supplemented with bought-in alfalfa hay. In contrast, the EX farms utilized natural pastures all year round, but were fed more hay (mainly bought-in alfalfa) than the SI-farms [16,24]. From late spring/early summer until lambing, both systems relied almost exclusively on grazing of natural pastures.
A detailed comparison of differences in feeding regimes between management systems, production seasons, and lambing groups during the milking period (when both lambing groups were managed within the same flock) is shown in Table S2.

2.5. Health Management Regimes Used in Semi-Intensive and Extensive Flocks

All EX and SI farm removed manure from barns/corrals and disinfected their facilities at least once per year as part of their animal health management plans. The veterinary regimes recorded in SI and EX flock/farms were also similar in both years. Comparisons of veterinary regimes are based on data from farm records collected via questionnaires with farmer. The level of antibiotic and antiparasitic veterinary intervention was overall slightly lower on EX than SI farms, but since assessments were made at flock level statistical comparisons were not possible. Necessary proactive vaccinations against Enterotoxaemia were applied in both systems, at least once a year, before lambing, with several farmers (5 SI farms and 2 EX farms) applying a booster before mating. Other vaccinations were used only when there were regional disease outbreaks or threats.
Mastitis prevention treatments in both systems were specific to each farm’s background mastitis levels and only 3 farms (2 SI farms and 1 EX farms) used vaccines against clinical mastitis. Prophylactic intramammary antibiotic treatment during the dry period were not used on any of the farms. However, on most farms, intramuscular antibiotics were used to treat clinical mastitis, and on 4 farms, (3 SI farms and 1 EX farms) a combination of intramammary and intramuscular antibiotics was used to treat clinical mastitis.
All farms applied anthelmintic treatments before lambing without prior testing and laboratory confirmation of parasites infection levels. The most common class of anthelmintic used were benzimidazoles (i.e., albendazole and fenbendazole). All SI farms rotated the class of anthelmintic drug of choice each year and six out of 10 SI farms used macrocyclic lactones (mainly ivermectin) at least once every two years. In contrast, this practice was only used by 1 out of 10 EX farms.
All farmers vaccinated weaned lambs against enterotoxaemia and treated them preventively with anthelmintics (benzimidazoles p.o.) against cestodes (i.e., Moniezia spp) or used an anticoccidial drug (toltrazuril/diclazuril) if there were symptoms relevant to coccidiosis. Additionally, more than half of the SI and EX farmers prophylactically treated the new born lambs with antibiotics to prevent either pneumonia or enteritis.

2.6. Analytical Methods

2.6.1. Milk Samples Analysis of Chemical Composition, Somatic Cell Count and Bacterial Load

Analyses were conducted 12 h after sampling at the State Milk Quality Laboratory (ELOGAK) in Rethymno, Crete. The samples where heated to 25 °C and pH measurement was taken. For samples with pH above 6.00, chemical composition (fat, protein, lactose and non-fat solid content) was assessed by infrared methods (MilkoscanTM FT, FOSS®, Hilleroed, Denmark) and by flow cell cytometry the Somatic Cell Count (SCC/FossomaticTM FC, FOSS®, Hilleroed Denmark) and the Colony Forming Units (CFU/ BactoScanTM FC, FOSS®, Hilleroed Denmark). Samples with pH < 6.00 (=38 samples in total) were discarded since they were below instruments’ acceptable level for analysis. One vial was used for chemical composition and SCC assessment and a second vial for Colony Forming Units.

2.6.2. Parasitological Examination

For faecal samples, parasitic egg counts were conducted according to the modified McMaster technique [35], using a saturated sodium chloride solution as floatation means, with a sensitivity of 50 eggs per gram of faeces (FEC). Faecal cultures of samples with FEC ≥ 200 were conducted for L3 stage larvae identification. Samples were incubated for 12 days at 27 °C, and afterwards, larvae were collected according to Baermann technique [36].

2.6.3. Mastitis Related Pathogens Detection

Evaluation of sub-clinical mastitis and microbiological examination of half udder milk samples was conducted when the SCC was higher than 500,000 cells per ml milk as described by Kiossis, et al. [37].

2.6.4. Milk Fatty Acid Analysis

The milk preparation, methylation, and gas chromatography analysis for FAs were as described by Butler, et al. [38] using a Shimadzu GC-2014 (Shimadzu, Kyoto, Japan). Identification of individual FA was performed from the retention time by using FA methyl ester standards mix and expressed as a proportion of total peak areas for all quantified FA (g/100g of total FA). The total area of unidentified peaks (which may or may not have been fatty acid methyl esters) was <6.5% of total peak area. In addition, we calculated the total concentrations of (a) saturated fatty acids (SFA), (b) monounsaturated fatty acids (MUFA), (c) polyunsaturated fatty acids (PUFA), (d) omega-3 PUFA (n-3) and (e) omega-6 PUFA (n-6).

2.7. Statistical Analyses

All statistical analyses were conducted in the R platform. The significance level for all the statistical tests was defined at 5%. All the analyses were conducted in the R statistical language (R Development core team). The main statistical inference analysis was based on Linear mixed-effects models [39] and three different sets of analysis were conducted:
  • Analysis of variance (ANOVA) using linear mixed-effects models, with “management system”, “sampling month”, and “year” as fixed factor sand “flock” as a random factor, for investigating differences on farm level;
  • Analysis of variance (ANOVA) using linear mixed-effects models with “management system”, “lambing period” and “production year” as fixed factors and “flock” as a random factor, for investigating differences on farm level for the prevalence of the recorded diseases (as indicated by the farmers and the veterinarian of the flock);
  • Analysis of variance (ANOVA) using linear mixed-effects models with “management system”, “lambing period” and “sampling month” as fixed factors and “animal” as a random factor, for investigating differences on animal level. The analysis was conducted separately for the two different sampling years.
Variables calculated as proportions (prevalence of diseases, individual FAs, SFAs, MUFAs, and PUFAs) were arcsine-transformed, and SCC and CFU values were transformed to lnSCC and lnCFU, respectively. Tukey’s honest significant difference test was used for pairwise comparisons of means where appropriate to account for the familywise error. Residual normality was assessed using the qqnorm plots [40], with none of the data reported here showing deviation. Furthermore, all the homoscedasticity of all the models was investigated, with no reported data showing heteroscedasticity.
Multivariate redundancy analysis (RDA) was used to extract and summarise the variation in a set of response variables that can be explained by a set of explanatory variables. RDA was performed with the CANOCO package [41] using automatic forward selection of variables with significance calculated using the Monte Carlo permutation test.

3. Results and Discussion

Traditionally, dairy sheep rearing has been an important economic activity in semi-arid regions such as the Mediterranean, where the ability of small ruminants to utilise low quality forage on marginal land provided human populations with suitable economic activity and a source of high-quality protein [6].
Recently, increased demand for ovine dairy products has resulted in an intensification of Mediterranean dairy sheep production to increase milk yield per ewe and unit land area [6]. This was achieved by increasing (a) the use of bought-in concentrate feed and improved pastures, (b) capital investment, (c) flock size and (d) breeding for high milk yield per ewe. However, while increasing milk yield per ewe and unit of grazing area, intensification was also reported to generate new challenges with respect to maintain animal health and both meat and dairy product quality. However, there is limited sound scientific information on the effects of different intensification practices on animal health, veterinary input needs and nutritionally relevant milk quality parameters [24].
In our study, two types of production systems (EX and SI) extensively applied in Crete, were selected to be used as representative for the two levels of intensification of grazing-based, out-door production systems found in many other semi-arid regions [6,24,25], in order to compare (i) animal health (see Section 3.1 and Section 3.2 below) and (ii) milk yield and composition parameters (see Section 3.3). It therefore allowed trade-offs between milk yield gains from intensification and both animal health and welfare and milk quality to be quantified.

3.1. Effect of Production System, Lambing Period and Season on Animal Health Parameters

Animal health-related parameters were assessed during regular monthly visits to all farms and ANOVA results and main effect means ± SE are reported in Table 1 and Table 2, while interaction means ± SE for significant two-way interactions are reported in the supplementary material (Tables S4–S6 and Tables S10–S12). Feeding and grazing regimes differed significantly between SI and EX farms/flocks (Figure 3), while health management practices were similar in both systems (Section 2.4).
Section 3.1.1, Section 3.1.2, Section 3.1.3, Section 3.1.4, Section 3.1.5 report and discuss health relevant parameters that were assessed at the individual animal level [23]. Section 3.1.6 reports and discusses the incidence of other diseases and flock management data that were recorded at the farm/flock level. Section 3.2 describes associations between environmental and agronomic factors and animal health parameters identified by redundancy analysis (RDA).

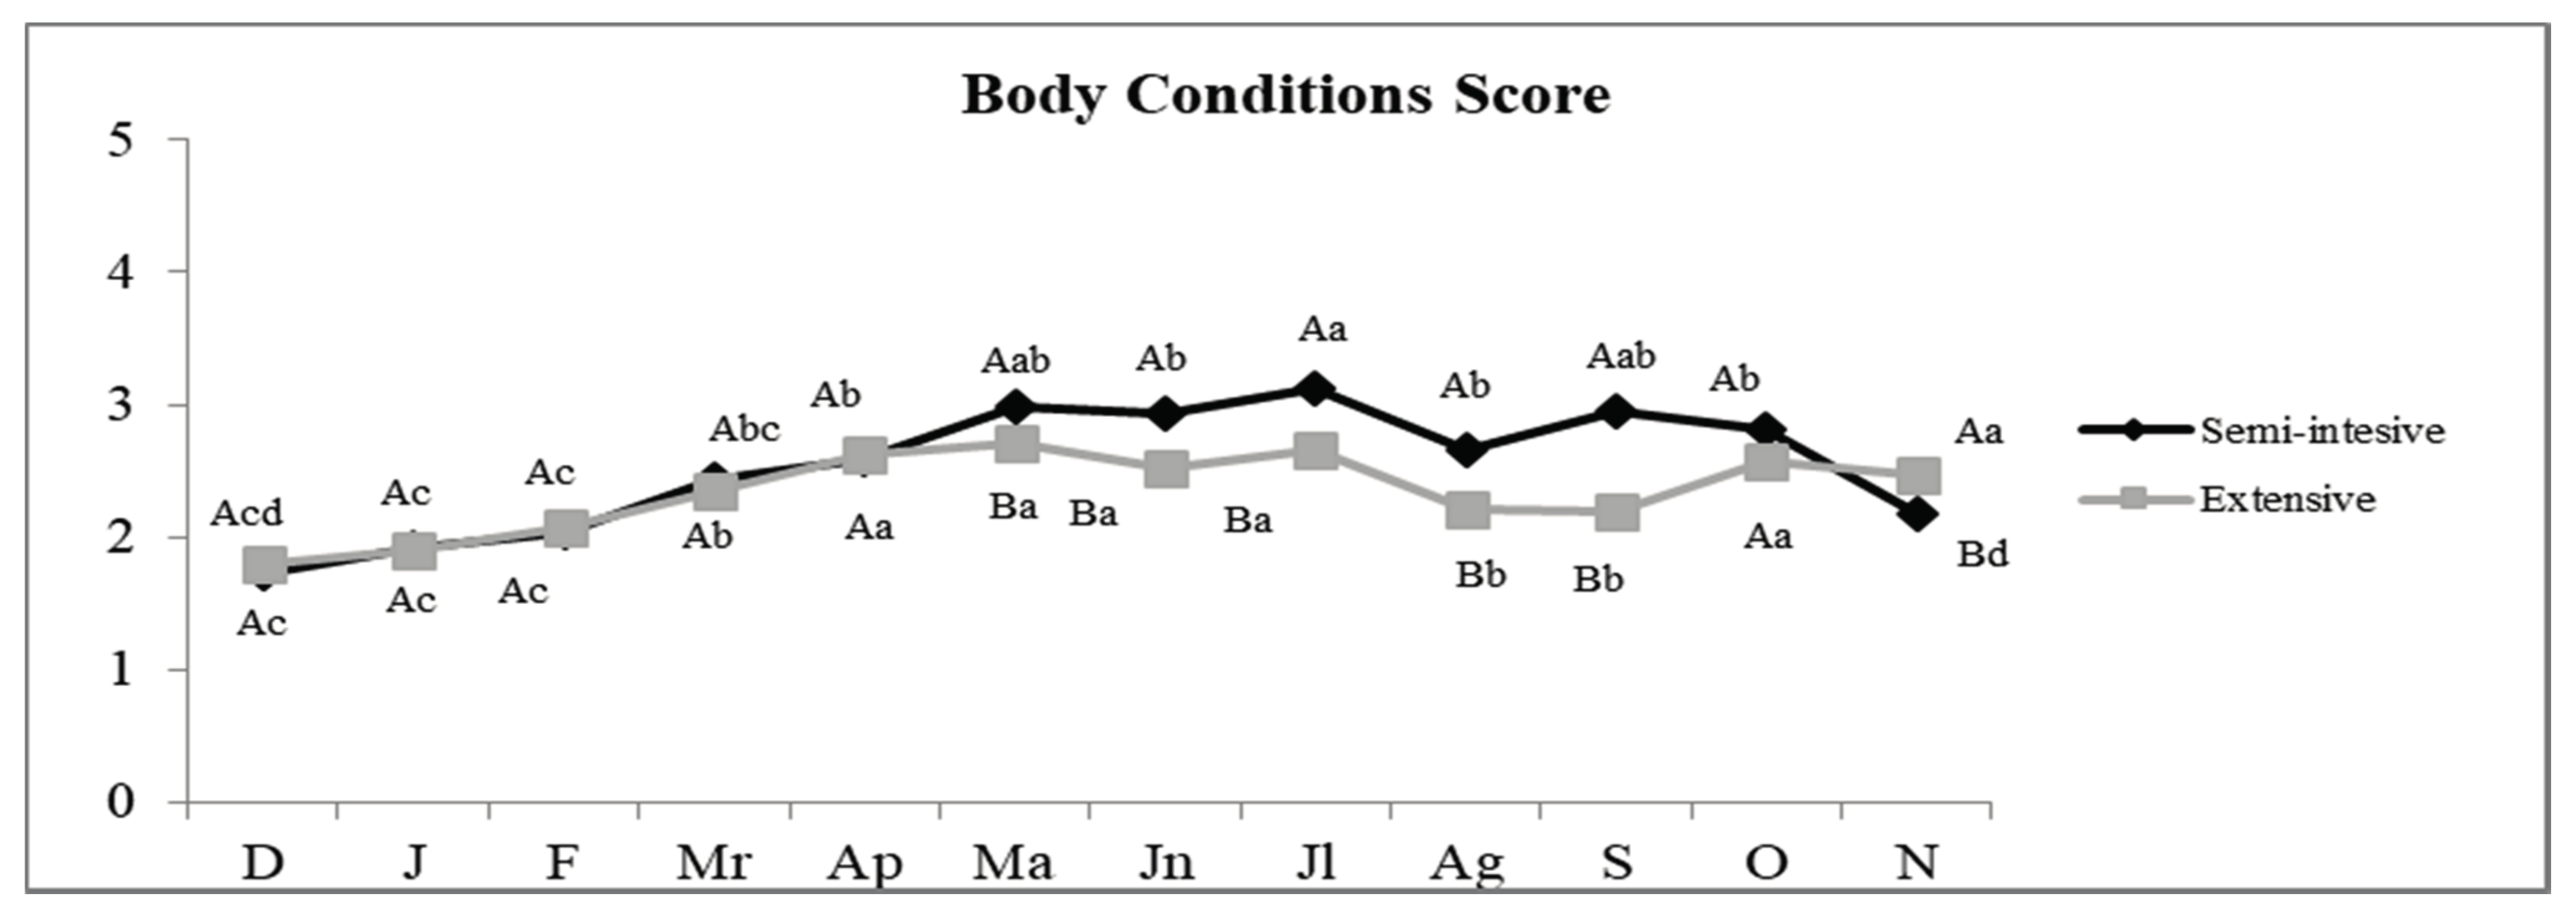
3.1.1. Body Condition Score (BCS)

As an index of nutritional and general health status, BSC was recorded monthly in individual animal level in each farm (Figure 4). In both systems, ewes’ BCS declined in August and after lambing, while afterwards, it steadily increased during milking, reaching its highest values at the end of spring with SI farms having higher scores at the end of lactation and during summer. Both systems had adequate average BCS without incidences of malnutrition or overweight animals [22].

3.1.2. Faecal Egg Counts (FEC)

In both years, GIN were present in over 50% of the animals, and the EX flocks tended to show higher burdens in comparison to the SI flocks, although this difference was not significant (61 ± 4% vs 51 ± 4%, p value 0.62). Moreover, the yearlings had higher burden compared with the older ewes (61 ± 3% vs 49 ± 3%, p value 0.02). Mean FEC/farm was generally low (<150 eggs per gram of faeces) indicating an overall mild GIN infection. High FEC (> 500), suggesting severe infections, were only recorded around lambing, characteristic of the periparturient rise. FEC values were higher in the second year/production seasons when higher rainfall was recorded. In both years, the most common GIN species identified were Trichostrongylus spp. (65%), Teladorsagia circumcincta (23%) and Haemonchus contortus (12%).

3.1.3. Somatic Cell Count (SCC) in Milk

For SCC in milk, significant main effects of production system, lambing period and sampling months were detected in both years (Table 1). Specifically, SI-managed ewes had higher SCC year 1, but lower SCC in year 2, when compared to EX managed ewes (Table 1). Early lambed older ewes had higher SCC compared to late lambed yearling ewes (Table 1) and SCC were found to be significantly lower between March and April than in June in both years (Table 1).
Significant two-way interactions between management systems and sampling months were detected for SCC in both years (Table 1); differences between management systems were significant in several, but not all sampling months (Table S4).
Significant two-way interaction between lambing period and sampling month were detected in year 2 only (Table 1); in year 2, differences between lambing periods were found to be significant in several but not all sampling months (Table S5).

3.1.4. Microbial Load (Colony Forming Units) in Milk

For microbial loads (colony forming units, CFU), significant main effects of management system and lambing period were only detected in year 1 and SI-managed and early lambed ewes were found to have higher CFU in milk (Table 1).
In contrast, a significant main effect of sampling month was only detected in year 2, when CFU decreased between March and May and then slightly increased again in June, although the difference between May and June was not significant (Table 1).
Significant two-way interactions between (i) management system and sampling months and (ii) lambing period and sampling month were detected in year 2 only (Table 1); differences between management systems or lambing periods were significant in some but not all sampling months (Tables S4 and S5).

3.1.5. Estimated Incidence Subclinical Mastitis

Somatic cell count and microbiological assessments of milk were made at the individual animal level. A somatic cell count of more than 500,000 in milk from individual ewes was used as an indicator/marker for subclinical mastitis. In ewes with SCCs above this threshold, the bacteria found in milk were further characterised by standard microbiological tests to separate them into Gram positive (Gram+) pathogens (indicative of infections transmitted between animals) and Gram negative (Gram−) pathogens (indicative of environmental sources of infection) (Table 2).
ANOVA detected no significant main effects of management system on the (i) proportion of ewes with subclinical mastitis, and (ii) detection frequency of Gram+ and Gram-pathogens in milk from ewes with subclinical mastitis (Table 2). However, highly significant main effects (p < 0.001) of lambing seasons were detected. Specifically, the incidence of subclinical mastitis was significantly (~45%) lower in late-lambed, younger ewes. The % of milk samples with subclinical mastitis that tested positive for Gram+ and Gram- pathogens was significantly lower in late lambed yearling ewes compared to early-lambed, older ewes.
Although the proportion of ewes with subclinical mastitis was similar in the two production seasons/years, highly significant (p < 0.001) differences in pathogen profiles were detected between the two years. In year 1 (with lower rainfall), 57% of milk samples tested positive for Gram+, but only 4 % for Gram- pathogens, while in production season 2 (with higher rainfall), Gram- and Gram+ pathogens were detected in a similar proportion (~20%) of ewes with subclinical mastitis (Table 2). There were weak interactions (0.01 < p < 0.05) between years and the other two factors, but these were not further investigated.
When the detection frequency of different bacterial pathogens known to cause mastitis was compared, coagulase-positive Staphylococcus spp. were most frequently found (52% of samples), followed by Corynebacterium spp. (10% of samples), coagulase positive Staphylococcus spp. (8% of samples), E. coli (4% of samples) and Streptococcus spp. (4% of samples).
Subclinical mastitis and GIN infection are considered to be the most important veterinary challenges in intensified dairy sheep production, resulting in both reductions in animal welfare and yield/economic performance [23]. Results suggest that the health management regimes implemented in both SI and EX systems provide satisfactory levels of udder health and control of GIN infections). In the extensive systems, GIN infection levels were expected to be low, due to the lower stocking densities used and the unfavourable environmental conditions for parasitic larvae in natural pastures in semi-arid regions [42]. However, findings of similar SCC, milk microbial contamination levels and relatively low FEC of GIN in both systems were unexpected, since previous studies reported substantially higher levels of both mastitis and GIN infections in intensive production systems [8,10]. The reasons for this remain unclear, but for GIN infection levels, this could have been due to the specific climatic conditions in Crete (high temperatures and long dry periods), which do not favour larval survival in a pasture, coupled with the more extensive, prophylactic use of broad spectrum anthelmintics compensating for the higher GIN infection pressure in SI-flocks.
The levels of subclinical mastitis (estimated from SCC and the proportion of milk samples tested positive for mastitis related pathogen) and GIN-infections (estimated from FEC) were similar to those reported in other Mediterranean regions [8,43,44]. The contrasting trends detected for GIN and mastitis markers between years (e.g., higher GRAM+ mastitis pathogen CFU in milk in the dryer year 1 and higher FEC and GRAM- mastitis pathogen CFU in the high rainfall year 2) are consistent with previous studies and suggest that background climatic conditions were a main driver for sub-clinical mastitis. [8,45]. However, given the increasing problem of anthelmintic resistance in GIN previously recorded in Crete [46], the widespread prophylactic use of anthelmintics recorded in both systems in this study are of concern and the participating farmers have now been advised to adopt FEC assessment and environmental condition monitoring-based health management regimes. Overall, results suggest that the relatively low levels of GIN disease pressure should allow further reductions in anthelmintic use in Crete by adopting FEC monitoring-based health management regimes [47]. H. contortus, which is a significant problem for the flocks in arid regions and was described as an “arising crisis” in Europe [48,49], was only identified in a small proportion (~12%) of faecal samples.

3.1.6. Incidence of Diseases and Health Related Management Parameters

The incidence of diseases and health related management parameters was recorded at the flock/farm level. Highly significant main effects of production system and lambing period were detected for disease incidence/health-related management parameters, while production season/year had no significant or only small effects (Tables S10–S12). Results obtained are described in detail in the supplementary materials.

3.2. Associations between Environmental/Agronomic Factors and Animal Health

Redundancy analyses were conducted to estimate the relative strength of associations between different environmental, agronomic and management explanatory variables/drivers and animal health related parameters (response variables). RDA also allowed the importance of management factors (e.g., milking method) that could not be investigated by ANOVA (Figure 5).
In the bi-plot resulting from RDA shown in Figure 5, axis 1 explains 28.4% of the variation with axis 2 explaining 0.03%.
The strongest drivers identified by RDA were (i) supplementary concentrate intake (p = 0.004), (ii) milking method (automatic milking, p = 0.028; semi-automatic milking p = 0.428; milking by hand: p = 0.428) and (ii) lambing period (late lambing, p = 0.012; early lambing group, p = 0.012). In contrast, the other feeding regime drivers and all environmental drivers assessed explained only small amounts of the additional variation (Figure 5). There were positive associations between concentrate intake, early lambing, and to a lesser extent, rainfall, and (i) clinical mastitis, (ii) CFU in milk, (ii) casualties, (iv) obligatory replacements, and to a lesser extent, (v) lameness, (vi) ruminal acidosis, (vii) pregnancy toxaemia and (viii) SCC in milk along negative axis 1. In contrast, there were negative associations between the same group of response variables and hand milking, and to a lesser extent, hay intake, semi-automatic milking and grazing altitude along axis 1 (Figure 5).
There were strong negative associations between hay intake, semi-automatic milking, hand milking and grazing altitude and a range of diseases including (i) coenurosis, (ii) diarrhoea, (iii) bloat, (iv) abortions after the 3rd month, and to a lesser extent, (v) contagious ecthyma, (vi) deaths associated with Clostridium infections, (vii) ectoparasite infections and (viii) FEC of GIN (Figure 5). In contrast, the same range of response variables was positively associated with late lambing and grazing of cultivated/improved pasture (Figure 5). Results from both ANOVA and RDA identified strong effects of management system and associations between management parameters and the overall health status of the flock.
Overall, SI farms had higher percentages of causalities among the ewes in comparison to the EX farms, and this was likely due to the greater incidence of diseases that impair animal health and productivity, as previously reported [14]. The RDA also showed that incidence of diseases that were more prevalent in SI systems were linked to specific intensification practices, and in particular, the use of concentrate feeds and use of cultivated pastures, which are grazed at higher stocking densities than natural pastures. Specifically, the higher incidence of the two main diet-related diseases (ruminal acidosis and diarrhoea of adult ewes) on SI farms was previously linked to an increased use of concentrate feeds in sheep diets [50,51]. Similarly, high rates of feed supplementation and other intensification practices were previously linked to a higher risk of enterotoxaemia and other Clostridium-infections of the gastrointestinal track in sheep [52].
However, it is important to note that SI flocks also grazed more in cultivated fields (e.g., weeds and grown cover in olive and other perennial crops, and weeds/crop residues in fields used for cereal or vegetable production), which was recorded in this study as grazing on natural pastures. The botanical composition, growth stage of vegetation and the consumption of specific plants (e.g., sorrel) in these cultivated fields may also explain the higher diarrhoea and bloat incidence in SI-flocks [53]. Acute problems with ruminal acidosis, bloats or diarrhoea observed in both SI and EX flocks may also be caused by mistakes in feeding practices (e.g., periods when only cereals were fed to ewes) that disrupted the balance between forage and concentrate intake.
However, EX farms/flocks had a higher incidence of diseases and parasites that are known to be associated with natural grazing environments and less rigorous animal health monitoring. For example, higher incidences of animals with chronic diseases such as progressive pneumonia, chronic piroplasmosis, paratuberculosis and endoparasites, were linked to less efficient ewe inspection during milking and feeding [25]. There is a higher risk of exposure to ectoparasites in natural environments, and this, together with less rigorous animal inspection, may also have contributed to the higher ectoparasite infestation levels in EX flocks [54].
Results also confirmed findings of previous studies that reported that lambing period has a significant effect on the health status/prevalence of diseases [18,52,55], but this may have been due to differences in (i) the age of ewes and (ii) environmental conditions/feeding regimes during the lactation and dry periods. The findings that (i) milk from early lambing (EL) older ewes had higher SCC and tested more frequently positive for mastitis pathogens and (ii) the incidence of both subclinical (SCC > 500,000) and clinical mastitis was higher in EL older ewes is consistent with results from previous studies that reported that the age of ewes was the most likely cause for the higher incidence of mastitis in EL ewes [18]. However, differences in disease pressure associated with contrasting environmental conditions/feeding regimes during the lactation period may have also contributed [45]. Specifically, periods of high concentrate intakes were previously linked to higher incidences of mastitis [8]. This view is supported by the RDA results in this study that identified high levels of concentrate intake as a major positive driver for clinical mastitis incidences and total CFU in milk.
In contrast, the higher incidence of lameness in EL older ewes was more likely, due to (i) EL animals spending more time in barns and corrals, as reported previously [55], and (ii) multiple birth being more prevalent in older EL ewes, which was linked to a higher incidence of pregnancy toxaemia in addition to nutritional stress from the previous lactation [56]. In contrast, the lower incidence of ruminal acidosis, bloats and diarrhoea in late lambed (LL) yearling ewes (which are lambed in spring) was linked to the availability of high-quality fresh forage and feeding regimes with a more suitable forage to concentrate ratio during lambing (a period when ewes have particularly high nutrient intake requirement) [51,53]. We also observed that farmers tended to graze LL ewes on the high-quality pastures (plant density), although the grazing time on natural pastures did not differ between the two groups. This practice may also explain the slightly higher frequency of enterotoxaemia for the LL ewes, although incorrect vaccination practices (time of vaccination) were also observed on farms. Differences in feeding regimes and type of pastures used for EL and LL ewes were also reported to affect the incidence of intestinal tract infections caused by Clostridium spp [52], and this is consistent with the RDA results in this study that identified positive associations between grazing time on cultivated pastures and higher incidence of deaths associated with Clostridium infections of the gastrointestinal tract.
Abortions were also more common in the LL yearling ewes, possibly due to a less developed immune system as reported previously [57]. The less developed immune system in yearling ewes may also explain the higher ectoparasite and TBD infection levels recorded in LL-flocks, and the relatively high percentages (31%) of contagious ecthyma in LL ewes compared to the low incidence in older EL ewes (1.7%) [54,58].

3.3. Effect of Production System and Season on Milk Yield and Quality

Milk yield and quality parameters were assessed in samples taken from selected ewes on each farm throughout the lactation period (Table 3, Table 4, Table 5, Table 6, Table 7 and Table 8 and Tables S4–S9).
In the results presented here, only milk yield and quality data obtained between March and June were included in the analyses, since this was the period when both early and late lambed ewes produced milk, and milk quality parameters could therefore be compared within the same environmental background conditions (Table 3 and Table 4). When comparing differences in milk yield and quality between production systems and lambing periods, it is important to consider that during the observation period, the early lambed yearling ewes were at a later stage in the lactation than the late-lambed older ewes. The difference in the age of ewes and that of the stage of lactation may therefore have contributed to the differences in milk yield and quality observed between early and late lambed ewes [59].

3.3.1. Milk Yield and Basic Composition, Fat, Protein and Lactose Content

Significant main effects of management systems were detected for milk yield, fat, lactose and non-fat solid content in both years and protein content in production season/year 2 (Table 3 and Table 4). Milk yield and lactose content in both years, and non-fat solids in year one, were significantly higher in milk from SI systems, while fat content in both years, and protein and non-fat solid content in year 2 were significantly higher in milk from EX-systems (Table 3 and Table 4).
Significant main effects of lambing period were detected for milk yield and fat, protein and lactose content in both years and non-fat solids in year 2 (Table 3 and Table 4). Milk yield and lactose content in both years and non-fat solids in year 2 were higher in milk from late lambed, older ewes, while fat and protein content were higher in milk from early lambed yearling ewes in both years (Table 3 and Table 4).
Significant main effects of sampling months were detected for milk yield, lactose and fat content both years, for protein content in year 1 and for non-fat solids in year 2. Milk yield, lactose content and non-fat solids decreased, while protein increased between March and June (Table 3 and Table 4). The fat content increased from March to April, decreased from April to May and then increased again from May to June in both years (Table 3).
Highly significant two-way interactions between (i) management system and sampling months and (ii) lambing season and sampling months were detected for milk yield and all basic milk composition parameters, except for non-fat solids in year 1 (Table 3 and Table 4). When the interactions between (i) management system and sampling months and (ii) lambing season and sampling month were further investigated, differences between management systems were found to be significant in some but not all sampling months (Tables S4 and S5).
A significant interaction between management system and lambing season were only detected for fat content in year 1 and non-fat solids in year 2 (Table 3 and Table 4). When these interactions were investigated further, milk fat content in year 1 was higher in milk from early lambed ewes from both SI and EX systems, but the relative difference between lambing groups was greater in SI systems (Table S6). In year 2, a significant difference in non-fat solid content between lambing groups was detected in the SI-system, but not the EX-system (Table S6).
The finding of 30% to 50% higher milk yield, but lower milk fat, lactose and non-fat solid concentrations in SI compared to EX-managed ewes in this study is consistent with the results of previous studies that compared milk yield/ewe and protein, fat and lactose content in bulk milk samples in the same region of Crete [16] and other regions [3,60]. This was reported to be mainly due to the higher concentrate and lower grazing time on natural pastures [16], and this view is supported by the results of the redundancy analysis of data from this study (see Section 3.3.3 below).
The finding of significant effects on lambing period on milk yield and milk fat, lactose and non-fat solid concentrations was consistent with the results of previous studies. For example, the finding that milk from older EL ewes (which were in the second or third lactation) had a higher milk protein and fat concentrations is consistent with the results reported by Sevi, et al. [59], who found an increase in milk protein and casein content as lactation number advances. They also suggested that the increased body weight in older ewes leads to higher (i) feed intakes, (ii) availability of “body reserves” for the synthesis of milk components and that the activity/capacity of udder tissue increases with age [59].

3.3.2. Milk Fatty Acid Profile

When comparing the concentrations of different fatty acids between management systems, lambing groups and sampling dates it is important to consider that the fatty acid concentrations are reported to g per 100g or kg of total fatty acids (Table 5, Table 6, Table 7 and Table 8) and that the total fat content in milk was significantly higher in milk from (i) EX system and (ii) ewes in the early lambing group (Table 3). In contrast, the fat content in milk was similar on the two sampling dates in March and May (Table 3).
Management systems had highly significant main effects on total SFA, lauric acid and myristic acid concentrations in both years, with SI-management resulting in higher concentrations in milk fat (Table 5 and Table 6). In contrast, production system had no significant effect on palmitic acid concentrations in both years and stearic acid (C18:0) concentrations in year 2, and stearic acid concentrations in year 1 were significantly higher in milk from EX systems (Table 6). The largest effect of production systems was detected for myristic acid, with concentrations found to be ~15% lower in the milk fat from EX when compared to SI farms (Table 6).
Lambing period had highly significant main effects on total SFA, lauric acid and stearic acid concentrations in year 1 only, with early lambing resulting in higher total SFA and lauric acid, but lower stearic acid concentrations in milk fat (Table 5 and Table 6). In contrast, lambing period had a significant main effect on myristic acid and palmitic acid concentrations in both years, with early lambing resulting in higher concentrations in milk fat (Table 7). There were highly significant main effects of sampling month production for total SFA and all four individual SFA assessed in both years (Table 5 and Table 6). Specifically, concentrations of total SFA and lauric acid were higher in March, while concentrations of palmitic acid and stearic acid were higher in May in both years (Table 5 and Table 8). In contrast, concentrations of myristic acid were higher in May in year 1 and March in year 2 (Table 6).
No significant interactions between management system and lambing period were detected for total and all four individual SFA (Table 5 and Table 6).
Significant interactions between management system and sampling month were detected for myristic acid in year 1 and palmitic acid and stearic acid in year 2 only (Table 6). In year 1, milk fat from semi-intensive systems had higher myristic acid concentrations in both sampling months, but the difference between systems was greater in May than in March (Table S8). In year 2, the concentration of palmitic acid was significantly higher in March than May in milk fat from SI, but not EX-managed ewes, although there were no significant differences in palmitic acid concentration in milk fat from SI and EX-managed ewes in both sampling months (Table S8). In year 2, stearic acid concentrations were higher in milk fat from EX-managed ewes in March, while there was no significant effect of production systems in May (Table S8).
Highly significant (p < 0.001) interactions between lambing period and sampling months were detected for total SFA and myristic acid in both years, although weak interactions (0.01 < p < 0.05) were also detected for lauric acid and palmitic acid in year 1 (Table 5 and Table 6). Milk fat from early lambed ewes had significantly higher concentrations of total SFA, lauric acid, myristic acid, C16 and total SFA in March. In contrast, in May of year 1, no significant effect of lambing period was detected for SFA and lauric acid, and the difference in myristic acid and palmitic acid concentrations between lambing periods was significantly smaller than in March (Table S9). Similar trends were detected for total SFA and myristic acid in year 2 (Table S9).
Mono-unsaturated fatty acids. Consumption of oleic acid (C18:1 cis9), the main monounsaturated fatty acid (MUFA) found in sheep milk, is widely considered to me nutritionally desirable [61]. For example, oleic acid is the main fatty acid found in olive oil and thought to contribute to the health benefits associated with traditional Mediterranean diets [62].
ANOVA detected significant (p < 0.05) main effects of management system and sampling month on total MUFA and oleic acid in both years and of lambing period in year 2 (Table 5). Specifically, both total MUFA and oleic acid were higher (~10–15%) in milk fat from (i) EX flocks and (ii) in samples collected in May in both years, and in early lambed older ewes in year 1 (Table 5).
No significant interactions between management system and lambing period were detected for total MUFA and oleic acid (Table 5).
Significant interactions between management system and sampling month were detected for oleic acid in both years and total MUFA in year 2 (Table 5). In year 1, total MUFA and oleic acid concentrations were higher in milk fat from EX-managed ewes in both sampling months, but the difference between systems was greater in May (Table S8). In year 2, oleic acid concentrations in milk fat from EX-managed ewes was only higher in March (Table S8).
Significant two-way interactions between lambing period and sampling months were detected for total MUFA and oleic acid in year 1 only (Table 5). Higher MUFA and oleic acid concentration in milk fat from late-lambed ewes were detected in March only (Table S9).
Polyunsaturated fatty acids. Overall, poly-unsaturated fatty acids (PUFA, many of which are essential fatty acids) are nutritionally desirable. However, many diets, especially in developed countries, are lacking in total daily intake or are imbalanced with respect to the ratios of different essential PUFA consumed, most importantly the omega-6/omega-3 PUFA [63]. Specifically, many diets are too low in omega-3 fatty acids and there are recommendations to increase the intake of omega-3 PUFA, and in particular, the long chain omega-3 PUFAs eicosapentaenoic acid (EPA), docosapentaenoic acid (DPA) and docosahexaenoic acid (DHA) [64]. Increased consumption of these omega-3 fatty acids has been linked to a range of health benefits including healthy development of the brain and eyes during childhood, lower rates of childhood adiposity, improved neurological and immune function, protection against CVD, and improved insulin sensitivity [65]. In contrast, current intakes of omega-6 fatty acids are thought to be too high, mainly due to high levels of consumption of vegetable oils/fats high in omega-6 content (e.g., soya, sunflower and maize oil) [66]. High omega-6 intakes and/or diets with a high omega-6/omega-3 ratio have been linked to an increased risk of atherosclerosis, obesity and diabetes due to the highly prothrombotic and proinflammatory effects of the eicosanoid products derived from omega-6 PUFAs such as linoleic acid (LA; the main omega-6 fatty acid found in milk fat) [67].
Significant main effects of management system were detected for total PUFA, total omega-3 PUFA, ALA, EPA and DHA in both years, and DPA, total omega-6, LA in year 2, with concentrations found to be higher in milk fat from EX-managed ewes (Table 5, Table 7 and Table 8). In contrast, the omega-6/omega-3 ratio was slightly lower in milk fat from EX-managed ewes in year 1, there was no significant main effect of production system in year 2 (Table 7).
Significant main effects of lambing period were detected for (i) total PUFA, total omega-3 PUFA, DPA, total omega-6 PUFA and LA in both years, (ii) ALA and DHA in year 1 and (iii) EPA in year 2, with concentrations found to be higher in milk fat from late lambed ewes (Table 5, Table 7 and Table 8). In contrast, the omega-6/omega-3 ratio was slightly lower in milk fat from late lambed ewes (Table 7).
Significant main effects of sampling date were detected for total PUFA, total omega-3 PUFA, ALA, EPA, DPA and DHA in both years and total omega-6 PUFA in year 1, with concentrations in milk fat found to be higher in May (Table 5, Table 7 and Table 8). In contrast, the omega-6/omega-3 ratio in milk fat was slightly lower in May, when compared with March (Table 7).
Significant interactions between management system and lambing date were detected for total omega-3 PUFA and ALA in year 2 and omega-6/omega-3 ratio in year 1 (Table 7 and Table 8). Late lambing resulted in higher concentrations of total omega-3 PUFA and ALA in milk fat from SI-managed flocks, while concentrations in milk fat from early and late lambed ewes were similar in EX-managed flocks (Table S7). In contrast, late lambing resulted in a lower omega-6/omega-3 ratio in milk fat from EX-managed flocks, while concentrations in milk fat from early and late lambed ewes were similar in SI-managed flocks (Table S7).
Significant interactions between management system and sampling months were detected for total omega-3 PUFA, ALA and EPA and the omega-3/omega-6 ratio in both years, and total PUFA, LA, DPA and DHA in year 2 only (Table 5, Table 7 and Table 8). When results for total PUFA, and both total and individual omega-3 PUFAs recorded in March were compared, difference between systems were not significant, or significantly higher in milk from EX-managed ewes, while in May, concentrations were significantly higher in milk from EX-managed ewes and differences between systems were greater than those recorded in March (Table S8). In contrast, milk from EX-managed ewes had significantly higher concentration of LA (an omega-6 fatty acid) in March, while LA-concentrations were similar in milk fat from EX and SI-managed ewes in May (Table S8). The omega-6/omega-3 ratio was significantly higher in milk fat from EX-managed ewes in March, but significantly lower in May (Table S8).
Significant interactions between lambing period and sampling date were detected for total PUFA, total omega-3 PUFA, ALA, DPA and total omega-6 PUFA in both years and DHA and LA in year 2 only (Table 5, Table 7 and Table 8). In March, concentrations of all parameters were found to be higher in milk fat from early lambed ewes, and in May, no significant effects of lambing period were detected except for α-linolenic acid, which was found in higher concentrations in milk fat from early lambed ewes (Table S9).

3.3.3. Associations between Environmental/Agronomic Factors, and Milk Yield/Quality

Redundancy analyses were conducted to estimate the relative strength of associations between different environmental, agronomic and management explanatory variables/drivers and milk yield and nutritionally relevant composition parameters (response variables). RDA also allowed the importance of management factors (e.g., milking method) that could not be investigated by ANOVA to be estimated (Figure 6).
In the bi-plot resulting from RDA, shown in Figure 6, axis 1 explains 23.3% of the variation with axis 2 explaining 1.4% (Figure 6). Only the RDA bi-plots for a) milk yield and d) content of major FA, and e) FA groups are presented since explained variation for milk composition, although examined, was minor. Moreover, markers for subclinical mastitis (somatic cell counts and microbial CFU in milk) and gastrointestinal nematode infections (Faecal egg counts) were found to explain none of the additional variation, and thus were excluded.
The strongest drivers identified by RDA were all animal diet-related parameters (i) grazing time on natural pastures (GN, p = 0.002), grazing time on cultivated pastures, p = 0.002), average altitude of grazing pastures (p = 0.002), (ii) supplementary concentrate intake (p = 0.002), conserved forage intake (p = 0.002), average daily temperature, although average daily temperature (p = 0.03) and (f) the average rainfall (p = 0.05) were also identified as significant explanatory parameters (Figure 6). However, milking systems did not explain any additional variation for milk yield and composition parameters (Figure 6).
The RDA bi-plot shows positive associations (along the positive axis 1) between grazing time on natural pastures, altitude of grazing pastures, and to a lesser extent, air temperature and concentrations of nutritionally desirable total MUFA, PUFA, total n-3 PUFA, ALA, DPA, and DHA (Figure 6).
In contrast, there were positive associations (along negative axis 1) between concentrate intake, hay intake and time spend grazing cultivated pastures, and (i) milk yield, (ii) the omega6/omega-3 ratio, and (iii) concentration of nutritionally undesirable total SFA (Figure 6). There were also positive associations (along the positive axis 1) between concentrate intake, rainfall and altitude of grazing and concentrations of total omega-6 PUA and LA (Figure 6).
Results demonstrate that overall milk from EX-systems has a more preferable nutritional composition since it has (i) lower concentrations of nutritionally undesirable SFA and in particular myristic acid (C14:0,) which was linked to a 3–4 times larger negative effect on cardiovascular health than other SFA [68], but (ii) higher concentrations of nutritionally desirable MUFA and omega-3 PUFA, including the long chain (VLC) omega-3 PUFA EPA, DPA, DHA, which have been linked to a range of health benefits. In this context, it is important to consider that European consumers are advised to increase the intake of VLC omega-3 PUFA [69].
There is limited information on the effects of intensification practices on the nutritional quality of milk from small ruminants [16] and the study reported here, for the first time comparing the relative effects of dietary, management and animal health parameters on sheep milk composition. However, the results obtained for omega-3 fatty acid in this study are broadly consistent with recent studies comparing different bovine dairy production systems that showed that low-input/organic production methods result in higher ALA and VLC omega-3 concentrations in milk compared to conventional intensive production systems [69]. In bovine milk production systems, livestock diets were also shown to be the main driver of milk composition, and in particular, fatty acid profiles [69]. Specifically, high grazing based fresh forage intake was shown to improve, while high concentrate, and to a lesser extent, conserved forage intake reduced the nutritional quality of bovine milk fat, which is similar to the trends reported here for dairy sheep production. However, grazing sward composition, the type of concentrate and conserved forage used, cattle breed/crossbreed choice and milking systems (robotic versus standard milking system) were also shown to affect nutritionally relevant bovine milk and composition parameters in bovine milk [13,70,71,72,73]. It will therefore be important to study the effect of these parameters in small ruminant production in the future.
In the study reported here, lambing period was also shown to affect milk composition, and this could have been due to (i) differences in the feeding regimes when samples were taken in March and May, or (ii) the difference in age/stage of lactation between EL and LL ewes when samples were taken. However, the feeding and grazing regimes for EL and LL ewes were similar on both sampling dates (Table S2), and these suggest that differences in animal age and/or stage of lactation were the main reason for the difference in milk composition. This view is supported by the result of Soják, et al. [74], who reported that, in an experimental flock of 328 ewes of different breeds, concentrations of short- and medium-chain SFA and ALA increased from first to third parity and then decreased again in older animals. However, differences in feeding regimes may also have contributed since LL-ewes had a slightly higher concentrate intake in year 2 of the study and farmers tended to graze LL-ewes on higher quality pastures.
Results from the RDA and the contrasting effects of lambing period detected in the two years suggest that the effects of lambing period on milk composition was due to complex interactions of environmental, dietary and animal age and physiology related factors and this should be investigated further in future studies. However, the lower concentrations of myristic and palmitic acid and higher concentrations of linoleic acid and PUFA detected in the milk of the LL yearling ewes suggest that dairy products produced with milk from LL ewes in EX-managed flocks may be marketed as “nutritionally enhanced” or “omega-3 rich” products in the future.

4. Conclusions

The results reported here confirmed that the intensification of Mediterranean dairy sheep production systems has increased milk yield per ewe and provide a more uniform milk composition and that these benefits are linked to the use of (i) cultivated pastures for grazing, (ii) conserved forages and (iii) imported cereal based concentrate supplements into the feeding regimes used for ewes, and (iv) the use of semi-automatic and automatic milking machines.
Our study provides evidence that many of these intensification measures have negative impacts on specific animal health parameters and important nutritional quality parameters of milk. The effects of intensification on the nutritional composition of sheep milk (in particular the lower concentrations of nutritionally desirable omega-3 fatty acids) were similar to those reported for bovine milk production systems
Results therefore confirmed existing European consumer perceptions that milk and dairy products from extensive production deliver “high levels of animal health and welfare” and have higher “nutritional and sensory quality”. Milk from EX-systems may therefore be marketed as being “nutritionally enhanced” or “omega-3 rich” and thereby achieve a price premium. However, this would require the introduction of clearly defined management and quality assurance protocol to guarantee that target nutritional quality levels can be reliably achieved.
Our results also highlighted challenges and the need to use a relative risk-based, production system specific veterinary protocols in Mediterranean sheep production.

Supplementary Materials

The following are available online at https://www.mdpi.com/article/10.3390/su13179706/s1, Figure S1: Farm surveillance questionnaire, Table S1: Average monthly temperature and rainfall during the study, Table S2: Grazing and feeding regimes used in different management systems (production intensity), lambing periods and sampling in the two production seasons/sampling years, Table S3: Interaction means for the effects of management system and sampling month on feeding and grazing regimes, Table S4: Interaction means for the effects of management system and sampling month on animal health parameters and milk compositions, Table S4: Interaction means for the effects of management system and sampling month on animal health parameters and milk compositions, Table S5: Interaction means for the effects of lambing period and sampling month on animal health parameters and milk compositions, Table S6: Interaction means for the effects of management system and lambing period on feeding regimes, animal health parameters and milk composition, Table S7: Interaction means for the effects of management system and lambing period on milk fat composition parameters, Table S8: Interaction means for the effects of management systems and sampling month on milk fat composition parameters, Table S9: Interaction means of the effects of lambing period and sampling months on milk fat composition parameters. Results on Incidence of diseases and health related management parameters, Table S10: Effect of management systems (production intensity), lambing period and sampling years on the proportion of ewes with clinical mastitis, lameness, contagious ecthyma, piroplasmosis, coenurosis on the proportion of ewes with chronic diseases, that became casualties and/or needed to be replaced. Means ± standard errors, Table S11: Effect of management systems (production intensity), lambing period and sampling years on the proportion of ewes with ruminal acidosis, bloat, abortions (up to the 3rd month of pregnancy), diarrhoea, ectoparasites in ewes and death associated with Clostridium infections in ewes. Means ± standard errors, Table S12: Interaction means for the effect of management systems (production intensity) and lambing period on the prevalence of different health conditions in ewes. Means ± standard errors

Author Contributions

Conceptualisation, S.S. (Smaragda Sotiraki), C.L., G.B., and A.S.; methodology, S.S. (Smaragda Sotiraki), C.L., G.B., and A.S.; validation, S.S. (Smaragda Sotiraki), A.S., G.B., and C.L.; formal analysis, N.V., L.R., S.S. (Sokratis Stergiadis), and M.E.; investigation, N.V. and N.T.; resources, S.S. (Smaragda Sotiraki) and A.S.; data curation, N.V.; writing—original draft preparation, N.V., S.S. (Smaragda Sotiraki), A.S., C.L., and S.S. (Sokratis Stergiadis); writing—review and editing, N.V., S.S. (Smaragda Sotiraki), A.S., S.S. (Sokratis Stergiadis), L.R., N.T., G.B., and C.L.; visualization, N.V.; supervision, S.S. (Smaragda Sotiraki), C.L., and G.B.; project administration, C.L.; funding acquisition, S.S. (Smaragda Sotiraki) and C.L. All authors have read and agreed to the published version of the manuscript.

Funding

The authors gratefully acknowledge financial support from the Agro4Crete project funded by the GSRI of Greece (code_nr: 2018SE01300000) and the European Community under the “LowInput-Breeds, FP7, Project No. KBBE 222 632”.

Institutional Review Board Statement

The study was conducted in compliance with the national animal welfare regulations and according to the guidelines of the Declaration of Helsinki. Diagnostic veterinary procedures are not within the context of relevant EU legislation for animal experimentations (Directive 86/609/EC) and may be performed in order to diagnose animal diseases and improve animal welfare. Samples were collected by registered veterinarians and caused no suffering. Samples were collected only after the farmers’ consent had been obtained. The experimental protocol was approved by the responsible institutional ethical committee (VRI Committee for Approval of Experimental protocols as appointed at 26/5/2014, Decision nr 972).

Informed Consent Statement

Not applicable.

Data Availability Statement

Not applicable.

Conflicts of Interest

The authors declare no conflict of interest in carrying out this work, and the founding sponsors had no role in the design of the study; in the collection, analyses, or interpretation of data; in writing the manuscript; or in the decision to publish the results.

References

  1. FAOSTAT Database; Rome, I.F. Production/Livestock Primary/Livestock Processed. In Food and Agriculture Organization of the United Nations (FAO); FAO: Rome, Italy, 2021. [Google Scholar]
  2. Pulina, G.; Milán, M.J.; Lavín, M.P.; Theodoridis, A.; Morin, E.; Capote, J.; Thomas, D.L.; Francesconi, A.H.D.; Caja, G. Current production trends, farm structures, and economics of the dairy sheep and goat sectors. J. Dairy Sci. 2018, 101, 6715–6729. [Google Scholar] [CrossRef] [PubMed] [Green Version]
  3. Zervas, G.; Tsiplakou, E. The effect of feeding systems on the characteristics of products from small ruminants. Small Rumin. Res. 2011, 101, 140–149. [Google Scholar] [CrossRef]
  4. OECD. Dairy and Dairy Products; OECD Publishing: Paris, France, 2016. [Google Scholar]
  5. de Rancourt, M.; Fois, N.; Lavín, M.P.; Tchakérian, E.; Vallerand, F. Mediterranean sheep and goats production: An uncertain future. Small Rumin. Res. 2006, 62, 167–179. [Google Scholar] [CrossRef]
  6. Hadjigeorgiou, I. Past, present and future of pastoralism in Greece. Pastor. Res. Policy Pract. 2011, 1, 24. [Google Scholar] [CrossRef] [Green Version]
  7. Hoste, H.; Torres-Acosta, J.F.J. Non chemical control of helminths in ruminants: Adapting solutions for changing worms in a changing world. Vet. Parasitol. 2011, 180, 144–154. [Google Scholar] [CrossRef] [PubMed]
  8. Contreras, A.; Sierra, D.; Sánchez, A.; Corrales, J.C.; Marco, J.C.; Paape, M.J.; Gonzalo, C. Mastitis in small ruminants. Small Rumin. Res. 2007, 68, 145–153. [Google Scholar] [CrossRef]
  9. Hadjigeorgiou, I.; Zervas, G. Evaluation of production systems in protected areas: Case studies on the Greek “Natura 2000” network. Options Méditerr. 2009, 91, 101–109. [Google Scholar]
  10. Casasús, I.; Rogosić, J.; Rosati, A.; Stoković, I.; Gabiña, D. Animal Farming and Environmental Interactions in the Mediterranean Region; EAAP Scientific Series: Ioannina, Greece, 2012; Volume 131. [Google Scholar]
  11. Volanis, M.; Tzerakis, K. Study of the Sfakia sheep breed. II. Reproductive characteristics of the ewes and growth characteristics of the lambs. Anim. Sci. Rev. 1997, 24, 5–20. [Google Scholar]
  12. Kairis, O.; Karavitis, C.; Salvati, L.; Kounalaki, A.; Kosmas, K. Exploring the Impact of Overgrazing on Soil Erosion and Land Degradation in a Dry Mediterranean Agro-Forest Landscape (Crete, Greece). Arid Land Res. Manag. 2015, 29, 360–374. [Google Scholar] [CrossRef]
  13. Stergiadis, S.; Leifert, C.; Seal, C.J.; Eyre, M.D.; Nielsen, J.H.; Larsen, M.K.; Slots, T.; Steinshamn, H.; Butler, G. Effect of feeding intensity and milking system on nutritionally relevant milk components in dairy farming systems in the North East of England. J. Agric. Food Chem. 2012, 60, 7270–7281. [Google Scholar] [CrossRef]
  14. Stafford, K.; Gregory, N. Implications of intensification of pastoral animal production on animal welfare. N. Z. Vet. J. 2008, 56, 274–280. [Google Scholar] [CrossRef]
  15. Lean, I.; Westwood, C.; Playford, M. Livestock disease threats associated with intensification of pastoral dairy farming. N. Z. Vet. J. 2008, 56, 261–269. [Google Scholar] [CrossRef] [PubMed]
  16. Voutzourakis, N.; Tzanidakis, N.; Stergiadis, S.; Rempelos, L.; Eyre, M.; Atsali, I.; Franceschin, E.; Leifert, C.; Stefanakis, A.; Sotiraki, S.; et al. Sustainable Intensification? Increased Production Diminishes Omega-3 Content of Sheep Milk. Sustainability 2020, 12, 1228. [Google Scholar] [CrossRef] [Green Version]
  17. Martini, M.; Liponi, G.B.; Salari, F. Effect of forage:concentrate ratio on the quality of ewe’s milk, especially on milk fat globules characteristics and fatty acids composition. J. Dairy Res. 2010, 77, 239–244. [Google Scholar] [CrossRef] [PubMed]
  18. Sevi, A.; Taibi, L.; Albenzio, M.; Muscio, A.; Annicchiarico, G. Effect of parity on milk yield, composition, somatic cell count, renneting parameters and bacteria counts of Comisana ewes. Small Rumin. Res. 2000, 37, 99–107. [Google Scholar] [CrossRef]
  19. Pappa, E.C.; Kondyli, E.; Sotirakoglou, K.; Bosnea, L.; Mataragas, M.; Allouche, L.; Tsiplakou, E.; Pappas, A.C. Farmers Profile and Characterization of Sheep and Goat Dairy Chain in Northwestern Greece. Sustainability 2021, 13, 833. [Google Scholar] [CrossRef]
  20. European Food Safety Authority. Food safety aspects of dairy cow housing and husbandry systems. EFSA J. 2009, 1189, 1–27. [Google Scholar]
  21. van Asselt, E.D.; van der Fels-Klerx, H.J.; Marvin, H.J.P.; van Bokhorst-van de Veen, H.; Groot, M.N. Overview of Food Safety Hazards in the European Dairy Supply Chain. Compr. Rev. Food Sci. Food Saf. 2017, 16, 59–75. [Google Scholar] [CrossRef] [PubMed]
  22. Defra. Code of Recommendations for the Welfare of Livestock: Sheep; Affairs, D.f.E.F.R., Ed.; Defra Publications: London, UK, 2013; pp. 1–27. [Google Scholar]
  23. Discontools. Available online: http://www.discontools.eu/ (accessed on 22 April 2017).
  24. Stefanakis, A.; Volanis, M.; Zoiopoulos, P.; Hadjigeorgiou, I. Assessing the potential benefits of technical intervention in evolving the semi-intensive dairy-sheep farms in Crete. Small Rumin. Res. 2007, 72, 66–72. [Google Scholar] [CrossRef]
  25. Sitzia, M.; Ruiz, F. Dairy Farm Management Systems: Sheep. In Reference Module in Food Science; Elsevier: Amsterdam, The Netherlands, 2016. [Google Scholar]
  26. ELSTAT. Holdings and number of animals by kind, region and regional unit. In Livestock Capital and Production; Authority, H.S., Ed.; Hellenic Statistical Authority: Athens, Greece, 2016. [Google Scholar]
  27. Stefanakis, A.; Laboratory of Parasitology, Veterinary Research Institute, Hellenic Agricultural Organization Demeter, Thessaloniki, Greece. Breed Sheep Population on Crete. Geotechnical Chamber of Greece: Heraklion, Crete, Greece. Personal communication, 2016. [Google Scholar]
  28. ELSTAT. Milk production, by Region and Regional Unities, 2019. In Livestock Capital and Production; Authority, H.S., Ed.; Hellenic Statistical Authority: Piraeus, Athens, Greece, 2019. [Google Scholar]
  29. Volanis, M.; Stefanakis, A.; Hadjigeorgiou, I.; Zoiopoulos, P. Supporting the extensive dairy sheep smallholders of the semi-arid region of Crete through technical intervention. Trop. Anim. Health Prod. 2007, 39, 325–334. [Google Scholar] [CrossRef] [PubMed]
  30. Volanis, M.; Kominakis, A.; Rogdakis, E. Genetic analysis of udder score and milk traits in test day records of Sfakia dairy ewes. Arch. Anim. Breed. 2002, 45, 69–77. [Google Scholar] [CrossRef]
  31. Vogiatzakis, I.N.; Pungetti, G.; Mannion, A.M. Mediterranean Island Landscapes, 1st ed.; Springer: Dordrecht, The Netherlands, 2008; p. 369. [Google Scholar]
  32. MAFF. Condition Scoring of Sheep. In Action on Animal Welfare, 2nd ed.; MAFF Publications: London, UK, 1996. [Google Scholar]
  33. Abecia, J.A.; Garcia, A.; Castillo, L.; Riocerezo, C. The effects of weather on milk production in dairy sheep vary by month of lambing & lactation phase. J. Anim. Behav. Biometeorol. 2017, 5, 56–63. [Google Scholar]
  34. Peana, I.; Francesconi, A.H.D.; Dimauro, C.; Cannas, A.; Sitzia, M. Effect of winter and spring meteorological conditions on milk production of grazing dairy sheep in the Mediterranean environment. Small Rumin. Res. 2017, 153, 194–208. [Google Scholar] [CrossRef]
  35. MAFF. Technical Bulletin No. 18, Manual of Veterinary Parasitological Laboratory Techniques; Her Majesty’s Stationery Office: London, UK, 1986. [Google Scholar]
  36. Hendrix, C.M.; Robinson, E.D. Diagnostic Parasitology for Veterinary Technicians, 4th ed.; Mosby: London, UK, 2014. [Google Scholar]
  37. Kiossis, E.; Brozos, C.N.; Petridou, E.; Boscos, C. Program for the control of subclinical mastitis in dairy Chios breed ewes during lactation. Small Rumin. Res. 2007, 73, 194–199. [Google Scholar] [CrossRef]
  38. Butler, G.; Stergiadis, S.; Seal, C.; Eyre, M.; Leifert, C. Fat composition of organic and conventional retail milk in northeast England. J. Dairy Sci. 2011, 94, 24–36. [Google Scholar] [CrossRef] [PubMed]
  39. Pinheiro, J.C.; Bates, D.M. Mixed-Effects Models in S and S-PLUS; Springer: New York, NY, USA, 2000; 528p. [Google Scholar]
  40. Crawley, M.J. The R Book; Wiley: Chichester, England; Hoboken, NJ, USA, 2007; p. viii. 942p. [Google Scholar]
  41. ter Braak, C.J.F.; Smilauer, P. CANOCO Reference Manual and CanoDraw for Windows User’s Guide: Software for Canonical Community Ordination (Version 4.5); Biometris: Wageningen, The Netherlands, 2002. [Google Scholar]
  42. Torres-Acosta, J.F.J.; Hoste, H. Alternative or improved methods to limit gastro-intestinal parasitism in grazing sheep and goats. Small Rumin. Res. 2008, 77, 159–173. [Google Scholar] [CrossRef]
  43. Giadinis, N.D.; Arsenos, G.; Tsakos, P.; Psychas, V.; Dovas, C.I.; Papadopoulos, E.; Karatzias, H.; Fthenakis, G.C. “Milk-drop syndrome of ewes”: Investigation of the causes in dairy sheep in Greece. Small Rumin. Res. 2012, 106, 33–35. [Google Scholar] [CrossRef]
  44. Vasileiou, N.G.C.; Cripps, P.J.; Ioannidi, K.S.; Chatzopoulos, D.C.; Gougoulis, D.A.; Sarrou, S.; Orfanou, D.C.; Politis, A.P.; Gonzalez-Valerio, T.C.; Argyros, S.; et al. Extensive countrywide field investigation of subclinical mastitis in sheep in Greece. J. Dairy Sci. 2018, 101, 7297–7310. [Google Scholar] [CrossRef] [Green Version]
  45. Bergonier, D.; de Cremoux, R.; Rupp, R.; Lagriffoul, G.; Berthelot, X. Mastitis of dairy small ruminants. Vet. Res. 2003, 34, 689–716. [Google Scholar] [CrossRef] [Green Version]
  46. Geurden, T.; Hoste, H.; Jacquiet, P.; Traversa, D.; Sotiraki, S.; Frangipane di Regalbono, A.; Tzanidakis, N.; Kostopoulou, D.; Gaillac, C.; Privat, S.; et al. Anthelmintic resistance and multidrug resistance in sheep gastro-intestinal nematodes in France, Greece and Italy. Vet. Parasitol. 2014, 201, 59–66. [Google Scholar] [CrossRef] [PubMed]
  47. Cringoli, G.; Rinaldi, L.; Veneziano, V.; Mezzino, L.; Vercruysse, J.; Jackson, F. Evaluation of targeted selective treatments in sheep in Italy: Effects on faecal worm egg count and milk production in four case studies. Vet. Parasitol. 2009, 164, 36–43. [Google Scholar] [CrossRef]
  48. Jackson, F.; Coop, R.L. Gastrointestinal Helminthosis. In Diseases of Sheep; Blackwell Publishing Ltd.: Hoboken, NJ, USA, 2008; pp. 185–195. [Google Scholar]
  49. Arsenopoulos, K.V.; Fthenakis, G.C.; Katsarou, E.I.; Papadopoulos, E. Haemonchosis: A Challenging Parasitic Infection of Sheep and Goats. Animals 2021, 11, 363. [Google Scholar] [CrossRef] [PubMed]
  50. Krehbiel, C.R. Invited Review: Applied nutrition of ruminants: Fermentation and digestive physiology1. Prof. Anim. Sci. 2014, 30, 129–139. [Google Scholar] [CrossRef]
  51. Bayne, J.; Edmondson, M. Diseases of the gastrointestinal system. Sheep Goat Cervid Med. 2021, 63–96. [Google Scholar] [CrossRef]
  52. Lewis, C.J. Control of Important Clostridial Diseases of Sheep. Vet. Clin. Food A 2011, 27, 121–126. [Google Scholar] [CrossRef]
  53. Westendarp, H. Effects of tannins in animal nutrition. DTW Dtsch. Tierarztl. Wochenschr. 2006, 113, 264–268. [Google Scholar]
  54. Plant, J.W.; Lewis, C.J. Treatment and Control of Ectoparasites in Sheep. Vet. Clin. N. Am. Food Anim. Pract. 2011, 27, 203–212. [Google Scholar] [CrossRef]
  55. Raadsma, H.W.; Egerton, J.R. A review of footrot in sheep: Aetiology, risk factors and control methods. Livest. Sci. 2013, 156, 106–114. [Google Scholar] [CrossRef]
  56. Brozos, C.; Mavrogianni, V.S.; Fthenakis, G.C. Treatment and control of peri-parturient metabolic diseases: Pregnancy toxemia, hypocalcemia, hypomagnesemia. Vet. Clin. N. Am. Food Anim. Pract. 2011, 27, 105–113. [Google Scholar] [CrossRef]
  57. Carson, A. Focus on ovine abortions. Vet. Rec. 2017, 180, 246–247. [Google Scholar]
  58. Nandi, S.; De, U.K.; Chowdhury, S. Current status of contagious ecthyma or orf disease in goat and sheep—A global perspective. Small Rumin. Res. 2011, 96, 73–82. [Google Scholar] [CrossRef]
  59. Sevi, A.; Albenzio, M.; Marino, R.; Santillo, A.; Muscio, A. Effects of lambing season and stage of lactation on ewe milk quality. Small Rumin. Res. 2004, 51, 251–259. [Google Scholar] [CrossRef]
  60. Nudda, A.; Battacone, G.; Boaventura Neto, O.; Cannas, A.; Francesconi, A.H.D.; Atzori, A.S.; Pulina, G. Feeding strategies to design the fatty acid profile of sheep milk and cheese. R. Bras. Zootec 2014, 43, 445–456. [Google Scholar] [CrossRef] [Green Version]
  61. Astrup, A.; Bradley, B.H.R.; Brenna, J.T.; Delplanque, B.; Ferry, M.; Torres-Gonzalez, M. Regular-Fat Dairy and Human Health: A Synopsis of Symposia Presented in Europe and North America (2014–2015). Nutrients 2016, 8, 464. [Google Scholar] [CrossRef] [PubMed] [Green Version]
  62. Sofi, F.; Cesari, F.; Abbate, R.; Gensini, G.F.; Casini, A. Adherence to Mediterranean diet and health status: Meta-analysis. BMJ 2008, 337, a1344. [Google Scholar] [CrossRef] [PubMed] [Green Version]
  63. Hibbeln, J.R.; Nieminen, L.R.; Blasbalg, T.L.; Riggs, J.A.; Lands, W.E. Healthy intakes of n-3 and n-6 fatty acids: Estimations considering worldwide diversity. Am. J. Clin. Nutr. 2006, 83 (Suppl. 6), 1483s–1493s. [Google Scholar] [CrossRef]
  64. Dietary Guidelines Advisory Committee. Scientific Report of the 2015 Dietary Guidelines Advisory Committee: Advisory Report to the Secretary of Health and Human Services and the Secretary of Agriculture; U.S. Department of Agriculture, Ed.; Dietary Guidelines Advisory Committee: Washington, DC, USA, 2015.
  65. Shahidi, F.; Ambigaipalan, P. Omega-3 Polyunsaturated Fatty Acids and Their Health Benefits. Annu. Rev. Food Sci. Technol. 2018, 9, 345–381. [Google Scholar] [CrossRef]
  66. Harris, W.S.; Klurfeld, D.M. Twentieth-century trends in essential fatty acid intakes and the predicted omega-3 index: Evidence versus estimates. Am. J. Clin. Nutr. 2011, 93, 907–908. [Google Scholar] [CrossRef] [PubMed] [Green Version]
  67. Simopoulos, A.P. An Increase in the Omega-6/Omega-3 Fatty Acid Ratio Increases the Risk for Obesity. Nutrients 2016, 8, 128. [Google Scholar] [CrossRef] [Green Version]
  68. Lichtenstein, A.H.; Appel, L.J.; Brands, M.; Carnethon, M.; Daniels, S.; Franch, H.A.; Franklin, B.; Kris-Etherton, P.; Harris, W.S.; Howard, B.; et al. Diet and lifestyle recommendations revision 2006: A scientific statement from the American Heart Association Nutrition Committee. Circulation 2006, 114, 82–96. [Google Scholar] [CrossRef] [PubMed] [Green Version]
  69. Średnicka-Tober, D.; Barański, M.; Seal, C.J. Higher PUFA and n-3 PUFA, conjugated linoleic acid, α-tocopherol and iron, but lower iodine and selenium concentrations in organic milk: A systematic literature review and meta- and redundancy analyses. Br. J. Nutr. 2016, 115, 1043–1060. [Google Scholar] [CrossRef] [Green Version]
  70. Stergiadis, S.; Bieber, A.; Chatzidimitriou, E.; Franceschin, E.; Isensee, A.; Rempelos, L.; Baranski, M.; Maurer, V.; Cozzi, G.; Bapst, B.; et al. Impact of US Brown Swiss genetics on milk quality from low-input herds in Switzerland: Interactions with season. Food Chem. 2018, 251, 93–102. [Google Scholar] [CrossRef] [PubMed] [Green Version]
  71. Butler, G.; Nielsen, J.H.; Slots, T.; Seal, C.; Eyre, M.D.; Sanderson, R.; Leifert, C. Fatty acid and fat-soluble antioxidant concentrations in milk from high- and low-input conventional and organic systems: Seasonal variation. J. Sci. Food Agric. 2008, 88, 1431–1441. [Google Scholar] [CrossRef]
  72. Butler, G.; Stergiadis, S.; Chatzidimitriou, E.; Franceschin, E.; Davis, H.R.; Leifert, C.; Steinshamn, H. Differing responses in milk composition from introducing rapeseed and naked oats to conventional and organic dairy diets. Sci. Rep. 2019, 9, 8115. [Google Scholar] [CrossRef] [PubMed]
  73. Davis, H.; Chatzidimitriou, E.; Leifert, C.; Butler, G. Evidence That Forage-Fed Cows Can Enhance Milk Quality. Sustainability 2020, 12, 3688. [Google Scholar] [CrossRef]
  74. Soják, L.; Blaško, J.; Kubinec, R.; Górová, R.; Addová, G.; Ostrovský, I.; Margetín, M. Variation among individuals, breeds, parities and milk fatty acid profile and milk yield of ewes grazed on pasture. Small Rumin. Res. 2013, 109, 173–181. [Google Scholar] [CrossRef]
Figure 1. Sheep distribution in Mediterranean countries and Crete in 2010 (1:75,000 resolution; data source: FAO GeoNetwork http://www.fao.org/geonetwork/srv/en/main.home accessed 28 June 2021). Source: [21], yellow dots pinpoint the areas where the farms in this study were located.
Sustainability 13 09706 g001
Figure 2. Experimental design of the study.
Sustainability 13 09706 g002
Figure 3. Feeding/grazing regimes used by the two different management systems (means are from ten flocks per systems collected in two consecutive years). The semi-intensive management system is represented by black diamonds (■) and extensive management system by white diamonds (◊). J, January; F, February; Mr, March; Ap, April; Ma, May; Jn, June; Jl, July; Ag, August; S, September; O, October; N, November; D, December. Means for the same management system in different sampling months labelled with the same capital letters and means for the two management systems in the same sampling month labelled with the same lowercase letters are not significantly different according to Tukey’s contrast (p < 0.05).
Sustainability 13 09706 g003
Figure 4. Interaction means for Body Condition Score (BCS) for different management systems and sampling season. Semi-intensive management system is represented by (♦) and extensive management system by (■). J, January; F, February; Mr, March; Ap, April; Ma, May; Jn, June; Jl, July; Ag, August; S, September; O, October; N, November; D, December. Values with different capitalized letters represent statistically significant differences between the two management systems (p value < 0.05). Values with different lowercase letters represent statistically significant differences between months within the same system (p value < 0.05).
Sustainability 13 09706 g004
Figure 5. Bi-plot derived from redundancy analyses showing the relationship between the prevalence of diseases the average bacterial load of milk (CFU), the average somatic cell counts in milk and the average number of faecal egg counts (FEC) of gastrointestinal nematodes.
Sustainability 13 09706 g005
Figure 6. Bi-plot derived from redundancy analyses showing the relationship between milk yield, the content of fatty acid groups in milk fat, the omega-6 to omega-3 ratio, the content of major fatty acids in milk fat and agronomic and environmental parameters.
Sustainability 13 09706 g006
Table 1. Effect of management systems (production intensity), sampling season and lambing period on somatic cell counts (SCC) and colony forming units (CFU) in milk. Means ± standard error.
Somatic Cell Counts (SCC)
(×103/100 mL−1 Milk)
Colony Forming Units (CFU)
(×103/100 mL−1 Milk)
FactorYear 1
(n = 400)
Year 2
(n = 400)
Year 1
(n = 400)
Year 2
(n = 400)
management system
semi-intensive182 ± 5162 ± 615.5 ± 1.014.1 ± 1.1
extensive138 ± 4191 ± 612.6 ± 1.015.8 ± 1.0
lambing period
early209 ± 6214 ± 615.1 ± 1.015.1 ± 1.0
late123 ± 4145 ± 412.9 ± 1.014.5 ± 1.1
sampling months
March135 ± 6 b140 ± 5 b13.8 ± 1.020.0 ± 1.3 a
April148 ± 4 b145 ± 4 b12.3 ± 1.015.8 ± 1.0 b
May151 ± 7 b135 ± 2 b13.8 ± 1.111.0 ± 1.0 c
June186 ± 4 a309 ± 6 a14.8 ± 1.113.8 ± 1.1 bc
ANOVA (p values)
Main effects
management systems (MS)*******NS
lambing period (LP)*********NS
sampling season (SS)*****T**
Interactions
MS × SS***1*1T*1
MS × LPNSNSNSNS
LP × SSNS**2NS***2
MS × LP × SSNSNSNSNS
Means differ significantly at ***, p < 0.001; **, p < 0.01; *, p < 0.05; T, trend (0.1 > p > 0.05); NS, not significant. Means labelled with the same lower-case letters in the same column are not significantly different according to Tukey’s honest significant difference test (p < 0.05). 1, see Table S4 for interaction means ± SE; 2, see Table S5 for interaction means ± SE.
Table 2. Effect of management systems (production intensity) and lambing period) and sampling years on the prevalence of subclinical mastitis (SCC > 500,000) and mastitis related pathogens. Means ± standard errors.
% of Samples from Ewes with Subclinical Mastitis that Tested Positive for
Factor% of Ewes
with Subclinical Mastitis 1
GRAM
Positive Pathogens 2
GRAM
Negative
Pathogen 3
GRAM
Positive and
Negative
Pathogens
Non-
Pathogenic
Micro-
Organisms
management system
semi-intensive (n = 400)30 ± 339 ± 513 ± 25 ± 142 ± 4
extensive (n = 400)31 ± 346 ± 511 ± 24 ± 138 ± 4
lambing period
early (n = 400)39 ± 343 ± 413 ± 25 ± 139 ± 3
late (n = 400)22 ± 242 ± 512 ± 25 ± 141 ± 5
production year
year 1 (n = 400)31 ± 361 ± 44 ± 11 ± 134 ± 4
year 2 (n = 400)30 ± 223 ± 322 ± 28 ± 146 ± 4
ANOVA (p values)
Main effects
management systems (MS)NSNSNSNSNS
lambing period (LP)*********NS***
production year (Y)NS*********T
Interactions NS
MS × LPNSNSNSNSNS
MS × Y*TNSNSNS
LP × YNST*NSNS
MS × LP × YNSNSNS*NS
1, proportion of ewes with SCC > 500,000; 2, coagulase negative and positive Staphylococcus spp., Corynebacterium spp. and Streptococcus spp.; 3, Escherichia coli, Klebsiella spp., Serratia spp. and Pseudomonas spp. ***, p < 0.001; *, p < 0.05; T, trend (0.1 > p > 0.05); NS, not significant.
Table 3. Effect of management systems (production intensity), sampling season and lambing period on milk yield and fat content in milk. Values shown are main effect means ± standard error.
Milk Yield
(l day−1 ewe−1)
Fat Content
(g 100 mL−1 Milk)
FactorYear 1
(n = 400)
Year 2
(n = 400)
Year 1
(n = 400)
Year 2
(n = 400)
management system
semi-intensive0.89 ± 0.010.67 ± 0.015.51 ± 0.045.22 ± 0.06
extensive0.58 ± 0.010.44 ± 0.015.97 ± 0.055.58 ± 0.06
lambing period
Early0.65 ± 0.010.50 ± 0.016.03 ± 0.046.57 ± 0.06
Late0.82 ± 0.020.62 ± 0.015.45 ± 0.055.20 ± 0.06
sampling months
March0.87 ± 0.02 a0.80 ± 0.02 a5.58 ± 0.08 b4.80 ± 0.08 b
April0.77 ± 0.02 b0.66 ± 0.02 b5.92 ± 0.07 a4.85 ± 0.08 b
May0.72 ± 0.02 b0.48 ± 0.01 c5.47 ± 0.07 b4.80 ± 0.09 b
June0.66 ± 0.03 c0.41 ± 0.01 d5.85 ± 0.08 a6.12 ± 0.08 a
ANOVA (p values)
Main effects
management systems (MS)************
lambing period (LP)************
sampling season (SS)************
Interactions
MS × SS***1*1***1***1
MS × LPNST***T
LP × SS***2***2***2***2
MS × LP × SSTNS**NS
Means differ significantly at ***, p < 0.001; **, p < 0.01; *, p < 0.05; T, trend (0.1> p > 0.05); NS, not significant. Means labelled with the same lower-case letters in the same column are not significantly different according to Tukey’s honest significant difference test (p < 0.05). 1 see Table S4 for interaction means ± SE; 2 see Table S5 for interaction means ± SE.
Table 4. Effect of management systems (production intensity), sampling season and lambing period on milk protein, lactose and non-fat solids in milk. Values shown are main effect means ± standard error.
Protein Content
(g 100 mL−1 milk)
Lactose Content
(g 100 mL−1 milk)
Non-Fat Solids Content
(g 100 mL−1 milk)
FactorYear 1
(n = 400)
Year 2
(n = 400)
Year 1
(n = 400)
Year 2
(n = 400)
Year 1
(n = 400)
Year 2
(n = 400)
management system
semi-intensive5.14 ± 0.025.25 ± 0.024.70 ± 0.024.53 ± 0.0310.60 ± 0.0310.62 ± 0.03
extensive5.18 ± 0.035.49 ± 0.034.52 ± 0.034.44 ± 0.0310.43 ± 0.0310.76 ± 0.04
lambing period
Early5.36 ± 0.025.49 ± 0.034.40 ± 0.034.25 ± 0.0310.49 ± 0.0310.61 ± 0.05
Late4.97 ± 0.025.23 ± 0.034.81 ± 0.024.71 ± 0.0310.54 ± 0.0210.76 ± 0.03
sampling months
March5.02 ± 0.03 c5.38 ± 0.044.93 ± 0.03 a4.90 ± 0.0310.67 ± 0.0311.04 ± 0.04 a
April5.16 ± 0.03 b5.40 ± 0.034.80 ± 0.03 b4.70 ± 0.0310.66 ± 0.0410.95 ± 0.04 a
May5.23 ± 0.04 a5.29 ± 0.034.67 ± 0.04 c4.55 ± 0.0410.62 ± 0.0510.72 ± 0.05 b
June5.20 ± 0.04 a5.17 ± 0.044.31 ± 0.05 d4.32 ± 0.0510.29 ± 0.0610.34 ± 0.06 c
ANOVA (p values)
Main effects
management systems (MS)NS************
lambing period (LP)************T***
sampling season (SS)***T******NS***
Interactions
MS × SS***1***1***1***1NS***1
MS × LPNSNSNS***2NS***2
LP × SS***3***3NSNS***3***3
MS × LP × SSNsNS*NSNSNS
Means differ significantly at ***, p < 0.001; **, p < 0.01; *, p < 0.05; T, trend (0.1 > p > 0.05); NS, not significant. Means labelled with the same lower-case letters in the same column are not significantly different according to Tukey’s honest significant difference test (p< 0.05). 1 see Table S4 for interaction means ± SE; 2 see Table S6 for interaction means ± SE; 3 see Table S5. for interaction means ± SE.
Table 5. SI, semi-intensive; EX, extensive; 1, see Table S7 for interaction means ±SE; 2, see Table S8 for interaction means ±SE; 3, see Table S9 for interaction means ±SE;
Total
Saturated
Fatty Acids (SFA)
Oleic Acid
(C18:1 cis9)
Total Monounsaturated
Fatty Acids (MUFA)
Total
Polyunsaturated
Fatty Acids (PUFA)
FactorYear 1Year 2Year 1Year 2Year 1Year 2Year 1Year 2
management system (MS)
SI (n = 200)69.0 ± 0.366.1 ± 0.216.4 ± 0.218.8 ± 0.224.3 ± 0.227.2 ± 0.26.8 ± 0.16.8 ± 0.1
EX (n = 200)66.0 ± 0.363.6 ± 0.319.1 ± 0.219.7 ± 0.227.0 ± 0.228.6 ± 0.27.0 ± 0.17.9 ± 0.1
lambing period (LP)
early (n = 200)68.5 ± 0.365.0 ± 0.317.4 ± 0.219.6 ± 0.224.9 ± 0.227.9 ± 0.26.6 ± 0.17.1 ± 0.1
late (n = 200)66.6 ± 0.364.6 ± 0.218.1 ± 0.218.9 ± 0.226.3 ± 0.227.9 ± 0.27.2 ± 0.17.5 ± 0.1
Sampling month (M)
March (n = 200)69.2 ± 0.366.4 ± 0.216.9 ± 0.217.7 ± 0.224.3 ± 0.226.5 ± 0.26.5 ± 0.17.1 ± 0.1
May (n = 200)65.8 ± 0.363.2 ± 0.218.6 ± 0.220.9 ± 0.226.9 ± 0.229.3 ± 0.27.3 ± 0.17.5 ± 0.1
ANOVA
(p values)
Main effects
MS**********************
LP***NS*******NS******
M***********************
Interactions
MS × LPNSNSNSNSNSNSNSNS
MS × MNSNS**2*2NS*2NS***2
LP × M**3***3**3NS***3T***3***3
MS × LP × MNSNSNSTNSNSNSNS
SI, semi-intensive; EX, extensive. 1 see Table S4 for interaction means ± SE; 3 see Table S5 for interaction means ± SE.
Table 6. Effect of management systems (production intensity) and lambing period and sampling years on concentrations of selected individual saturated fatty acids (SFA). Fatty acid concentrations are expressed in g 100 g−1 of total fatty acids; values shown are main effect means ± standard errors.
Lauric Acid (C12:0)Myristic Acid (C14:0)Palmitic Acid (C16:0)Stearic Acid (C18:0)
FactorYear 1Year 2Year 1Year 2Year 1Year 2Year 1Year 2
management system (MS)
SI (n = 200)5.8 ± 0.14.4 ± 0.113.0 ± 0.111.9 ± 0.126.2 ± 0.226.0 ± 0.16.7 ± 0.19.0 ± 0.1
EX (n = 200)4.3 ± 0.13.7 ± 0.111.3 ± 0.110.7 ± 0.126.0 ± 0.226.0 ± 0.18.7 ± 0.29.2 ± 0.1
lambing period (LP)
early (n = 200)5.2 ± 0.14.1 ± 0.112.8 ± 0.111.7 ± 0.126.7 ± 0.226.2 ± 0.17.4 ± 0.19.2 ± 0.1
late (n = 200)4.9 ± 0.14.0 ± 0.111.5 ± 0.111.0 ± 0.125.5 ± 0.225.8 ± 0.18.0 ± 0.28.0 ± 0.1
Sampling month (M)
March (n = 200)5.5 ± 0.14.8 ± 0.112.0 ± 0.111.7± 0.125.7 ± 0.225.7 ± 0.17.1 ± 0.28.0 ± 0.1
May (n = 200)4.6 ± 0.13.3 ± 0.112.3 ± 0.111.0 ± 0.126.5 ± 0.226.3 ± 0.18.3 ± 0.110.2 ± 0.1
ANOVA
(p values)
Main effects
MS************NSNS***NS
LP**NS*************NS
M*********************
Interactions
MS × LPNSTNSNSNSNSNSNS
MS × MNSNS*2TNS*2NS**2
LP × M*3NS***3***3*3TNSNS
MS × LP × MNSNSNSNSNSNSNSNS
SI, semi-intensive; EX, extensive. 1 see Table S7 for interaction means ± SE; 2 see Table S8 for interaction means ± SE 3 see Table S9 for interaction means ± SE.
Table 7. SI, semi-intensive; EX, extensive; 1, see Table S7 for interaction means ±SE; 2, see Table S8 for interaction means ±SE; 3, see Table S9 for interaction means ±SE;
Linoleic Acid
(LA; C18:2 cis9 cis12)
Total
Omega-6 PUFA
Total
Omega-3 PUFA
Omega-6/Omega-3
Ratio
FactorYear 1Year 2Year 1Year 2Year 1Year 2Year 1Year 2
management system (MS)
SI (n = 200)29.5 ± 0.525.7 ± 0.338.5 ± 0.634.8 ± 0.412.0 ± 0.0213.8 ± 0.33.6 ± 0.12.8 ± 0.1
EX (n = 200)29.5 ± 0.428.5 ± 0.138.2 ± 0.538.8 ± 0.414.2 ± 0.0419.4 ± 0.53.4 ± 0.12.7 ± 0.1
lambing period (LP)
early (n = 200)27.9 ± 0.526.5 ± 0.436.6 ± 0.536.2 ± 0.412.3 ± 0.0316.1 ± 0.43.7 ± 0.12.8 ± 0.1
late (n = 200)31.1 ± 0.527.6 ± 0.340.1 ± 0.537.4 ± 0.413.9 ± 0.0317.0 ± 0.43.4 ± 0.12.7 ± 0.1
Sampling month (M)
March (n = 200)29.0 ± 0.527.4 ± 0.436.7 ± 0.536.9 ± 0.511.3 ± 0.0214.5 ± 0.33.8 ± 0.13.1 ± 0.1
May (n = 200)30.0 ± 0.426.7 ± 0.340.0 ± 0.536.7 ± 0.315.0 ± 0.0418.7 ± 0.43.2 ± 0.12.4 ± 0.1
ANOVA
(p values)
Main effects
MSNS***NS**********NS
LP***************NS
MNSNS**NS**********
Interactions
MS × LPNSNSNSNSNS**1***1NS
MS × MNS***2NSNS***2***2***2***2
LP × MT***3*3***3**3***3*3NS
MS × LP × MNSTNSNS**NS***
SI, semi-intensive; EX, extensive. 1 see Table S4 for interaction means ± SE; 3 see Table S5 for interaction means ± SE.
Table 8. SI, semi-intensive; EX, extensive; 1, see Table S7 for interaction means ±SE; 2, see Table S8 for interaction means ±SE; 3, see Table S9 for interaction means ±SE;
α-Linolenic Acid (ALA; C18:3 cis 9.cis 12.cis 15)Eicosapentaenoic Acid
(EPA; C20:5 n-3)
Docosapentaenoic Acid (DPA; C22:5 n-3)Docosahexaenoic Acid (DHA; C22:6 n-3)
FactorYear 1Year 2Year 1Year 2Year 1Year 2Year 1Year 2
management system (MS)
SI (n = 200)5.7 ± 0.17.3 ± 0.10.54 ± 0.020.49 ± 0.011.26 ± 0.031.09 ± 0.020.44 ± 0.020.31 ± 0.01
EX (n = 200)8.0 ± 0.211.5 ± 0.30.69 ± 0.030.65 ± 0.011.29 ± 0.041.43 ± 0.030.49 ± 0.020.42 ± 0.01
lambing period (LP)
early (n = 200)6.5 ± 0.29.3 ± 0.30.59 ± 0.020.55 ± 0.011.20 ± 0.041.22 ± 0.030.43 ± 0.010.36 ± 0.01
late (n = 200)7.2 ± 0.29.5 ± 0.20.64 ± 0.020.59 ± 0.011.35 ± 0.041.29 ± 0.030.51 ± 0.020.37 ± 0.01
Sampling month (M)
March (n = 200)5.8 ± 0.17.6 ± 0.20.48 ± 0.010.51 ± 0.010.90 ± 0.021.05 ± 0.020.38 ± 0.010.31 ± 0.01
May (n = 200)7.9 ± 0.211.3 ± 0.30.75 ± 0.030.63 ± 0.011.66 ± 0.041.47 ± 0.030.56 ± 0.020.43 ± 0.01
ANOVA
(p values)
Main effects
MS************NS*******
LP**NSNS********NS
M************************
Interactions
MS × LPNS***1NSNSNSNSNSNS
MS × M***2***2**2***2NS***2NS***2
LP × M***3***3NSNS*3***3NS***3
MS × LP × MNSNSNSNSNSNSNST
SI, semi-intensive; EX, extensive. 1 see Table S4 for interaction means ± SE; 3 see Table S5 for interaction means ± SE.
Publisher’s Note: MDPI stays neutral with regard to jurisdictional claims in published maps and institutional affiliations.

