1. Introduction
Bangladesh is a low-lying coastal country which experiences monsoon inundations almost every year. Such seasonal inundation is useful for the people of Bangladesh due to its potentiality of bumper rice production and local fish migration. One of the most vulnerable areas of Bangladesh in terms of water-related hazards is the southwestern part, which has a long history of suffering from prolonged and extensive hydro-meteorological events such as flood, waterlogging, cyclone, saline water intrusion, and storm surge [
1]. The climate complexity in the southwestern part of Bangladesh (SWB) began with the introduction of construction of ‘polder’—an enclosure system through dikes, developed by Dutch experts, around the entire coastal region with a view to protecting the subdivisions from seasonal saline water intrusion, safeguarding tidal-surge from cyclones, and increasing of rice production during monsoon season under the Flood Control Drainage (FCD) project in 1964. The project adapted a twenty-year water master plan to employ fifty-eight large-scale Flood Control Drainage and Irrigation (FCDI) projects. Lengthening the monsoon surface water inside the polders is the immediate impact of the FCD project. However, several secondary impacts from FCDI projects were reported; (1). Increased siltation in
beels (beel is a lake-like wetland with static water around Ganges-Brahmaputra flood plains, monsoon rainfall and the level of water at beels are positively related), canals, and local rivers, (2). Prolonged seasonal water and waterlogging in the upper reaches, (3). Expanded salinity area, (4). Reduced agricultural land, and 5. Shortened fuel, fodder, and pure drinking water which amplified ‘tensions’ and ‘conflicts’ within the communities [
2,
3,
4,
5].
Natural disasters played a crucial role in land cover change in SWB over the years. Ahmed and Akter noted the cyclone in 2009 had played an active role for huge inundation that needed several years to recover surface water to prepare cultivable land, which led to increased fish farming in Satkhira. Such natural disasters might be responsible for existing permanent water around SWB [
6]. In contrast, the same cyclone also contributed to a decline of aquaculture practices in different coastal districts such as Khulna [
7]. Decadal exposure to cyclones, flooding, and storm surges affected land use and land cover (LULC) in SWB and people utilized the change created from the natural disasters in a positive adaptation–aquaculture, which offers nutritional and economic sufficiency in Bangladesh. However, several studies found severe ecological impacts and socio-economic conflicts in relation to such adaptations. Islam et al. found enormous socio-economic and environmental disruption due to shrimp cultivation in the country [
8]. Hossain et al. found the benefit of shrimp cultivation does not outweigh its environmental and social impact in Bangladesh. They also concluded that shrimp cultivation is actively reducing agricultural land, and it contributes to gradually increasing siltation around SWB [
9]. Akber et al. estimated a total loss of
$1.41 billion due to the decrease of agricultural land from 1980 to 2016 in SWB. They concluded aquaculture activity, especially shrimp farms in coastal areas, did not help develop ecosystem service positively [
10].
Detection of LULC is the dominant subject of spatiotemporal remote sensing research around SWB. The studies often measure the decadal percentage change of important land covers such as agriculture, bare-land, water, inundation, vegetation, human settlement, fish culture, and so on. Rahman and Begum indicated a sharp conversion of fallow land (‘cultivable and uncultivable land’) into waterbodies especially from 1989 to 2002 and an increase of 14% homestead area from 1980 to 2009 in SWB based on January and February Landsat observations. They mentioned the land cover changes were very useful for the local economy [
11]. In contrast, Johnson et al. denied such land use change as an effective adjustment especially for the marginalized areas of the entire coastal region [
12]. Khan et al. found a 30% increase of shrimp culture and 48% decrease of agricultural land during 1999–2012, owing to enormous human activity and natural disasters at coastal areas of Bangladesh [
13]. Based on Landsat images of March, Rahman et al. stated that bare-land decreased by 21% and shrimp farms increased by 25% during 1989–2015 in SWB [
14] and Islam et al. found a forty-three-fold increase of waterlogging areas between 1973 and 2015 at sub-districts in Satkhira based on Landsat images from January to February [
15]. Tareq et al. noted a 69% reduction of bare-land and a 62% increase of water bodies during 1989–2000 at SWB based on Landsat images between November and December [
16]. Mukhopadhyay et al. found a significant replacing trend of agricultural land into aquaculture in the coastal areas of Bangladesh because of its monetary benefits, based on Landsat image of January during 1989–2010 [
17]. A similar trend was explored by Barai et al. between 1988 and 2017 based on Landsat images between February and March, and they identified a more than two-fold increase of water bodies during that period in SWB [
18]. It seems a general land cover change has been taking place in SWB since the 1970s, such as rapid decline of bare-land, agricultural land, and intensification of surface water or aquaculture. In contrast, several studies identified an increase of agricultural land and decrease of shrimp farms in SWB as well. Abdullah et al. observed an increase of agricultural land, built-up, and river by 5.4%, 4.9%, and 4.5% respectively during 1990–2017 based on the dry season’s Landsat images. However, the vegetation land shrank over several years—1996, 1997, 1998, 2004, and 2007—due to the natural disasters such as flood, cyclone, and storm surge [
19]. In addition, Karim et al. identified a declining trend of shrimp cultivation in SWB based on Landsat images of December and January [
7].
Surface water plays a critical role for conventional fish, livestock, and crop production in SWB. It also affects groundwater, soil quality, and local ecology. Human-ecosystem interrelations are inevitable in SWB because the economy is dominantly agrarian. However, recent human interventions enormously changed the land use system around the southwestern coastal areas of Bangladesh between 1984 and 2015—e.g., from seasonal wet and muddy rice fields to permanent fish farms [
20]. Such estimation of surface water adjacent to coastal ‘regions and subregions’ through elucidation of satellite images with sufficient ground validation might be influential for future planning, development, and policymaking on water resources where in situ information is scarce [
21,
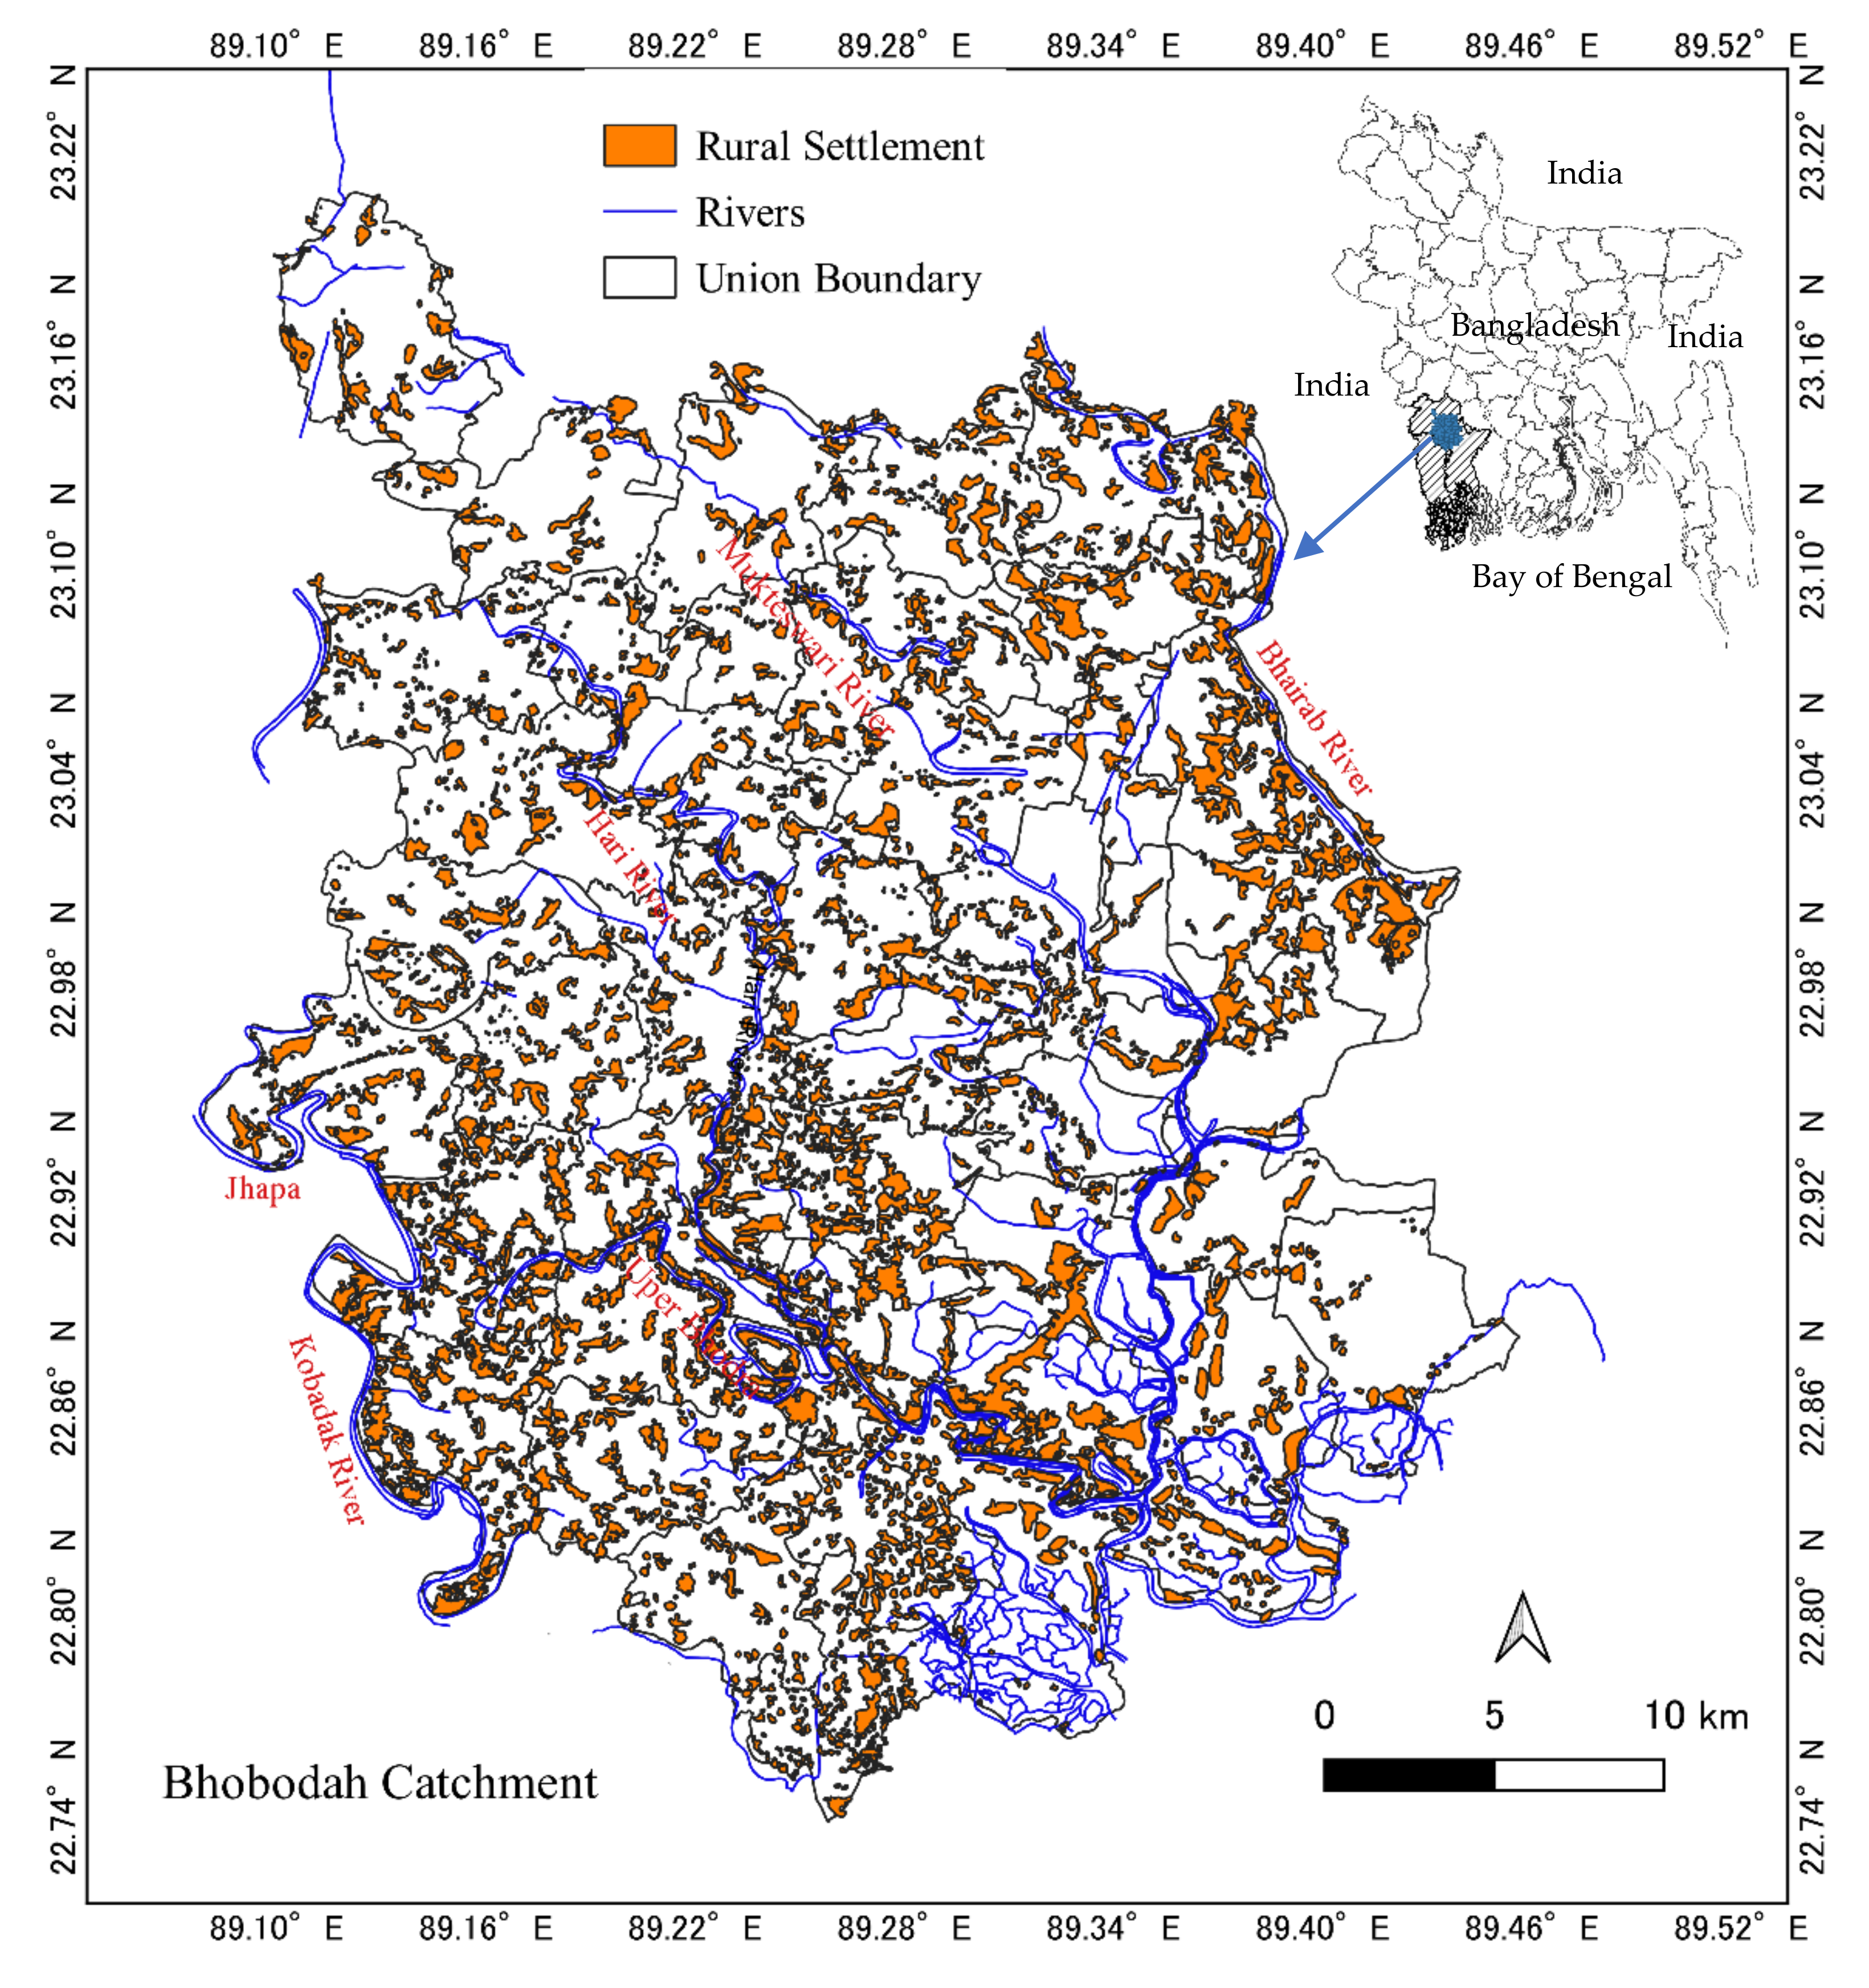
22]. Landsat archival remote sensing data which are free to access have already been considered as a good dataset to produce acceptable results. Therefore, this study uses entire Landsat collection-1 images and focuses on subregions of the southwestern part to estimate long-term surface water because it is considered as one of the most crucial land class patterns for a low-lying coastal country like Bangladesh [
23], and for the others as well [
24]. The target subregions are located on the upper reaches of the FCDI project area, around 150 km from the Bay of Bengal, spreading around 1167 km
2. According to population census-2011 of Bangladesh Bureau of Statistics (BBS), the population density of the target location is around 1025/km
2, which is higher than the country average [
25]. The explanation of choosing the upper reaches as the study area of the present study is described in the last paragraph of this section, and the detailed geographical location of the target area is presented in
Figure 1.
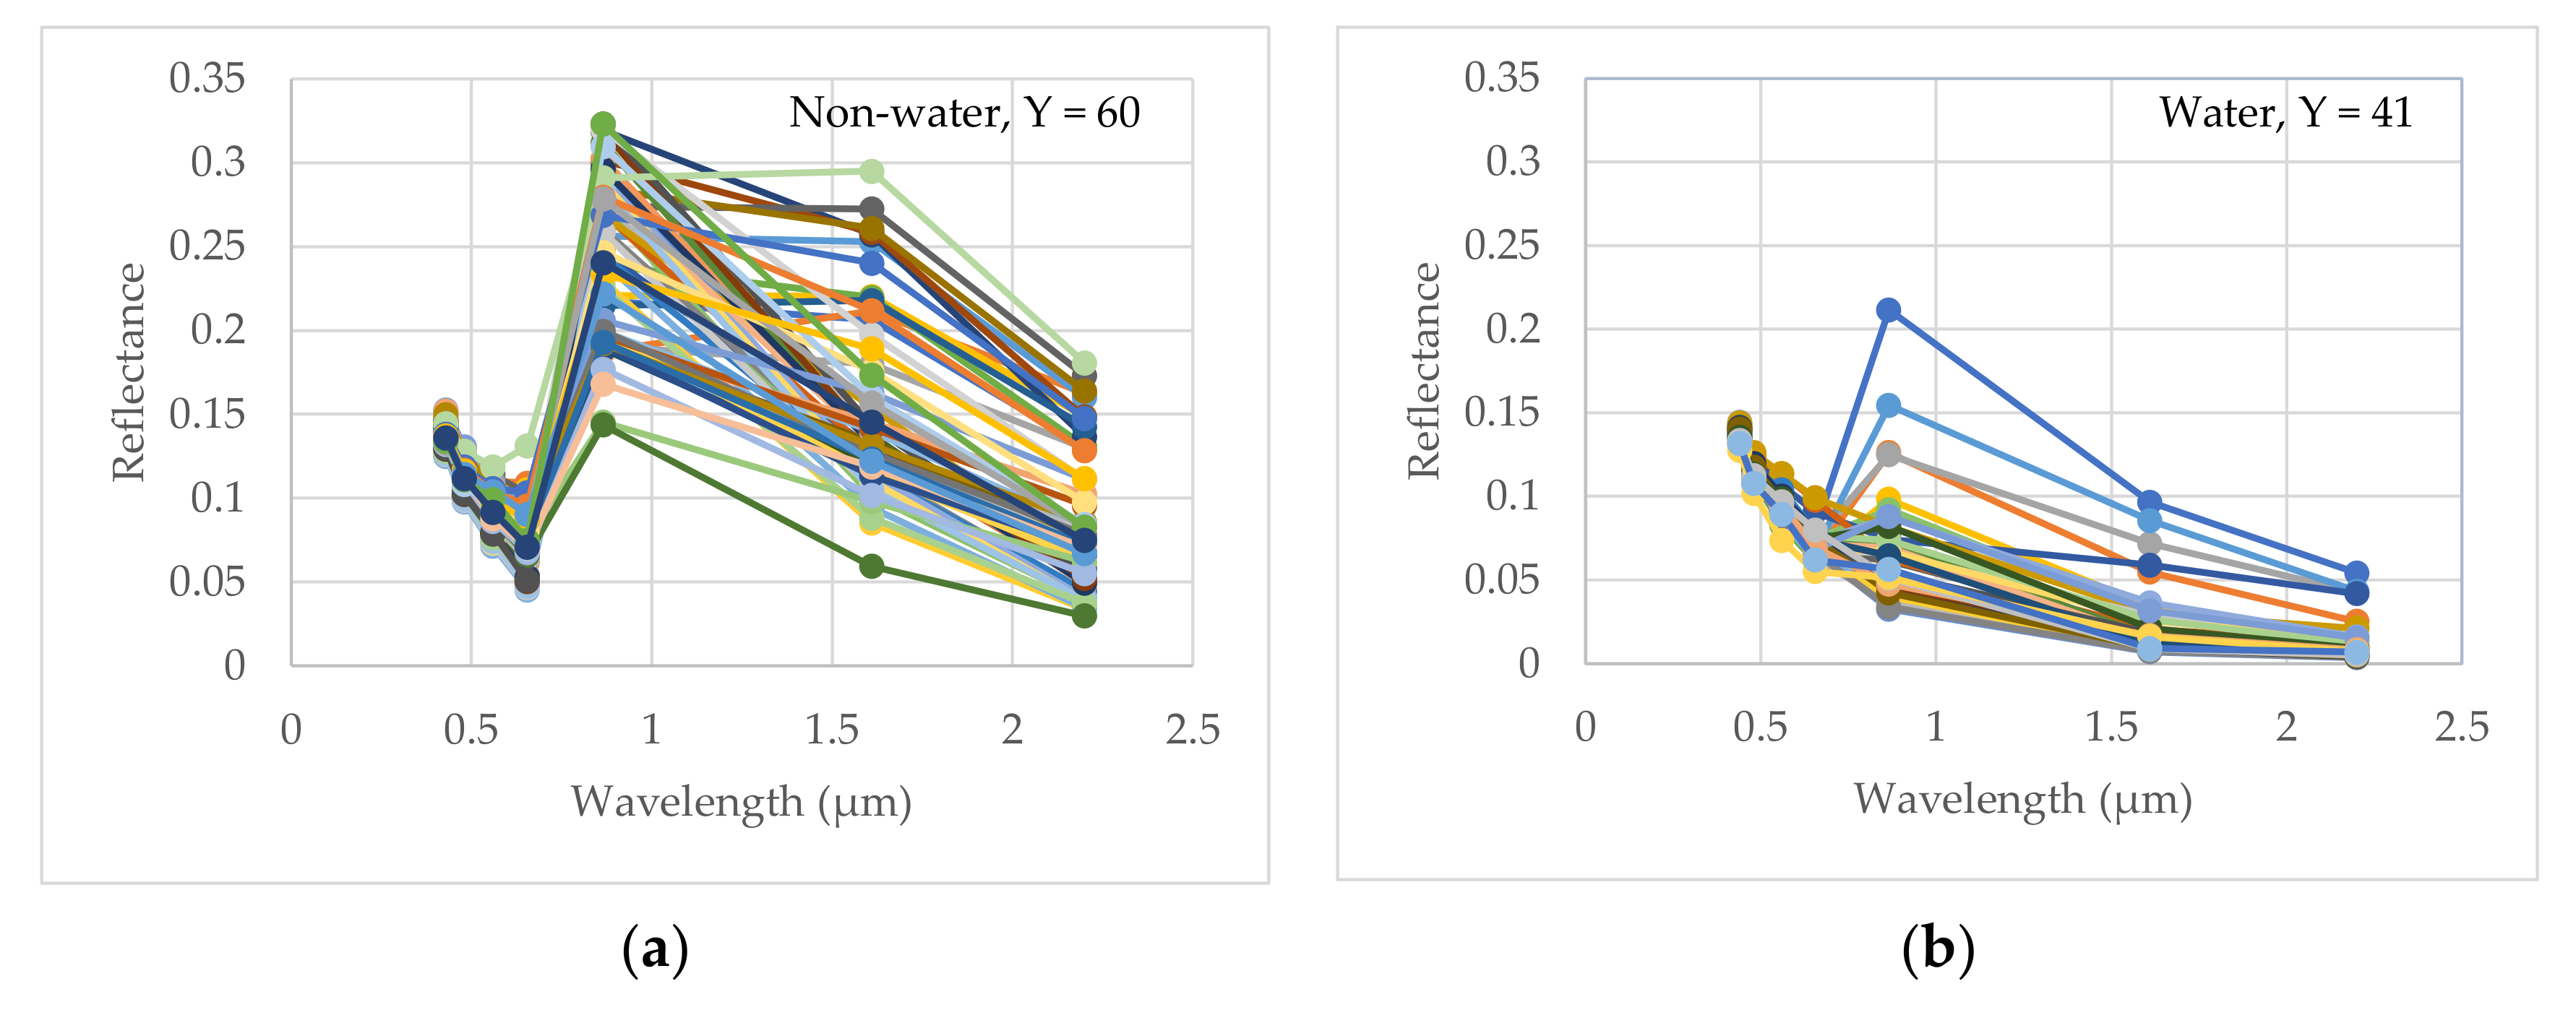
Detection of surface water through Landsat images is not new, although several constraints exist such as (a) availability of the best quality images as expected time series points, (b) determination of the reliability and validity of the result, and (c) misclassification of land cover, particularly where multi-sectoral use of land classes exists. Broadly, three approaches were employed by the researchers to detect land classes where Landsat mission’s spectral wavelength remote sensing data were involved: 1. The single band approach engaged to describe the geographical time series distribution based on distinct threshold point, 2. Multiple band approach engaged to combine several bands, create a colorful map, and classify the image into maximum probable land use classes, and 3. Index-based or ‘ratio’ approach engaged to count spectral reflectance variations in different bands, often considered two best spectral reflectance bands to decide a context-based threshold value to finalize the index, which Du et al. described as essential to produce a better and more accurate result [
26]. Exclusively detecting surface water, McFeeters had pioneered an index as the Normalized Difference Water Index (NDWI) based on green and Near Infrared (NIR) bands [
27] which was later modified by Zu as the Modified Normalized Difference Water Index (MNDWI) using green and Mid-Infrared of Thematic Mapper (TM) sensors, which has almost similar wavelength with short-wave infrared (SWIR-1) band of Operation Land Imager (OLI) sensor (
Table A1) [
28]. Both researchers used a threshold value ‘zero’ to separate surface water from other land use classes assumed as non-water. Furthermore, Ji et al. arranged NIR, SWIR-1, and SWIR-2 bands with red band to compare NDWI threshold index characteristics and found that SWIR-1 band performed better to extract water from Enhanced Thematic Mapper Plus (ETM+) sensor data. They concluded 0.015 and -0.007 are the threshold values for NDWI and Normalized Difference Vegetation Index (NDVI), respectively, between water and non-water pixels [
29]. Again, NDWI seems the best practice to identify water pixels from Landsat images where frequent seasonal water exists, such as SWB [
6]. Pekel et al. used petabytes of Landsat collection-1 data for their pioneering work to present global surface water dynamics, checked the ‘seasonality and persistence’ of surface water from 1984 to 2015 using NIR, red, and SWIR-1 spectral bands [
20]. On the other hand, Zhai et al. concluded that the MNDWI is a better index to extract water pixels compared to NDVI, NDWI, and Automated Water Extraction Index (AWEI), from rural and urban areas. They compared the TM and OLI sensors’ data and found that the OLI data were more efficient and stable for selecting threshold values between water and non-water pixels. To select the threshold point, first, they drew a spectral curve, then chose the values which are close to ‘endpoints’ or ‘logical value’ by sampling points values. Based on OLI data, the verified threshold values to extract waters in village areas for NDVI, NDWI, and MNDWI are 0.0, 0.0, and 0.07, respectively [
30]. Similarly, Singh et al. found that MNDWI is a better index to extract water pixels that are mixed with vegetation compared to NDWI [
31]. Du et al. discovered that green and mid-infrared bands of ETM+ sensor can provide better results to detect water pixels than those of green and NIR bands [
26]. However, apart from Landsat mission collection-1 archival data, different remote sensing Landsat data might also produce better results: for example, Li et al. compared the conventional technique of NDWI index calculation between TM and ETM+ sensor bands data with those of Advanced Land Imager (ALI). They proved that ALI data, using the green and SWIR band, is a better index to estimate surface water compared to conventional NDWI index from Landsat collection-1 data [
32]. It is important to note that the investigations which relied on the SWIR band focused on reflectance produced from the ocean, lake, and river water [
26,
28,
32]. In contrast, a study focused on separating water pixels from mixed land classes found that the SWIR band reduces more light than the NIR band which produces more positive value, confirming that the MNDWI index has more efficiency to detect surface water. However, the study relied on Indian Remote-Sensing Satellite, P-6 data, which collects images from a coarser ground resolution than that of the Landsat observations [
31]. The present study’s target location is SWB, where seasonal shallow water often exists. In such cases, the NIR band might be more efficient and effective to detect water pixels from non-water [
33] and, thus, the present study assumes the NDWI index might be the more appropriate method to estimate surface water which considers green and NIR bands, instead of MNDWI which considers green and SWIR bands.
Spatiotemporal research in Bangladesh has tremendous drawbacks, such as considerations of the limited Landsat observations from different days of the year (DoY) that restricts its applicability, especially for seasonal and time series investigation. For example, ten or less than ten Landsat observations between November and April have been used to estimate eight to forty-two years of LULC and surface water change [
6,
18]. Furthermore, five or less than five observations between November and March have been considered for thirteen to thirty-six years of land use change detection including surface water [
7,
10,
11,
13,
14,
16,
17] which are insufficient to produce conclusive results, especially for SWB where frequent human activity changes land classes rapidly [
34]. The studies, thus, could not fulfill the need to detect and determine the extent and dynamics of surface water exclusively to observe its long-term persistence around the region. Literature on spatiotemporal change in SWB is mostly concentrated on the lower parts of the Bengal delta which are very close to the sea. Therefore, the present exploratory study aims to consider maximum available Landsat observations from 1972 to 2020 with a view to illustrating consistent, seasonal, and annual changes of surface water around the upper part of the Bengal delta. After a pilot visit in SWB, the present study carefully targets the location where it assumes that the discharging of the seasonal surface water from the basin becomes increasingly difficult for the last two decades due to rapid change of land uses around the entire coastal region and has never been considered for spatiotemporal investigation. The present study includes interviews from the local people to support the remote-sensing data and in situ information and concentrate on local mechanisms and adaptive measures if surface water becomes a spatial problem. Finally, the study includes real-time in situ training points on water and non-water grounds to produce valid information and to reduce contradictory results from Landsat collection-1 images.
3. Results
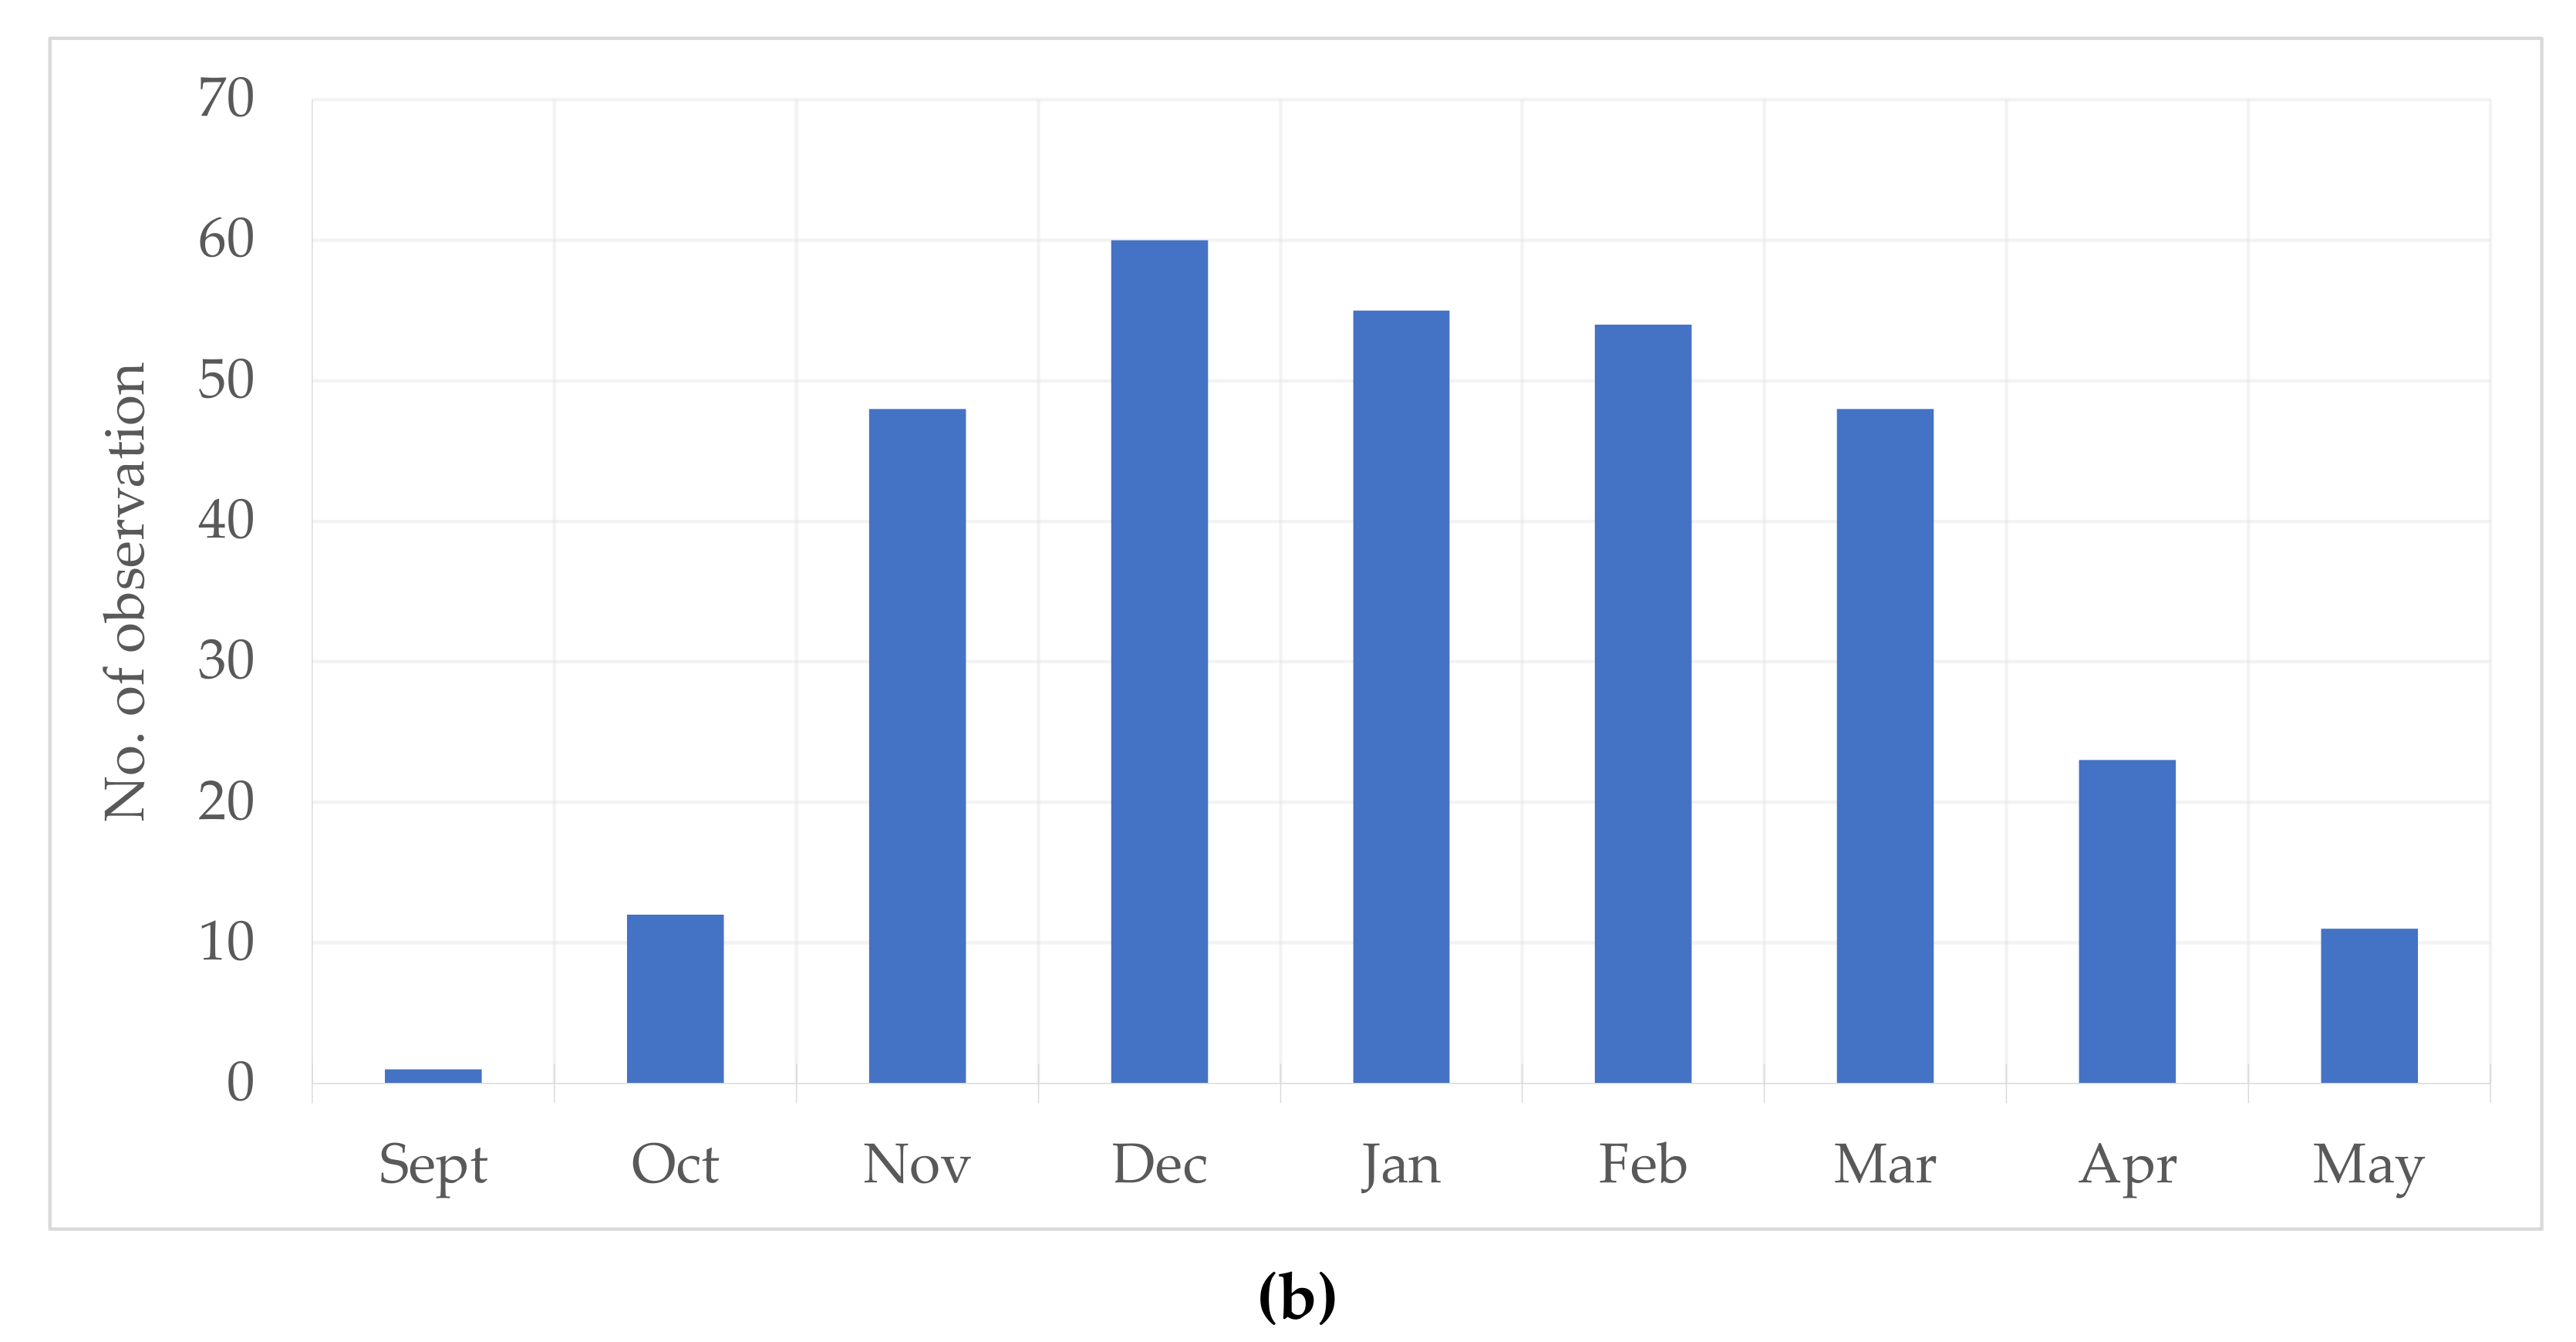
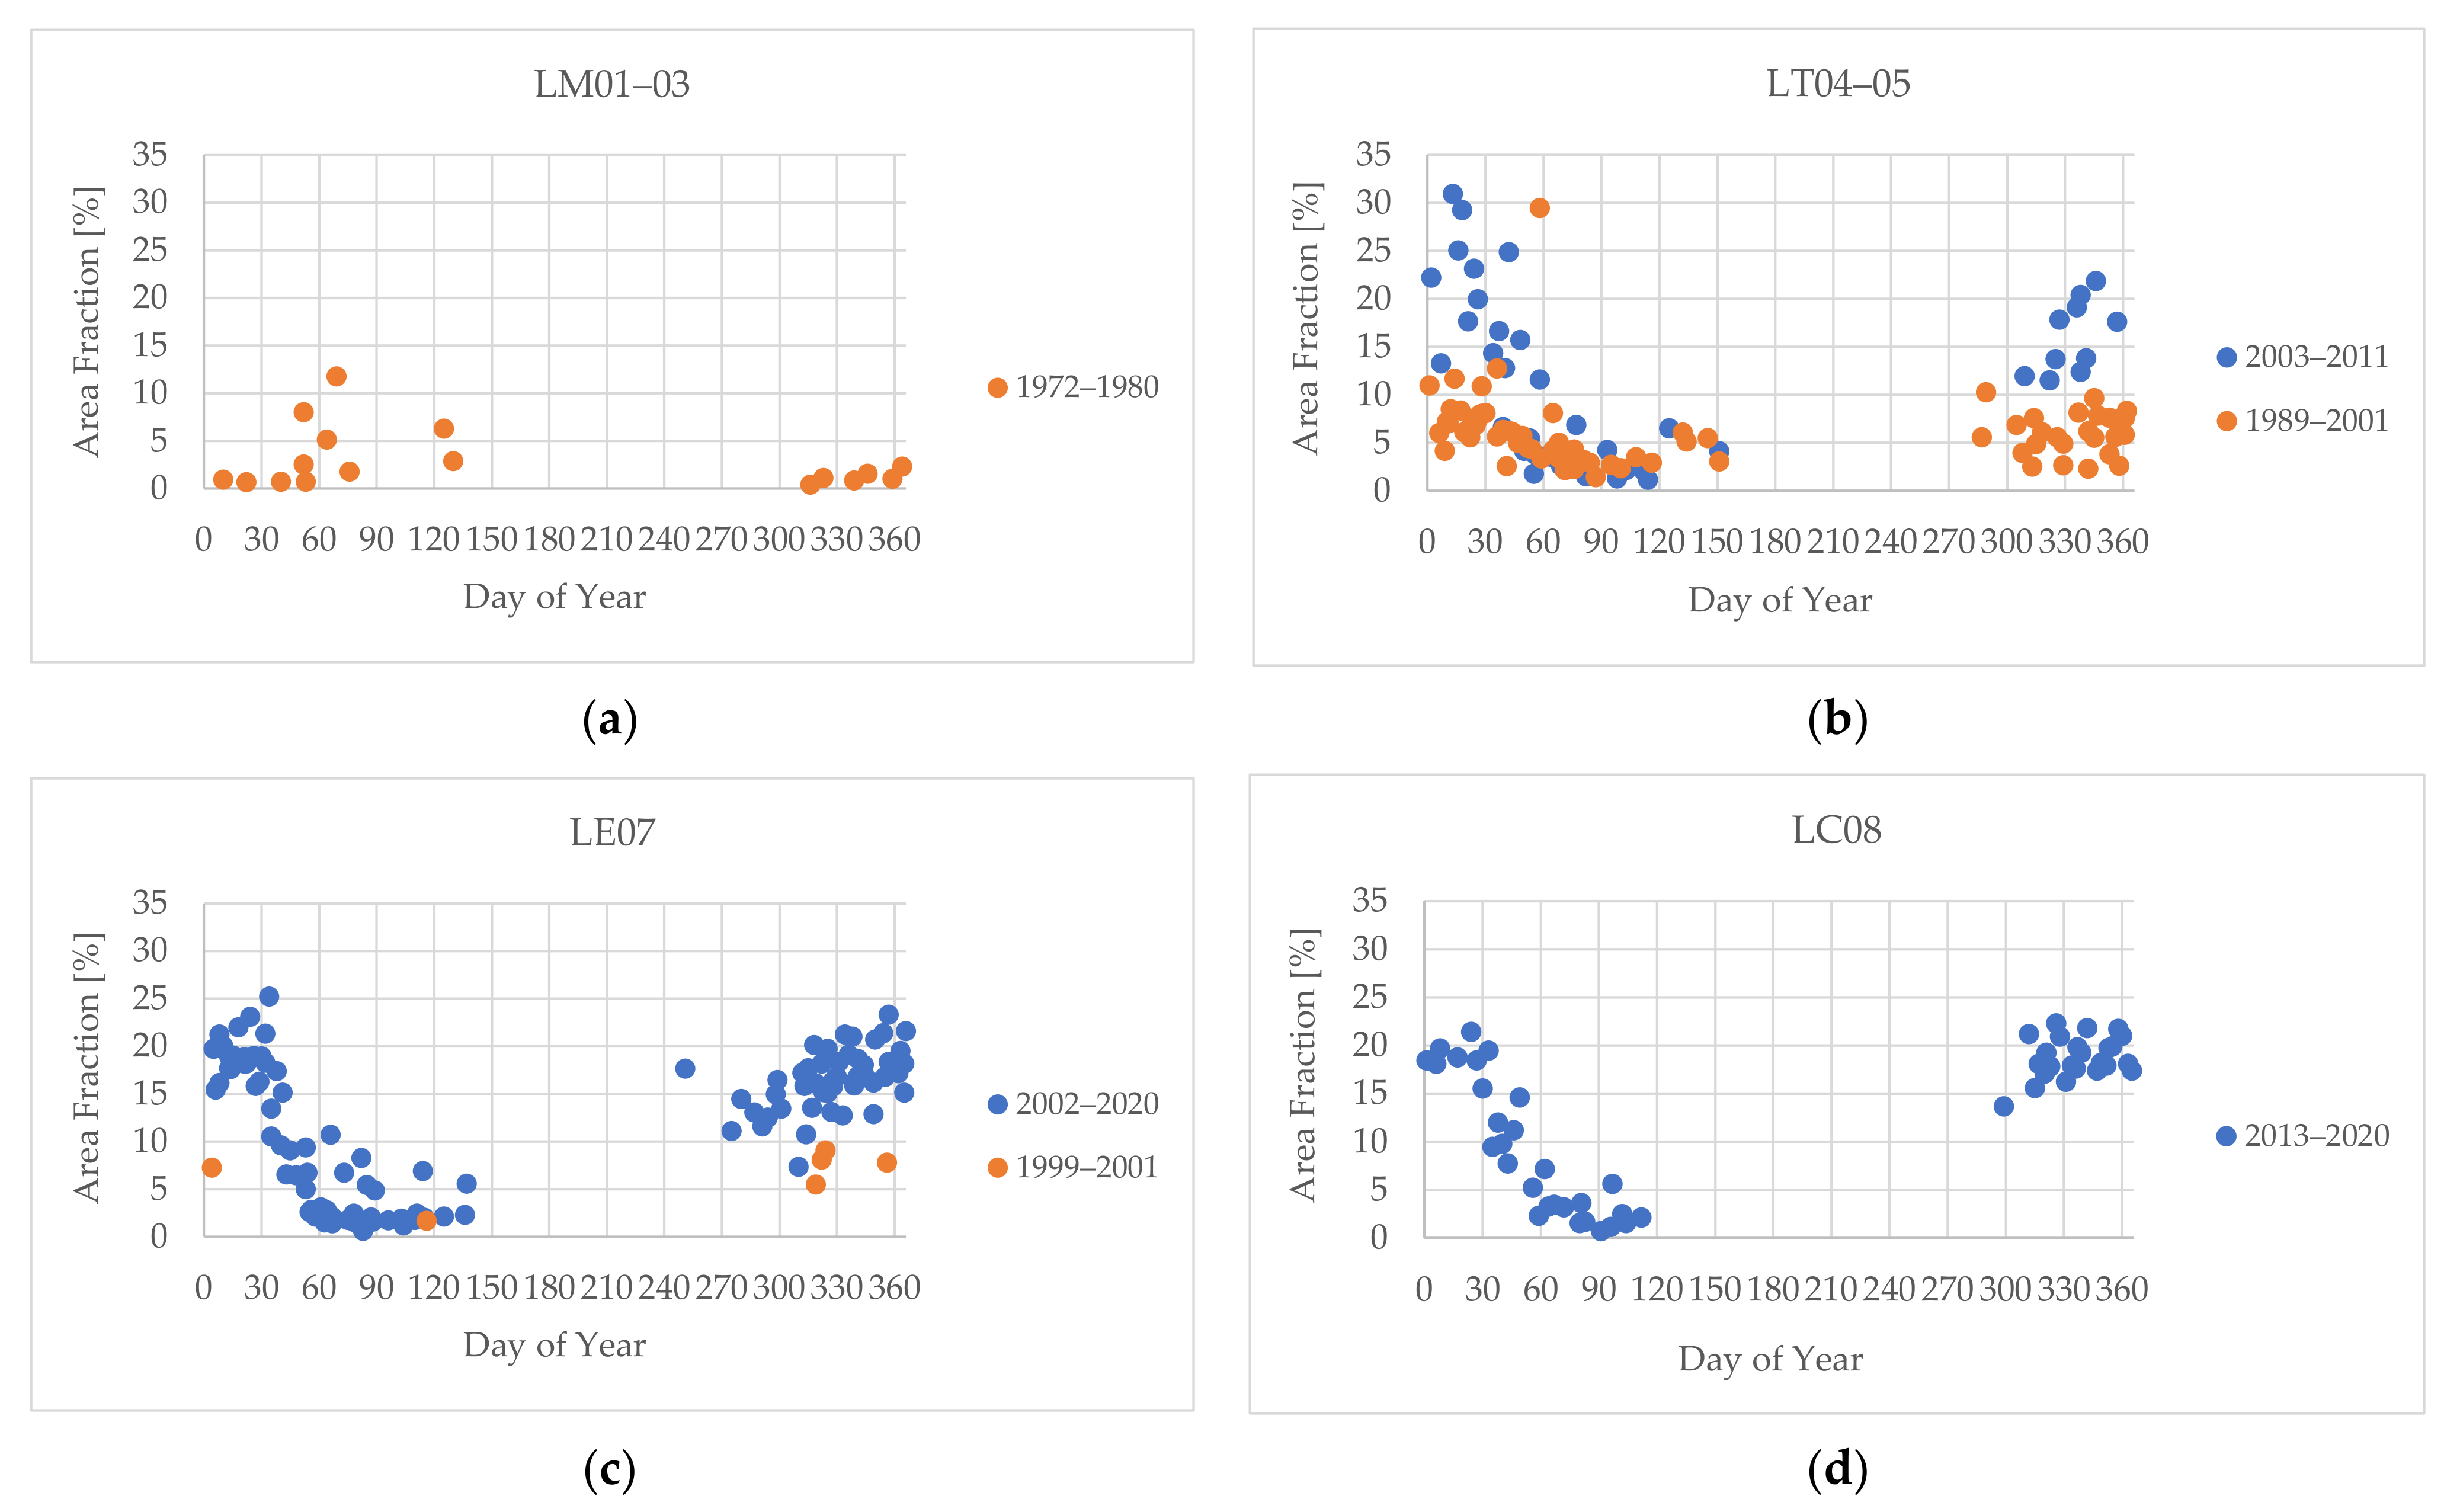
A total of 312 valid Landsat collection-1 observations from 1972 to 2020 were finally considered for analysis in the present study. A small number of observations were found between 1972 and 1980. Some observational data have been downloaded for the year 1974 and 1979, but none are considered for analysis because of the disturbed dataset in the archive.
Figure 5a presents that no observation has been found between 1981 and 1986. After that, on average, six observations per year have been considered for analysis until 2003. More than twelve observations are available for each year between 2004 and 2020. On the other hand,
Figure 5b shows that the highest number of observations is 60 from December, followed by 55 in January. Only one observation is available in September; thus, for monthly analysis, the month is excluded. The numbers of observations are found as 11 May and 12 October. A good number of monthly total observations are also available in February as 54 and in March as 48. No observations are considered for the final analysis for the months of June, July, and August, mainly because of the cloud coverage.
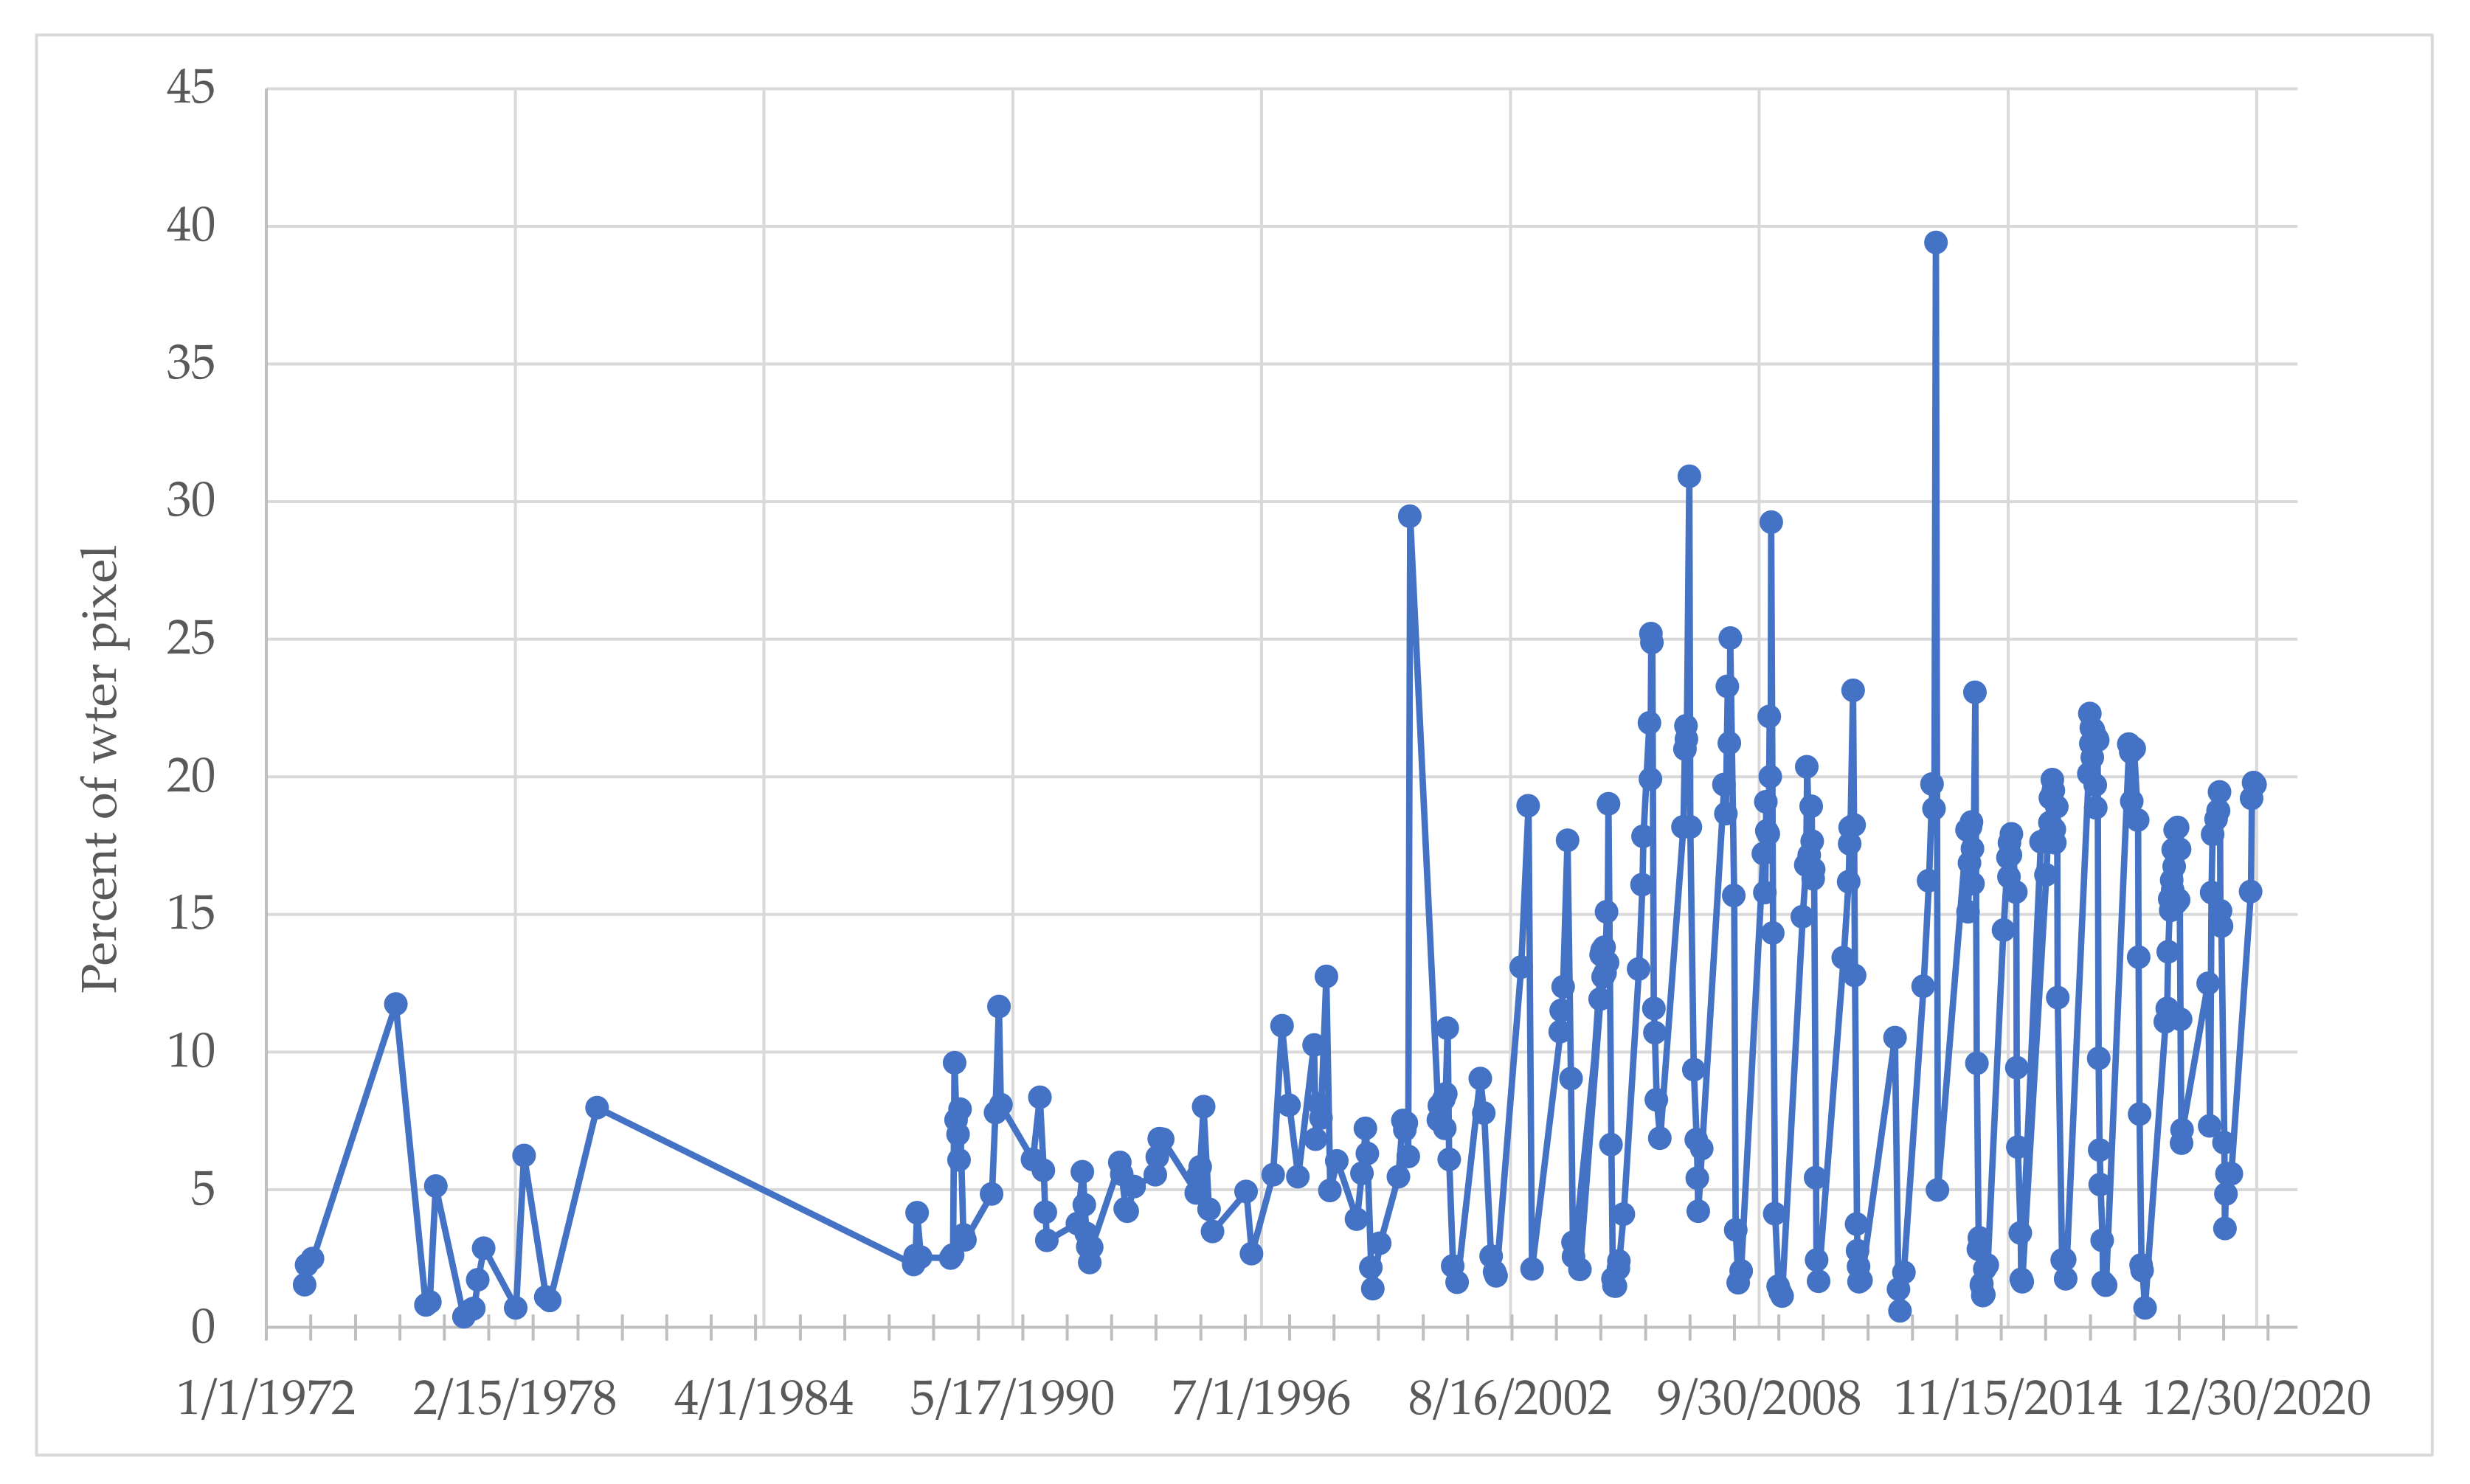
The percent of water pixels based on NDWI > 0.0 is presented to observe the general trend of percent of water bodies defined as surface water in the study area between 1972 and 2020. The years 1974, 1979, and 1981 to 1986 are not included for final data analysis based on valid Landsat observations which have already been presented in
Figure 5a. The distribution of water pixels in
Figure 6 distinguishes two perceivable and incompatible patterns of surface water in the study area in two different eras—(1) from 1972 to 2001 and (2) from 2002 to 2020. Though we checked for different period of separation, results do not change largely. For better understanding of temporal analysis, it is crucial to consider the analysis between these two eras, which is shown later. The NDWI > 0.0 pixels of each observation from 1972 to 2001 will be defined as the first era and, likewise, the latter part as the second era. Less than 10% area is observed as surface water in general in the first era, which expands to 20% in the second era. The highest surface water of 39.4% is observed in 2013, followed by 30.9% in 2007, and next to 29.4% in 2000. The persistence of surface water from 1972 seems uniform until 1999 and then in 2000, the first sharp increase is observed as around 29%. On an average, the study area has around 5.5% of surface water with 3.7 standard deviation in the first era which increases to 12.8% with a 7.6 standard deviation in the second era. The surface water trend could be explicitly recognized by observing the single-year distribution. The yearly presence of surface water will be presented in two different graphs representing two different eras so that it is possible to observe not only the yearly extent of surface water but also to perceive the yearly trend in two eras. Before that, a decadal change of surface water estimation is important to identify the most vital decade of surface water change in SWB. Percent of pixel trend from 1972 to 2020 presented in
Figure 6 constitutes both the highest and lowest percent of surface water; in some cases, the value is too low or too high compared to the median value. The data derived from valid Landsat observations have not been distributed in a uniform frequency of the DoY. Based on the extent of the value and the diversified DoY, an interquartile range of box-plot presentations has been arranged for decadal, yearly, and seasonal analyses of the dataset using MS excel.
The study also tries to inspect the reason for some high and low values of surface water in the study area. It appears that at least 11 abrupt surface water cases which might be related to water-related natural disasters such as cyclone, riverine flood, and flash flood around SWB. Although seeking the source of surface water and its direct relationship with natural disaster is beyond the present study objective, it may be an important element to consider future remote sensing research on land class change in coastal areas of Bangladesh.
Table A4 has been prepared to present surface water scenario in the study area based on the Landsat observations of the immediate before and after of the disasters. A few examples are noted—1. Surface water increases from 2.6% on 24 November to 9.6% on 10 December in 1988 are related to a category-3 cyclone on 29 November of the same year. 2. Water pixel increases from 5.5% on 25 May to 10.3% on 16 October in 1997 are related to a tropical cyclone on 26 September. 3. A category-5 cyclone on 15 November in 2007 instigated the surface water change from 6.5% on 5 May to 19.7% on 21 November. 4. Last but not least, a tropical cyclone on 9 November increased surface water from 7.3% on 6 November to 15.8% on 22 November in 1997.
From
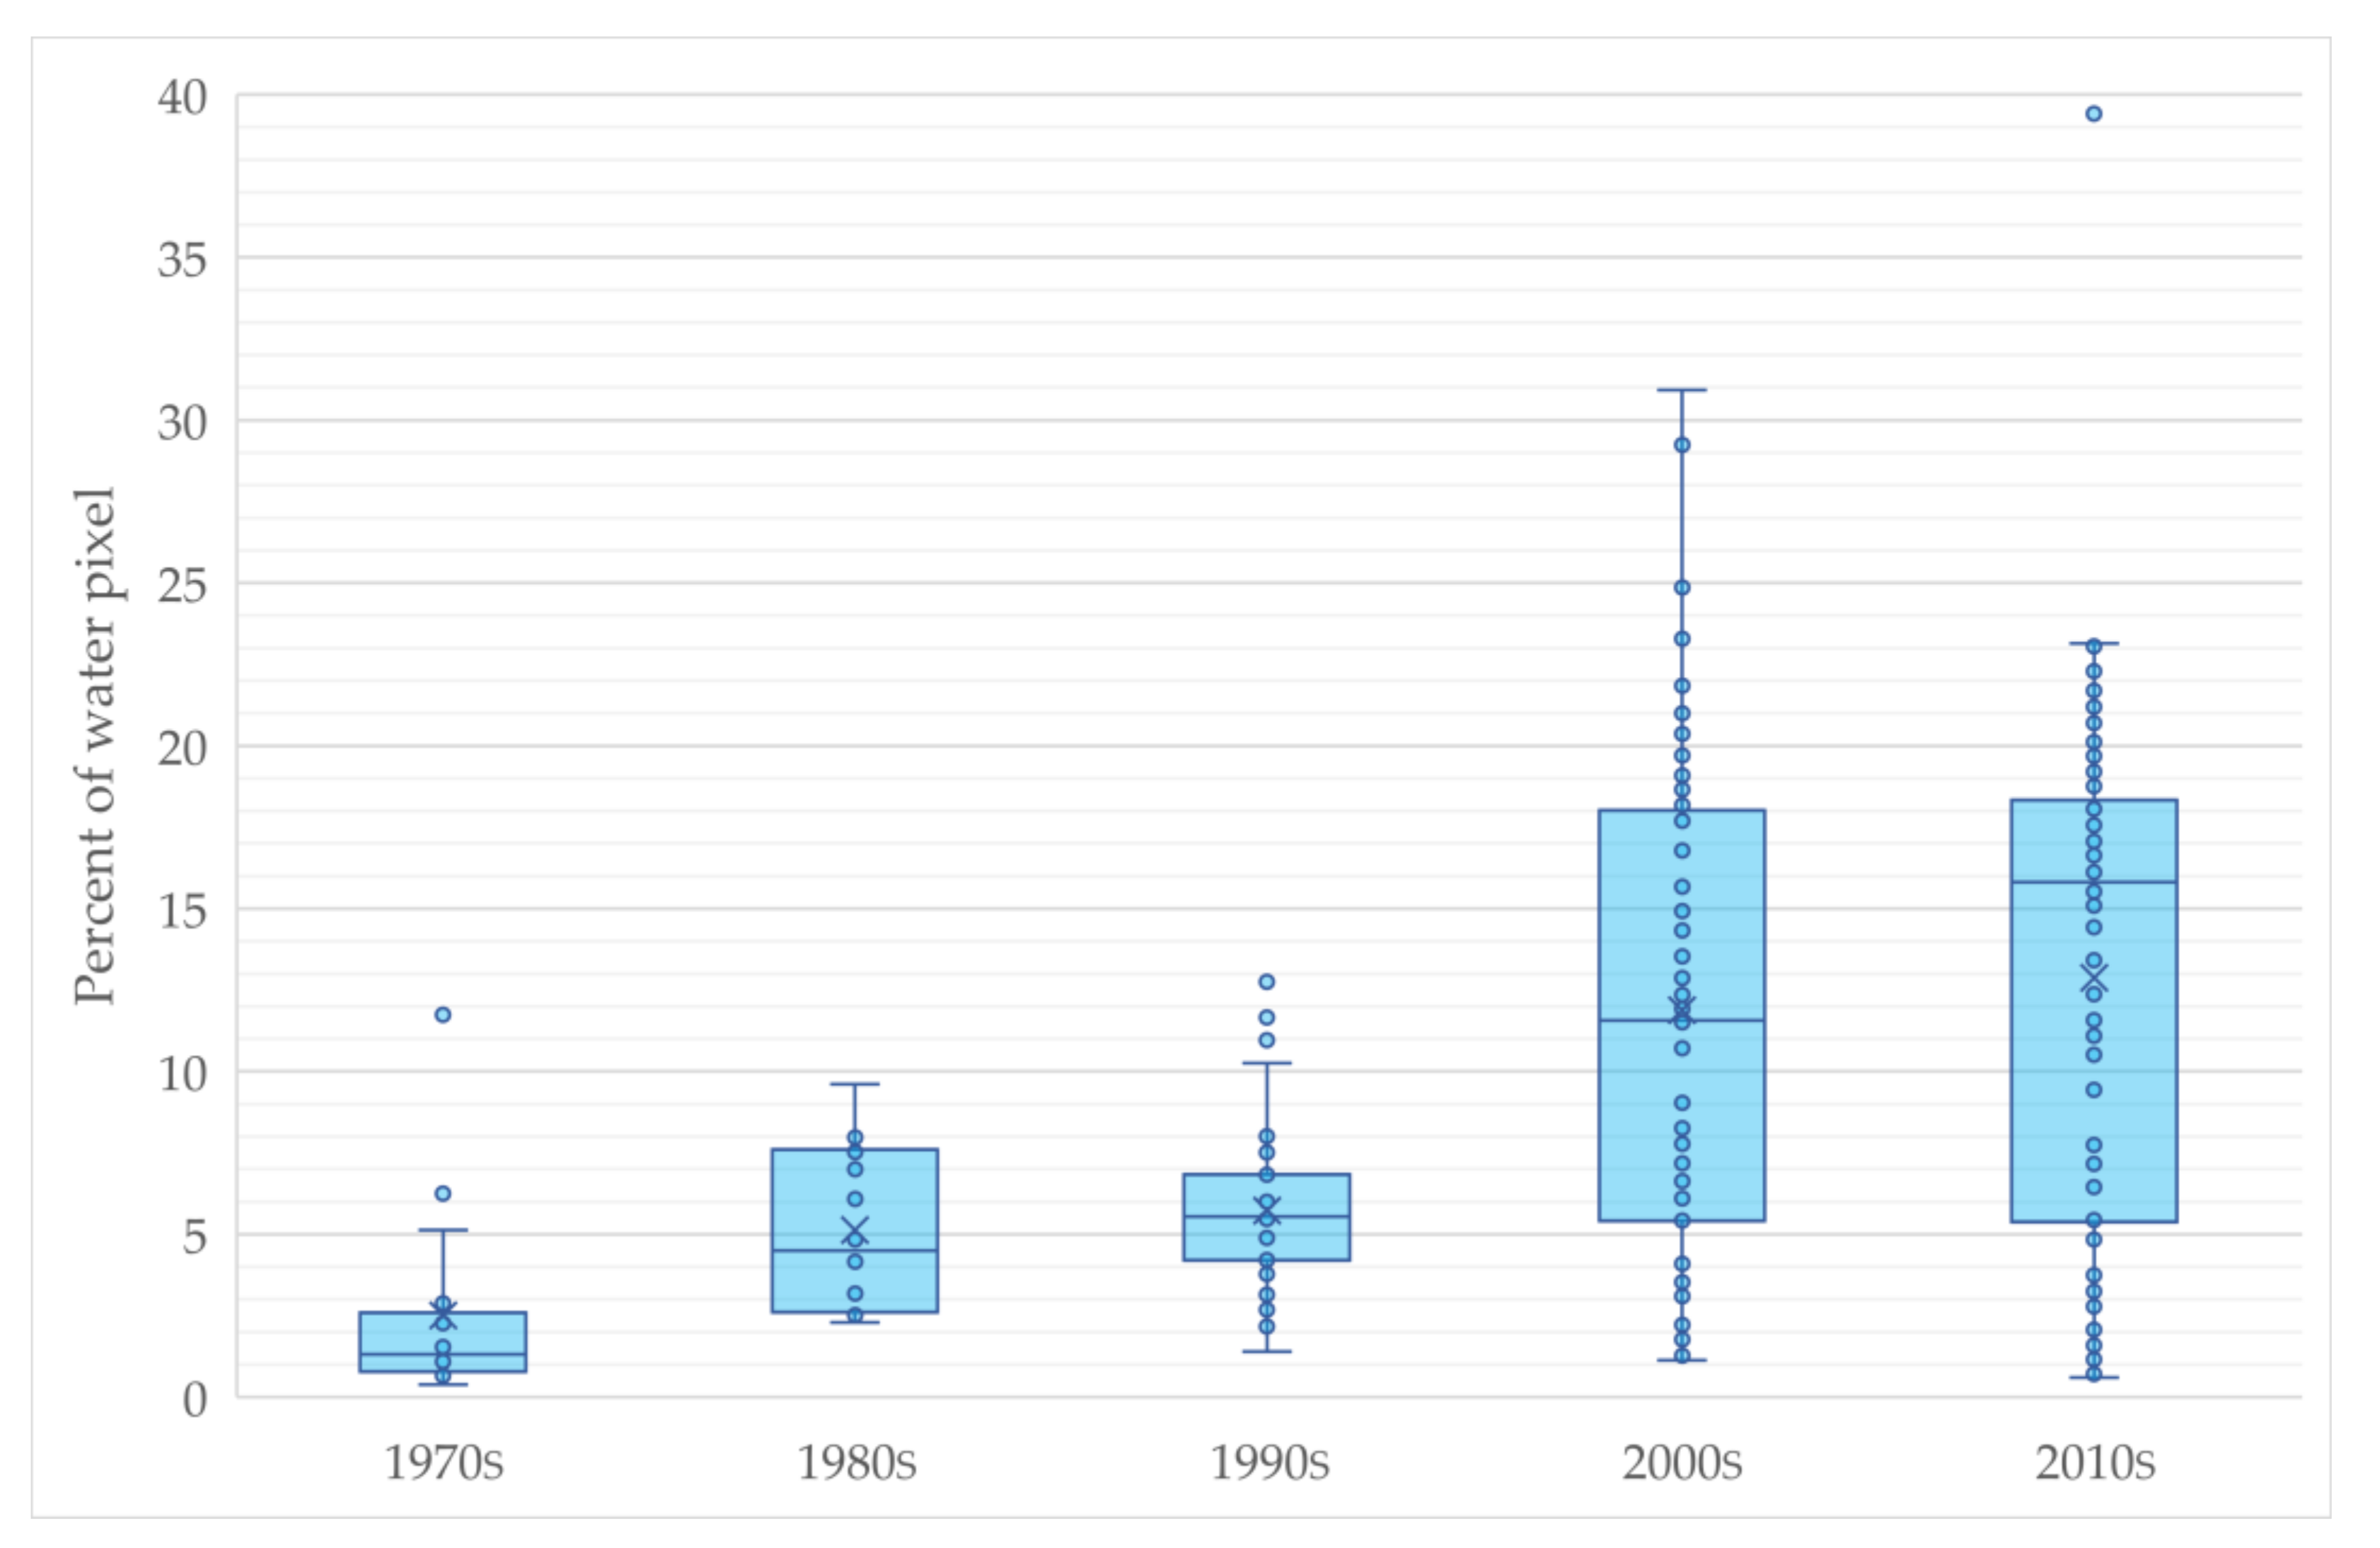
Figure 7, the presentation has been prepared through box plot analysis, where the upper whisker represents the maximum value, the lower whisker as the minimum. The upper limit of the box is based on the 75th percentile or 3rd quartile (Q3) while the lower limit is the 25th percentile or 1st quartile (Q1). The median value or 2nd quartile (Q2), and average point are shown as a line-mark and marker respectively inside the box. Dots are the actual values. The outlier dots are the values lying over 1.5 times of the interquartile range (IQR) below the Q1 or above the Q3. IQR = Q3–Q1. The study considers five decades of surface water observation in SWB between 1972 and 2020.
Figure 7 reveals the decadal change, and it appears that the maximum surface water is observed as 5% and 10% in the 1970s and 1980s, respectively. The presence of surface water is only 3% in the 1970s based on Q3, which jumps to 8% in the next decade. Again, the Q3 shows that the surface water slightly decreases by 1% from the 1980s to the 1990s, but the median and maximum values indicate a slight increase of surface water between the decades. The surface water expands to the highest level in the 2000s. The maximum extent of surface water is around 10% in the 1990s, which steeply increases in the next decade. The maximum occurrence of surface water is counted as over 30% in the 2000s. It can be assumed that a two-and-a-half-fold surface water expansion occurs between the 1990s and 2000s based on Q3, while the median value of 6% is found in the 1990s that doubles in the 2000s. It is noted that a total of 51 valid observations were considered for the final analysis in the 1990s while for the latter decade the number was 93, which indicates a substantial quantity of Landsat observations were aggregated to analyze both decades. After a significant increase of surface water in the 2000s, the trend continues in the next decade as well. The IQR for the 2000s and 2010s appears almost identical. The maximum occurrence of surface water counted as over 30% in the 2000s followed by 23% in the 2010s. However, a higher median value is observed in the 2010s than that of the 2000s, which confirms that the surface water is more intense and persistent in the latter decade. However, the maximum and minimum values show that surface water decreases marginally from the 2000s to the 2010s. One extreme outlier point has been found higher than the Q3 in the 2010s. Evidently, the study area has covered much higher and distinct presence of surface water in the last two decades, the 2000s and 2010s, than that of the prior three decades which further recommends observing the extent of surface water in the two different periods which have already been defined as the first and the second era in the previous trend analysis section.
The yearly change of surface water is divided into two eras which indicates a clear and distinguishable pattern of surface water as well.
Figure 8a shows that the surface water is not widely observed in the first era. In general, the median value is around 5% during the entire period. The maximum surface water is observed over 10% in four instances between 1972 and 2001. The highest surface water observed during the first era is around 12% both in 1975 and 1990, followed by 11% both in 1997 and 2001. An upper IQR is observed in the year 1990 with a minimum and maximum value as 6% and 12% respectively. Based on Q3 of the data, three waves of surface water are observed in the first era—the first wave appears between 1987 and 1990, followed by the second wave between 1992 and 1995, and the next one between 1998 and 2001. In contrast, two significant decreasing trends are also seen: the first is between 1975 and 1977 and the second is between 1990 and 1992. Two extreme outlier points are observed in 1998 and 2000 advanced the average marker out of the box plot.
Compared to the first era,
Figure 8b shows significant and outspread surface water increases in the second era between 2002 and 2020. The highest maximum surface water is observed over 30% in 2007, followed by 29% in 2009. Furthermore, a maximum of 25% surface water is seen both in 2006 and 2008. In contrast, the lowest maximum surface water is observed as 5% in 2002, but an outlier value of 13% exists in that year. Around or over 20% of surface water in the Q3 is observed on at least five occasions. Based on the median value, significant increase of surface water in successive years occurred at least on two occasions—first, it increased from 5% in 2005 to over 20% in 2006, and the second, 6% in 2012, increased to around 18% in 2013. Around 13% of average surface water is observed in four consecutive years from 2007, then it decreases until 2012 to around 8%. A sharp increasing trend is observed from 2014 to 2016, then it slightly decreases next year. However, from 2017, the surface water appeared to increase until 2020. Two outlier values higher and lower than the Q3 and Q1 are observed in 2013, and the median value is 18%.
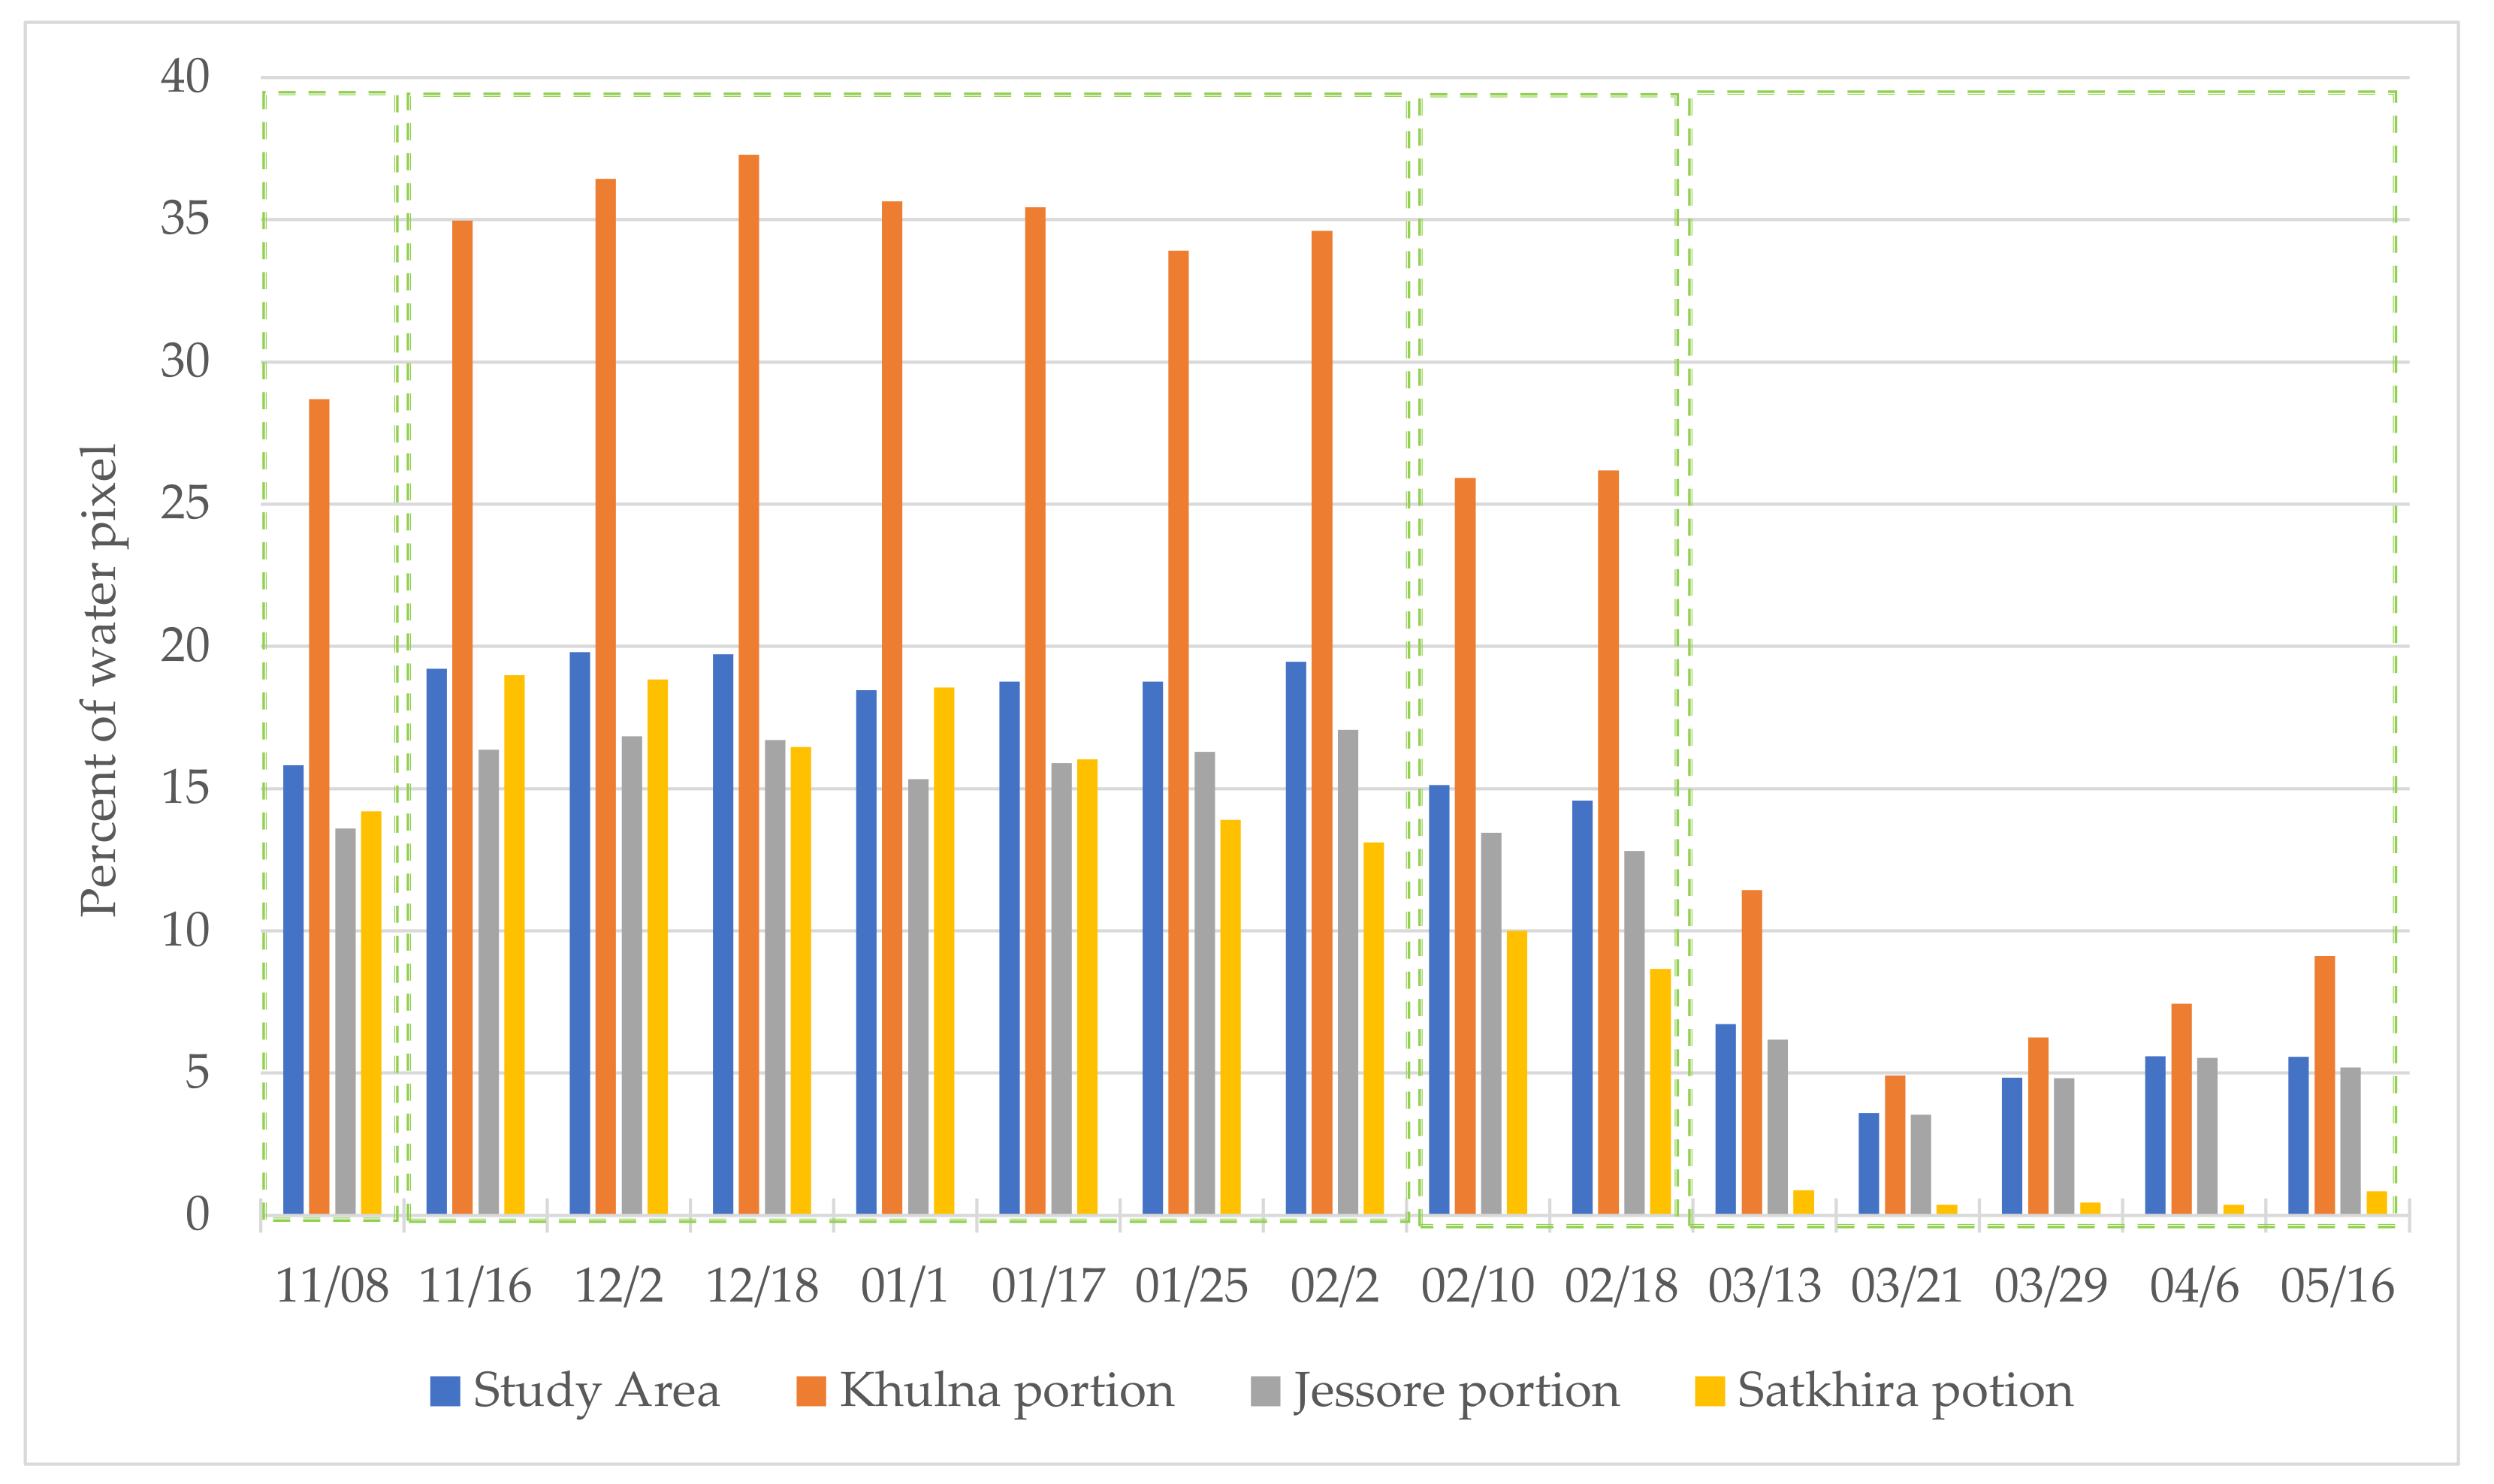
The percent of pixel based on NDWI > 0.0 in the study area is arranged in monthly order from October to May contemplating all the available observed data between 1972 and 2020.
Figure 9 demonstrates that the months—June, July, August, and September—are excluded from the analysis either because of the absence of valid observations or the presence of very few observations. The highest maximum surface water is observed in January at over 30% followed by 25% in February. The maximum value for both December and November is observed as around 23%. In contrast, the maximum value for March, April, and May is found around 5%. The Q3 shows that the surface water in the study area is 14% in October, which sharply increases to 18% in November, increases further 1% in December, and remains the same in January. However, after January the drastic change began, as surface water went down to 13% in February and again to only 4% in March and 3% in April. The median value of surface water in May is only 5%. The IQR of the month from November to February shows the most consistent and extensive surface water in the study area. The IQR of November, December, and January is almost identical, but the highest median value in January proves that the month has the higher consistency of surface water. A considerable level of surface water in October is found compared with the two sets of months shown by the two box-markers in
Figure 9. This eight-month observation of surface water in the study area provokes further analysis between the two groups of months. Group-A, when a significant presence of surface water appears, including November, December, January, and February; and group-B, when a minimum percent of surface water exists, including March and April, and May in between the two eras. The significant decrease of surface water observed between January and February, and February and March, is also notable.
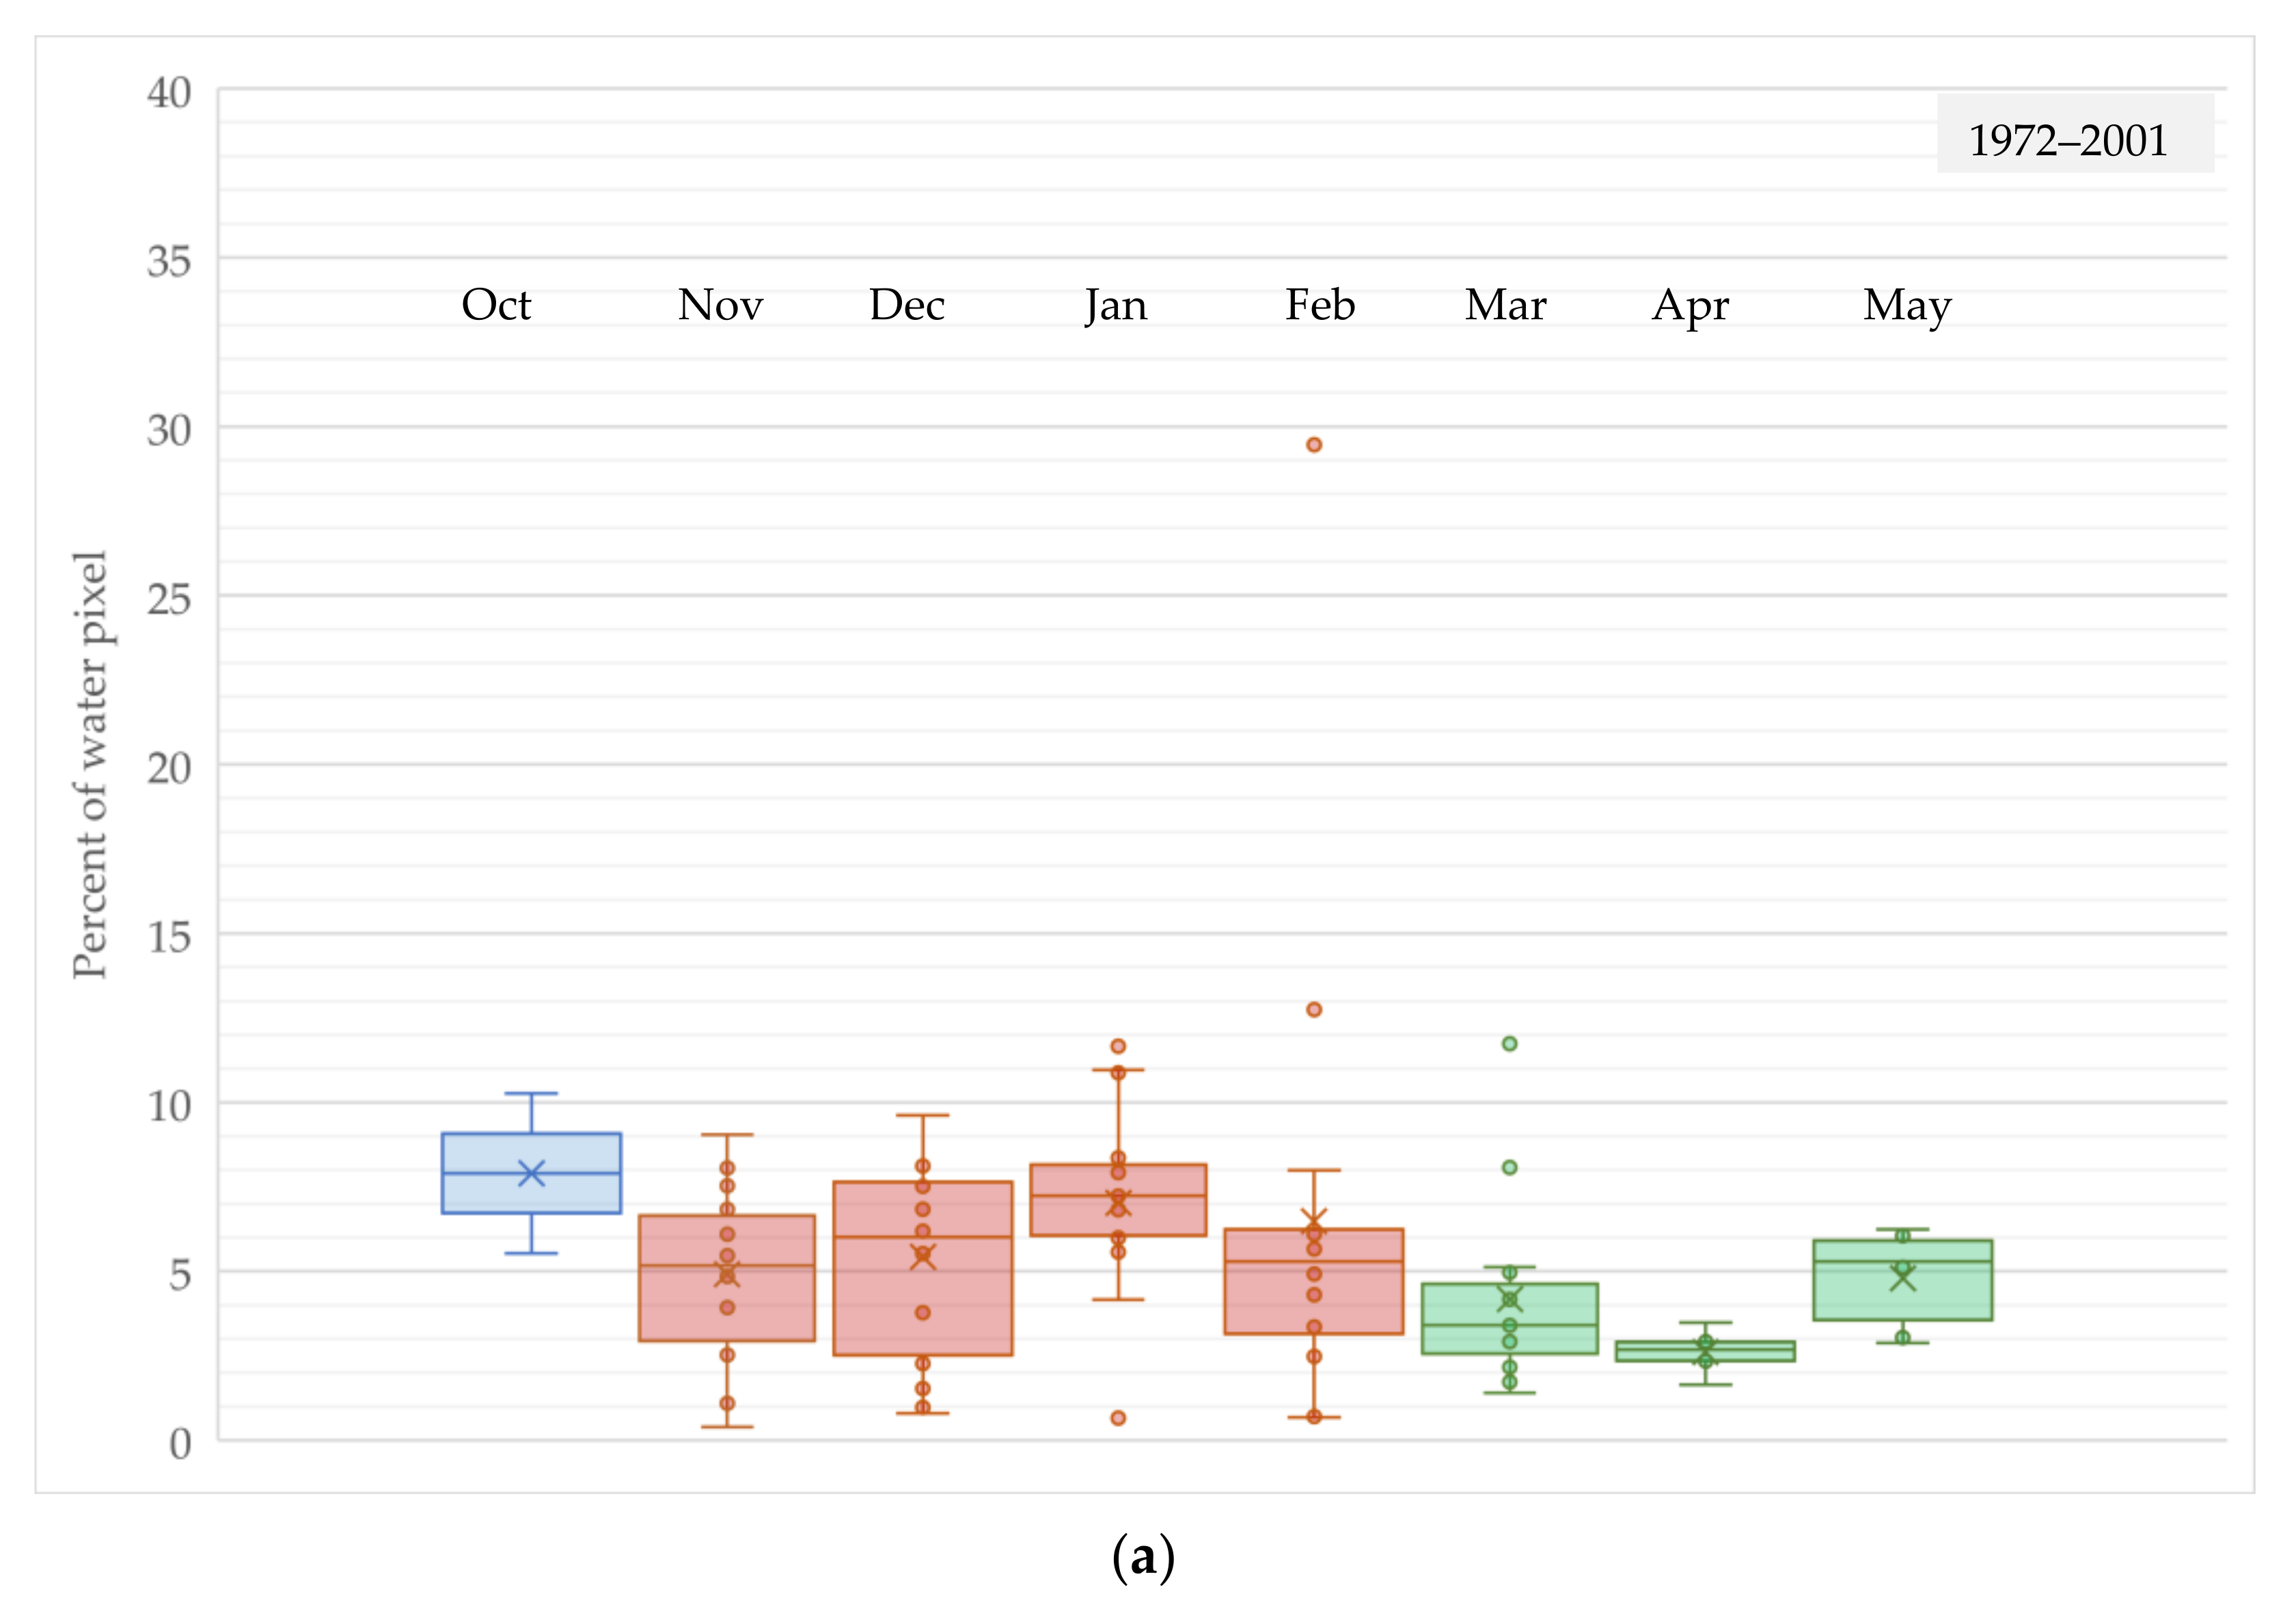
Figure 10 presents the monthly trend of surface water between the two eras—from 1972 to 2001 and from 2002 to 2020; group-A and group-B months are colored differently while the month October remains the same color.
Figure 10a reveals that the maximum monthly surface water in group-A months in the first era is around 10% while in group-B months it is around 5%. The box plot of group-B months indicates a similar intensity and trend of surface water as the monthly analysis presented in
Figure 9. In addition, for the group-A months, the Q3 of surface water in November is found around 7% which increases by 1% in the consecutive two months as 8% in January. A slight decrease trend is also observed from January to April. Two outlier points are available among each of the observations from the month of January, February, and March. On the other hand, compared to the first era,
Figure 10b shows a completely different consistency and extent of surface water from 2002 to 2020. The maximum surface water appears in February as around 25%, followed by around 23% both in December and January. The widest IQR appears in February where Q3 and Q1 are 15% and 6% respectively. The Q3 of the value suggests an increasing trend of surface water from November to January. However, the change of surface water is much wider and clearer between January and February, and February and March. Such successive monthly change of surface water never appears in the first era. The extent of surface water in the study area for the months of November, December, January, and February seems to expand nearly two-and-a-half fold in the second era as maximum value is found to be more than 23% in each case. The extent is so clear that the minimum values of Group-A months in the second era are always higher than that of the maximum value from the first era. In contrast, the trend and extent of surface water for the months of March, April, and May remains almost the same in both eras as the maximum value appears around 5%, while water fraction seems to decline from March to April in the second era. However, the surface water is seen to increase slightly in October in the second era. Thus, the reasons for the significant increase of surface water in the study area for group-A months and drastic change from January to April in the second era need to be clarified in the discussion section.
5. Conclusions
The present remote sensing study explores the trend, extent, and seasonality of surface water at the southwestern part of Bangladesh based on maximum useable Landsat level-1 reflectance observational data. The main limitation of reflectance data is cloud coverage; thus, the study excludes the months between June and August and cannot focus on the years between 1979 and 1986 due to the disturbed dataset. The study discusses numerous water management projects and frequent natural disasters around SWB but does not try to provide concrete evidence that these events might be the source of surface water on the upper reaches of the Bengal delta. However, the interviews reveal the decadal change of human interventions; seasonal water management by the locals, especially using the surface water for their better livelihood; and at least 11 natural disasters that might trigger surface water between 1972 and 2020. Further studies on the impact of natural disasters such as storms, tropical cyclones, and floods and the consequences of water management projects on surface water considering the entire delta may be needed. The reflectance analysis of the investigation, based on the real-time ground truth data, suggests that the NIR band has the highest separation efficacy between water and non-water pixels compared to SWIR1 and SWIR2. The threshold value ‘0′ of NDWI based on OLI sensor image to detect surface water produced an overall accuracy of 92.3% where the Kappa coefficient value is 0.89. The study also confirms the threshold value as reliable and applicable to other previous sensors of the Landsat level-1 archival data as well (
Figure 14). Thus, the study ensures and suggests using NIR band and NDWI index as a reliable method to estimate surface water, especially from other parts of Bangladesh where frequent and seasonal land class change and shallow surface water exist. Similar analysis may be applicable to the region where complex aquaculture and paddy field cultivation are actively conducted. The method based on NDWI may be applicable at least from the TM sensors. However, the study recommends checking the threshold value against the ground truth. Based on people’s past experiences of land use and historic secondary data, the study confirms that human interventions transformed the spatiality of surface water in SWB, mostly between November and February, particularly after 2001. On average, the SWB has faced around 5.5% of surface water between 1972 and 2001, which increased to 12.8% between 2002 and 2020. The median surface water doubled from the 1990s to the 2000s and nearly tripled in the 2010s (
Figure 7). The highest median value of surface water was observed around 18% in January and the lowest, just over 2%, was observed in April between 1972 and 2020 (
Figure 9). Monthly comparison between the two periods—from 1972 to 2001 and from 2002 to 2020—suggests that average surface water expanded from 5% to 17% in November, from 6% to 18% in December, 7% to 19% in January, and from 6% to 11% in February. In contrast, the average surface water slightly decreased in March, April, and May. Hence, based on the trend, extent, and seasonality of surface water in SWB, the study suggests using December and or January month’s Landsat observations, especially for studies which involve identifying LULC where waterbody or surface water is either exclusive or one of the land classes in southwestern Bangladesh. It appears that the aquaculture, especially the shrimp farm, is the primary source of surface water and one of the key livelihood options for the people in SWB. Thus, to estimate shrimp farm might be an important option in future remote sensing research which may provide almost real-time monitoring opportunity for the policy makers. Surface water is not only important for the flora and fauna but also for local ecology. The study finds a tremendous seasonal change in SWB after 2001 and assumes it also affected the local ecology such as humidity and surface temperature. Such changes of surface water obviously influence people to fabricate their livelihoods, which may transform the community and even society. The future research regarding ecological effects from surface water, adaptation research, and social impact might be crucial for the academicians and planners in Bangladesh.
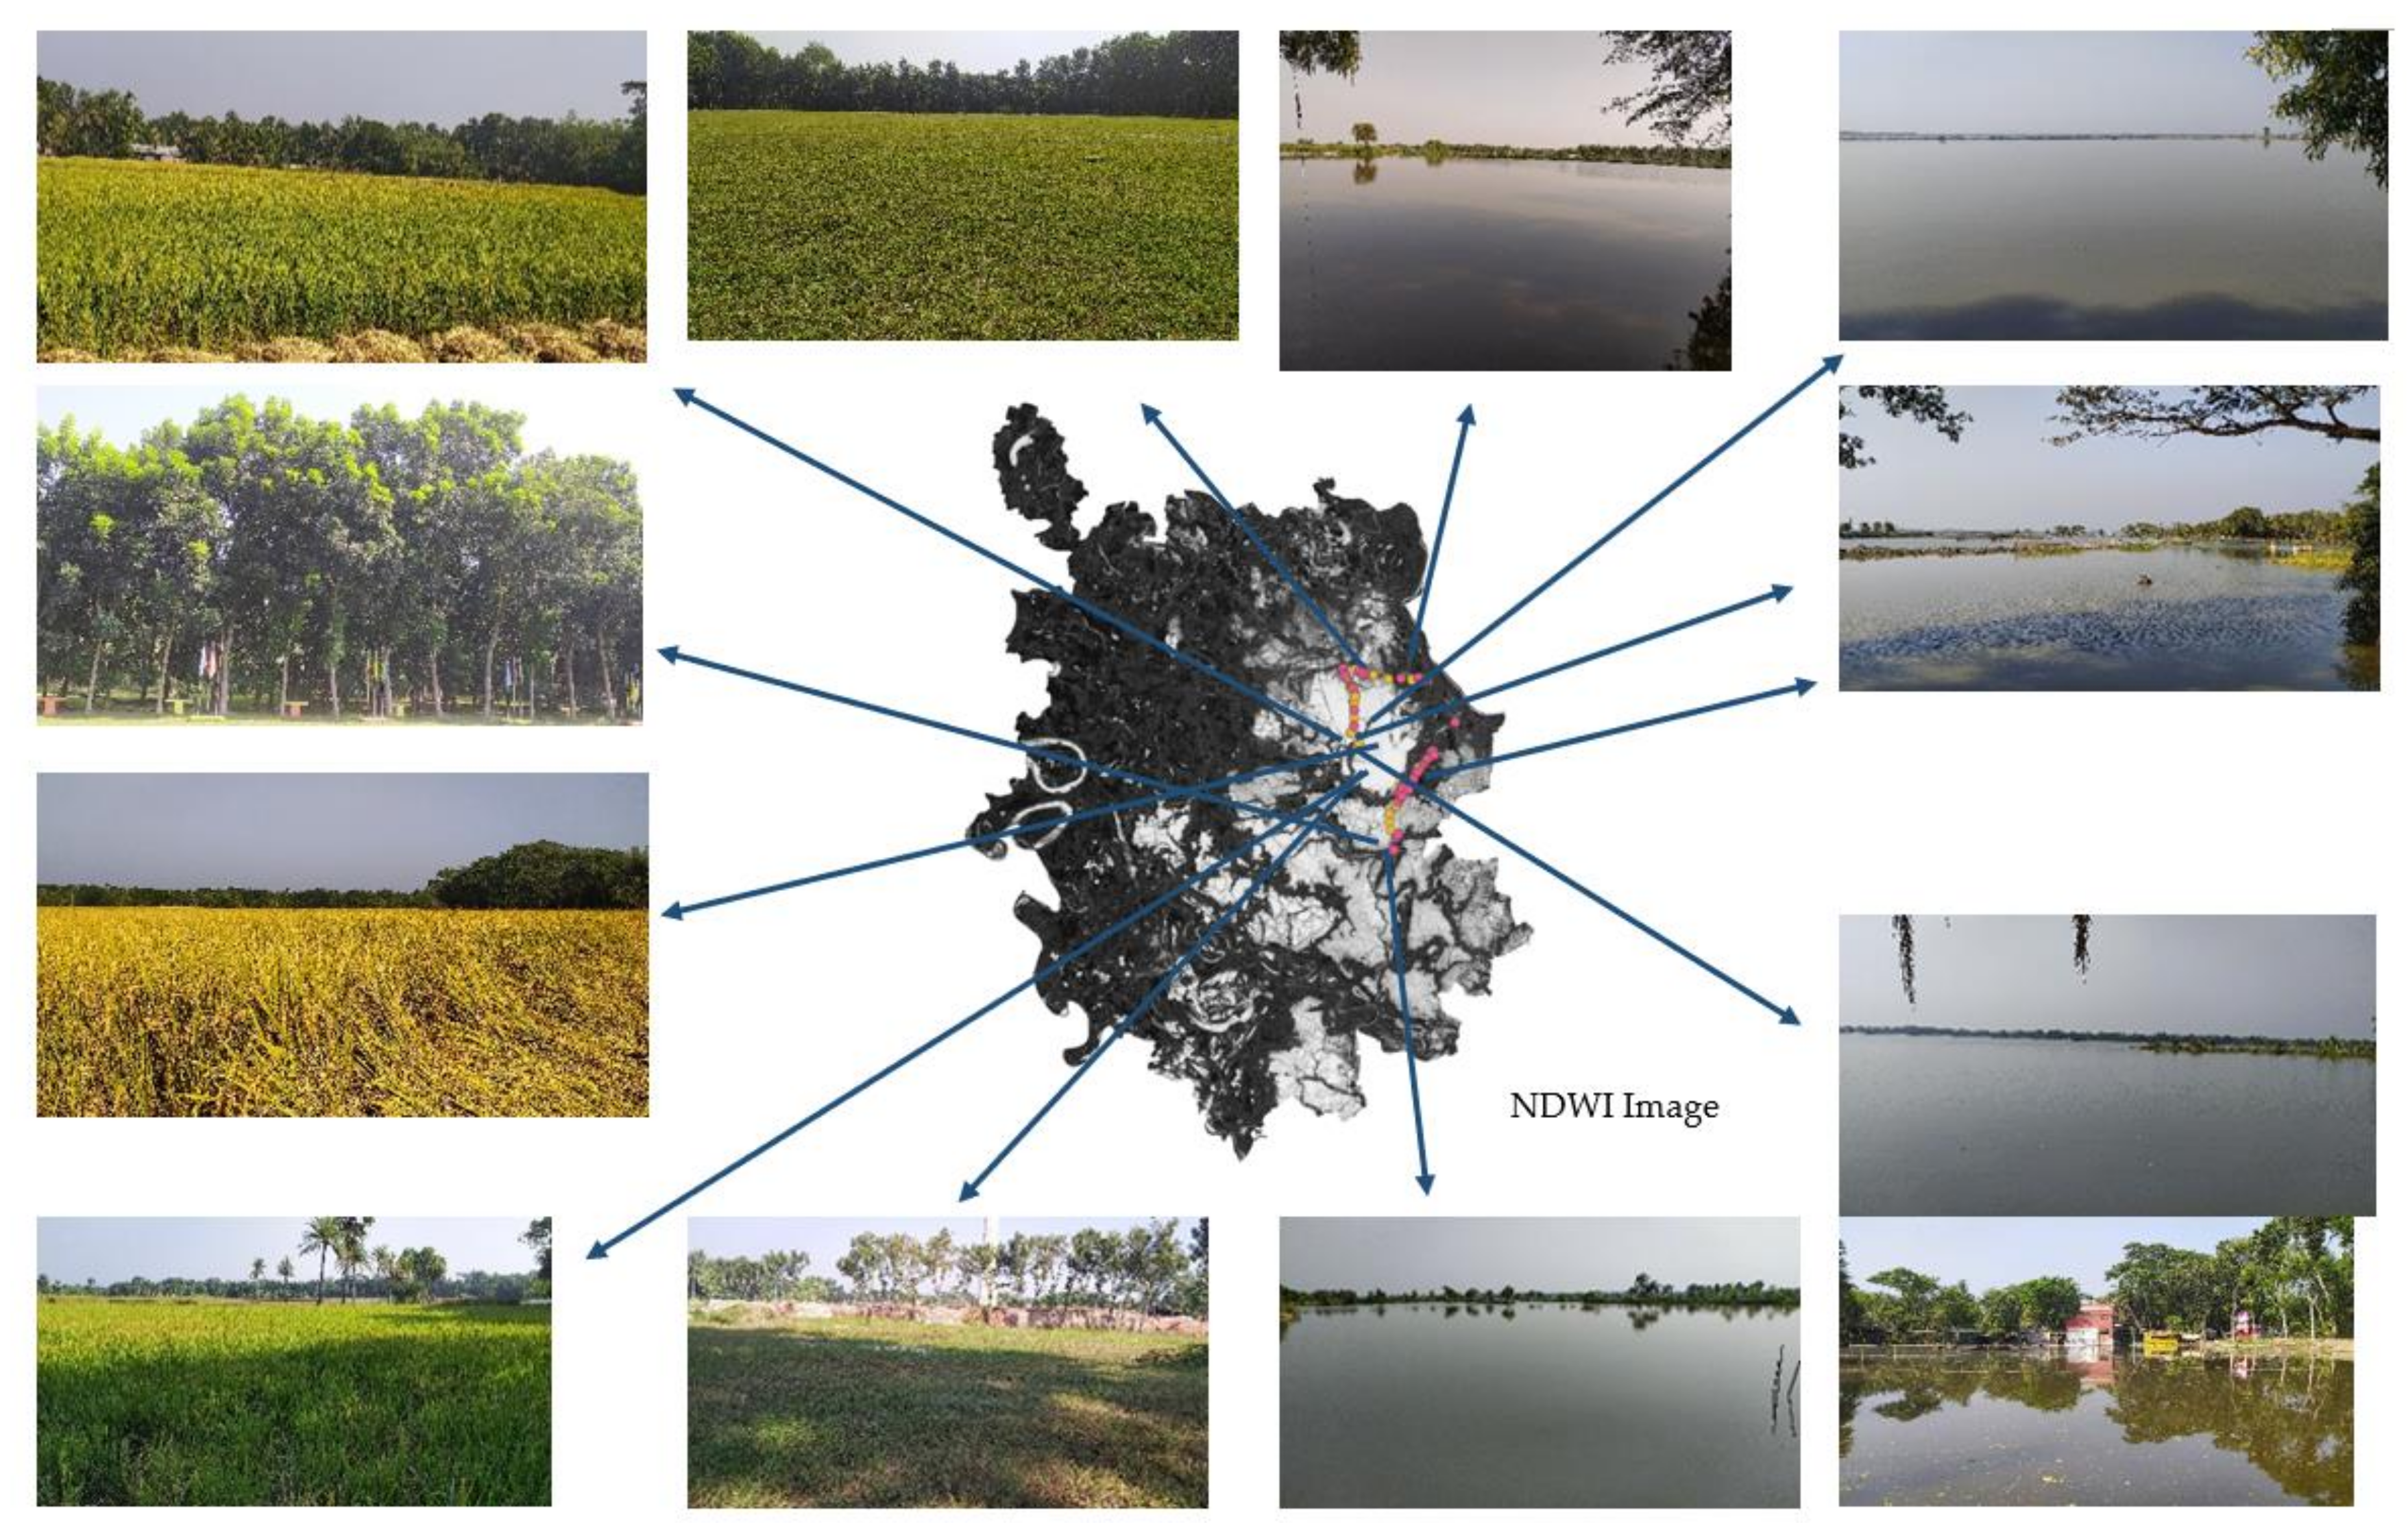
Based on the water pixel analysis and interviews, in short, the reason for widespread surface water between October and mid-November after 2001 (
Figure 10b) is the increasing trend of aquaculture, especially shrimp cultivation (
Figure 13). The source of water for the shrimp farm is local rivers, which are easy to collect from the elevated water-level during the monsoon. In study the areas the local rivers are closely connected to the Bay of Bengal, and frequently carry salty water that is suitable for shrimp farm production but not for paddy cultivation. The highest expansion of surface water observed between mid-November and early February (
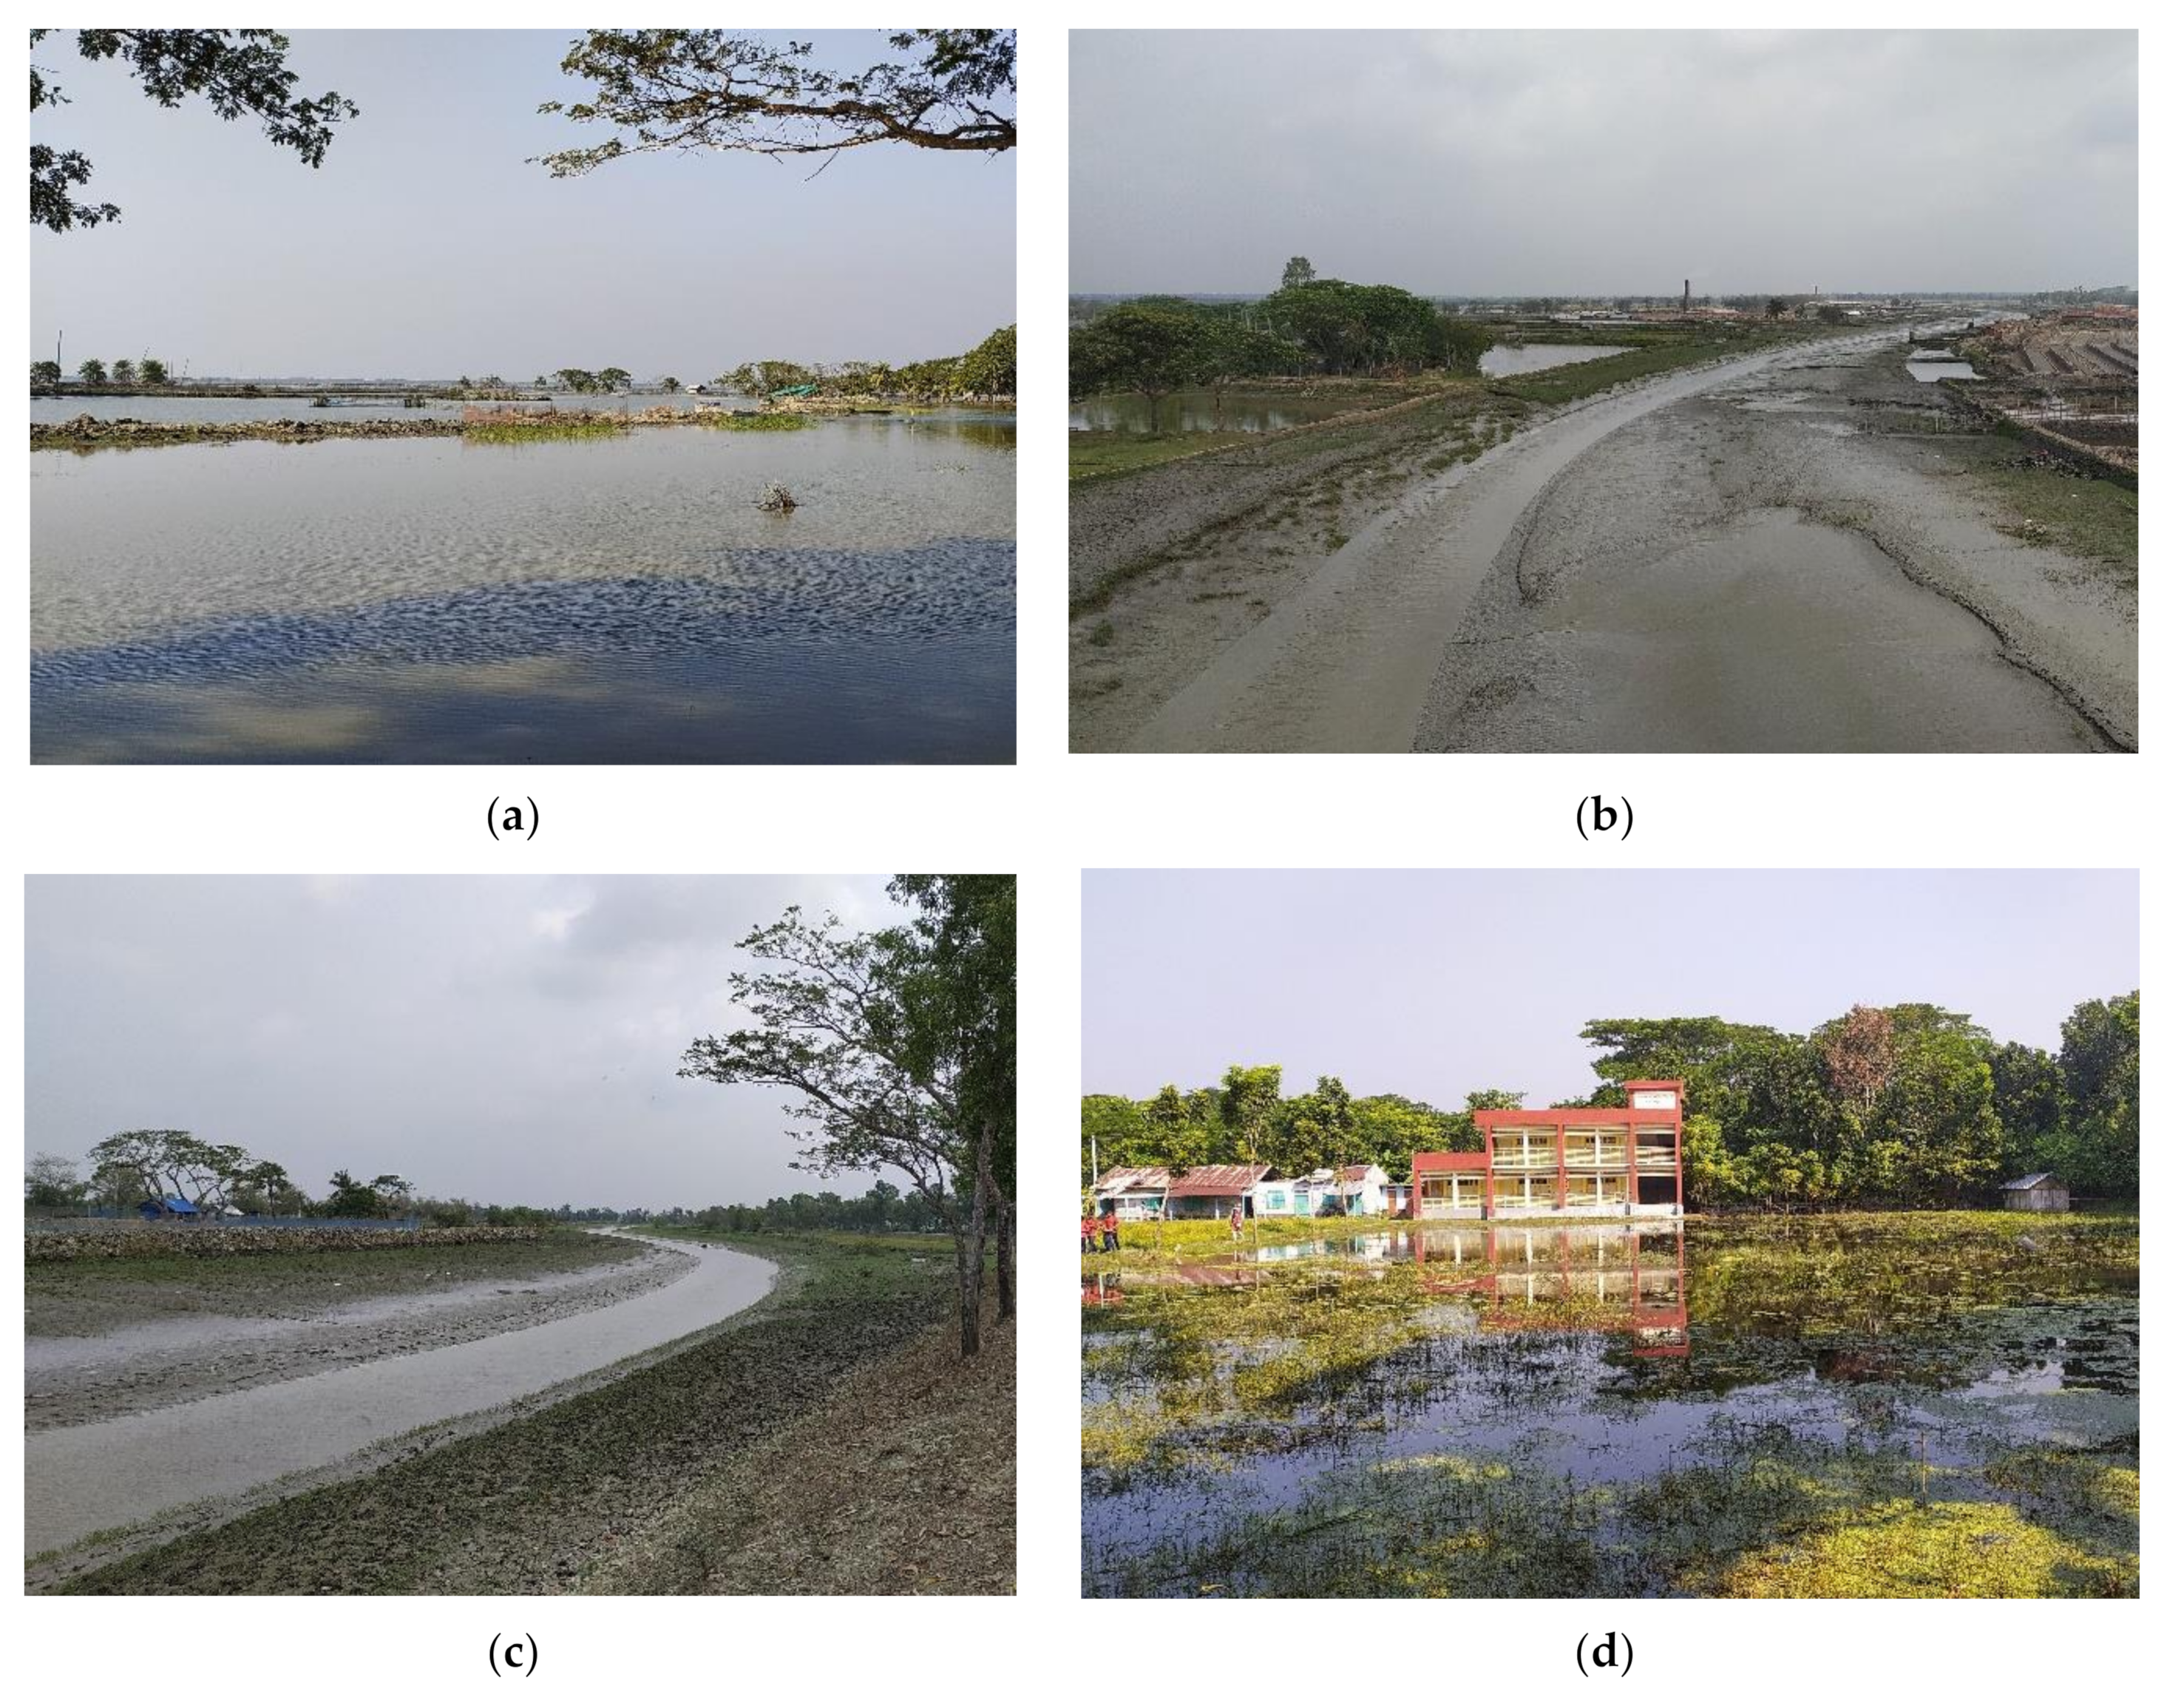
Figure 10b) was mainly because of water management by local people. The entire beel, including fish-farms, is divided by large-scale temporary embankments to discharge the surface water and reduce the water level so that the farmers are able to plant Boro rice. The interview also confirms that such water management was never needed before 2002 because the monsoon water from beel was automatically discharged through downstream rivers. This discharged water, interrupted by local canals, rivers, and downstream earthworks (
Figure 12a,b), expands in unexpected areas such as human settlements, educational institutions (
Figure 12d), and even local roads, particularly between mid-November and early February in each year from 2002 (
Figure 11b,c). During the entire Boro rice season inside the embankments, primarily, the farmers use groundwater to avoid the salty water from the shrimp farm which remains as a water reservoir. After February, gradually, the rice plant covers the study area’s cultivable land and the logged water in the local settlements dries due to evaporation and penetration into the ground because of the summer season (
Figure 11d). This study has already addressed the expansion trend of rice cultivation, which follows that of shrimp cultivation, especially after 2001 [
42,
43].


