Article

Effective Mooring Rope Tension in Mechanical and Hydraulic Power Take-Off of Wave Energy Converter

1
Center for Defense Resource Management, Korea Institute for Defense Analyses, Seoul 02455, Korea
2
Ingine Inc., Changdo Building, Seoul 03722, Korea
3
School of Mechanical Engineering, Chung-Ang University, Seoul 156-756, Korea
*
Author to whom correspondence should be addressed.
Sustainability 2021, 13(17), 9803; https://doi.org/10.3390/su13179803
Submission received: 5 July 2021 / Revised: 26 August 2021 / Accepted: 27 August 2021 / Published: 31 August 2021

Abstract

:
The InWave wave energy converter (WEC), which is three-tether WEC type, absorbs wave energy via moored cylindrical buoys with three ropes connected to a terrestrial power take-off (PTO) through a subsea pulley. In this study, a simulation study was conducted to select a suitable PTO when designing a three-tether WEC. The mechanical PTO transfers energy from the buoy to the generator using a gearbox, whereas the hydraulic PTO uses a hydraulic pump, an accumulator, and a hydraulic motor to convert mechanical energy into electrical energy. The hydraulic PTO has a lower energy conversion efficiency than that of the mechanical PTO owing to losses resulting from pipe friction and the individual efficiencies of the hydraulic pumps and motors. However, the efficiencies mentioned above are not the efficiency of the whole system. The efficiency of the whole system should be analyzed considering the tension of the rope and the efficiency of the generator. In this study, the energy conversion efficiencies of the InWave WEC installed the mechanical and hydraulic PTO devices are compared, and their behaviors are analyzed through numerical simulations. The mechanics of mechanical and hydraulic PTO applied to InWave are mathematically expressed, and the issues of the elements constituting the PTO are explained. Finally, factors to consider for PTO selection are presented.

1. Introduction

Renewable energy is an energy resource that is naturally replenished over time, such as sunlight, wind, rain, waves, and geothermal heat. Developed countries are increasing their renewable power output to reduce dependence on fossil fuels. Furthermore, higher energy conversion efficiencies have been achieved for solar and wind power generators through continued development. Solar and wind energy are the dominant forms of renewable energy resources owing to the abundant scope for harnessing them. However, wave energy has been drawing considerable research interest as it involves a higher energy density than that of the aforementioned two resources.
Salter [1] pioneered the wave energy converter (WEC), which transforms kinetic energy of the ocean waves into electrical energy. Since then, various types of WECs have been developed. Surface waves are generated by the friction between wind and surface water and possess high surface energy. Taller waves that last longer have high offshore energy. Therefore, buoys positioned offshore on the surface of the ocean can absorb large quantities of wave energy. However, the cost of laying cables from an offshore location to the land for electricity transmission is high. Furthermore, buoys located on the surface are prone to physical damage. To solve these problems, various types of WECs have been developed, but only a few WEC have achieved commercialization [2]. One of the most widespread types of WEC are the point absorbers [3,4,5]. The point absorbers consist of a floating body whose oscillating motion (heaving). A long floating body with multiple segments floats parallel with the direction of waves and acts in a similar concept as the point absorber [6,7,8]. In addition, the WEC uses the oscillating water column or terminator [9,10,11,12,13,14] it generates. As the water pressure increases, the air is forced out through the turbine, producing electrical energy.
There is a principle of the various types of PTO system to convert the movement of the buoy by the waves into electrical energy [15,16]. Both mechanical and hydraulic PTO can be applied to the three-tether WEC. There are many WEC applied mechanical PTO [17,18,19]. Mechanical PTO generated energy by the wave converter directly into electricity by rotating a generator. Therefore, the Mechanical PTO obtains more energy from wave than hydraulic PTO because of the reduced friction. However, the mechanical PTO undergoes higher load, and reliability of this type of PTO still needs to be proven.
Since wave energy operates at a low frequency, it is advantageous to use a hydraulic pump with a low rated speed [20,21,22,23]. However, the overall efficiency of hydraulic PTO is about 70% to 80% due to the efficiency of hydraulic pumps and motors [24]. The fluid flows inside the hydraulic PTO such as the hydraulic pumps and motors, accumulators and this can create hydraulic oil leakage, which can pollute the marine environment [25]. However, the PTO of InWave WEC prevents this problem due to installation on land.
Numerical studies have been conducted to analyze the efficiency of various WECs [26,27,28,29,30,31]. In this study, considerations of mechanical and hydraulic PTO selection were reviewed and suggested when designing three-tether WEC. The WEC analyzed in this study is a type using three-tether buoy. The WEC developed by INGINE Inc.(Seoul, Korea) is called InWave WEC, is deployed near the onshore to reduce the cost of laying cables and power take-off (PTO) facilities are installed on land to prevent wave-induced damage. The InWave system does not require subsea transmission cables because its power generation unit is installed onshore. In addition, it can be easily maintained because all its components except the buoy itself are installed onshore. However, these aspects are also responsible for its main disadvantage: it generates a smaller wave energy onshore than that offshore. To generate as much energy with InWave as that in the case of offshore WECs, an InWave PTO must be designed that has a higher energy efficiency than that of the existing facilities.
There exist two types of PTOs equipped in WECs: hydraulic and mechanical. The hydraulic PTO stores the energy absorbed by the buoy as hydraulic energy in the accumulator and transmits it to the generator. The mechanical PTO transfers the energy absorbed by the buoy from the waves through a mechanical device to a generator, and it is more efficient than the hydraulic PTO as its mechanism involves only minute energy losses. However, the efficiency of the PTO is not the overall efficiency of the system. The efficiency of PTO means the efficiency of transmitting the power received through the rope to the generator. Because the behavior of the WEC system varies depending on the PTO type, the magnitude of energy absorbed from the buoy movement and the generator’s efficiency must also be considered to analyze the whole system’s efficiency. In this study, simulation studies were conducted to analyze the efficiency of the InWave system when hydraulic and mechanical PTO were applied.
A simulation using subroutine was performed to update the buoy movement and rope tension data at each time step. The buoy movement due to wave was calculated in ocean domain by seaFEM solver and the behavior of rope due to the buoy movement can be computed in subroutine. The reaction force of PTO by the behavior of rope is applied as rope tension. In this simulation, the elasticity of rope is not considered. Subsequently, a numerical model that can compute the rope tension of the PTO according to the buoy movement and simulate the buoy movement due to the tension effect was constructed. Since the real ocean is an irregular wave environment, it is necessary to apply the irregular wave in the installed area to predict the generated power accurately [32,33]. However, it is difficult to analyze the detailed behavior of PTO elements in simulations with irregular waves. Since various PTO design variables need to be reviewed, simulations using irregular waves that take a long time to solve are not suitable for simulation for concept design. For example, a 16-core CPU (2.80 Hz, intel i-9) was used to perform the simulation, and it takes about 8000 s to calculate a regular wave case, while it takes about 40,000 s to calculate an irregular wave case. The results obtained in this manuscript with regular waves may be rough compared to the results obtained in irregular waves, but it would be valid and realistic for the current conceptual design phase as in other studies. Various studies have performed simulations applying regular waves in the conceptual design stage of WEC [34,35,36]. The issue on simulation with irregular waves will be dealt with in the future study. The simulations of WEC with irregular waves in the realistic [37,38,39] is usually performed in the next stage of design after the conceptual designs are completed. Therefore, the regular wave was used as boundary condition in this simulation to simplify the analysis of the results, and the characteristics of 30 regular waves were thereby simulated. The numerical model provides information on various factors influencing InWave WEC power generation, namely, the behaviors of the PTO components, rope tension, and buoy movement for both the mechanical as well as hydraulic PTOs. Subsequently, the two PTO types were compared. Specifically, the calculated rope tension values of the two PTOs were analyzed to compare their rope tension utilization rates, and finally the average efficiency of the generator in the two cases was calculated from the efficiency curve of the wave-type generator.
Through simulation, the change of WEC’s efficiency was analyzed when mechanical and hydraulic PTO were installed in InWave. Although the efficiency of hydraulic PTO was smaller than that of mechanical PTO, the whole efficiency of WEC system applied with hydraulic PTO was high. Therefore, even if the PTO efficiency is high, since the entire system’s efficiency is affected depending on the PTO type, it should be calculated considering the energy absorbed from the buoy and the generator’s behavior.

2. InWave System

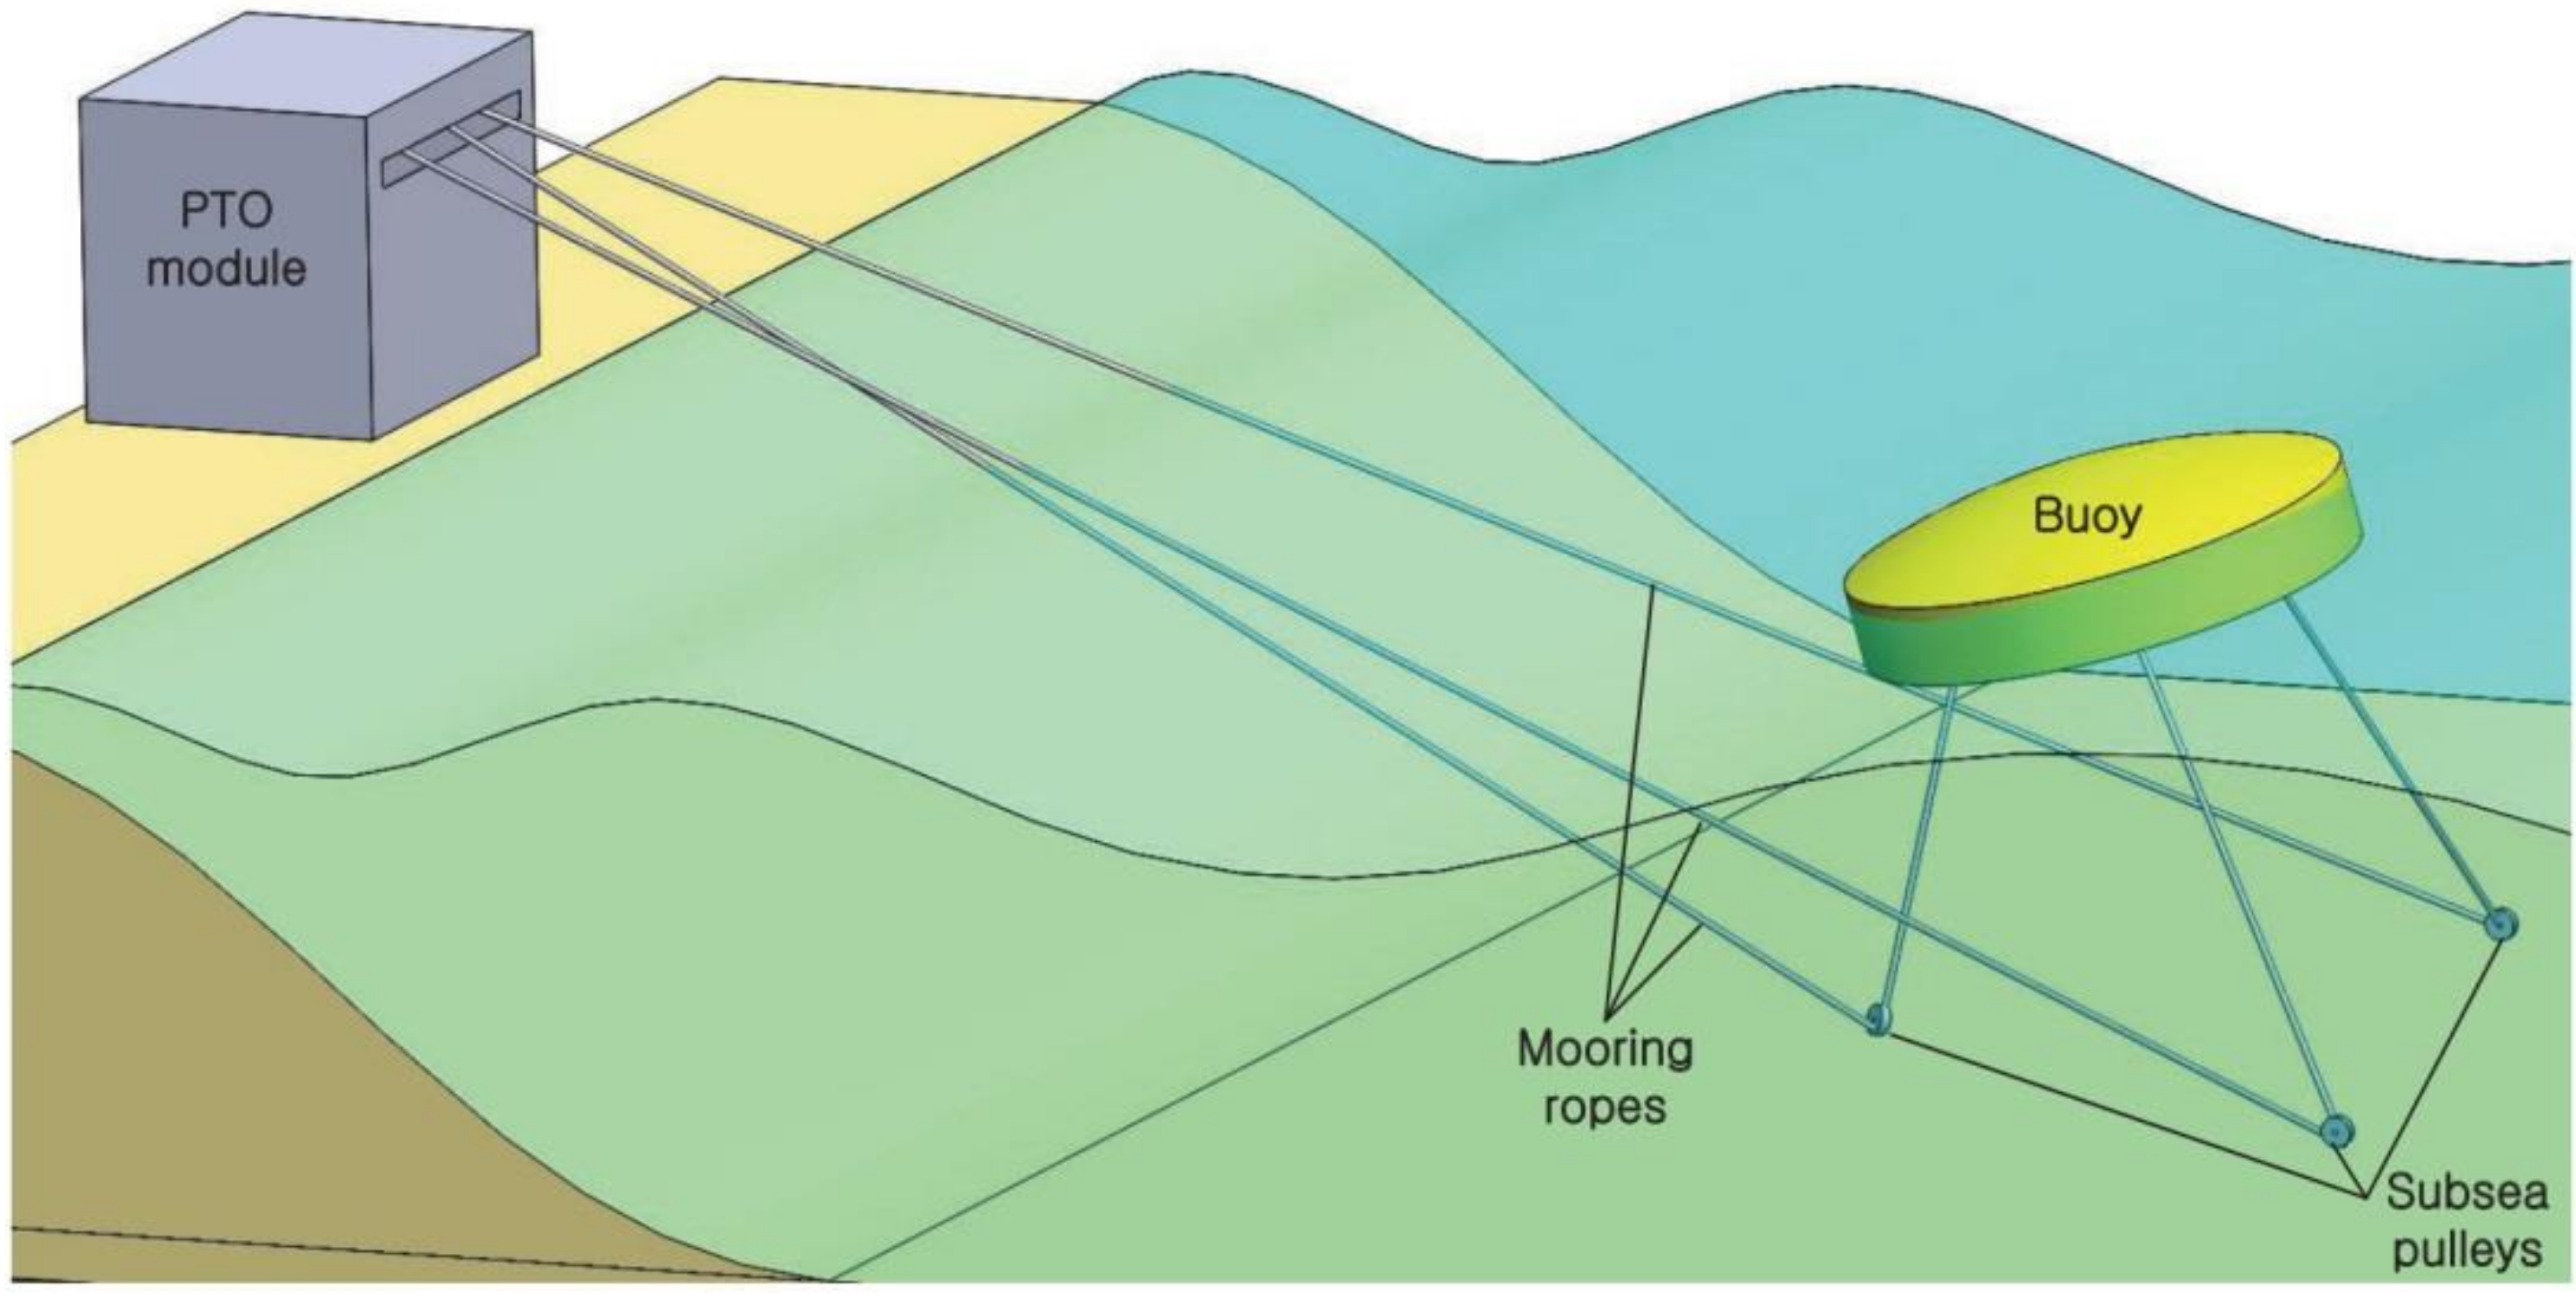
This section details the components and features of the InWave system. The system employs a cylindrical buoy with six degrees of freedom (DoF): surge, sway, heave, roll, pitch, and yaw. There are various types of WECs depending on which mode of motion is utilized to generated power (Point Absorber type–heave, Pelamis type–pitch, Oyster wec type–surge, pitch). These type of WECs are less efficient when the wave direction changes. However, three-tether type of WEC could convert all the 6 DoF into energy: the buoy is moored by a rope at 120° intervals (Figure 1).
The mooring ropes are wound on rope drums inside the onshore PTO by subsea pulleys anchored to the seabed. As the buoy is elevated by the waves, the rope rotates the rope drum, which transmits power to the generator. As the buoy descends, it rotates anticlockwise, owing to the torque of the counter-weight, and then returns to its original position. The rope drum shaft transmits power to the generator unidirectionally using a ratchet gear or a hydraulic circuit. Thus, the energy generated upon anticlockwise rotation of the rope drum is not transmitted to the generator in the restored state. The variable speed power produced by the generator is stored in the ESS (Energy Storage System) through the inverter and then transmitted to the grid power.

2.1. Mooring Rope

The InWave system transmits the motion of the buoy to the PTO through the rope. The power delivered by the rope is determined by the rope’s line speed and tension. The linear speed depends on the buoy movement, and the rope tension is determined by the torque generator in the mechanical PTO and charging pressure of the accumulator in the hydraulic PTO. If the rope is severed, the energy absorbed by the buoy cannot be transferred to the PTO. In addition, the rope is an important yet nonrecyclable component, the maintenance of which is difficult and requires sea work. Therefore, an appropriate safety design of the rope is important for the economy and efficiency of operation.
The first factor to consider in the safety design is strength. To transmit high power, the rope must be sufficiently strong. The strength of a rope is directly proportional to its thickness. Therefore, WEC designs with high power-generation capacities require thick ropes. On the other hand, thicker ropes are heavier, hence a compromise between thickness and weight should be established. Material plays a key role as well.
The second factor is the lifespan of the rope, which is determined by the diameter of the rope drum and thickness of the rope. To produce ropes that can last long, rope drums with large diameters must be used.
However, at a constant rope speed, the rotational speed of the shaft decreases as the diameter of the rope drum increases. When the rotational speed of the rope drum, a gearbox with a high ratio should be required because the generator cannot operate at rated speed. The challenges resulting from a slow shaft speed are explained in the subsequent section.

2.2. Generator

The parameters of the operating conditions required to be met to ensure safe and efficient operation of a generator in the manufacturer’s specifications are appropriate rated current, voltage, torque, and rotational speed. If these specifications are not met, the generator may not perform efficiently, or it may fail altogether. Therefore, for the stable operation of a generator, the PTO design must conform to the generator rated value; alternatively, a generator suited to the PTO must be selected.
A generator is a machine that can be fabricated easily using commercial components with various specifications. Based on the generator’s capacity, the PTO can either have a low-rated velocity—high-rated torque or a high-rated velocity—low-rated torque configuration. Because the rope drum of the InWave WEC rotates at a low speed (<10 rpm), the power cannot be directly transmitted to the generator. The mechanical PTO uses a gearbox to accelerate the slow rope drum to enable power transmission to the generator. A generator with a low-rated velocity is suitable for this purpose; however, it has a large moment of inertia, which warrants a large torque to rotate the shaft. Additionally, because the tension caused by inertia is proportional to the square of the gear ratio, selecting a generator with suitable specifications is critical. A generator is highly efficient when it is operated below the rated torque and velocity conditions. Therefore, the generator for the intended purpose must be selected by analyzing the operating conditions suitable for the characteristics of the most frequent type of wave in the installation area. However, tall waves cause the buoy to transmit excess rotational speed to the generator, which damages the generator. Damage to the generator not only increases maintenance costs, but also WEC could not generate electricity. In addition, in mechanical PTO, it is complicated to replace the generator only when the movement of the buoy must be stopped. In addition, high energy conversion efficiency can only be achieved for moments close to the rated velocity.
In the hydraulic PTO, the power transmitted from the rope drum is stored in the accumulator and then released, and this PTO is therefore free from the above-mentioned disadvantages. Power from this PTO can be transmitted to the generator at a constant speed through the variable displacement of the hydraulic motor and accumulator control.

3. Numerical Model

The commercial package seaFEM, which can be employed to analyze floating bodies in the marine environment, was used to simulate the WEC behavior. SeaFEM includes a state-of-the-art radiation and diffraction BEM and FEM solver, enabling frequency domain and direct time-domain analyses of the dynamic response of the structure [41]. The buoy’s motion was simulated in the time-domain using the FEM solver. The radiation and diffraction problems are solved based on potential flow theory. The seaFEM provides the forces and moments acting over the buoy and movements, velocities, and accelerations referred to the gravity center of the buoy. In this study, the PTO behavior was expressed only by a mathematical model. The movements of the rope and the behavior of PTO components were calculated using the movements data of the buoy provided by the seaFEM solver. For each time step, seaFEM transfers the buoy’s 6-DoF motion to the mathematical model (PTO model), which in turn calculates the linear velocity of the rope and simulates the behavior of the PTO components. The rope tension calculated in mathematical model (subroutine) was returned to seaFEM as external load applying on the floating body (connection points). The model equations used in this simulation are detailed in the next section.

3.1. Rope Vector

The magnitude and direction vector of the tension were calculated to simulate the behavior of a buoy under rope tension. First, the direction vector was calculated from the position of the point on the buoy, to which the rope was tethered, and the position of the subsea pulley. SeaFEM provides information on the wave-induced buoy movement as 6 DoF (surge, sway, heave, roll, pitch, yaw) of the buoy’s central coordinates. The mooring point’s position coordinates were calculated using the translational and rotational matrices of the relative position vector between the buoy center and mooring point.
Equation (1) represents the rotational matrix.
R = R z α R y β R x γ = cos ( α ) sin ( α ) 0 sin ( α ) cos ( α ) 0 0 0 1 cos ( β ) 0 sin ( β ) 0 1 0 sin ( β ) 0 cos ( β ) 1 0 0 0 cos ( γ ) sin ( γ ) 0 sin ( γ ) cos ( γ )
The connection point coordinates of the (i + 1)th time step by rotation are expressed as follows.
P i + 1 = R z α R y β R x γ C P i   .   α = d r z , β = d r y , γ = d r z
In Equation (3), dR is the displacement caused by rotation during one time step.
d R = C P i + 1 C P i
The position of the mooring point in the global coordinate system considering the buoy’s central displacement (dx, dy, dz) is expressed as follows.
G C P i + 1 = G C P i + d x d y d z + d R
The ith length of the rope l i , the speed of the rope d l i / d t , and acceleration of the rope d 2 l i / d t 2 is calculated as follows.
L i = X S P i X C P i   for   i = 1 , 2 , 3
l i 2 = L i 2 = ( X S P i X C P i ) T X S P i X C P i
d l i d t = 1 l i ( X S P i X C P i ) T X ˙ C P i
d 2 l i d t 2 = 1 l i ( X S P i X C P i ) T X ¨ C P i + 1 l i ( X ˙ C P i ) T X ˙ C P i 1 l i d l i d t 2
The rotational speed of the shaft according to the rope drum diameter can be calculated from the linear velocity and acceleration of the rope. The rotating body and the generator are rotated by the rope drum, generating rope tension. On one hand, underestimating the tension would yield less than the expected power, resulting in unexpected damages to the rope and generator of the WEC system. On the other hand, overestimating the rope tension would result in unnecessarily advanced WEC configurations and consequently high installation costs. Therefore, the rope tension must be accurately predicted to reasonably evaluate the economic feasibility and stability of the WEC. The equations for modeling the behavior of components and calculating the rope tension are presented in the next section.

3.2. Mechanical Power Take-Off (PTO)

The factors that induce tension in the rope can be classified as counter mass, moment of inertia, and generator torque. First, the counter mass applies tension in the rope both on the generation and restoration states. In this case. the rope tension can be calculated from the value of the counter mass, acceleration due to gravity, and linear acceleration of the rope.
The ith rope tension from the counter mass ( M C W , i ) is expressed as follows.
T C W , i = M C W , i × ( g + l ¨ i )
The moment of inertia of the rotating components in the PTO induces tension in the rope. The rotating elements in the mechanical PTO are the rope drum, gear, and generator, and they generate a tension proportional to the square of the gear ratio in the rope. This rope tension is expressed as in Equation (10).
T i n e r t i a = J s y s θ ¨ s y s = J 1 , i θ ¨ 1 , i + R g e a r , i J 2 , i θ ¨ 2 , i = ( J 1 , i + R g e a r , i 2 × J 2 , i ) θ ¨ 1 , i
where J2 is the moment of inertia about the elements influenced by the gearbox such as the generator shaft, flywheel to smooth the velocity of generator also the moment of inertia of generator. The last rope tension-inducing factor is the generator torque. The generator rotates when the power transmitted equals the torque generated. The generator torque can be set by the user. It can be expressed as a constant, curve, or function. If the initial generator torque equals the rated torque, a high impact load is generated at the initial generation. Figure 2 illustrates the torque curve, in which the torque is increased by increasing the rotational speed. If the generator rotates over the rated speed in the rated torque condition, it will produce over-electricity and cause damage to the generator. Therefore, to avoid the situation, the rated torque should be reduced if the generator speed exceeds the rated speed. Figure 2 shows the shape of the torque curve applied in this study.
The technician can adjust the torque curve of the generator as per the requirement. Although the torque curve affects the behavior of both the generator and buoy, the numerical analysis in this study was performed with only one torque curve. The ith rope tension due to the generator torque is expressed as follows.
T G e n , i = J G e n , i R g e a r , i 2 θ ¨ 1 , i + τ G e n , i ( θ ˙ 2 , i ) R g e a r , i / r d r u m , i

3.3. Hydraulic PTO

The hydraulic PTO uses the same rope drum and counter-weight as the mechanical one does. In addition, it uses a hydraulic circuit for energy transfer. Figure 3 shows a schematic of the hydraulic PTO. This section details the energy transfer process of the PTO mechanism and rope tension calculation.
As the buoy is lifted by the waves, the rope rotates the rope drum and the hydraulic pump in the same shaft, which charges the accumulator. The accumulator transmits the stored power to the generator through a hydraulic motor, producing electricity. The accumulators alternately charge, standby, and release energy to deliver energy to the generator, causing the generator to rotate continuously. The charging, standby, and discharge processes can be controlled by installing solenoid valves and pressure sensors at the inlet and outlet of the accumulator.
As with the mechanical PTO, the hydraulic mechanism is also divided into restoration and power-generation states. The counter mass applies tension on the rope in both the states, whereas the accumulator applies tension only in the power-generation state.
The rope tension required to fill the accumulator with the operating oil is expressed as follows.
T A c c = τ h y d r o , i r d r u m , i = P b a r × d i s p h y d r o , i c c / r e v 20 × π × r d r u m , i
All parameters except for the internal pressure of the accumulator are kept constant. The internal pressure, and consequently the rope tension, increases as the operating oil is filled. To reflect this trend in the simulation, the filling flow rate was calculated according to the rotational displacement of the rope drum for each time step. The buoy was subjected to rope tension according to the pressure gradient inside the accumulator.
The rope tension induced by the internal pressure gradient of the accumulator is derived using Equations (13)–(16).
V ˙ j i n , i = d i s p c c / r e v × θ ˙ j d r u m , i
V j + 1 N i t = V j N i t V ˙ j i n , 1 + V ˙ j i n , 2 + V ˙ j i n , 3 × t s t e p
P j + 1 = C o n s t P V / V j + 1 N i t
T A c c = τ r d r u m , i = P j + 1 b a r × d i s p i c c / r e v 20 × π × r d r u m , i

4. Analysis

This section details the boundary conditions and parameters of the InWave simulation and presents the results. We used seaFEM to analyze the hydrodynamic behavior of the WEC.

4.1. Simulation Parameters

This section describes the components of the PTO mechanism used for the simulation and the parameters of the marine environment. The buoy used in the InWave system is a cylinder. The designs of the mechanical and hydraulic systems of the system, except for the PTO device, are the same. Table 1 lists the design factors common to the mechanical and hydraulic systems. Total simulation time is 120 s, and the initialization time that the wave amplitudes will be increased smoothly from to zero to avoid long transient behaviors is 30 s. The size of a time step is 0.01 s.
The FEM model used for the simulation had approximately 64,102 nodes and 360,000 elements (Fluid domain-tetrahedral 3D elements, Surface domain-trigonal 2D elements) [41] (Figure 4). In consideration of the wavelength and depth of the waves, the element size recommended by seaFEM was applied, and the analysis area around the buoy was densified to construct the FEM model. The mesh size should be no larger than one fifth of the smallest wavelength. Recommended value, at least, one tenth. Mesh size at the outlet should be no larger than one fifth of the distance to the reference point. Mesh size at the portion of the bottom located right below the body should be no larger than one fifth of the computational depth [42]. The meshes of the buoy and analysis areas were created denser than the recommended size. The analysis area includes all area where the buoy moves.
SeaFEM supports both regular and irregular waves; however, in this study, the behavior was simulated using regular waves, which eases analysis of the results. Table 2 lists the characteristics of the regular waves used in this simulation.

4.2. Design of PTO

This section explains the design parameters of the PTO mechanisms. The main variables in the mechanical PTO are the gearbox and the generator. The gearbox was used to accelerate the rotational speed (2–10 rpm) of the rope drum to the rated speed of the generator. The rope tension generated by the moment of inertia increases in proportion to the square of the gear ratio. Therefore, it is advantageous to use a generator with a low-rated speed. However, this would render installation infeasible owing to the large size of the generator with low-rated speeds and increase the moment of inertia. Therefore, the engineer must select an optimal generator. The mechanical PTO uses three gearboxes and three generators as each rope is connected to one generator. Table 3 lists the generator specifications and gear ratio used in this simulation.
The main components of a hydraulic PTO are the hydraulic pump, accumulator, and hydraulic motor. The pump and motor ensure high efficiency even at low speeds, eliminating the need for a gearbox. This PTO counters the seasonal variations of waves by controlling the maximum and minimum pressure inside the accumulator. As the accumulator is charged and transfers energy to the generator, the generator can operate in a steady state at the rated speed. Because the hydraulic PTO stores the energy transferred from the ropes in the accumulator and delivers it to the generator, it requires fewer generators and electrical equipment than the mechanical PTO does. Table 4 summarizes the specifications of the hydraulic components used for the simulation, for calculation of the energy conversion efficiency of the hydraulic system.

4.3. Results

The simulation model developed in this study provides information on the behavior of the buoy, generator, rope drums, and ropes. In order to compare the efficiency of the WEC system, it is necessary to analyze the energy obtained from the buoy (= rope tension) and the behavior of the generator that converts it into electrical energy. For this, the simulation result was analyzed by calculating the average tension for 1 min (45 s to 105 s) and presented in Table 5, Table 6, Table 7 and Table 8. In addition, some cases (12, 14, 22, and 24) are graphically expressed to show the behavior of generator and rope tension.

4.3.1. Behavior of Drum

Figure 5 illustrates the rotational speed of the rope drum of the mechanical and hydraulic PTO. Although varying under the same wave condition owing to the difference in tension produced by the two PTOs, the rotational speed exhibits a regular wave behavior. The shorter the wave period and the taller the wave, the higher the rotational speed. In Figure 5, rope drums 2 and 3 have the same rotational speed because of their symmetry in the wave direction. However, in CASE22 (2.5 m, 6 s), the buoy rotated in the yaw direction. In the mechanical PTO, a rope drum rotates the generator via a gearbox. In the hydraulic PTO, hydraulic oil is filled in the accumulator up to the same height as the rotation displacement by rotating the hydraulic pump. The rotation of the rope drum in the mechanical PTO transmits the rotational motion unidirectionally using a ratchet gear. The hydraulic PTO does not require a ratchet gear because of the bypass of its hydraulic circuit.

4.3.2. Rope Tension

Figure 6 depicts the tension in Rope 1. The effective tension of the rope is the tension required to produce electrical energy. As mentioned earlier, the rope tension of the mechanical PTO includes the tension due to counter mass, moment of inertia of the rotating body, and generator torque. The rope tensions resulting from the counter mass and the moment of inertia act in both the power generation and restoration states. However, rope tension due to the generated torque arises only in the power generation section. The torque of the generator conformed to the torque curve input to the generator. The rope tension due to the torque increased as the rotational speed increased.
In the hydraulic PTO, the counter mass, moment of inertia of the rotating body, and charge of the accumulator contribute to the total rope tension. As the accumulator is filled with oil, its internal pressure increases, and the rope tension gradually increases. When the internal pressure reaches the maximum value, it is transferred to another accumulator via the hydraulic circuit (via the action of the pressure sensor and solenoid valve) and converted into rope tension by the minimum pressure. Several accumulators are used to charge and discharge the circuit.
Among these tensions, the rope tension converted into electrical energy in the generator is the rope tension caused by the generator torque in the mechanical PTO and the rope tension required to charge the accumulator in the hydraulic PTO.
Figure 6b illustrates the tensile vibration at the point where the wave commences and ends the ascent of the buoy. This phenomenon is explained as follows: the brief movement of a floating body results from insufficient rope tension to charge the accumulator. This phenomenon occurs when the accumulator is charged with high pressure, confirming the need to install accumulators as damper in the hydraulic circuit. Table 5 and Table 6 list the results of rope tension for 60 s (45–105 s) of CASES 1–30.
The average rope tension over the analysis time was calculated. The ratio of the rope tension to the allowable strength of the rope was defined as the available tension.
In the mechanical PTO, the generator cannot rotate at the rated speed if the wave is short, so the rope tension availability rate is low. In the hydraulic PTO, the accumulator takes a long time to charge at short waves, but the effective tension increases as the internal pressure of the accumulator increases. Further, the ratio of rope tension required to produce electricity from the available tension was defined as the effective tension.
Under most wave conditions, the InWave system with a hydraulic PTO has more available tension. As the rotational speed of the drum in the mechanical PTO matches the rated speed of the generator, the tension availability ratio approaches that of the hydraulic PTO. Meanwhile, the hydraulic PTO is prone to pipe friction; however, if pipe friction does not significantly reduce the efficiency, this PTO device can generate more power than that in the case of the mechanical one.

4.3.3. Efficiency of Generator

As stated in the previous section, generator efficiency is guaranteed at the rated speed and torque. Failure to meet this condition reduces the energy conversion efficiency, thereby reducing the power output. Figure 7 illustrates the efficiency with respect to the rotational speed of the generator. As shown in Figure 7a, the generator’s efficiency decreases sharply under operation at 50% or less of the rated speed.
Figure 7b,c show the generator behavior in CASE16 and CASE23. In CASE16, the generator operates at the rated speed (450 rpm), but the time—exceeding 50% of the rated speed—is 68.2% of the generation time of one cycle.
Table 7 classifies the energy conversion rate of the generator per the wave condition. As in CASE16, when the generator is operated near the rated speed, the energy conversion rate is more than 90%. However, the energy conversion rate plummets for short waves with long periods.
In the hydraulic PTO, the generator operates by rotating the hydraulic motor with the oil charged in the accumulator. As the accumulator alternately charges and discharges, if the charging time is shorter than the discharging time, the generator should continue to run at the rated speed in theory. Even for short waves, the accumulator can be rotated at the rated speed by waiting until it is fully charged. Additionally, in situations inconducive to power generation, the standby power can be reduced by switching the power generation unit to sleep mode while charging the accumulator.

5. Discussion

5.1. Comparison between Mechanical and Hydraulic PTO

In this study, the energy conversion efficiencies of mechanical and hydraulic PTOs were calculated via numerical simulations. First, the rope tension was computed and used to calculate the energy obtained from the buoy movement. Table 8 lists the results of the comparison of the rope tension availability rate between the mechanical and hydraulic PTO devices. The rate is higher for hydraulic PTOs under most wave conditions, especially under a low wave height and long cycle, where it was more than six times higher. Using a gearbox with a high gear ratio increases the availability rate in the mechanical PTO. However, the maximum tension also increases, whereby the allowable strength of the rope is exceeded, which poses the risk of damage to the generator. In some wave conditions, the generator rated speed exceeded 150%, and the calculated tension was higher than the allowable tension of the rope. Therefore, it is necessary to design the PTO device according to the wave characteristics common in the installation area.
The mechanical PTO design recommended in this study is suitable for a wave height of 2.0–2.5 m. Even under wave conditions with a short period, where the mechanical PTO is suitable, the availability rate is similar to that with the hydraulic PTO. The availability rate with the hydraulic PTO is higher under long cycle conditions. In addition, the generator efficiency with the mechanical PTO is less than that with the hydraulic PTO because the generator cannot rotate at a constant velocity. Considering this behavior, even with the energy conversion efficiency (70–80%) [43] of the common hydraulic PTO, the WEC installed hydraulic PTO would be more efficient.
However, this conclusion is valid when WEC is installed on the site where the wave characteristics of 30 cases are uniformly distributed. In some wave characteristics, the efficiency of mechanical PTO is higher, considering the efficiency of 70–80% of hydraulic elements. Therefore, it is necessary to apply the PTO type suitable for three-tether WEC by analyzing the wave characteristics of the installation area. We suggested strengths and weakness for mechanical and hydraulic PTO.
  • Mechanical PTO
    • Transfers the energy using components (gears, shaft) with high efficiency
    • Easier maintenance of components compared to hydraulic PTO.
    • Has a risk of generator breakage in high waves due to transfer wave energy directly to the PTO.
    • Once installed, it is difficult to change the components, so it cannot adequately respond to the seasonal wind.
  • Hydraulic PTO
    • The energy transferred from the buoys through the hydraulic circuit is stored in the accumulator, requiring fewer generators.
    • Can respond to seasonal wind through control using the hydraulic circuit.
    • It is safe from unexpected high waves as it drains energy through a bypass of the hydraulic circuit.
    • Energy loss occurs due to the components of the hydraulic circuit.
  • Consideration
    • The wave characteristics of the site where the WEC will be installed should be analyzed.
    • Under each wave characteristic, the energy conversion efficiency of the entire WEC system with mechanical or hydraulic PTO must be calculated.
    • The energy loss due to the hydraulic circuit (friction of pipeline, hydraulic pumps, and motors) must be calculated rationally, and efforts to reduce the loss are required.
    • By calculating the expected annual electricity production, a more efficient WEC should be selected.

5.2. Limitations

The energy conversion efficiency of a WEC is influenced by various factors in addition to rope tension and generator operation.
In the mechanical PTO, these factors pertain to ratchet gears, gearbox efficiency, and friction losses. In the hydraulic PTO, these factors are associated with hydraulic pumps, accumulators, hydraulic motors, and valves in hydraulic circuits. The efficiency of the hydraulic elements and pipe friction reduce the energy conversion rate. Therefore, a detailed analysis considering these conditions is necessary to accurately compare the efficiency of the PTOs.
However, the numerical model in this study is that of a conceptual PTO. A detailed design (component specifications, circuit design) should be conducted considering these conditions. In the future, to calculate the exact energy conversion rate, a numerical model considering the detailed design including the frictional effects must be constructed.

6. Conclusions

In this study, a seaFEM model was constructed to analyze the behaviors of the mechanical and hydraulic PTO and design a PTO for the InWave WEC. To calculate the energy input required by the PTO, the tension of the rope transferring kinetic energy from the buoy movement was calculated. In addition, the behavior of the generator was analyzed to calculate the average efficiency according to the generator operation status.
The buoy motion was simulated under the wave conditions of 0.5–3.0 m (height) and 4–12 s (period) (CASE30). Thus, the behavior of the main components was simulated, and the average availability of rope tension was calculated.
The effective tension converted into electrical energy is relatively similar from 2.0–3.0 m, but the longer the cycle, the larger the effective tension in the hydraulic PTO. In the mechanical PTO, the wave-induced buoy motion directly affects the rope tension and generator behavior. Therefore, the rotation of the rope drum must be maintained under a condition conducive to generator operation. However, in the hydraulic PTO, if a small degree of movement in the buoy can generate sufficient buoyancy, the buoy will absorb the energy and transfer it to the accumulator of the PTO. In addition, the hydraulic PTO has a higher energy conversion efficiency than that of the mechanical PTO because its generator can operate at the rated speed for a long time.
The mechanical PTO presented in this study is an initial model of InWave WEC. By constructing and operating InWave WEC (mechanical PTO) on a real scale, the limitations of mechanical PTO were confirmed. Therefore, hydraulic PTO was designed as shown in Figure 3 to design WEC with higher efficiency. Although the efficiency of hydraulic PTO is low, it was confirmed in this study that it can produce more electricity than WEC installed with mechanical PTO. WECs equipped with mechanical PTO, which were previously presented in other research, can expect higher electricity production if mechanical PTO is changed to hydraulic PTO like the InWave model. However, depending on the characteristics of the wave, mechanical PTO may be more appropriate, so it is necessary to review both mechanical and hydraulic PTO.
However, the total energy-conversion efficiency of the WEC system is affected by the rope tension and generator efficiency, as well as the efficiency of the friction and hydraulic-circuit components. Therefore, it is necessary to construct a more inclusive numerical model. In future research, a numerical model considering the detailed design should be designed and the corresponding PTO characteristics under irregular wave conditions should be analyzed.

Author Contributions

Y.J.S. made a device; J.W.N. conceived and designed the simulations; J.W.N. performed the simulations; J.W.N. and S.W.C. analyzed the data; J.W.N. and S.W.C. wrote the paper. All authors have read and agreed to the published version of the manuscript.

Funding

This research was funded by the Basic Science Research Program through the National Research Foundation of Korea (NRF) funded by the Ministry of Education (No. 2018R1D1A1A09084287).

Institutional Review Board Statement

The study was conducted according to the guidelines of the Declaration of Korea, and approved by the Institutional Review Board of Chung-Ang University.

Informed Consent Statement

Informed consent was obtained from all subjects involved in the study.

Data Availability Statement

Not applicable.

Conflicts of Interest

The authors declare no conflict of interest.

References

  1. Salter, S.H. Wave power. Nature 1974, 249, 720–724. [Google Scholar] [CrossRef]
  2. Penalba, M.; Ringwood, J.V. A review of wave-to-wire models for wave energy converters. Energies 2016, 9, 506. [Google Scholar] [CrossRef] [Green Version]
  3. Mann, L.D. Application of ocean observations & analysis: The CETO wave energy project. In Operational Oceanography in the 21st Century; Springer: Berlin/Heidelberg, Germany, 2011; pp. 721–729. [Google Scholar]
  4. Weber, J.; Mouwen, F.; Parish, A.; Robertson, D. Wavebob—research & development network and tools in the context of systems engineering. In Proceedings of the Eighth European Wave and Tidal Energy Conference, Uppsala, Sweden, 7–10 September 2009; pp. 416–420. [Google Scholar]
  5. Edwards, K.; Mekhiche, M. Ocean power technologies powerbuoy®: System-level design, development and validation methodology. In Proceedings of the Marine Energy Technology Symposium, Seattle, DC, USA, 15–17 April 2014. [Google Scholar]
  6. Lucas, J.; Livingstone, M.; Vuorinen, M.; Cruz, J. Development of a wave energy converter (WEC) design tool–application to the WaveRoller WEC including validation of numerical estimates. In Proceedings of the 4th International Conference on Ocean Energy, Dublin, Ireland, 17–19 October 2012. [Google Scholar]
  7. Whittaker, T.; Folley, M. Nearshore oscillating wave surge converters and the development of Oyster. Philos. Trans. R. Soc. A: Math. Phys. Eng. Sci. 2012, 370, 345–364. [Google Scholar] [CrossRef] [PubMed] [Green Version]
  8. Cameron, L.; Doherty, R.; Henry, A.; Doherty, K.; Van’t Hoff, J.; Kaye, D.; Naylor, D.; Bourdier, S.; Whittaker, T. Design of the next generation of the Oyster wave energy converter. In Proceedings of the 3rd International Conference on Ocean Energy, Bilbao, Spain, 6–8 October 2010; p. 1e12. [Google Scholar]
  9. Antonio, F.d.O. Wave energy utilization: A review of the technologies. Renew. Sustain. Energy Rev. 2010, 14, 899–918. [Google Scholar]
  10. Takahashi, S.; Nakada, H.; Ohneda, H.; Shikamori, M. Wave power conversion by a prototype wave power extracting caisson in Sakata port. Coasta. Eng. 1992, 1993, 3440–3453. [Google Scholar]
  11. Brito-Melo, A.; Neuman, F.; Sarmento, A. Full-scale data assessment in OWC Pico plant. Int. J. Offshore Polar Eng. 2008, ISOPE-08-18-1-027. [Google Scholar]
  12. Torre-Enciso, Y.; Ortubia, I.; De Aguileta, L.L.; Marqués, J. Mutriku wave power plant: From the thinking out to the reality. In Proceedings of the 8th European Wave and Tidal Energy Conference, Uppsala, Sweden, 7–10 September 2009; pp. 319–329. [Google Scholar]
  13. Arena, F.; Romolo, A.; Malara, G.; Ascanelli, A. On design and building of a U-OWC wave energy converter in the Mediterranean Sea: A case study. In Proceedings of the International Conference on Offshore Mechanics and Arctic Engineering, Nantes, France, 9–14 June 2013; p. V008T009A102. [Google Scholar]
  14. Naty, S.; Viviano, A.; Foti, E. Wave energy exploitation system integrated in the coastal structure of a Mediterranean port. Sustainability 2016, 8, 1342. [Google Scholar] [CrossRef] [Green Version]
  15. Ahamed, R.; McKee, K.; Howard, I. Advancements of wave energy converters based on power take off (PTO) systems: A review. Ocean Eng. 2020, 204, 107248. [Google Scholar] [CrossRef]
  16. Pascal, R.C.; Gendron, B.; Combourieu, A. Numerical Modelling of the Laminaria Concept with Coupled Mooring and PTO System. Available online: https://www.researchgate.net/publication/327591085_Numerical_modelling_of_the_Laminaria_concept_with_coupled_mooring_and_PTO_system (accessed on 30 August 2021).
  17. Rosa-Santos, P.; Taveira-Pinto, F.; Teixeira, L.; Ribeiro, J. CECO wave energy converter: Experimental proof of concept. J. Renew. Sustain. Energy 2015, 7, 061704. [Google Scholar] [CrossRef]
  18. Rosa-Santos, P.; Taveira-Pinto, F.; Rodríguez, C.A.; Ramos, V.; López, M. The CECO wave energy converter: Recent developments. Renew. Energy 2019, 139, 368–384. [Google Scholar] [CrossRef]
  19. Amir, M.A.U.; Sharip, R.M.; Muzanni, M.A.; Anuar, H.A. Wave energy convertors (WEC): A review of the technology and power generation. In Proceedings of the AIP Conference Proceedings, Songkhla, Thailand, 10–12 August 2016; p. 030100. [Google Scholar]
  20. Gaspar, J.F.; Calvário, M.; Kamarlouei, M.; Soares, C.G. Power take-off concept for wave energy converters based on oil-hydraulic transformer units. Renew. Energy 2016, 86, 1232–1246. [Google Scholar] [CrossRef]
  21. Drew, B.; Plummer, A.R.; Sahinkaya, M.N. A review of wave energy converter technology. Proc. Inst. Mech. Eng. Part A J. Power Energy 2009, 223, 887–902. [Google Scholar] [CrossRef] [Green Version]
  22. Henderson, R. Design, simulation, and testing of a novel hydraulic power take-off system for the Pelamis wave energy converter. Renew. Energy 2006, 31, 271–283. [Google Scholar] [CrossRef]
  23. Zhang, D.; Li, W.; Lin, Y.; Bao, J. An overview of hydraulic systems in wave energy application in China. Renew. Sustain. Energy Rev. 2012, 16, 4522–4526. [Google Scholar] [CrossRef]
  24. Hansen, R.H.; Kramer, M.M.; Vidal, E. Discrete displacement hydraulic power take-off system for the wavestar wave energy converter. Energies 2013, 6, 4001–4044. [Google Scholar] [CrossRef]
  25. Zou, S.; Abdelkhalik, O. Control of wave energy converters with discrete displacement hydraulic power take-off units. J. Mar. Sci. Eng. 2018, 6, 31. [Google Scholar] [CrossRef] [Green Version]
  26. Zang, Z.; Zhang, Q.; Qi, Y.; Fu, X. Hydrodynamic responses and efficiency analyses of a heaving-buoy wave energy converter with PTO damping in regular and irregular waves. Renew. Energy 2018, 116, 527–542. [Google Scholar] [CrossRef]
  27. Zhang, D.; Shi, Y.; Huang, C.; Si, Y.; Huang, B.; Li, W. SPH method with applications of oscillating wave surge converter. Ocean Eng. 2018, 152, 273–285. [Google Scholar] [CrossRef]
  28. Brito, M.; Canelas, R.; García-Feal, O.; Domínguez, J.; Crespo, A.; Ferreira, R.; Neves, M.; Teixeira, L. A numerical tool for modelling oscillating wave surge converter with nonlinear mechanical constraints. Renew. Energy 2020, 146, 2024–2043. [Google Scholar] [CrossRef]
  29. Ropero-Giralda, P.; Crespo, A.J.; Tagliafierro, B.; Altomare, C.; Domínguez, J.M.; Gómez-Gesteira, M.; Viccione, G. Efficiency and survivability analysis of a point-absorber wave energy converter using DualSPHysics. Renew. Energy 2020, 162, 1763–1776. [Google Scholar] [CrossRef]
  30. Quartier, N.; Ropero-Giralda, P.; M Domínguez, J.; Stratigaki, V.; Troch, P. Influence of the drag force on the average absorbed power of heaving wave energy converters using smoothed particle hydrodynamics. Water 2021, 13, 384. [Google Scholar] [CrossRef]
  31. Wang, C.; Zhang, Y. Hydrodynamic performance of an offshore Oscillating Water Column device mounted over an immersed horizontal plate: A numerical study. Energy 2021, 222, 119964. [Google Scholar] [CrossRef]
  32. Guiberteau, K.L.; Liu, Y.; Lee, J.; Kozman, T.A. Investigation of developing wave energy technology in the Gulf of Mexico. Distrib. Gener. Altern. Energy J. 2012, 27, 36–52. [Google Scholar] [CrossRef]
  33. Guiberteau, K.; Lee, J.; Liu, Y.; Dou, Y.; Kozman, T.A. Wave energy converters and design considerations for gulf of Mexico. Distrib. Gener. Altern. Energy J 2015, 30, 55–76. [Google Scholar] [CrossRef]
  34. Kurniawan, A.; Moan, T. Optimal geometries for wave absorbers oscillating about a fixed axis. IEEE J. Ocean. Eng. 2012, 38, 117–130. [Google Scholar] [CrossRef]
  35. McCabe, A.; Aggidis, G.; Widden, M. Optimizing the shape of a surge-and-pitch wave energy collector using a genetic algorithm. Renew. Energy 2010, 35, 2767–2775. [Google Scholar] [CrossRef]
  36. Goggins, J.; Finnegan, W. Shape optimisation of floating wave energy converters for a specified wave energy spectrum. Renew. Energy 2014, 71, 208–220. [Google Scholar] [CrossRef]
  37. Hai, L.; Göteman, M.; Leijon, M. A methodology of modelling a wave power system via an equivalent RLC circuit. IEEE Trans. Sustain. Energy 2016, 7, 1362–1370. [Google Scholar] [CrossRef]
  38. Sheng, W.; Lewis, T. Energy conversion: A comparison of fix-and self-referenced wave energy converters. Energies 2016, 9, 1056. [Google Scholar] [CrossRef] [Green Version]
  39. Tedeschi, E.; Carraro, M.; Molinas, M.; Mattavelli, P. Effect of control strategies and power take-off efficiency on the power capture from sea waves. IEEE Trans. Energy Convers. 2011, 26, 1088–1098. [Google Scholar] [CrossRef]
  40. Song, S.K.; Sung, Y.J.; Park, J.B. Numerical Modeling and 3D Investigation of INWAVE Device. Sustainability 2017, 9, 523. [Google Scholar] [CrossRef] [Green Version]
  41. COMPASSIS. Available online: https://www.compassis.com//downloads/Manuals/SeaFEM_Theory_Manual.pdf (accessed on 1 August 2021).
  42. COMPASSIS. Available online: https://www.compassis.com//downloads/Manuals/Ramseries_Reference_Manual.pdf (accessed on 1 August 2021).
  43. Pecher, A.; Kofoed, J.P. Handbook of Ocean Wave Energy; Springer Nature: Basingstoke, England, 2017. [Google Scholar]
Figure 1. InWave system scheme [40].
Sustainability 13 09803 g001
Figure 2. Example of torque curve.
Sustainability 13 09803 g002
Figure 3. Schematic of the hydraulic PTO of InWave.
Sustainability 13 09803 g003
Figure 4. Numerical model of floating body and sea.
Sustainability 13 09803 g004
Figure 5. Rotational speed of rope drum vs. time. (a) Mechanical; (b) Hydraulic.
Sustainability 13 09803 g005
Figure 6. Profile of Rope 1 tension in mechanical and hydraulic PTO devices. (a) Mechanical; (b) Hydraulic.
Sustainability 13 09803 g006
Figure 7. (a) Generator efficiency vs. (b,c) rotational velocity.
Sustainability 13 09803 g007
Table 1. Simulation parameters.
BuoyInstallationInWave System
Diameter14 mAngle between Connection Points120°Diameter of rope drum1.2 m
Height2.8 mRope angle60°Inertia of rope drum6.0 kg/m2
Mass88.3 tonWater depth10 mCounter weight1 ton
Draft0.56 mDensity ofwater1025 kg/m3Gear ratio2.8:1
Table 2. Characteristics of regular waves.
Periods4 s6 s8 s10 s12 s
Height
0.5 mCASE1CASE2CASE3CASE4CASE5
1.0 mCASE6CASE7CASE8CASE9CASE10
1.5 mCASE11CASE12CASE13CASE14CASE15
2.0 mCASE16CASE17CASE18CASE19CASE20
2.5 mCASE21CASE22CASE23CASE24CASE25
3.0 mCASE26CASE27CASE28CASE29CASE30
Table 3. Specification of generator and gear box.
ComponentsParameterValue
GeneratorCapacity110 kW
Rated velocity450 rpm
Rated torque2334 Nm
Gear BoxGear ratio1:22
Table 4. Specification of hydraulic components.
ComponentsParameterValue
Hydraulic pumpDisplacement7500 cc/rev
AccumulatorVolume800 L
Minimum pressure80 bar
Maximum pressure160 bar
Hydraulic motorDisplacementVariable
Table 5. Available and effective tension of Rope 1.
CASEMechanicalHydraulic
MAX (ton)Available (%)Effective (%)Max. (ton)Available (%)Effective (%)
CASE14.2622.1338.269.142.9668.26
CASE23.0818.4025.868.7541.2866.97
CASE32.7417.2721.148.4541.3867.05
CASE42.6316.6818.267.7932.5758.14
CASE52.5816.4717.227.3233.0858.78
CASE66.9530.7855.5410.6342.8168.15
CASE74.6623.2741.3510.5442.2067.69
CASE8420.8934.9310.5644.0269.04
CASE93.8519.7030.7810.5735.5461.63
CASE103.7419.2729.2410.3834.9060.94
CASE119.6439.5265.2810.6944.4869.34
CASE126.2228.2851.7310.6241.9567.49
CASE135.324.5244.6410.5444.7269.53
CASE145.1422.6539.8010.5438.0864.19
CASE154.9921.9937.9710.2333.7259.57
CASE1611.0745.0069.4610.7143.9568.97
CASE177.7733.4559.1710.6242.5567.95
CASE186.6128.1551.8610.6744.7469.55
CASE196.5225.5246.5610.6737.8764.00
CASE206.4324.6244.6010.6432.9058.56
CASE2111.4344.5269.0210.8844.2469.18
CASE229.2638.7464.7110.5842.8468.16
CASE237.9331.8157.4710.5645.1969.86
CASE247.9128.2951.8110.5837.1963.34
CASE258.0227.2149.879.8332.4758.01
CASE2611.5243.2167.8910.7944.9869.69
CASE2710.6443.5768.5710.6943.3268.52
CASE289.3535.5362.0010.645.2869.93
CASE299.330.9956.0210.637.7063.83
CASE309.629.8254.2410.6234.0860.00
Table 6. Available and effective tension of Ropes 2 and 3.
CASEMechanicalHydraulic
MAX (ton)Available (%)Effective (%)Max. (ton)Available (%)Effective (%)
CASE12.1719.7730.929.0142.3867.82
CASE21.9817.9724.108.8141.7067.30
CASE31.9117.4021.708.4541.5967.22
CASE41.8516.7818.717.7937.8163.93
CASE51.8216.5217.477.3638.0464.16
CASE62.8125.5746.5310.5642.2167.69
CASE72.4522.2538.6510.5442.3967.83
CASE82.3321.2135.8310.643.6468.76
CASE92.220.0131.8210.5643.5768.70
CASE102.1519.5430.2010.6145.5870.07
CASE113.4231.0755.9410.6641.7967.37
CASE122.9126.4548.3810.641.9167.46
CASE132.7625.0845.7910.5943.6868.80
CASE142.5723.3541.5810.5645.6670.13
CASE152.522.7540.0410.6244.0769.05
CASE163.9936.3062.2310.3840.6166.42
CASE173.3730.5955.3110.642.3967.84
CASE183.1929.0453.2110.6643.6768.80
CASE192.9526.8449.1810.6344.6669.47
CASE202.8826.2147.9610.5643.5868.71
CASE214.3539.5465.2810.6440.7366.52
CASE223.8234.7360.5610.5342.4167.86
CASE233.6433.0858.9710.6244.3269.25
CASE243.3630.5155.2810.6244.9269.64
CASE253.329.9954.5110.5844.1769.13
CASE264.2938.9864.7310.8140.0665.96
CASE274.2638.7264.5910.6841.9267.47
CASE284.137.2463.5910.6444.1069.11
CASE293.7834.3660.2910.5845.1669.80
CASE303.7534.1360.0210.6146.2870.54
Table 7. Generator efficiency in mechanical PTO.
Periods4 s6 s8 s10 s12 s
Height
0.5 m78.16%46.49%36.11%31.92%30.68%
1.0 m89.46%81.59%72.65%65.77%64.67%
1.5 m92.18%87.84%84.32%82.74%82.75%
2.0 m93.42%90.48%88.26%87.43%87.77%
2.5 m94.11%91.91%90.22%89.86%90.29%
3.0 m94.34%92.73%91.50%91.36%91.87%
Table 8. Effective rope tension and its comparison between mechanical and hydraulic.
CASERope 1Ropes 2 and 3
Mechanical (%)Hydraulic (%)Hydraulic/Mechanical (%)Mechanical (%)Hydraulic (%)Hydraulic/Mechanical (%)
CASE18.4729.32346.346.1128.74470.19
CASE24.7627.65581.004.3328.06648.02
CASE33.6527.75759.963.7827.96740.42
CASE43.0518.94621.723.1424.17769.92
CASE52.8419.44685.602.8924.41845.67
CASE617.1029.18170.6611.9028.57240.15
CASE79.6228.57296.878.6028.75334.35
CASE87.3030.39416.507.6030.01394.85
CASE96.0621.90361.226.3729.93470.11
CASE105.6321.27377.465.9031.94541.22
CASE1125.8030.84119.5517.3828.15161.99
CASE1214.6328.31193.5312.8028.27220.94
CASE1310.9531.09284.0711.4830.05261.68
CASE149.0124.44271.159.7132.02329.81
CASE158.3520.09240.579.1130.43334.07
CASE1631.2630.3196.9822.5926.97119.41
CASE1719.7928.91146.0816.9228.76169.97
CASE1814.6031.12213.1515.4530.04194.44
CASE1911.8824.24203.9813.2031.03235.04
CASE2010.9819.27175.4612.5729.94238.21
CASE2130.7330.6199.6025.8127.09104.97
CASE2225.0729.20116.4821.0328.78136.83
CASE2318.2831.57172.6919.5130.69157.33
CASE2414.6623.56160.7216.8731.28185.48
CASE2513.5718.84138.8116.3530.53186.78
CASE2629.3431.35106.8625.2326.42104.72
CASE2729.8829.6899.3525.0128.28113.09
CASE2822.0331.66143.7423.6830.48128.70
CASE2917.3624.06138.6120.7231.52152.16
CASE3016.1720.45126.4220.4832.65159.37
Publisher’s Note: MDPI stays neutral with regard to jurisdictional claims in published maps and institutional affiliations.

