
Hydrogeophysical Study of Sub-Basaltic Alluvial Aquifer in the Southern Part of Al-Madinah Al-Munawarah, Saudi Arabia


Abstract
:1. Introduction
2. Study Area
3. Geological Setting
4. Hydrogeology
5. Methodology
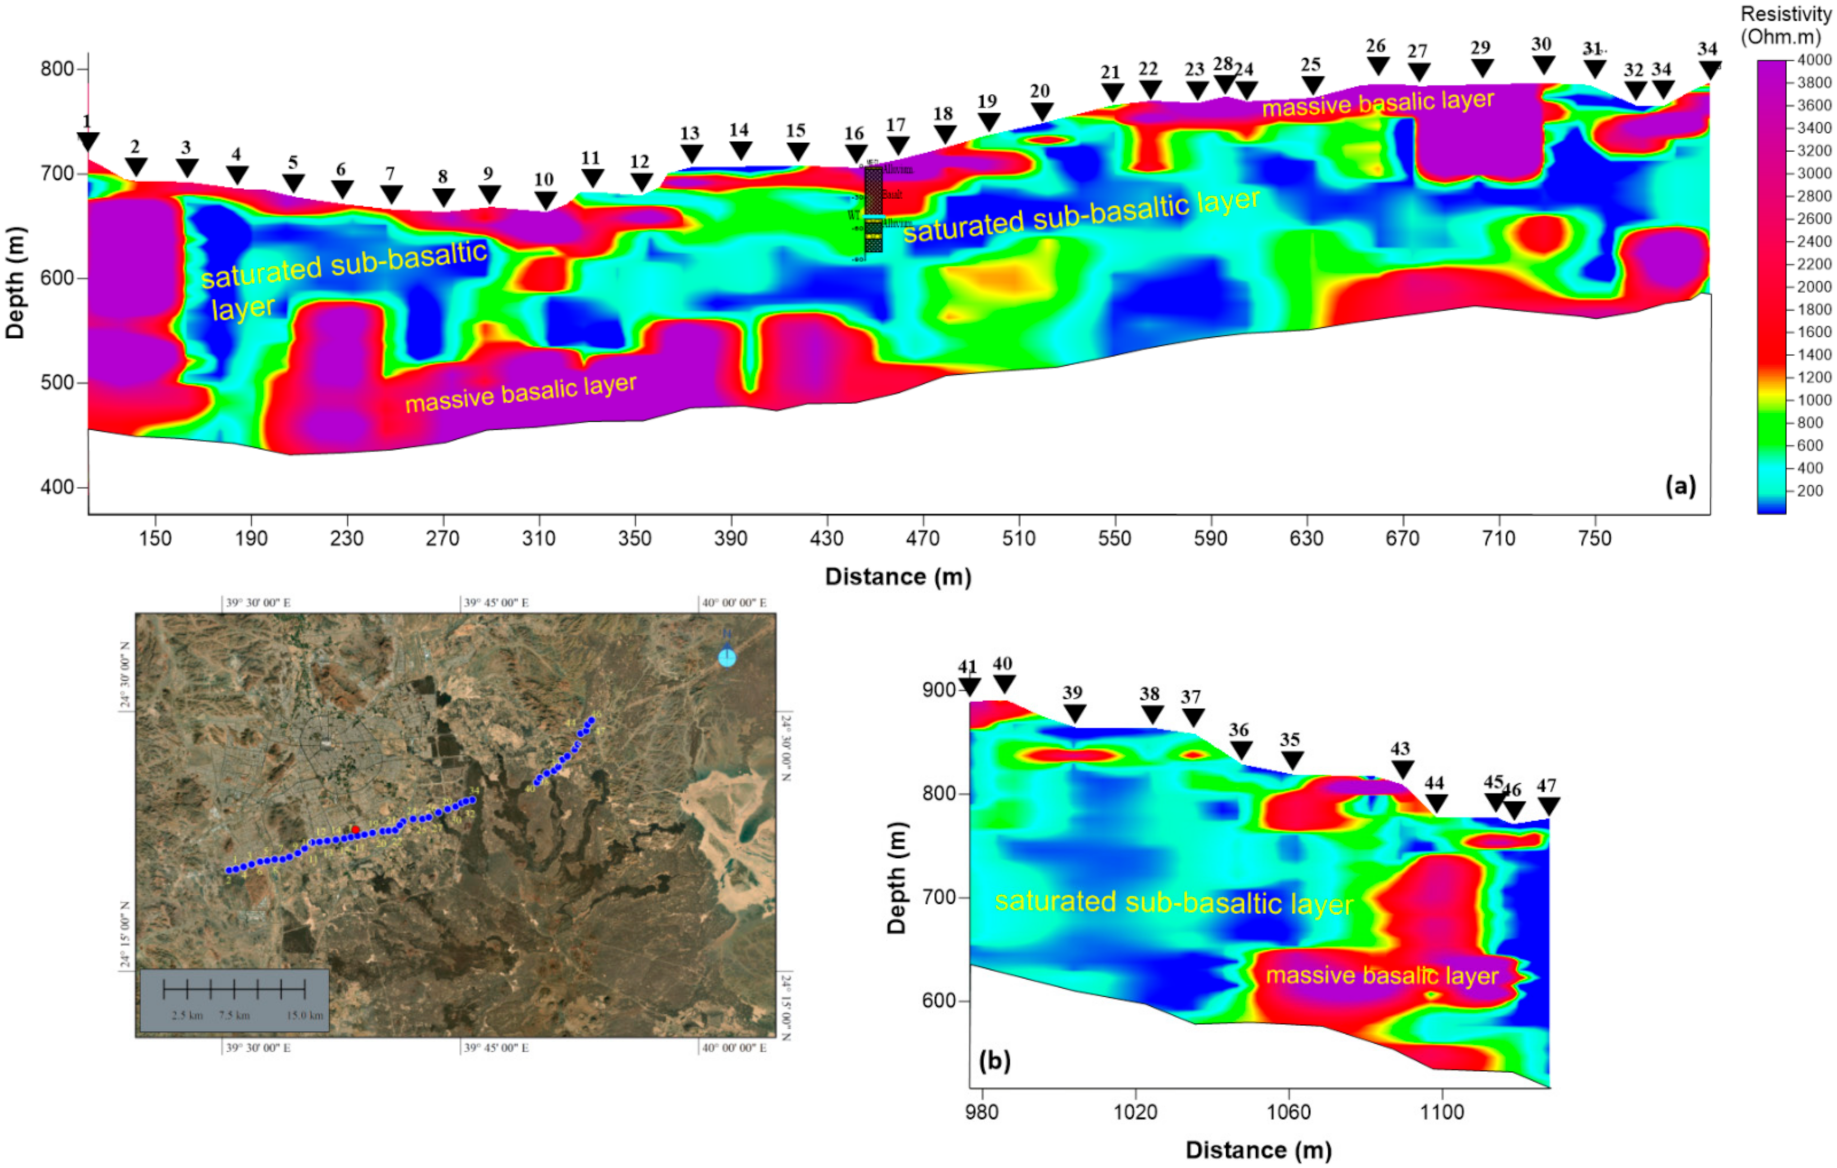
6. Results
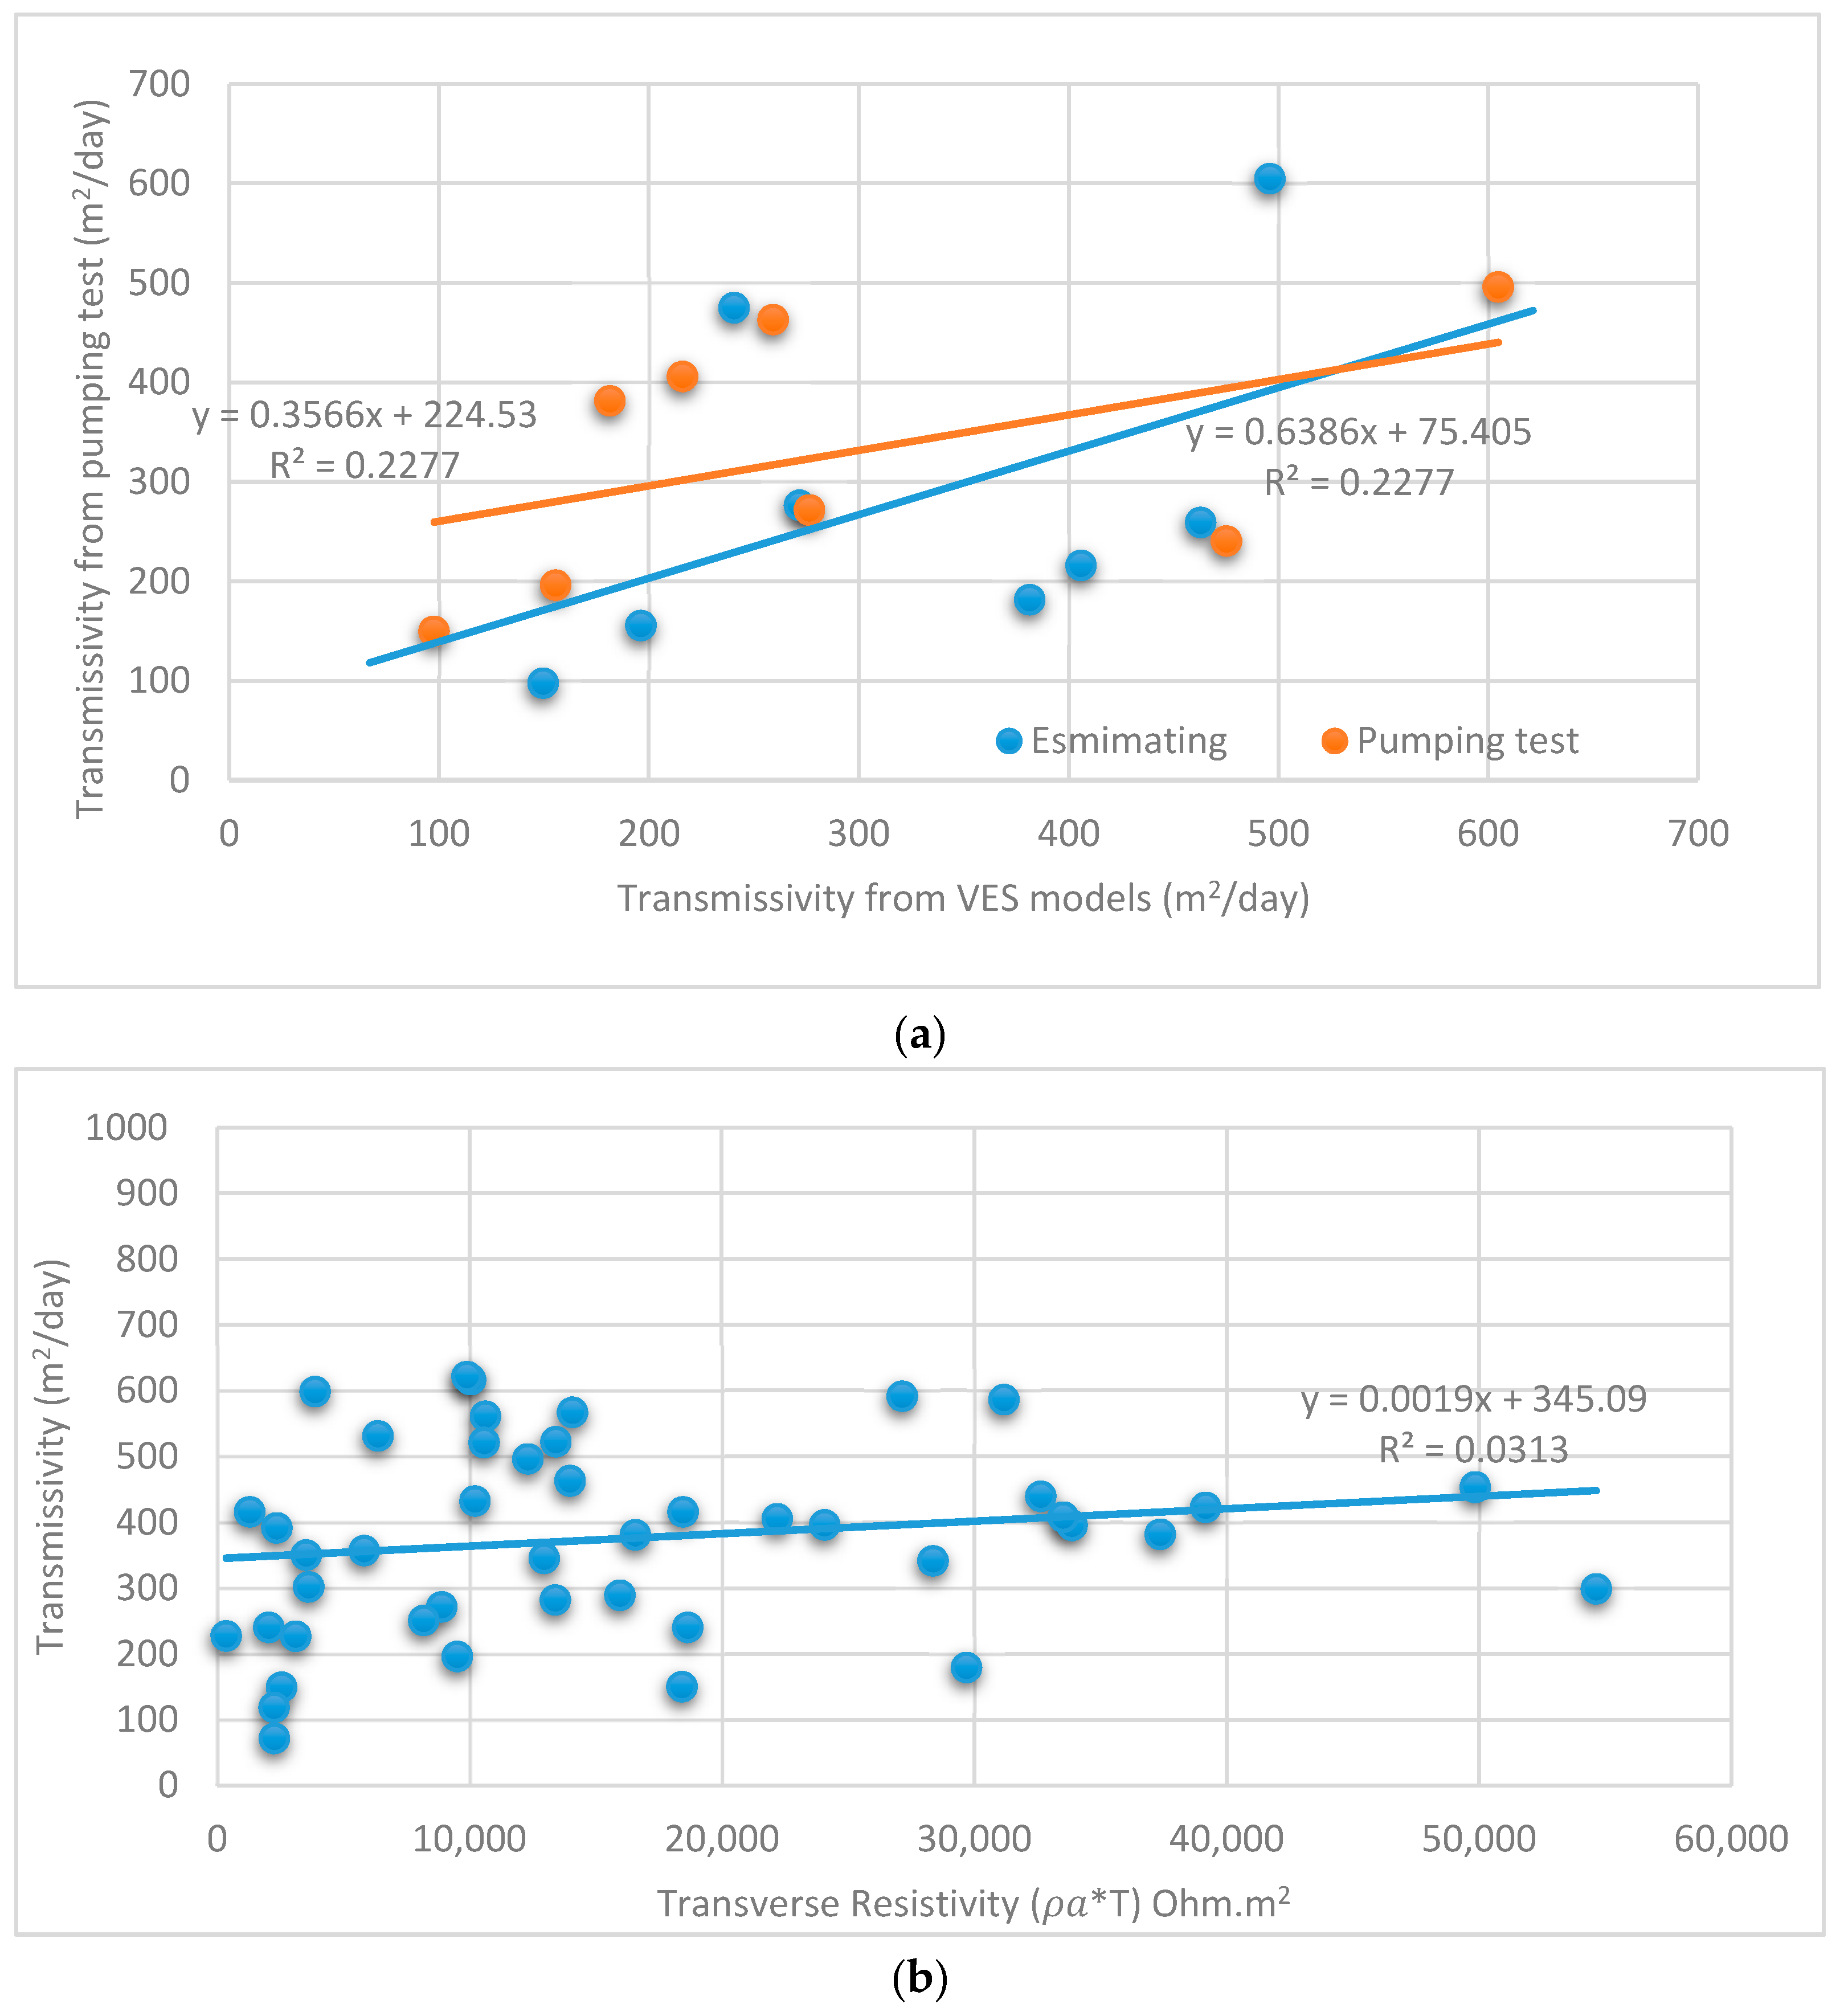
7. Discussion
8. Conclusions
Author Contributions
Funding
Institutional Review Board Statement
Informed Consent Statement
Data Availability Statement
Acknowledgments
Conflicts of Interest
References
- AQUASTAT-FAO’s Global Information System on Water and Agriculture, Saudi Arabia. 2021. Available online: http://www.fao.org/aquastat/en/ (accessed on 21 March 2021).
- Fallatah, O.A. Groundwater Quality Patterns and Spatiotemporal Change in Depletion in the Regions of the Arabian Shield and Arabian Shelf. Arab. J. Sci. Eng. 2020, 45, 341–350. [Google Scholar] [CrossRef] [Green Version]
- El Maghraby, M.M. Hydrogeochemical characterization of groundwater aquiferin Al-Madinah Al-Munawarah City, Saudi Arabia. Arab. J. Geosci. 2015, 8, 4191–4206. [Google Scholar] [CrossRef]
- Gasperikova, E.; Commer, M. Electrical and Electromagnetic Methods. In Geophysics and Geosequestration; Davis, T., Landrø, M., Wilson, M., Eds.; Cambridge University Press: Cambridge, UK, 2019; pp. 154–167. [Google Scholar] [CrossRef]
- Metwaly, M.M.; El Alfy, M.; Eawadi, E.; Ismail, A.; El-Qady, G. Estimating aquifer hydraulic parameters in the limestone aquifer using electrical resistivity measurements; A case study at Khuff Formation Aquifer, Saudi Arabia. In Proceedings of the International Conference on Engineering Geophysics, Al Ain, United Arab Emirates, 15–18 November 2015. [Google Scholar] [CrossRef]
- Pratap, B.; Dev, H. Electrical Resistivity Survey for Groundwater Investigation at Sumbli of Jammu District (J&K). In Management of Water, Energy and Bio-Resources in the Era of Climate Change: Emerging Issues and Challenges; Raju, N., Gossel, W., Ramanathan, A., Sudhakar, M., Eds.; Springer: Cham, Switzerland, 2015. [Google Scholar] [CrossRef]
- Reynolds, J.M. An Introduction to Applied and Environmental Geophysics; John Wiley and Sons Ltd.: Chichester, UK, 1997; 796p. [Google Scholar]
- Akhter, G.; Hasan, M. Determination of aquifer parameters using geoelectrical sounding and pumping test data in Khanewal District, Pakistan. Open Geosci. 2016, 8, 630–638. [Google Scholar] [CrossRef]
- Lu, D.; Huang, D.; Xu, C. Estimation of hydraulic conductivity by using pumping test data and electrical resistivity data in faults zone. Ecol. Indic. 2021, 129, 107861. [Google Scholar] [CrossRef]
- Niwas, S.; Celik, M. Equation estimation of porosity and hydraulic conductivity of Ruhrtal aquifer in Germany using near surface geophysics. J. Appl. Geophys. 2012, 84, 77–85. [Google Scholar] [CrossRef]
- Slater, L.; Lesmes, D.P. Electrical-hydraulic relationships observed for unconsolidated sediments. Water Resour. Res. 2002, 38, 1075. [Google Scholar] [CrossRef]
- Tijani, M.N.; Obini, N.; Inim, I.J. Estimation of aquifer hydraulic parameters and protective capacity in basement aquifer of south-western Nigeria using geophysical techniques. Environ. Earth Sci. 2021, 80, 466. [Google Scholar] [CrossRef]
- Mozac, O.; Kelly, W.E.; Landa, I. A hydrogeological model for relations between electrical and hydraulic properties of aquifers. J. Hydrol. 1985, 79, 1–19. [Google Scholar] [CrossRef]
- Singh, S.; Singh, V.S. Estimation of hydraulic characteristics from electrical resistivity data in coastal aquifers of Southern India. J. Geol. Soc. India 2016, 88, 77–86. [Google Scholar] [CrossRef]
- Fetter, C.W. Applied Hydrology, 2nd ed.; Macmillan Publishing Company: New York, NY, USA, 1998; 592p. [Google Scholar]
- Khashogji, M.S.; El Maghraby, M.M.S. Evaluation of groundwater resources for drinking and agricultural purposes, Abar Al Mashi area, south Al Madinah Al Munawarah City, Saudi Arabia. Arab. J. Geosci. 2013, 6, 3929–3942. [Google Scholar] [CrossRef]
- Al-Harbi, O.A.; Hussain, G.; Khan, M.M.; Moallim, M.A.; Al-Sagaby, I.A. Evaluation of groundwater quality and its recharge by isotopes and solute chemistry in wadi Malal, al-Madinah al-Munawarah, Saudi Arabia. Pak. J. Biol. Sci. 2006, 9, 260–269. [Google Scholar] [CrossRef] [Green Version]
- Al-Shaibani, A.; Lloyed, J.; Abokhodai, A.; Al-Ahmari, A. Hydrogeological and quantitative groundwater assessment of the basaltic aquifer, Northern Harrat Rahat, Saudi Arabia. Arab Gulf J. Sci. Res. 2007, 25, 39–49. [Google Scholar]
- El Maghraby, M.M.S.; El Nasr, A.K.O.A.; Hamouda, M.S.A. Quality assessment of groundwater at south Al Madinah Al Munawarah area, Saudi Arabia. Environ. Earth Sci. 2013, 70, 1525–1538. [Google Scholar] [CrossRef]
- Gutub, S. A case study of al-Madinah’s water resources and reclaimed wastewater reuse perspective. Int. J. Civ. Environ. Eng. 2013, 13, 9–16. [Google Scholar]
- Taibah University Research and Consulting Institute. Study of Shallow Water Table Rise Problem in Almadinah Almunawarah—Phase 1; Final Report; Taibah University: Madinah, Saudi Arabia, 2011. [Google Scholar]
- Brown, G.F.; Schmidt, D.L. Geology of the Arabian Peninsula, Shield Area of Western Saudi Arabia; U.S. Geological Survey Professional Parer 560-A: Washington, DC, USA, 1989.
- Johnson, N.M.; Officer, C.B.; Opdyke, N.D.; Woodard, G.D.; Zeitler, P.K.; Lindsay, E.H. Rates of Late Cenozoic tectonism in the Vallecito–Fish Creek basin, western Imperial Valley, California. Geology 1983, 11, 664–667. [Google Scholar] [CrossRef]
- Pellaton, C. Geologic Map of the Al Madinah Quadrangle. Sheet 24D. In Geologic Map GM-52C, Scale 250,000; Ministry of Petroleum and Mineral Resources: Riyadh, Saudi Arabia, 1981. [Google Scholar]
- Moufti, M.R.; Moghazi, A.M.; Ali, K.A. 40Ar/39Ar geochronology of the Neogene–Quaternary Harrat Al-Madinah intercontinental Volcanic Field, Saudi Arabia: Implications for duration and migration of volcanic activity. J. Asian Earth Sci. 2012, 62, 253–268. [Google Scholar] [CrossRef]
- Moufti, M.R.; Németh, K. The intra-continental Harrat Al Madinah volcanic field, Western Saudi Arabia: A proposal to establish Harrat Al Madinah as the first volcanic geopark in the Kingdom of Saudi Arabia. Geoheritage 2013, 5, 185–206. [Google Scholar] [CrossRef]
- Camp, V.E.; Roobol, M.J. Geology of the Cenozoic Lava Field of Harrat Rahat, Kingdome of Saudi Arabia. In Directorate General of Mineral Resources, Geoscience Map GM-123 with Text; Ministry of Petroleum and Mineral Resources, Directorate General of Mineral Resources: Jiddah, Saudi Arabia, 1991; p. 37. [Google Scholar]
- Ministry of Petroleum and Mineral Resources KSA. Geologic Map of Kingdom of Saudi Arabia; Ministry of Petroleum and Mineral Resources: Riyadh, Saudi Arabia, 1987.
- Bayumi, T. Impact of natural and human activities on the groundwater quality in the southern part of Al Madinah Al Munawwarah. Arts Humanit. 2008, 35, 1–21. [Google Scholar]
- Italconsult. Detailed Investigation of the Madina Region. In Final Report: Thermatic Report Number 5 and 7; Saudi Arabian Ministry of Agriculture and Water: Riyadh, Saudi Arabia, 1979. [Google Scholar]
- Alghamdi, A.G.; Aly, A.A.; Aldhumri, S.A.; Al-Barakaha, F.N. Hydrochemical and quality assessment of groundwater resources in al-Madinah city, Western Saudi Arabia. Sustainability 2020, 12, 3106. [Google Scholar] [CrossRef] [Green Version]
- Bob, M.; Abd Rahman, N.; Taher, S.; Elamin, A. Multi-objective assessment of groundwater quality in Madinah City, Saudi Arabia. Water Qual. Expo. Health 2015, 7, 53–66. [Google Scholar] [CrossRef]
- Bamousa, A.O.; El Maghraby, M.E. Groundwater characterization and quality assessment, and sources of pollution in Madinah, Saudi Arabia. Arab. J. Geosci. 2016, 9, 536. [Google Scholar] [CrossRef]
- Dahlin, T. The development of DC resistivity imaging techniques. Comput. Geosci. 2001, 27, 1019–1029. [Google Scholar] [CrossRef] [Green Version]
- Koefoed, O. Geosounding Principles Resistivity Sounding Measurements; Elsevier: Amsterdam, The Netherlands, 1979. [Google Scholar]
- Interpex. IX1D v3 Instruction Manual; Interpex Ltd.: Golden, CO, USA, 2008; pp. 1–133. [Google Scholar]
- McLachlan, P.; Blanchy, G.; Chambers, J.; Sorensen, J.; Uhlemann, S.; Wilkinson, P.; Binley, A. The application of electromagnetic induction methods to reveal the hydrogeological structure of a riparian wetland. Water Resour. Res. 2021, 57, e2020WR029221. [Google Scholar] [CrossRef]
- McNeill, J.D. Advances in electromagnetic methods for groundwater studies. Geoexploration 1991, 27, 65–80. [Google Scholar] [CrossRef]
- Linde, N.; Pedersen, L.B. Characterization of a fractured granite using radio magnetotelluric (RMT) data. Geophysics 2004, 69, 1125–1350. [Google Scholar] [CrossRef]
- Beamish, D. Quantitative 2D VLF data interpretation. J. Appl. Geophys. 2000, 45, 33–47. [Google Scholar] [CrossRef] [Green Version]
- Schütze, C.; Vienken, T.; Werban, U.; Dietrich, P.; Finizola, A.; Carsten, L. Joint application of geophysical methods and Direct Push-soil gas surveys for the improved de-lineation of buried fault zones. J. Appl. Geophys. 2012, 82, 129–136. [Google Scholar] [CrossRef] [Green Version]
- Ahmad, J.; Schmitt, D.R.; Rokosh, C.D.; Pawlowicz, J.G. High-resolution seismic and resistivity profiling of a buried Quaternary subglacial valley: Northern Alberta, Canada. Geol. Soc. Am. Bull. 2009, 121, 1570–1583. [Google Scholar] [CrossRef]
- Abdelfattah, M.; Gaber, A.; Geriesh, M.H.; Hassan, T.M. Investigating the less ambiguous hydrogeophysical method in exploring the shallow coastal stratified-saline aquifer: A case study at West Port Said Coast, Egypt. Environ. Earth Sci. 2021, 80, 159. [Google Scholar] [CrossRef]
- Bratus, A.; Santarato, G. The characterization of aquifers by means of resistivity investigations. Boll. Geofis. Teor. Appl. 2009, 50, 15–28. [Google Scholar]
- Hickin, A.S.; Kerr, B.; Barchyn, T.E.; Paulen, R.C. Using ground-penetrating radar and capacitively coupled resistivity to investigate 3-D fluvial architecture and grain-size distribution of a gravel floodplain in northeast British Columbia, Canada. J. Sediment. Res. 2009, 79, 457–477. [Google Scholar] [CrossRef]
- Alqadi, M.; Al Dwairi, A.; Dehnavi, S.; Margane, A.; Al Raggad, M.; Al Wreikat, M.; Chiogna, G. A Novel Method to Assess the Impact of a Government’s Water Strategy on Research: A Case Study of Azraq Basin, Jordan. Water 2021, 13, 2138. [Google Scholar] [CrossRef]
- Metwaly, M.M.; El-Qady, G.; Massoud, U.; El-Kenawy, A.; Matsushima, J.; Al-Arifi, N. Integrated Geoelectrical survey for ground water and shallow subsurface evaluation: Case study at Siliyin spring, El-Fayoum, Egypt. Int. J. Earth Sci. 2010, 99, 1427–1436. [Google Scholar] [CrossRef]
- Singh, S.B.; Veeraiah, B.; Dhar, R.L.; Prakash, B.A.; Rani, M.T. Deep resistivity sounding studies for probing deep fresh aquifers in the coastal area of Orissa, India. Hydrogeol. J. 2011, 19, 355–366. [Google Scholar] [CrossRef]
- Mace, R.; Smyth, R.; Xu, L.; Liang, J. Transmissivity, Hydraulic Conductivity, and Storativity of the Carrizo-Wilcox Aquifer in Texas; Technical Report Prepared for Texas Water Development Board under TWDB Contract No. 99-483-279, Part 1; The University of Texas at Austin: Austin, TX, USA, 2000. [Google Scholar]
- Mendoza, G.F.; Steenhuis, T.S.; Walter, M.T.; Parlange, J.-Y. Estimating basin-wide hydraulic parameters of a semi-arid mountainous watershed by recession-flow analysis. J. Hydrol. 2003, 279, 57–69. [Google Scholar] [CrossRef]
- Niwas, S.; Tezkan, B.; Israil, M. Aquifer hydraulic conductivity estimation from surface geoelectrical measurements for Krauthausen test site, Germany. Hydrogeol. J. 2011, 19, 307–315. [Google Scholar] [CrossRef]
- Kazakis, N.; Pavlou, A.; Vargemezis, G.; Tsokas, G. Seawater intrusion mapping using electrical resistivity tomography and hydrochemical data. An application in the coastal area of eastern Thermaikos Gulf, Greece. Sci. Total Environ. 2016, 543, 373–387. [Google Scholar] [CrossRef]
- Patnode, H.W.; Wyllie, M.R.I. The presence of conductive solids in reservoir rocks as a factor in electric log interpretation. Trans. Am. Inst. Min. Eng. 1950, 189, 47–52. [Google Scholar] [CrossRef]
- Archie, G.E. The electrical resistivity log as an aid in determining some reservoir characteristics. Trans. Am. Inst. Min. Metall. Eng. 1942, 146, 56–62. [Google Scholar] [CrossRef]
- Bureau de Recherches Geologiques, Minieres Agence. D’interventions (BRGM) Detailed Investigations of the Medinah Region. In Final Report Internal Report Submitted to Ministry of Agriculture and Water; Bureau de Recherches Géologiques et Minières: Orléans, France, 1979. [Google Scholar]
- Domenico, P.; Schwartz, F.W. Physical and Chemical Hydrogeology, 2nd ed.; John Wiley & Sons: New York, NY, USA, 1998. [Google Scholar]
- Fetter, C.W. Applied Hydrogeology, 3rd ed.; Macmillan College Publishing Company: New York, NY, USA, 1994. [Google Scholar]


| Station No. | Water-Bearing Formation Resistivity (Ohm.m) | Pore Water Resistivity (Ohm.m) | Aquifer Thickness (m) | True Resistivity TR(Ohm.m) | Formation Factor | Porosity | Hydraulic Conductivity (m/day) | Transmissivity (m2/day) | |
|---|---|---|---|---|---|---|---|---|---|
| VESs Model | Pumping Tests | ||||||||
| 3 | 179.3 | 0.002 | 182 | 32,636 | 133.33 | 0.1737 | 2.417607 | 440.00 | |
| 4 | 197 | 172 | 33,884 | 266.67 | 0.1712 | 2.299740 | 395.56 | ||
| 5 | 85 | 120 | 10,214 | 152.38 | 0.1950 | 3.606902 | 432.83 | ||
| 6 | 105 | 85 | 8897 | 228.57 | 0.1887 | 3.215129 | 271.68 | 276.48 | |
| 7 | 147 | 151 | 22,197 | 76.19 | 0.1791 | 2.687904 | 405.87 | 216.00 | |
| 8 | 127 | 131 | 16,580 | 495.24 | 0.1834 | 2.912262 | 381.51 | 181.44 | |
| 9 | 44 | 47 | 2046 | 666.67 | 0.2161 | 5.175094 | 240.64 | 475.20 | |
| 10 | 23 | 56 | 1288 | 0.2391 | 7.433548 | 416.28 | |||
| 11 | 88 | 140 | 12,320 | 0.1940 | 3.542405 | 495.94 | 604.80 | ||
| 12 | 69 | 37 | 2553 | 0.2015 | 4.042918 | 149.59 | 97.63 | ||
| 13 | 136 | 70 | 9520 | 0.1813 | 2.802125 | 196.15 | 155.52 | ||
| 14 | 157.35 | 153 | 24,075 | 0.1773 | 2.591947 | 396.57 | |||
| 15 | 49.128 | 72 | 3537 | 0.2124 | 4.869830 | 350.63 | |||
| 16 | 36.948 | 105 | 3880 | 0.2221 | 5.700881 | 598.59 | |||
| 17 | 99.931 | 140 | 13,990 | 0.1902 | 3.307079 | 462.99 | 259.2 | ||
| 18 | 35.3 | 67 | 2365 | 0.2237 | 5.847329 | 391.77 | |||
| 19 | 74 | 30.5 | 2257 | 0.1993 | 3.891768 | 118.70 | |||
| 20 | 90 | 149.19 | 13,427 | 0.1934 | 3.499566 | 522.10 | |||
| 21 | 66.968 | 150 | 10,045 | 0.2025 | 4.109370 | 616.41 | |||
| 22 | 128.2 | 144 | 18,461 | 0.1830 | 2.892248 | 416.48 | |||
| 23 | 73.84375 | 144 | 10,634 | 0.1994 | 3.896247 | 561.06 | |||
| 24 | 191.6 | 175 | 33,530 | 0.1719 | 2.333938 | 408.44 | |||
| 25 | 184.62 | 101 | 18,646 | 0.1729 | 2.380460 | 240.43 | |||
| 26 | 55 | 66 | 3630 | 0.2087 | 4.576798 | 302.07 | |||
| 27 | 193 | 147 | 28,371 | 0.1717 | 2.324929 | 341.76 | |||
| 28 | 323.36 | 169 | 54,649 | 0.1585 | 1.770227 | 299.17 | |||
| 29 | 105 | 78 | 8190 | 0.1888 | 3.219980 | 251.16 | |||
| 30 | 67 | 87 | 5829 | 0.2024 | 4.108299 | 357.42 | |||
| 31 | 66 | 150 | 9900 | 0.2029 | 4.142155 | 621.32 | |||
| 32 | 115 | 112.72 | 12,964 | 0.1861 | 3.066058 | 345.63 | |||
| 33 | 214.76 | 174 | 37,369 | 0.1689 | 2.196800 | 382.24 | |||
| 34 | 303 | 98 | 29,694 | 0.1601 | 1.831808 | 179.52 | |||
| 35 | 55 | 116 | 6380 | 0.2087 | 4.576798 | 530.91 | |||
| 36 | 207.27 | 189 | 39,176 | 0.1698 | 2.238512 | 423.08 | |||
| 37 | 144.33 | 216 | 31,176 | 0.1797 | 2.714344 | 586.30 | |||
| 38 | 134 | 100 | 13,400 | 0.1817 | 2.824451 | 282.45 | |||
| 39 | 131.14 | 207 | 27,147 | 0.1824 | 2.857264 | 591.45 | |||
| 40 | 103 | 22 | 2266 | 0.1893 | 3.253543 | 71.58 | |||
| 41 | 231.9 | 215 | 49,859 | 0.1669 | 2.109309 | 453.50 | |||
| 42 | 15 | 24 | 360 | 0.2555 | 9.479689 | 227.51 | |||
| 43 | 60 | 52 | 3120 | 0.2059 | 4.363670 | 226.91 | |||
| 44 | 249 | 74 | 18,426 | 0.1650 | 2.031459 | 150.33 | |||
| 45 | 147.78 | 108 | 15,961 | 0.1790 | 2.680256 | 289.47 | |||
| 46 | 88 | 160 | 14,080 | 0.1940 | 3.542405 | 566.78 | |||
| 47 | 77.25 | 137 | 10,583 | 0.1980 | 3.801859 | 520.85 | |||
| Min | 22.0 | 0.2 | 1.8 | 71.6 | 97.632 | ||||
| Max | 216.0 | 0.3 | 9.5 | 621.3 | 604.8 | ||||
| Avrg. | 118.3 | 0.2 | 3.5 | 369.6 | 283.28 | ||||
Publisher’s Note: MDPI stays neutral with regard to jurisdictional claims in published maps and institutional affiliations. |
© 2021 by the authors. Licensee MDPI, Basel, Switzerland. This article is an open access article distributed under the terms and conditions of the Creative Commons Attribution (CC BY) license (https://creativecommons.org/licenses/by/4.0/).
Share and Cite
Metwaly, M.; Abdalla, F.; Taha, A.I. Hydrogeophysical Study of Sub-Basaltic Alluvial Aquifer in the Southern Part of Al-Madinah Al-Munawarah, Saudi Arabia. Sustainability 2021, 13, 9841. https://doi.org/10.3390/su13179841
Metwaly M, Abdalla F, Taha AI. Hydrogeophysical Study of Sub-Basaltic Alluvial Aquifer in the Southern Part of Al-Madinah Al-Munawarah, Saudi Arabia. Sustainability. 2021; 13(17):9841. https://doi.org/10.3390/su13179841
Chicago/Turabian StyleMetwaly, Mohamed, Fathy Abdalla, and Ayman I. Taha. 2021. "Hydrogeophysical Study of Sub-Basaltic Alluvial Aquifer in the Southern Part of Al-Madinah Al-Munawarah, Saudi Arabia" Sustainability 13, no. 17: 9841. https://doi.org/10.3390/su13179841
APA StyleMetwaly, M., Abdalla, F., & Taha, A. I. (2021). Hydrogeophysical Study of Sub-Basaltic Alluvial Aquifer in the Southern Part of Al-Madinah Al-Munawarah, Saudi Arabia. Sustainability, 13(17), 9841. https://doi.org/10.3390/su13179841