Article

How Relevant Are Direct Emissions of Microplastics into Freshwater from an LCA Perspective?

1
TEMAS Solution, 5212 Hausen, Switzerland
2
Empa, Swiss Federal Laboratories for Materials Science and Technology, 9014 Sankt Gallen, Switzerland
*
Author to whom correspondence should be addressed.
Sustainability 2021, 13(17), 9922; https://doi.org/10.3390/su13179922
Submission received: 6 July 2021 / Revised: 25 August 2021 / Accepted: 26 August 2021 / Published: 3 September 2021

Abstract

:
Microplastics are ubiquitous in ecosystems and a lot of research is being performed to understand their environmental fate and effects on organisms. However, the release and impact of MP has so far not been considered in LCA studies. This is due to missing information on the inventory side about microplastic releases and missing Characterization Factors to quantify the effects of MP. The goal of this study was to elucidate the relevance of MP release into freshwaters from an LCA perspective, by using worst-case assumptions. In accordance with the USEtox framework, an interim and simplified Characterization Factor for the impact category of freshwater ecotoxicity was calculated to be 3231 PAF·m3·d·kg−1. Applying this Characterization Factor, two LCA case studies were conducted, one on a polyester T-Shirt and one with a shower gel containing microplastics. The results show a small contribution of microplastics to the freshwater ecotoxicity for a scenario with state-of-the-art wastewater treatment. Different scenarios varying in microplastic release and removal during wastewater treatment and a sensitivity analysis of the Characterization Factor allowed identifying the potential range of the microplastic contribution to the overall ecotoxicity. In conclusion, the inclusion of microplastic release into LCA only marginally influences the overall environmental effects of the two products in the LCA case studies.

1. Introduction

Over the course of the last decades, microplastics, i.e., plastic particles between 0.1 µm and 5 mm, have become ubiquitous in ecosystems around the globe. Vast volumes are making their way into terrestrial, marine, and freshwater environments [1,2,3,4]. The presence of microplastic may pose a threat to the health of aquatic and terrestrial ecosystems due to their slow degradability and potential uptake by organisms and possible transfer through the food chain [5]. The impacts of microplastics on both marine and freshwater systems have been investigated [5,6]. Different effects of microplastics on freshwater organisms have been observed, e.g., accumulation in digestive and reproductive systems, translocation within the body, interference with nutrient productivity, and cycling and induction of physiological stress in organisms (e.g., behavioral alterations, immune responses, abnormal metabolism, and changes to energy budgets) [7,8]. The Circular Economy Action Plan (CEAP) and the EU Plastic strategy address the presence of microplastics in the environment by “closing the gaps on scientific knowledge related to the risk and occurrence of microplastics in the environment” [9,10].
Within the development of the Life Cycle Assessment (LCA) methodology, plastics were among the first materials investigated (see, e.g., [11]) and among the first materials for which industry published inventory data [12]. Since then, numerous studies have been conducted in relation to plastics, ranging from specific plastic-based products [13,14,15] to plastics waste management [16,17,18]. The formation of microplastics during the life cycle of plastics however has only been considered to a very limited extent in these LCA studies. The need to include microplastic release in environmental sustainability assessments of textiles was put forward by Henry et al. [19], who highlighted the importance of developing indicators (e.g., mass or number of textile microfiber losses) to assess the potential threat of microplastics released from textiles to ecological systems. The lack of inventory data on microplastic emissions along the life cycle of a product and the missing characterization factor (CF) for microplastics (e.g., for freshwater and terrestrial ecotoxicity), is seen as a clear bottleneck in order to assess in a comprehensive manner the environmental impacts of microplastic releases by mean of LCA.
Focusing on the marine environment, the currently ongoing research within the MariLCA project (www.marilca.org (accessed on 31 August 2021)) aims to integrate potential environmental impacts of marine plastics littering in LCA. The project aims to develop a methodological Life Cycle Impact Assessment (LCIA) framework to characterize the impacts of microplastics into the environment, hence, to characterize the “cause-effect” chain of the release of microplastics into the environment. Within this project, Saling et al. [20] developed the first LCA impact assessment method for marine litter, the “Marine Microplastic Potential” (MMP), in units of pellet equivalent points. The authors consider the model behind the MMP method as a starting point for further development of characterization and impact assessment methods relating to marine plastic debris. The model accounts for variations in polymer properties, for example, LDPE film will generate fragments whereas PP will be in the form of microbeads. The calculated effect factor is in units of “pellet equivalents”, representing the relative toxicity of various forms of microplastics compared to PE beads, used as reference form. Although showing promising results, the authors highlight the limited data available regarding the fate of microplastics in the marine environment, including their degradation and lifetime.
Microplastic impacts on freshwater systems have not yet been studied in the context of LCA. The goal of this study was therefore to elucidate whether microplastic emissions into freshwaters could influence the LCA results when considered the impact category of freshwater ecotoxicity. Such information will elucidate whether including microplastic emissions into freshwater in LCA should be further pursued and investigated. To do so, in a first step, a simplified, interim characterization factor for microplastics for the impact category of freshwater ecotoxicity was developed, following the USEtox framework. Using the newly developed interim characterization factor, in the second step of this study, LCA case studies of a polyester T-shirt and a shower gel containing microplastics were conducted in order to investigate the relevance of microplastic releases for the LCA results and their contribution to the freshwater toxicity potential for these two products. The release of microplastics from textiles through washing has been shown to be an important source of those found in freshwaters and seawater, despite efficient wastewater treatment plant removal [3,19,21,22,23]. Various studies have reported that besides the apparel sector, personal care and cosmetic products are among the most relevant sources of microplastics in the freshwater compartment [3,19,24].

2. Materials and Methods

The first section presents the methods and approaches used to calculate the interim characterization factor (CF). The second section presents the LCA case studies and the quantification of the microplastic release into freshwater from a polyester T-shirt and a shower gel.

2.1. Interim and Simplified Characterization Factor (CF) for Microplastics

USEtoxTM was used as the basis to calculate a simplified, interim characterization factor for microplastics for the impact category of freshwater ecotoxicity. The USEtoxTM model [25] is a consensus model of the international LCA community for the assessment of toxicological effects and its use is recommended e.g., by the European Commission’s Product Environmental Footprint (PEF) initiative [26]. USEtoxTM allows for the computation of characterization factors for organic and inorganic substances for the impact categories of human toxicity and freshwater ecotoxicity. The USEtoxTM framework has already been applied to develop for emerging contaminants such as, e.g., nano-TiO2, building upon the advances in environmental fate modeling of nanoparticles [27,28,29]. Within USEtoxTM, the characterization factor of a substance, expressed in comparative toxic units (CTUe) (PAF m3 day kg−1) with PAF standing for the potentially affected fraction, is calculated as:
CF = EF × FF × XF
where, EF—the effect factor—represents the potential fraction of species affected by exposure to the substance (expressed in PAF m3 kg−1); FF—the fate factor—represents the residence time of the substance in a given environmental compartment (in days); and XF—the exposure factor—represents the dissolved fraction of the substance (dimensionless). In this study, XF was set to 1, as a precautionary approach by assuming that the entire particle is available for exposure to aquatic species.

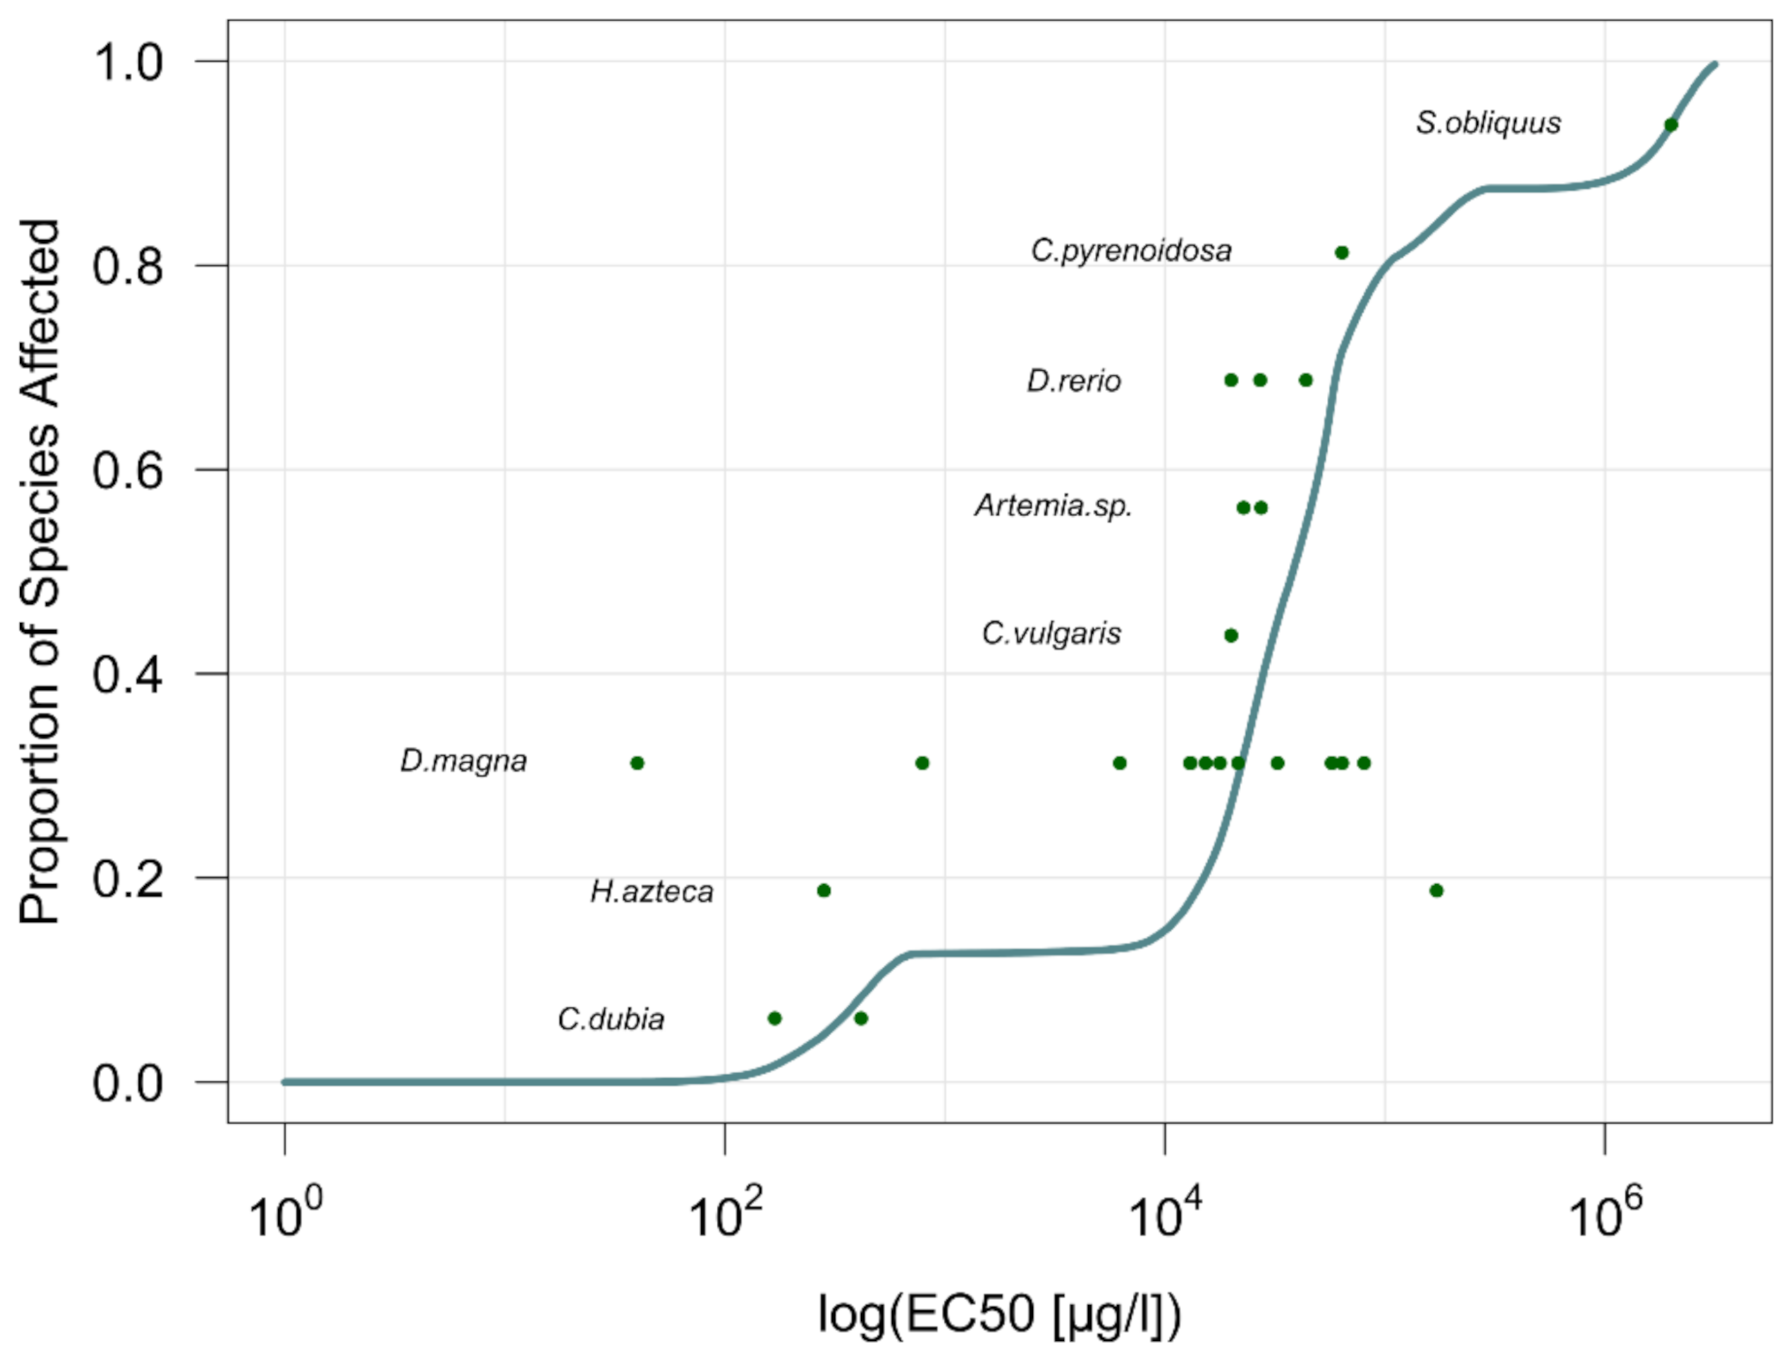
2.1.1. Effect Factor Calculation

Within USEtoxTM, the effect factor (PAF m3 kg−1) is calculated as EF = 0.5/HC50EC50 with HC50EC50 representing the hazard concentration at which 50% of species are exposed to a concentration above their half-maximal concentration (EC50). The HC50EC50 value is calculated as the geometric mean of the chronic EC50 values (kg m−3) at the species level. In the on-hand study, a dataset used for the environmental risk assessment of microplastics in freshwater [30] is used to derive the effect factor for microplastics. This dataset is comprised of toxicity values of studies on freshwater organisms from the three trophic levels (i) algae, (ii) crustaceans, and (iii) fish, as recommended by the USEtoxTM model. Hence, the present calculation is in accordance with the USEtoxTM guidelines, asking for the representation of at least three trophic levels [31]. In accordance with these guidelines, the ‘Highest Observed No Effect Concentration’ (HONEC) and the ‘No Effect Concentration’ (NEC) were omitted, as the data requirements were already met without considering these data points that would have added uncertainty to the results. It was shown that with this dataset no significant differences between different polymers exist [30] and therefore data from all polymer types were pooled together, representing a “generic microplastic”. Details regarding the studies considered for determining the effect factor can be found in the Supplementary Material.
In total 26 ecotoxicity datapoints of various freshwater aquatic species were used to calculate the effect factor, originating from 13 studies and including 4 data points for algae, 19 for crustaceans, and 3 for fish (Table S1 in Supplementary Materials). The various dose descriptors were harmonized and aggregated based on recommendations by [32]: LOEC (lowest observed effect concentration), LC10 (10% lethal concentration) and EC10 (10% effect concentration) endpoints were treated as EC10eq, and LC50 (50% lethal concentration) as EC50 values. From these harmonized dose descriptors, extrapolation factors were applied for all data to be represented as chronic EC50 values. An extrapolation factor of 2 was applied to acute EC50 values (EC50chronic = EC50acute/2) and a factor of 0.5 to chronic EC10eq data (EC50chronic = EC10 eq/0.5). Acute-to-chronic values were estimated for the 16 acute data points, after harmonization of the dose descriptors (Table S1).

2.1.2. Fate Factor Calculation

USEtoxTM accounts for removal (i.e., degradation, adsorption, volatilization) and transport (advection, burial, leaching) processes and adopts the principles of a nested multimedia mass balance modeling. For the latter, the behavior of chemicals released from the technosphere to the environment is simulated as the net result of mass flows between a suite of well-mixed and homogeneous compartments. The physicochemical properties of the substance and of the environment are applied as input parameters to model these transports among different phases as well as related loss rates [31].
As the aim of the on-hand work is to consider a worst-case scenario regarding the fate of microplastics in freshwater, a highly simplified and conservative fate model is used for a first exploratory assessment, providing an upper bound of ecotoxicological impacts [33]. Hence, the fate factor calculation here accounts only for the degradation of the microplastics in freshwater. Within the USEtoxTM fate module, we changed the physical-chemical parameter of degradation accordingly and the background fate parameters for the continental geographical scale as reported in USEtoxTM.
We considered various degradation rates of microplastics in water based on an analysis of existing data regarding degradation rates of plastics (i.e., plastic bags, food storage containers, biodegradable plastic bags, plastic bottles, single-use water bottles) in various environmental compartments [34]. Although this study does not specifically relate to microplastic, we assumed here as a worst-case assumption that the degradation time of plastic and microplastic would be in similar ranges. Hence, we used the reported half-lives of plastic to estimate the degradation rate constants in water. In marine environments, the half-lives varied between 3.1 to over 2500 years depending on the plastic type and study. From these half-life values, we calculated the degradation rate constants in water as:
kdeg w = ln 2 t 1 / 2
with t1/2 being the half-life of the plastic in the marine environment. In the case of the upper bound of half-lives >2500 years, it was assumed that no degradation was taking place in the usual timeframe of 100 years being used in the impact assessment models for LCA studies.
To model a hypothetical worst-case scenario of a high persistence of microplastics in freshwater, we used in USEtoxTM a high molecular weight to confer high impact resistance, an extremely low partitioning coefficient between octanol and water (KOW) to represent the non-solubility of plastics, an extremely low Henry law coefficient (KH25C) to represent that microplastics have no potential of partitioning between air and water, an extremely low vapor pressure (Pvap25), as well as assuming no solubility (Sol25).

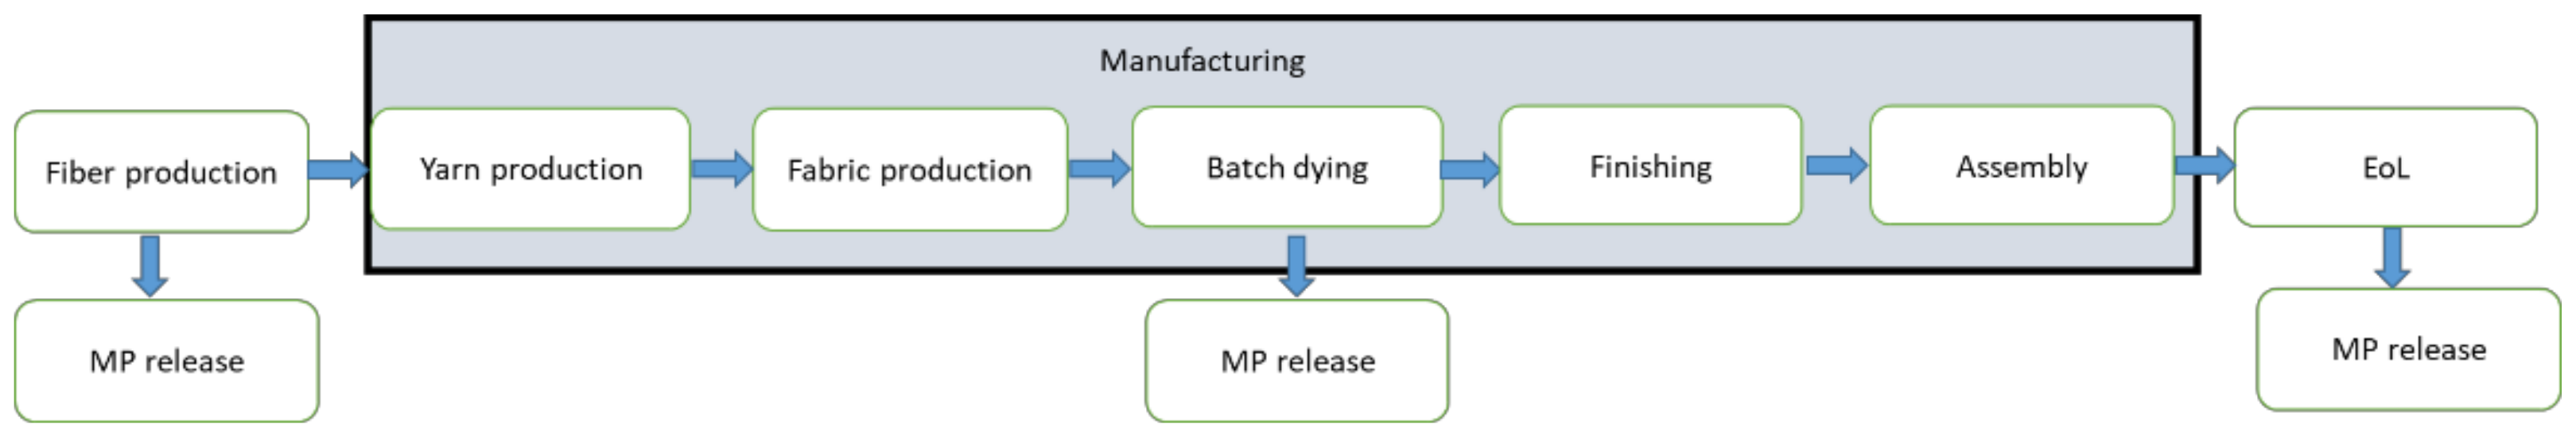
2.2. Life Cycle Assessment of a Polyester T-Shirt and a Shower Gel Containing Microplastics

Two LCA case studies were performed with the aim to evaluate the contribution of microplastic emissions into freshwater for two selected products using the newly developed characterization factor. The two selected case studies are dealing with a polyester T-shirt, considering the release of microplastic during fibers production, textile manufacturing and washing, and a shower gel containing primary microplastics. The detailed inventory data (i.e., input data for material and energy and outputs in form of emissions and waste streams) associated with the two case studies are provided in detail in the Supporting Material File (see Parts S2 and S3). For the polyester T-shirt, these inventory data are derived from a recent publication [35]. The emissions and raw materials used in the case of shower gels were taken from the Product Environmental Footprint Category Rules (PEFCR) developed for shampoos [36]. Due to limited data availability, it has been assumed that the ingredients in shower gels and shampoos do not differ significantly.
The first LCA case study looked at the life cycle of a 100% polyester T-shirt up to its usage, from fiber production over manufacturing of the textile and the assembly of the garment, to the washing during the use phase (Figure 1). The final disposal of the T-shirt was considered outside of the system boundaries, as the present study is focusing on the release of microplastics into freshwater systems within Switzerland, and most textile waste in Switzerland is either incinerated (resulting in no microplastic release to water), recycled, or then exported [3].
A cradle-to-grave LCA study on a bottle of shower gel is performed as a second case study. The life cycle phases included in the study are illustrated in Figure 2: the production of the HDPE bottle, manufacturing of shower gel ingredients, EoL shower gel, and EoL of shower gel bottle. As the scope of this study was to assess the relevance of MP emissions into freshwater, the stages of filling and distributing the shower gel bottles were considered out of scope as no releases of microplastics are expected in these stages. The inventory data for this case are taken from the study of [36], established in the frame of developing Product Environmental Footprint Category Rules (PEFCR) for shampoos. See Part S3 for the inventory data as modeled in ecoinvent v3.6.
Both LCA studies were performed using the LCA software SimaPro (version 9), and the ecoinvent database (version 3.6). The ‘EF method 2.0’ from the Environmental Footprint Initiative [26] was used to characterize the environmental impacts of the selected products. In order to get a comprehensive picture, the following impact categories have been investigated: Climate Change (expressed in kg CO2 eq), Ozone depletion (kg CFC11 eq), Non-cancerous human health effects (CTUh), Cancerous human health effects (CTUh), terrestrial and freshwater Acidification (mol H+ eq), freshwater Eutrophication (kg P eq), marine Eutrophication (kg N eq), terrestrial Eutrophication (mol N eq), and freshwater Ecotoxicity (CTUe). The direct ecotoxicity-related impacts resulting from microplastic releases are accounted for by using the microplastic-specific characterization factors developed in this study.

2.2.1. Quantification of Microplastic Releases from Textile Products (Case Study 1)

Published results from material flow analysis (MFA) studies were used in order to develop inventories for microplastic emissions associated with the production and the use of polyesters textiles. Kawecki and Nowack [3] quantified the plastic flows from products to the environment within Switzerland, considering both macro- and microplastic emissions of seven polymers. From this work, we were able to determine the share of microplastic releases to wastewater resulting from (i) polyester fiber production, as well as (ii) from polyester textile manufacturing. Regarding fiber production, out of the 2709 t of PET used annually for fiber production, 2.48 × 10⁻³ t (i.e., 9.14 × 10⁻⁵%) are released to waste-water in the form of microplastics. In the textile manufacturing phase, this amounts to 1.52 t (3.8 × 10⁻²%) from a total of 4005 tons of PET used for textile manufacturing.
A number of studies have been conducted on the release of microplastics during the washing of polyester textiles. Cai et al. [22] showed that the cutting method used (laser-cut vs. scissor-cut) played an important role in the amount of microplastic fibers released from washing, as well as different amounts being released from either the edge or the surface of the textile, with an average of 84% originating from the former. Considering this, while collecting data on microplastic release from polyester textile washing, we only took into account studies that looked at 100% polyester T-shirts, and not other types of polyester garments (e.g., blankets, jackets, etc.) nor any textile blends. Three such studies were identified. One study found that around 0.0125% mass of the T-shirt was released as microfibers during the first washing cycle, and then lowered and stabilized from the 5th cycle at around 0.002% mass (the garments underwent a total of 10 washing cycles) [37]. Another study found a far greater release in the first cycles, starting at 0.325% mass but stabilizing at 0.04% mass from the 5th wash on [38]. Lastly, one study did not observe a decrease in release over multiple washes, but an average release of 0.01% mass when washed with detergent [21].
On average, a T-shirt will be washed 44 times during its lifetime [39]. To estimate the mass of microplastic release during the lifetime of a T-shirt, we extrapolated the release rates from the three studies listed above by assuming that the release rates observed during the last washing cycles of the studies would be the same for the subsequent cycles. This led to an average of 0.04% mass released as microplastics to wastewater over the lifetime of one T-shirt. Considering the largest release rate reported in the literature, this percentage grows to 0.06% mass. However, not all of these microplastics will end up in the environment. From the release from washing, most microplastics will be removed when going through the wastewater treatment plant. Based on various sources, the average removal rate of microplastics from wastewater treatment plants was calculated to be 97.6% [3,40,41,42]. Therefore, on average 0.001% mass of a polyester T-shirt will end up in freshwater. Considering the largest release rate from washing, this percentage increased to 0.0015% mass.
It should be noted that these release rates assume the use of state-of-the-art wastewater treatment plants. Two additional hypothetical scenarios were considered: (i) the wastewater treatment plant has a microplastic removal rate of 50%, and (ii) wastewater goes straight to the environment (i.e., no water treatment). These removal rates are applied to microplastic released during the use phase (washing) as well as during production and manufacturing (Table 1). In the scope of this study, one T-shirt (weighting 0.154 kg) was used as a functional unit.

2.2.2. Quantification of Microplastics Releases from Personal Care Products (Case Study 2)

Although representing a small share of microplastics released to the environment, those in personal care products commonly in the form of microbeads) account for most of the primary microplastics released to water (as opposed to secondary microplastics, i.e., larger plastic particles that have fragmented down to the micro-scale) [43,44]. A wide variety of personal care products contains such microbeads—here defined as small manufactured plastics pellets, typically measuring less than 0.5 mm [45]—including shampoos, shower gels, facial creams, body scrubs, body glitter, and nail decorations. Polyethylene (PE) microbeads are the most commonly used plastic material in personal care products, representing over 90% of the total amount in Europe [46]. Even if these plastic-based microbeads are considered safe in cosmetics intended for external human application, they are rinsed off during product use, and as a result, are washed down the drain and frequently pass through wastewater treatment processes. One study estimated that 4360 tonnes of microbeads were used in personal care products across Europe (including Norway and Switzerland) in 2012 [46]. The authors further found that microplastics originating from personal care products represent between 0.1% and 1.5% of plastic emissions to the North Sea marine environment. The European Chemicals Agency (ECHA) has proposed a restriction on the use of microplastics in personal care products through a gradual phasing out of these products [47], although debates regarding legal issues, definitions affecting the scope of the ban as well as the exact timeline are still on-going [48,49].
The microplastic content in a range of personal care products has been reported [50]. Regarding shower gels, it was found that microplastic-containing shower gels contained on average 1.78% weight of microplastic. The microplastic release occurs during the EoL of the shower gel only, i.e., the application by its user [36]. For this step, the same scenarios of WWTP removal as for the T-shirt case study were considered. A functional unit of “250 mL of shower gel” was applied. As the density of shower gel is 1.036 g/mL, the weight of shower gel is 259 g. This resulted in 8.5 × 10⁻⁵ kg microplastic being released to freshwaters with a removal rate of 97.6% (average from the literature, see LCA of polyester T-shirt above for details), and 1.78 × 10⁻³ kg considering a hypothetical scenario of a removal rate of 50%.

3. Results

3.1. Interim and Simplified Characterization Factor for Microplastics

Figure 3 shows the plot of the species sensitivity distribution (SSD), showing all data points for each species, collected from the dataset [31] and applied to calculate the EF.
The line corresponds to the mean of the probabilistic SSD modeled by the PSSD+ method [51]. For some organisms, there is a very wide range of EC50 values observed between different studies, but similar ranges have also been observed for other particulate pollutants [51]. The effect factor was calculated as the geometric mean (HC50EC50) of the EC50 values per species. This resulted in an HC50EC50 value of 22.1 mg/L and an effect factor of 22.6 PAF m3/kg.
For the fate factor, three plastic degradation rates were considered based on Chamas et al. [34]. Considering the fastest degradation, the fate factor is 120 days, with a mean degradation rate the fate factor is 142 days, and considering no degradation of microplastics within the water compartment as the worst-case scenario the fate factor is 143 days. The ratio between the smallest and the highest fate factor in our three scenarios is therefore only 1.2, indicating that the degradation rate of plastic is not a relevant parameter influencing the here calculated fate factor. The fate factor is determined mostly by the water exchange rate within the adopted simplified model system.
Table 2 reports the characterization factors calculated as described in Equation (1). With the fastest degradation rate, the characterization factor is 2712 PAF m3/d kg−1. Using a mean degradation rate, the characterization factor is 3209 PAF m3/d kg−1, and considering no degradation of microplastics within the water compartment as the worst-case scenario, the characterization factor is in 3231 PAF m3/d kg−1.

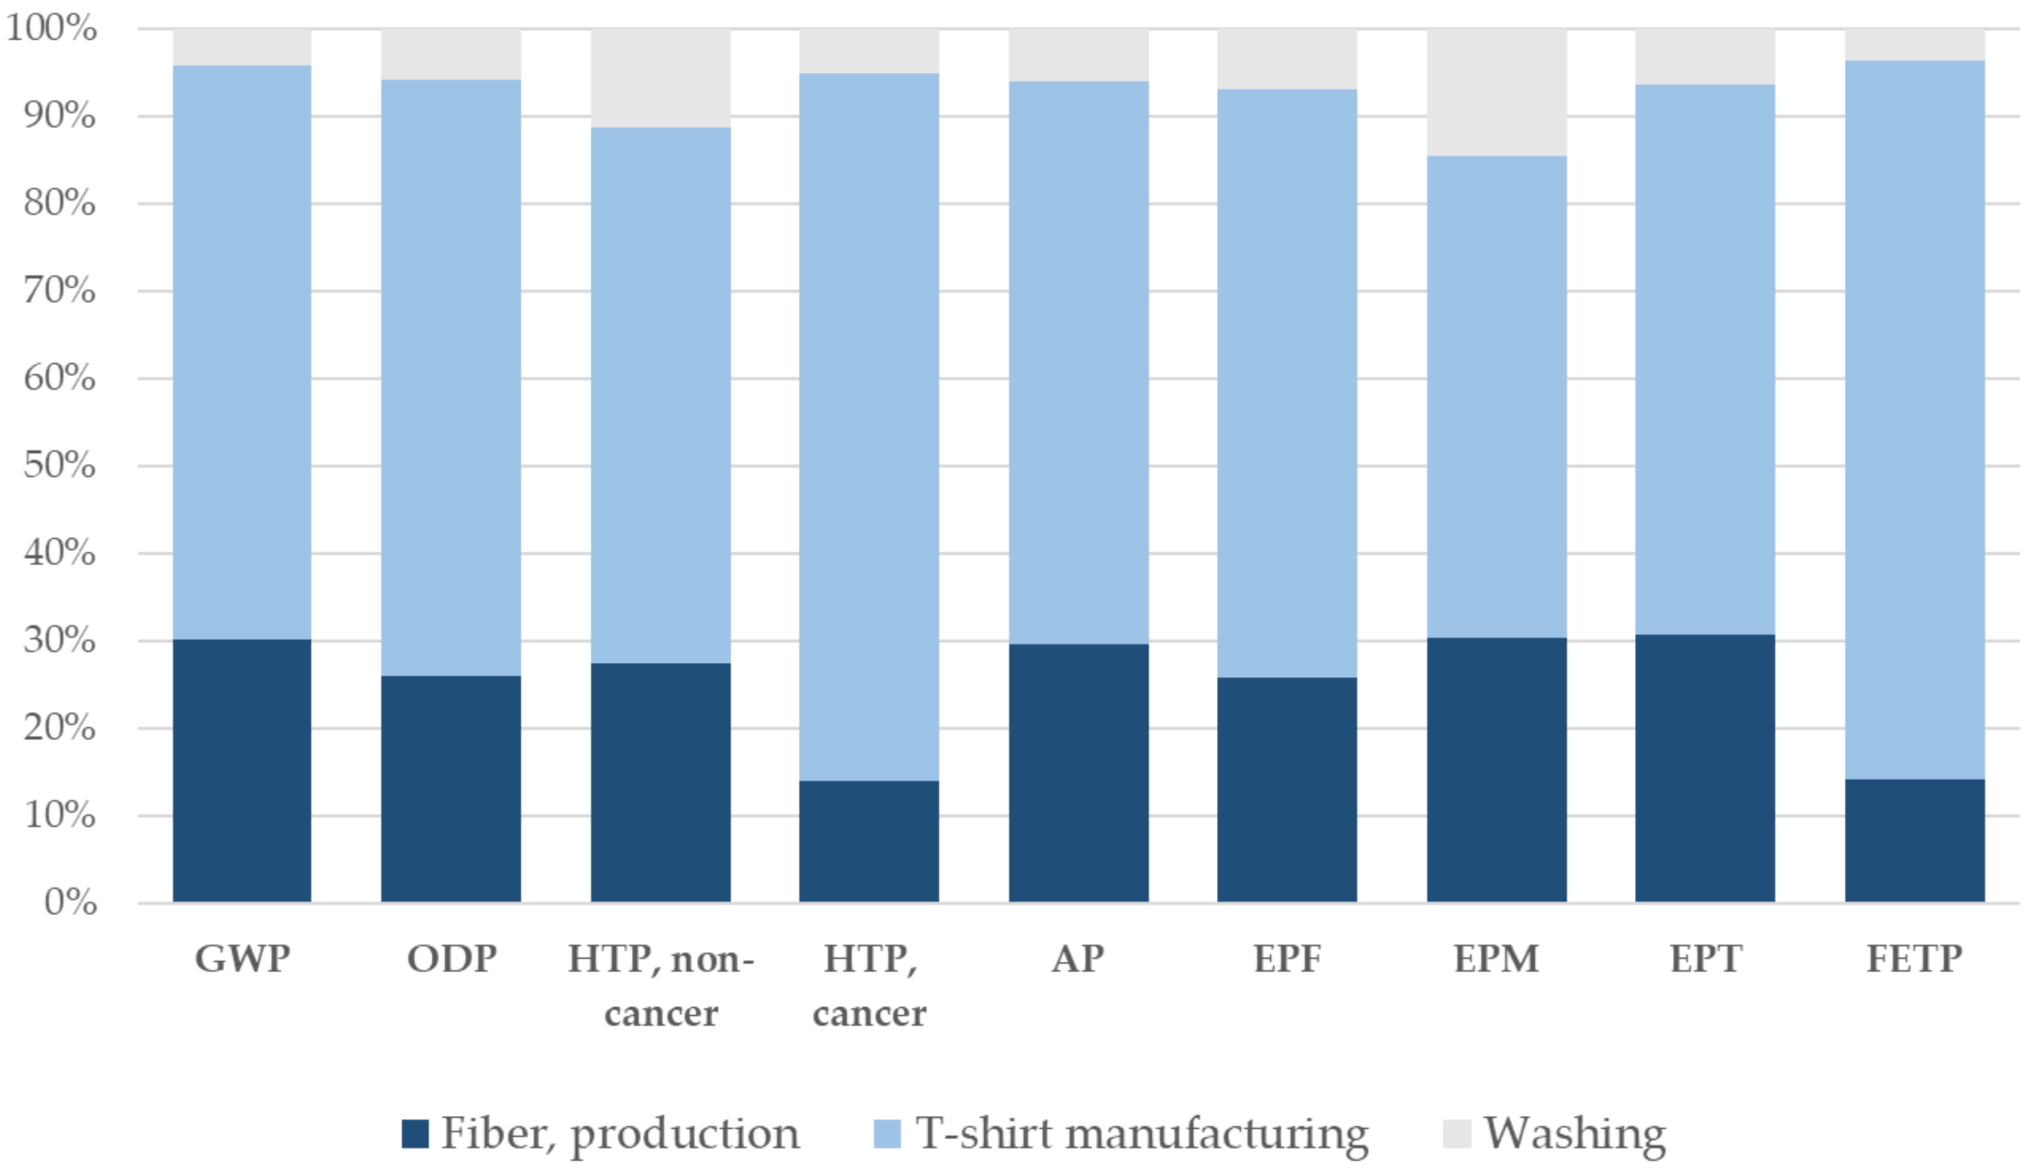
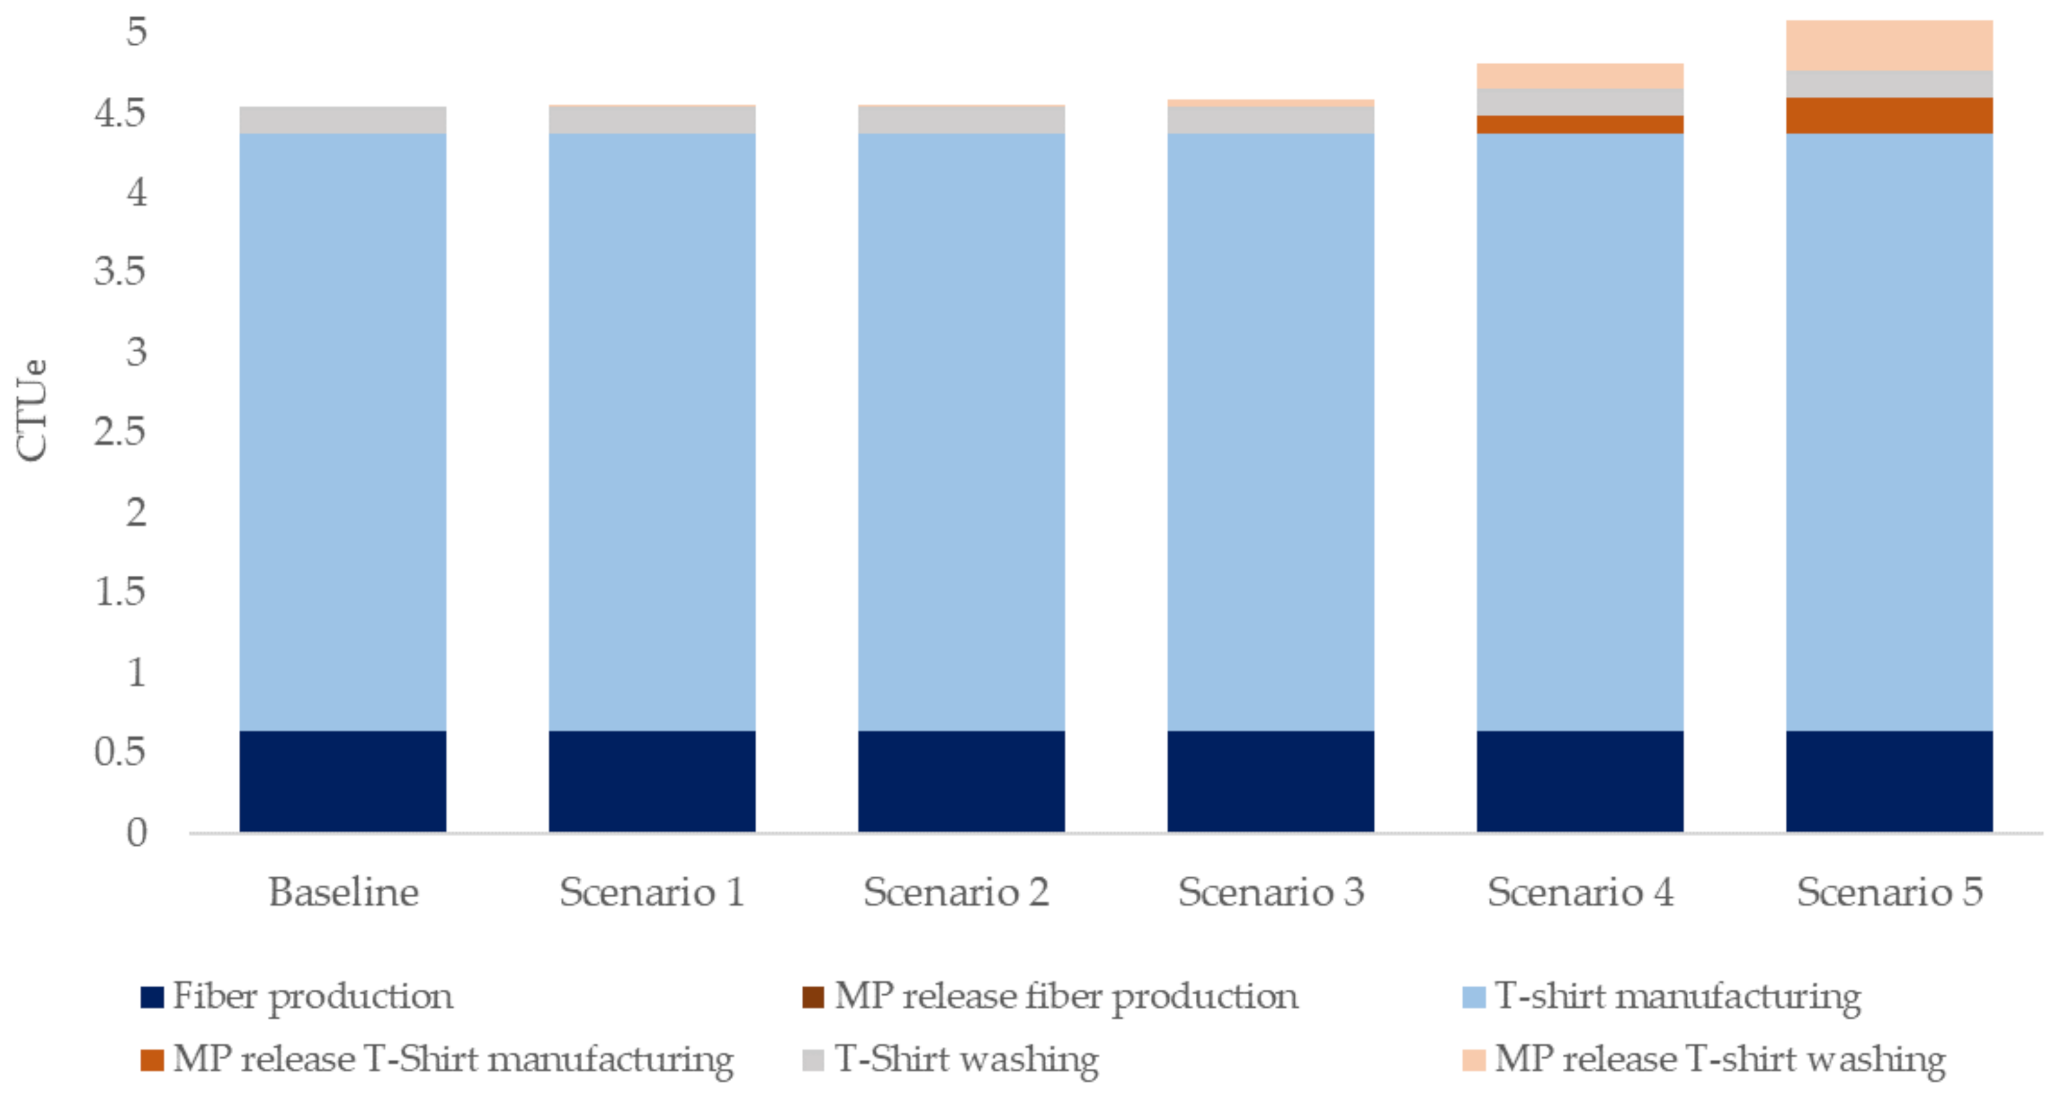
3.2. Life Cycle of a Polyester T-Shirt

In the first step, an LCA analysis was performed for a baseline scenario without any microplastic release. Then, five scenarios with varying release rates during the washing step and different removal rates in the subsequent wastewater treatment (for details see Table 3), were considered Due to a lack of respective data, microplastic release rates during fiber production or during the manufacturing step were not varied; hence, the release rate of microplastics was the same for all five scenarios (i.e., 9.14 × 10⁻⁵% mass for fiber production and 3.8 × 10⁻²% mass from textile manufacturing). However, the different wastewater treatment removal rates were also applied to the microplastic release from these two life cycle phases.
Scenarios 1, 2, and 3 all assume a wastewater removal rate of 97.6%. Scenarios 1 and 2 differ in the assumed microplastic release rate, with scenario 1 representing the mean release rate from the literature (0.04%), and scenario 2 the worst-case release rate identified (0.06%). For scenario 3, we were interested in determining the amount of microplastics that are needed to be released from the T-shirt to account for 1% of the potential impact to freshwater ecotoxicity, compared to the baseline scenario. We found that 0.33% mass would need to be released to wastewater (considering wastewater treatment removal rate of 97%). Scenario 4 assumed a removal rate of 50% from wastewater treatment plants, while scenario 5 assumed that all microplastics released to wastewater end up in the freshwater without any removal. In scenarios 4 and 5, the highest microplastic release rate from washing was accounted for. Although wastewater treatment plants are highly efficient in industrialized countries, this is not the case in many parts of the world, and this will have an important impact on microplastic release rates to freshwater.
The LCA results for the baseline scenario are shown in Figure 4. The analysis revealed that for all examined impact categories the manufacturing phase is dominating. The manufacturing phase (i.e., yarn and fabric production, knitting, dyeing, and finishing) includes several processes that are characterized by intense use of chemicals and show high water and energy consumption.
These results—based on the model in [35]—are in accordance with the findings of other authors who performed LCA studies to characterize the impacts of the various life cycle stages of cotton T-shirts [52] or conducted an LCA analysis on specific processes in the life cycle of textile products (such as dyeing and finishing stages in [53]). For the baseline scenario, the impact category freshwater ecotoxicity is 4.5 CTUe; representing the (ecotoxicity) impacts not related to microplastic releases.
In the next step, the impacts for the category of freshwater ecotoxicity were calculated for the five subsequent scenarios described above in Table 3 and by using the characterization factor for no-degradation (CF = 3234 PAF m3 day kg−1). The results are shown in Figure 5. The microplastic releases are responsible for an increase of 0.23% and 0.29%, respectively, of the impacts on freshwater ecotoxicity for the mean-release (i.e., scenario 1) and the worst-case release scenario (scenario 2). An increase of 6% and 12% on the freshwater impact category was calculated for the scenario 4 (with WWTP removal of 50%) and 5 (no WWTP removal), respectively.
In Figure 6, the freshwater ecotoxicity impacts of scenarios 1 to 5 are shown by varying the characterization factor values for microplastic releases. By varying the values of the fate factor, only a very small difference among the calculated CTUe values is observed (i.e., less than 1% and not larger than 2%). The fate factor values here estimated (by assuming no degradation, fastest degradation, and mean degradation) are similar and this is therefore reflected in the respective CTUe values.

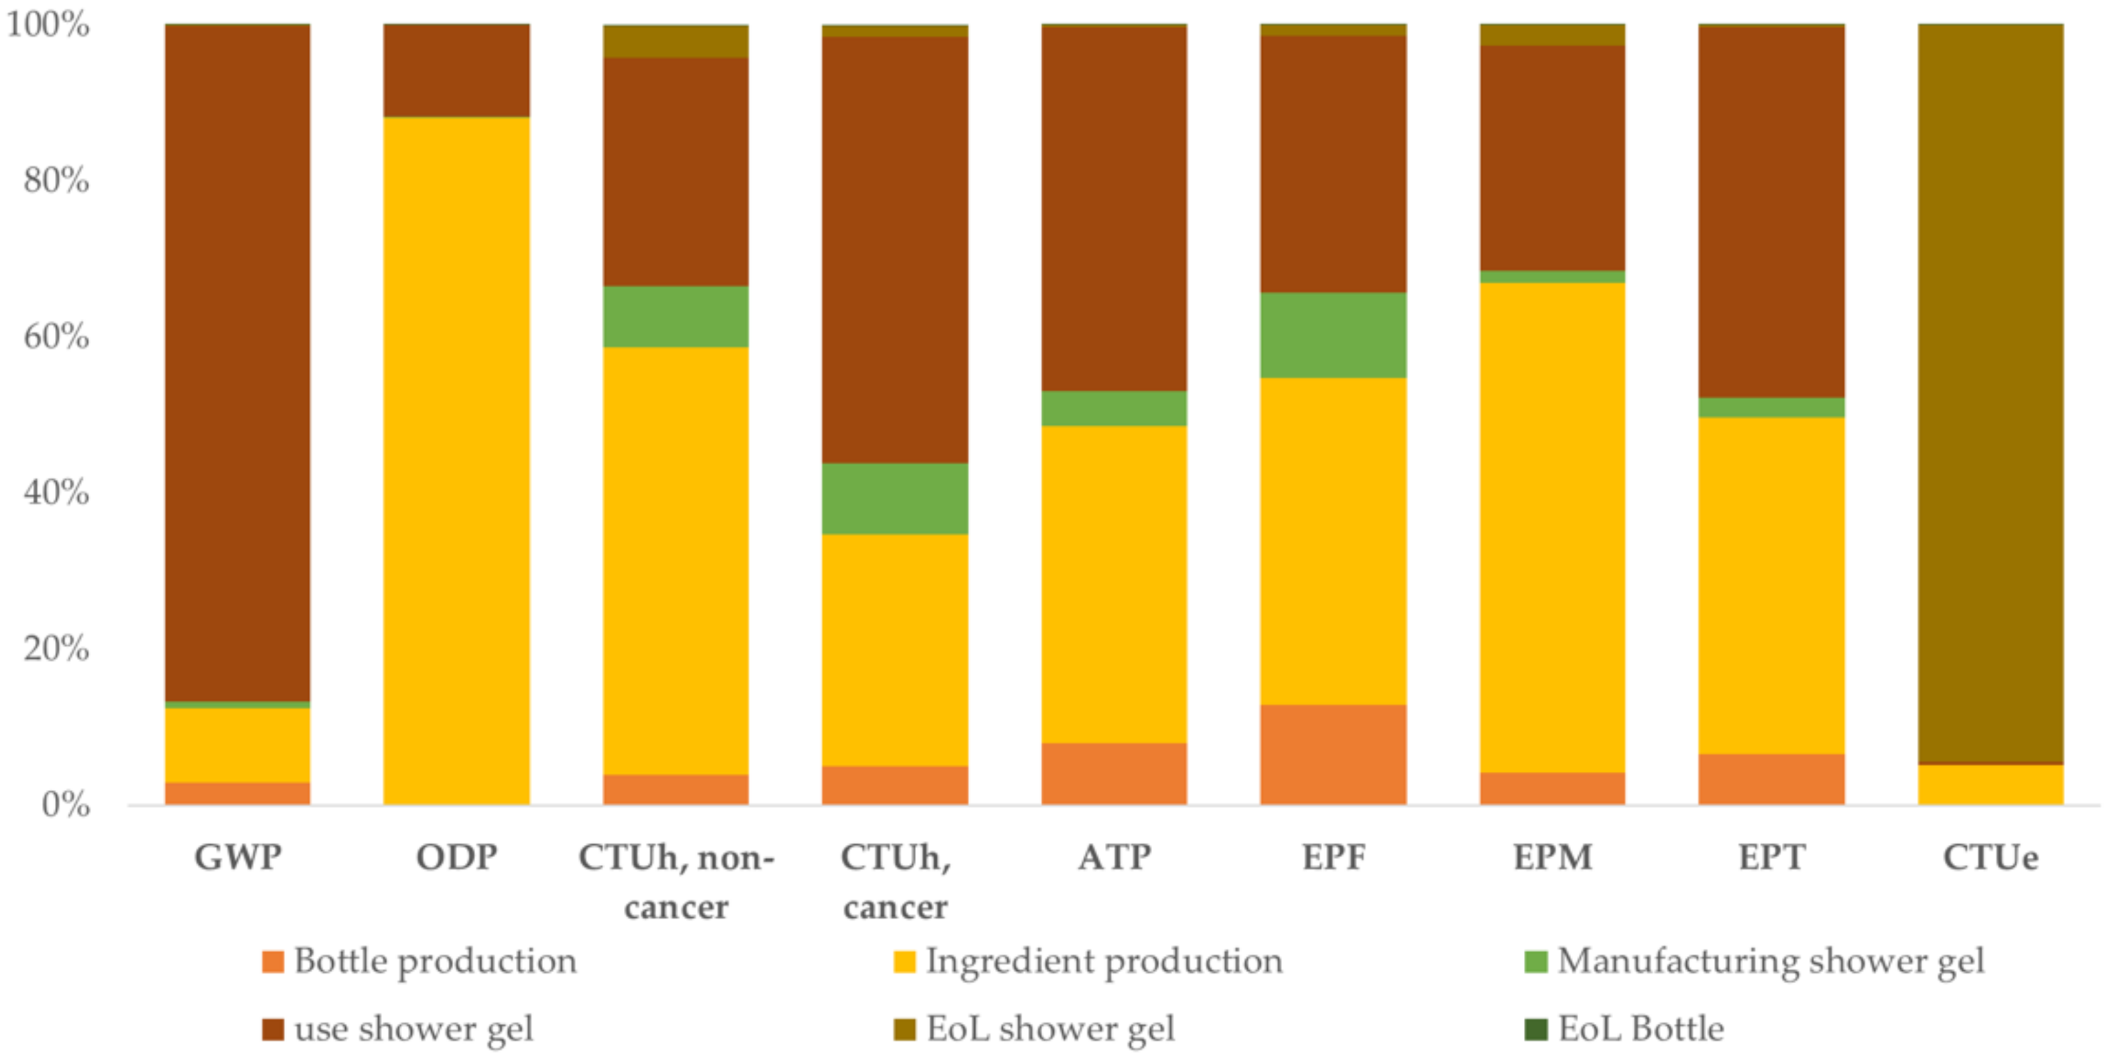
3.3. Life Cycle of a Shower Gel Containing Microplastics

The second case study for the shower gel followed the approach used for the T-shirt case study. A baseline scenario was calculated not considering any microplastic release. Its results are shown in Figure 7. For the impact categories of Ozone Depletion, non-cancer human health, and eutrophication terrestrial, the phase of “ingredient production” is dominant. The phase of production of shower gel ingredients includes the production and transformation of the shampoo ingredients (Supplementary Materials, Table S3). For the impact category of climate change, the phase of “shower gel use” is the main contributor as it includes the water used and energy consumed to heat the water needed to shower. In short, 24.8 showers are needed to consume 259 g of shower gel (10.46 g/shower). For each shower, 15 L of water and 16 MJ of heat are consumed [36].
For the impact category of freshwater ecotoxicity (showing a total impact of 49.6 CTUe for the baseline scenario), the EoL of the shower gel is the dominant phase. This is not surprising, as the end of life of shower gel is modeled assuming that, after use in the shower, a part of the shower gel ingredients goes to freshwater. For the shower gel ingredients, a default wastewater treatment removal rate of 90% was used. For the ingredients belonging to the class of “fragrance”, a removal rate of 99% was applied as reported in [36] (more details in Table S4 in Part S2 of the Supplementary Materials).
Three scenarios were modeled by varying the removal efficiency of microplastics by the wastewater treatment similarly as in the first case study (i.e., ranging from 0% to 97%). As the microplastic release occurs only in the life cycle stage of “EoL of shower gel” the variation of the removal efficiency only refers to this life cycle stage. The impacts on the freshwater ecotoxicity for each life cycle stage of a bottle of shower gel and for each of the three scenarios are reported in Table 4. The total CTUe range from 49.6 for the baseline scenario to 64.5 CTUe for the scenario without any removal of microplastics. The contribution of microplastic release to the total freshwater ecotoxicity impact varies from 24% (removal 0%), to 14% (removal 50%) and to 1% (removal 97%).

4. Discussion

The goal of this work was to elucidate the relevance of microplastic release from an LCA perspective. All calculations and scenarios developed in this work contain worst-case assumptions, precautionary calculations, and simplifications (biased towards worst case) that are here below discussed. An interim and simplified characterization factor for the impact category of freshwater ecotoxicity is proposed and applied in the two LCA case studies.
The effect factor was calculated using ecotoxicity data collected for different types of polymers in a previous study [30]. These authors showed that the available data for all polymer types and forms can be lumped together as no statistically significant influence of polymer type or form could be observed when all data are analyzed within a meta-analysis. Therefore, the use of all ecotoxicity data without disguising among the type of polymer to calculate the effect factor is supported given the current state of knowledge. For a dataset of marine ecotoxicity, a recent study [54] also evaluated the influence of the size of microplastics on the NOEC (No Observed Effect Concentration) values. When microplastic concentrations were used in mass-based units, there was no trend for an effect of particle size visible for NOEC values. When including HONEC (Highest Observed No Effect Concentration) values, there was a trend that particles larger than 100 µm had a larger NOEC, i.e., were less toxic. A meta-analysis of nanoplastics ecotoxicity data [55] revealed that the nanoplastic predicted no-effect concentration (PNEC) was much larger than the microplastics PNEC, suggesting that smaller plastic particles are not necessarily more toxic as often suggested. Hence, the use of one effect factor for all sizes of microplastics is, therefore, a suitable approach given the current state of knowledge. However, in light of the rapid development of the field of effect-testing of microplastics using more standardized methods, the interim effect factor proposed in this work needs to be re-evaluated in due time.
A first attempt to calculate the fate factor for microplastics resulted in a fate factor of 119.6 to 142.8 per day. The fate factor cannot be considered as exhaustive as a simplified fate model was applied to calculate it. While the underlying fate model of USEtoxTM is well established for organic and inorganic compounds, it can a priori not be applied directly to particulate pollutants. Salieri and co-workers showed for engineered nanoparticles that a fate model for particles can be developed within the USEtoxTM context [28]. Also for microplastics, first fate models considering agglomeration and settling of microplastic as main processes affecting microplastic concentrations in water have been published [56]. Here, we opted for a simplified assessment considering no removal of microplastics from the water phase by agglomeration and settling. Hence, the removal of microplastics from the system is represented by the residence time of freshwater as accounted by the USEtox model at the continental scale. To include possible degradation of plastic, two degradation values were applied, representing a slow and fast degradation of plastics in freshwater. Even with the fastest possible degradation rate, the resulting fate factor was decreased by only 20%, indicating that detailed knowledge about the degradation rate would not affect the values of the fate factor to any large degree.
The resulting characterization factor for microplastic cannot be considered exhaustive in the description of the “cause-effect” chain of microplastic once released into the environment. The characterization factor values need to be reviewed once an LCIA model for such a substance will be proposed. The use of a fate model in which fate processes such as settling and biodegradation would be accounted for would result in a lower persistence of microplastics in the freshwater column. However, this would not change our analysis in terms of the relative contribution of the direct impact of microplastics to the impact category of freshwater ecotoxicity. One recent study [20] aimed at creating an entirely new impact category, “Marine Microplastic Potential”. In this context, a characterization factor for microplastics was developed, expressed in terms of “pellet equivalents”. The authors defined and developed a new environmental issue of concern. Using this new impact category, the authors found that the influence of microplastics on the LCA results was dependent on the number of microplastics released over time. We faced similar limitations to those listed in their study, including the strong reliance on assumptions regarding degradation, exposure, and the role that the size, polymer type, and other physicochemical properties of the microplastics will play in determining its fate and toxicological effect on species. The current state of knowledge regarding the influence of these physicochemical properties is limited, although these questions are attracting increasing attention. The size and shape of particles have been shown to play a key role in determining the ingestion likelihood of microplastics by different species and bioavailability, as well as the residence time within the body [8]. Different polymer types have been shown to lead to different levels of adsorption, accumulation, and toxicity in freshwater organisms [57], and more research is needed to gain a deeper understanding of the implications for freshwater and marine systems.
The worst-case approach of high persistence of microplastics in freshwater is justified as our aim was to identify if an inclusion of microplastic releases and the use of the newly developed interim characterization factor for microplastics influences the results of an LCA study. This first assessment can have three outcomes: the application of the new characterization factor has (i) no influence on the resulting ecotoxicity impacts, (ii) the microplastic impacts dominate the impacts on freshwater ecotoxicity, or (iii) depending on the chosen scenario the new characterization factor contributes partially to the overall impacts. In the first case, one could argue that microplastic releases are likely not relevant in the overall context while in case (iii) a much more detailed derivation of the characterization factor would be needed as microplastics have likely a large influence on LCA results. The results of our study show that the inclusion of microplastic releases into LCA can have a certain influence on the LCA results under some conditions, although in a situation with state-of-the-art wastewater treatment this is not the case. However, we have to consider that we only varied the removal efficiency of the microplastics, not of all the other compounds that are released into wastewater. The contribution of microplastics to the overall ecotoxicity impact will therefore be smaller than predicted in this work as the other compounds released into wastewater would also not be removed and therefore will have a larger impact on freshwater ecotoxicity.
Recent studies have shown that the release of microplastics to soils and their impact on terrestrial species is substantial [58,59]. The impacts of microplastics within this environmental compartment warrants further investigation considering that there are many cases of direct emissions to soils, e.g., agricultural film during their use phase, in recycling processes, or via littering [3]. Gavignan et al. [59] put forward those improvements made to wastewater treatment will lead to a shift of microplastics to terrestrial systems, as a large share of sewage sludge ends up on land. The authors, therefore, call for reducing microplastic emissions at the source rather than trying to improve their removal rates from WWTP, as this only shifts the problem to other environmental compartments. There is currently no characterization factor for microplastics regarding terrestrial ecotoxicity. This would be the next step to assess whether accounting for these emissions affects LCA results and warrants further investigation.

5. Conclusions

The LCA results revealed that that microplastic releases to freshwater do not influence the potential impacts on freshwater ecotoxicity to a very high degree, under the conditions of a state-of-the-art wastewater treatment which has been shown to remove microplastics. This result shows that the main ecotoxicological impact of the plastic products is caused by other life cycle stages, such as the production and/or manufacturing stages and the other compounds that are released during all life-cycle stages, rather than the microplastic release. However, scenarios with less efficient wastewater treatment yield different results, with microplastic releases increasing the overall freshwater ecotoxicity impacts substantially. The share of wastewater going to wastewater treatment plants is therefore an important geographical factor that needs to be considered when evaluating the effect of microplastic releases. However, this also applies to all other pollutants released and considered within an LCA.

Supplementary Materials

The following are available online at https://www.mdpi.com/article/10.3390/su13179922/s1: pdf document with supporting tables and literature.

Author Contributions

B.S. and N.S. conceptualization, methodology, writing—original draft preparation, and formal analysis; R.H. supervision, methodology, and writing—review and editing; C.S. funding acquisition, supervision, and editing; B.N. conceptualization, writing—original draft preparation, editing, and supervision. All authors have read and agreed to the published version of the manuscript.

Funding

This publication was supported by the SUBITEX program of Empa (https://subitex.empa.ch/ (accessed on 31 August 2021)) and received partial funding from the European Union’s Horizon 2020 research and innovation programme under grant agreement No. 761000 GREENSENSE.

Institutional Review Board Statement

Not applicable.

Informed Consent Statement

Not applicable.

Data Availability Statement

All data are reported in the manuscript or are given in the Supplementary Materials.

Conflicts of Interest

The authors declare no conflict of interest and the funders had no role in the design of the study; in the collection, analyses, or interpretation of data; in the writing of the manuscript, or in the decision to publish the results.

References

  1. Akdogan, Z.; Guven, B. Microplastics in the environment: A critical review of current understanding and identification of future research needs. Environ. Pollut. 2019, 254, 113011. [Google Scholar] [CrossRef]
  2. Geyer, R.; Jambeck, J.R.; Law, K.L. Production, use, and fate of all plastics ever made. Sci. Adv. 2017, 3, e1700782. [Google Scholar] [CrossRef] [PubMed] [Green Version]
  3. Kawecki, D.; Nowack, B. Polymer-Specific Modeling of the Environmental Emissions of Seven Commodity Plastics As Macro- and Microplastics. Environ. Sci. Technol. 2019, 53, 9664–9676. [Google Scholar] [CrossRef]
  4. Pabortsava, K.; Lampitt, R.S. High concentrations of plastic hidden beneath the surface of the Atlantic Ocean. Nat. Commun. 2020, 11, 4073. [Google Scholar] [CrossRef]
  5. Horton, A.A.; Walton, A.; Spurgeon, D.J.; Lahive, E.; Svendsen, C. Microplastics in freshwater and terrestrial environments: Evaluating the current understanding to identify the knowledge gaps and future research priorities. Sci. Total Environ. 2017, 586, 127–141. [Google Scholar] [CrossRef] [Green Version]
  6. Luo, W.; Su, L.; Craig, N.J.; Du, F.; Wu, C.; Shi, H. Comparison of microplastic pollution in different water bodies from urban creeks to coastal waters. Environ. Pollut. 2019, 246, 174–182. [Google Scholar] [CrossRef]
  7. Li, C.; Busquets, R.; Campos, L.C. Assessment of microplastics in freshwater systems: A review. Sci. Total Environ. 2020, 707, 135578. [Google Scholar] [CrossRef] [PubMed]
  8. Ma, H.; Pu, S.; Liu, S.; Bai, Y.; Mandal, S.; Xing, B. Microplastics in aquatic environments: Toxicity to trigger ecological consequences. Environ. Pollut. 2020, 261, 114089. [Google Scholar] [CrossRef] [PubMed]
  9. European Commission. Communication from the Commission to the European Parliament, the Council, the European Economic and Social Committee and the Committee of the Regions: A European Strategy for Plastics in a Circular Economy; European Commission: Brussels, Belgium, 2018. [Google Scholar]
  10. European Commission. Communication from the Commission to the European Parliament, the Council, the European Economic and Social Committee and the Committee of the Regions: Closing the Loop-An EU Action Plan for the Circular Economy; European Commission: Brussels, Belgium, 2015. [Google Scholar]
  11. Postlethwaite, D. Recent Developments in LCA and Critical Issues. In Environmental Toxicology and Risk Assessment: Third Volume; Hughes, J.S., Biddinger, G.R., Mones, E., Eds.; ASTM International: West Conshohocken, PA, USA, 1995; pp. 332–347. ISBN 978-0-8031-5292-2. [Google Scholar]
  12. Boustead, I. Eco-Balance Methodology for Commodity Thermoplastics; Association of Plastics Manufacturers in Europe: Brussels, Belgium, 1992. [Google Scholar]
  13. Cordella, M.; Bauer, I.; Lehmann, A.; Schulz, M.; Wolf, O. Evolution of disposable baby diapers in Europe: Life cycle assessment of environmental impacts and identification of key areas of improvement. J. Clean. Prod. 2015, 95, 322–331. [Google Scholar] [CrossRef]
  14. Accorsi, R.; Cascini, A.; Cholette, S.; Manzini, R.; Mora, C. Economic and environmental assessment of reusable plastic containers: A food catering supply chain case study. Int. J. Prod. Econ. 2014, 152, 88–101. [Google Scholar] [CrossRef]
  15. Accorsi, R.; Versari, L.; Manzini, R. Glass vs. plastic: Life cycle assessment of extra-virgin olive oil bottles across global supply chains. Sustainability 2015, 7, 2818–2840. [Google Scholar] [CrossRef] [Green Version]
  16. Lazarevic, D.; Aoustin, E.; Buclet, N.; Brandt, N. Plastic waste management in the context of a European recycling society: Comparing results and uncertainties in a life cycle perspective. Resour. Conserv. Recycl. 2010, 55, 246–259. [Google Scholar] [CrossRef]
  17. Rigamonti, L.; Grosso, M.; Møller, J.; Sanchez, V.M.; Magnani, S.; Christensen, T.H. Environmental evaluation of plastic waste management scenarios. Resour. Conserv. Recycl. 2014, 85, 42–53. [Google Scholar] [CrossRef]
  18. Hou, P.; Xu, Y.; Taiebat, M.; Lastoskie, C.; Miller, S.A.; Xu, M. Life cycle assessment of end-of-life treatments for plastic film waste. J. Clean. Prod. 2018, 201, 1052–1060. [Google Scholar] [CrossRef]
  19. Henry, B.; Laitala, K.; Klepp, I.G. Microfibres from apparel and home textiles: Prospects for including microplastics in environmental sustainability assessment. Sci. Total Environ. 2019, 652, 483–494. [Google Scholar] [CrossRef]
  20. Saling, P.; Gyuzeleva, L.; Wittstock, K.; Wessolowski, V.; Griesshammer, R. Life cycle impact assessment of microplastics as one component of marine plastic debris. Int. J. Life Cycle Assess. 2020, 25, 2008–2026. [Google Scholar] [CrossRef]
  21. Hernandez, E.; Nowack, B.; Mitrano, D.M. Polyester Textiles as a Source of Microplastics from Households: A Mechanistic Study to Understand Microfiber Release during Washing. Environ. Sci. Technol. 2017, 51, 7036–7046. [Google Scholar] [CrossRef]
  22. Cai, Y.; Yang, T.; Mitrano, D.M.; Heuberger, M.; Hufenus, R.; Nowack, B. Systematic Study of Microplastic Fiber Release from 12 Different Polyester Textiles during Washing. Environ. Sci. Technol. 2020, 54, 4847–4855. [Google Scholar] [CrossRef] [PubMed]
  23. Fontana, G.D.; Mossotti, R.; Montarsolo, A. Assessment of microplastics release from polyester fabrics: The impact of different washing conditions. Environ. Pollut. 2020, 264, 113960. [Google Scholar] [CrossRef] [PubMed]
  24. Guerranti, C.; Martellini, T.; Perra, G.; Scopetani, C.; Cincinelli, A. Microplastics in cosmetics: Environmental issues and needs for global bans. Environ. Toxicol. Pharmacol. 2019, 68, 75–79. [Google Scholar] [CrossRef]
  25. Rosenbaum, R.K.; Bachmann, T.M.; Gold, L.S.; Huijbregts, M.A.J.; Jolliet, O.; Juraske, R.; Koehler, A.; Larsen, H.F.; MacLeod, M.; Margni, M.; et al. USEtox—the UNEP-SETAC toxicity model: Recommended characterisation factors for human toxicity and freshwater ecotoxicity in life cycle impact assessment. Int. J. Life Cycle Assess. 2008, 13, 532–546. [Google Scholar] [CrossRef] [Green Version]
  26. European Commission. Recommendation 2013/179/EU on the use of common methods to measure and communicate the life cycle environmental performance of products and organisations. Off. J. Eur. Union 2013, 124, 210. [Google Scholar]
  27. Ettrup, K.; Kounina, A.; Hansen, S.F.; Meesters, J.A.J.; Vea, E.B.; Laurent, A. Development of Comparative Toxicity Potentials of TiO2 Nanoparticles for Use in Life Cycle Assessment. Environ. Sci. Technol. 2017, 51, 4027–4037. [Google Scholar] [CrossRef] [Green Version]
  28. Salieri, B.; Hischier, R.; Quik, J.T.K.; Jolliet, O. Fate modelling of nanoparticle releases in LCA: An integrative approach towards “USEtox4Nano”. J. Clean. Prod. 2019, 206, 701–712. [Google Scholar] [CrossRef]
  29. Salieri, B.; Righi, S.; Pasteris, A.; Olsen, S.I. Freshwater ecotoxicity characterisation factor for metal oxide nanoparticles: A case study on titanium dioxide nanoparticle. Sci. Total Environ. 2015, 505, 494–502. [Google Scholar] [CrossRef] [Green Version]
  30. Adam, V.; Yang, T.; Nowack, B. Toward an ecotoxicological risk assessment of microplastics: Comparison of available hazard and exposure data in freshwaters. Environ. Toxicol. Chem. 2019, 38, 436–447. [Google Scholar] [CrossRef] [Green Version]
  31. Fantke, P. USEtox 2.0 Documentation (Version 1); USEtox® International Center: Lyngby, Denmark, 2017. [Google Scholar]
  32. Eckelman, M.J.; Mauter, M.S.; Isaacs, J.A.; Elimelech, M. New perspectives on nanomaterial aquatic ecotoxicity: Production impacts exceed direct exposure impacts for carbon nanotoubes. Environ. Sci. Technol. 2012, 46, 2902–2910. [Google Scholar] [CrossRef] [PubMed]
  33. Chamas, A.; Moon, H.; Zheng, J.; Qiu, Y.; Tabassum, T.; Jang, J.H.; Abu-Omar, M.; Scott, S.L.; Suh, S. Degradation Rates of Plastics in the Environment. ACS Sustain. Chem. Eng. 2020, 8, 3494–3511. [Google Scholar] [CrossRef] [Green Version]
  34. Schmutz, M.; Hischier, R.; Som, C. Factors allowing users to influence the environmental performance of their T-shirt. Sustainability 2021, 13, 2498. [Google Scholar] [CrossRef]
  35. Golsteijn, L.; Lessard, L.; Campion, J.F.; Capelli, A.; D’Enfert, V.; King, H.; Kremer, J.; Krugman, M.; Orliac, H.; Furnemont, S.R.; et al. Developing Product Environmental Footprint Category Rules (PEFCR) for shampoos: The basis for comparable life cycle assessment. Integr. Environ. Assess. Manag. 2018, 14, 649–659. [Google Scholar] [CrossRef] [PubMed]
  36. De Falco, F.; Di Pace, E.; Cocca, M.; Avella, M. The contribution of washing processes of synthetic clothes to microplastic pollution. Sci. Rep. 2019, 9, 6633. [Google Scholar] [CrossRef]
  37. Sillanpää, M.; Sainio, P. Release of polyester and cotton fibers from textiles in machine washings. Environ. Sci. Pollut. Res. 2017, 24, 19313–19321. [Google Scholar] [CrossRef]
  38. Lehmann, A.; Roffeis, M.; Finkbeiner, M. Ökobilanzielle Bewertung des Lebensweges Eines Handelsüblichen weißen Baumwolle T-Shirts in Deutschland; Technische Universität Berlin: Berlin, Germany, 2019. [Google Scholar]
  39. Murphy, F.; Ewins, C.; Carbonnier, F.; Quinn, B. Wastewater Treatment Works (WwTW) as a Source of Microplastics in the Aquatic Environment. Environ. Sci. Technol. 2016, 50, 5800–5808. [Google Scholar] [CrossRef] [Green Version]
  40. Sun, J.; Dai, X.; Wang, Q.; van Loosdrecht, M.C.M.; Ni, B.J. Microplastics in wastewater treatment plants: Detection, occurrence and removal. Water Res. 2019, 152, 21–37. [Google Scholar] [CrossRef]
  41. Schmiedgruber, M.; Hufenus, R.; Mitrano, D.M. Mechanistic understanding of microplastic fiber fate and sampling strategies: Synthesis and utility of metal doped polyester fibers. Water Res. 2019, 155, 423–430. [Google Scholar] [CrossRef]
  42. Cheung, P.K.; Fok, L. Characterisation of plastic microbeads in facial scrubs and their estimated emissions in Mainland China. Water Res. 2017, 122, 53–61. [Google Scholar] [CrossRef]
  43. Napper, I.E.; Bakir, A.; Rowland, S.J.; Thompson, R.C. Characterisation, quantity and sorptive properties of microplastics extracted from cosmetics. Mar. Pollut. Bull. 2015, 99, 178–185. [Google Scholar] [CrossRef] [Green Version]
  44. Hunt, C.F.; Lin, W.H.; Voulvoulis, N. Evaluating alternatives to plastic microbeads in cosmetics. Nat. Sustain. 2020, 4, 366–372. [Google Scholar] [CrossRef]
  45. Gouin, T.; Avalos, J.; Brunning, I.; Brzuska, K.; De Graaf, J.; Kaumanns, J.; Koning, T.; Meyberg, M.; Rettinger, K.; Schlatter, H.; et al. Use of Micro-Plastic Beads in Cosmetic Products in Europe and Their Estimated Emissions to the North Sea Environment. SOFW J. 2015, 141, 40–46. [Google Scholar]
  46. European Chemicals Agency. Annex XV Restriction Report—Proposal for a Restriction: Intentionally Added Microplastics; European Chemicals Agency: Helsinki, Finland, 2019.
  47. Kentin, E.; Kaarto, H. An EU ban on microplastics in cosmetic products and the right to regulate. Rev. Eur. Comp. Int. Environ. Law 2018, 27, 254–266. [Google Scholar] [CrossRef] [Green Version]
  48. Culliney, K. REACH Microplastics Restriction: Worst-Case and Best-Case Scenarios ‘Already Clear’, Says Cosmetics Europe Chief. Available online: https://www.cosmeticsdesign-europe.com/Article/2020/06/18/ECHA-microplastics-restriction-impact-on-beauty-and-personal-care-clear-says-Cosmetics-Europe (accessed on 11 October 2020).
  49. Lei, K.; Qiao, F.; Liu, Q.; Wei, Z.; Qi, H.; Cui, S.; Yue, X.; Deng, Y.; An, L. Microplastics releasing from personal care and cosmetic products in China. Mar. Pollut. Bull. 2017, 123, 122–126. [Google Scholar] [CrossRef]
  50. Aurisano, N.; Albizzati, P.F.; Hauschild, M.; Fantke, P. Extrapolation Factors for Characterizing Freshwater Ecotoxicity Effects. Environ. Toxicol. Chem. 2019, 38, 2568–2582. [Google Scholar] [CrossRef] [PubMed]
  51. Wigger, H.; Kawecki, D.; Nowack, B.; Adam, V. Systematic Consideration of Parameter Uncertainty and Variability in Probabilistic Species Sensitivity Distributions. Integr. Environ. Assess. Manag. 2020, 16, 211–222. [Google Scholar] [CrossRef]
  52. Zhang, Y.; Liu, X.; Xiao, R.; Yuan, Z. Life cycle assessment of cotton T-shirts in China. Int. J. Life Cycle Assess. 2015, 20, 994–1004. [Google Scholar] [CrossRef]
  53. Berradi, M.; Hsissou, R.; Khudhair, M.; Assouag, M.; Cherkaoui, O.; El Bachiri, A.; El Harfi, A. Textile finishing dyes and their impact on aquatic environs. Heliyon 2019, 5, e02711. [Google Scholar] [CrossRef]
  54. Adam, V.; von Wyl, A.; Nowack, B. Probabilistic environmental risk assessment of microplastics in marine habitats. Aquat. Toxicol. 2021, 230, 105689. [Google Scholar] [CrossRef] [PubMed]
  55. Yang, T.; Nowack, B. A Meta-analysis of Ecotoxicological Hazard Data for Nanoplastics in Marine and Freshwater Systems. Environ. Toxicol. Chem. 2020, 39, 2588–2598. [Google Scholar] [CrossRef]
  56. de Klein, J.J.M.; Quik, J.T.K.; Bäuerlein, P.S.; Koelmans, A.A. Towards validation of the NanoDUFLOW nanoparticle fate model for the river Dommel, The Netherlands. Environ. Sci. Nano 2016, 3, 434–441. [Google Scholar] [CrossRef]
  57. Sheng, C.; Zhang, S.; Zhang, Y. The influence of different polymer types of microplastics on adsorption, accumulation, and toxicity of triclosan in zebrafish. J. Hazard. Mater. 2021, 402, 123733. [Google Scholar] [CrossRef]
  58. Rillig, M.C.; Lehmann, A. Microplastic in terrestrial ecosystems. Science 2020, 368, 1430–1431. [Google Scholar] [CrossRef]
  59. Gavigan, J.; Kefela, T.; Macadam-Somer, I.; Suh, S.; Geyer, R. Synthetic microfiber emissions to land rival those to waterbodies and are growing. PLoS ONE 2020, 15, e0237839. [Google Scholar] [CrossRef] [PubMed]
Figure 1. Life cycle stage of a polyester T-shirt. The End of Life (EoL) is outside the system boundaries. (MP: microplastics).
Sustainability 13 09922 g001
Figure 2. Life cycle stage of the shower gel containing microplastics considered in the LCA. (MP: microplastics).
Sustainability 13 09922 g002
Figure 3. Species sensitivity distribution (SSD) plot of the eEC50 values for freshwater ecotoxicity-of microplastics used to compute the HC50EC50.
Sustainability 13 09922 g003
Figure 4. Relative contribution of the fiber production, T-shirt manufacturing, washing on the selected impact categories for one T-shirt. For this calculation, no microplastic release was considered (baseline scenario). GWP: Global warming potential; ODP: Ozone depletion potential; HTP, non-cancer: Non-cancerous human toxicity potential; HTP, cancer: Cancerous human toxicity potential; AP: Acidification potential (terrestrial and freshwater); EPF: Eutrophication potential freshwater; EPM: Eutrophication potential marine; EPT: Eutrophication potential terrestrial; FETP: Freshwater ecotoxicity potential.
Sustainability 13 09922 g004
Figure 5. Impacts of a polyester T-shirt on the freshwater ecotoxicity potential (according to the EF method), considering several scenarios with various release rates from washing of the T-shirt during its use phase. For details about the scenarios see Table 3.
Sustainability 13 09922 g005
Figure 6. Freshwater ecotoxicity impacts (CTUe) calculated for the scenarios 1 to 5 (Table 3) by varying the value of the CF (see Table 2).
Sustainability 13 09922 g006
Figure 7. Relative contribution of each life cycle phase of a bottle of shower gel on the selected impact categories (EF method). No microplastic release was considered in this baseline scenario. GWP: Global warming potential; ODP: Ozone depletion potential; HTP, non-cancer: Non-cancerous human toxicity potential; HTP, cancer: Cancerous human toxicity potential; AP: Acidification potential (terrestrial and freshwater); EPF: Eutrophication potential freshwater; EPM: Eutrophication potential marine; EPT: Eutrophication potential terrestrial; FETP: Freshwater ecotoxicity potential.
Sustainability 13 09922 g007
Table 1. Microplastics (MP)-release (kg) during washing in the life cycle stages of the production and use phase of a T-shirt to WWTP and to freshwater via WWTP having different efficiency of treatment.
Life Cycle StageMP (kg) to WWTPMP (kg) to Freshwater
(WWTP Removal 97.6%)
MP (kg) to Freshwater
(WWTP Removal 50%)
MP (kg) to Freshwater
(No WWTP)
Fiber production of one T-shirt2.40 × 10−75.74 × 10−91.20 × 10−72.40 × 10⁻⁷
Manufacturing of one T-shirt6.91 × 10−51.65 × 10−63.46 × 10−56.91 × 10⁻⁵
Washing of one T-shirt (44 cycles)6.20 × 10−51.48 × 10−63.10 × 10−56.20 × 10−5
Table 2. Calculated fate factor (FF), effect factor (EF) and characterization factor (CF) for microplastics for different degradation rates (s−1).
KdegW
(s−1)
FF
(Days)
EF
(PAF m3 kg−1)
XF
(-)
CF
(PAF m3 d kg−1)
Fast degradation1.6 × 10-812022.612712
Mean degradation5.8 × 10-1014222.613209
No degradation014322.613231
Table 3. The scenarios used to identify the effect of changes of microplastic release and removal rates.
ScenarioMP ReleaseWWTP Removal
Baseline00
1Mean release0.04%97.6%
2Worst-case release0.06%97.6%
31% increase of ecotoxicity impacts0.33%97.6%
4WWTP removal 50%0.06%50%
5No WWTP removal0.06%0%
Table 4. Freshwater ecotoxicity potential (expressed in CTUe) for each life cycle stage of a bottle of shower gel. Three scenarios were investigated by varying the WWTP removal efficiency for microplastics within the life cycle stage of the EoL of the shower gel.
BaselineWWTP 0%WWTP 50%WWTP 97%
Bottle production0.039
Ingredients production2.48
Manufacturing shower gel0.054
Use shower gel0.19
EoL shower gel46.961.854.347.2
EoL Bottle0.005
Total49.664.557.150
Publisher’s Note: MDPI stays neutral with regard to jurisdictional claims in published maps and institutional affiliations.

