Abstract
This paper’s purpose is to shed light on the current understanding of the environmental benefits of vegetarian and vegan diets, considering the inclusion of a significant share of processed foods, such as plant-based burgers. We review recent Environmental Life Cycle Assessments of the three main diet types, omnivore, vegetarian, and vegan, and then assesses the environmental impacts of adding two commercial brands of plant-based burgers to vegetarian and vegan diets. The recent literature confirms that compared to omnivore diets adhering to the same dietary guidelines, vegan diets reduce land-use impacts by 50–86%, water use by 22–70%, and greenhouse gas emissions by 21–70%, while vegetarian diets achieve reductions of 27–84% in land use, 15–69% in water use, and 24–56% in greenhouse emissions. The environmental benefits of vegan and vegetarian diets are not affected by the consumption of highly processed plant-based burgers. Consumers reduce land use, water use, and greenhouse gas emissions between 87% and 96% by choosing a Beyond or Impossible burger instead of a regular beef patty. These results are robust to the uncertainties associated with a variety of beef production systems; there is no indication that a situation or condition may make beef burgers more environmentally friendly than these two plant-based alternatives, or that the addition of plant-based meats to vegan and vegetarian diets may reduce their environmental benefits.
1. Introduction
Agriculture uses about 50% of habitable land on Earth and food production is responsible for 20–50% of human impacts on the environment including deforestation, biodiversity loss, soil degradation, freshwater consumption, eutrophication of water bodies, air pollution, and the emissions of greenhouse gasses [1]. Sustained increases in both human and ruminant livestock populations, and a rise in per capita meat production [2] have been identified as key contributors to the impending climate crisis [3].
With population growth expected to reach 12 billion people by 2100 [4] and increased per capita demand of meat and dairy products in developing nations where average income is rising [2,5], there is a gloom prospect for increased food-related environmental degradation. While there is variation in the type and intensity of the impacts depending on farming practices and regions, meat and dairy are known to have significantly higher impacts on the environment than other products. This is due to overgrazing, water contamination from waste runoff, biodiversity loss due to landscape conversion for grazing and feed production, and greenhouse gas emissions related to livestock digestion [1]. Livestock production also requires caloric inputs in the form of grains, amounting to 45% of global grain production [6]. Feeding grain crops to livestock is less efficient with regards to land, energy, and water use, than growing crops for direct human consumption, because only between 4% and 20% of all protein in cereal and leguminous grains fed to animals is converted to edible protein [7].
Environmental life-cycle assessment (LCA) studies have shown that low meat, vegetarian (no red meat, poultry, fish, or seafood), and vegan (vegetarian with no eggs or dairy) diets have significant environmental benefits in comparison to more carnivorous dietary trends in wealthy countries. However, despite scientific consensus on the environmental benefits of reduced meat consumption, a major diet shift does not seem to be a policy priority in the US, nor is it forcibly advocated by sustainability scientists. Reluctance to push for reduced consumption of meat comes, among other reasons, from fear of antagonizing with cherished values and culture [8]. New plant-based burgers may be the solution to this conundrum if two conditions are met: (a) consumers can accept them as a perfect meat substitute, and (b) they indeed are more sustainable. This paper investigates the second condition, asking whether less-healthy plant-based diets, those that abstain entirely from animal products but include high shares of industrially processed meat-substitutes, have the lowest environmental footprint. How are the environmental impacts of a vegan diet affected in terms of land use, water use, and greenhouse emissions, when highly processed plant-based meat substitutes are included? This paper reviews published LCA studies to shed light on this question and summarizes the consensus on the sustainability of vegetarian and vegan diets. It then analyses the impacts of including two brands of plant-based burgers in diets. Section 2 describes the methods, Section 3 presents the findings on vegetarian and vegan diets, Section 4 shows results of the plant-based burgers impacts, Section 5 discusses findings, and Section 6 concludes.
2. Methods: Review Protocol
This systematic review followed the PRISMA guidelines [9]. In this section we describe the eligibility criteria, information sources, and search strategy that led to the articles included in this review. In Section 2.1 we discuss the comparability of these papers’ results.
The objective of this review is to assess the effect of human dietary change on GHG emissions, water resources, and land use. The literature search of comparative LCA of diets was performed between October 2019 and February of 2020 with the use of Web of Science and Google Scholar (See Supplementary Materials with charts describing searches). The term: “diet” was combined with the terms “greenhouse” or “land” or “water”, and the terms “lifecycle” or “footprint.” Articles included in this review meet the following six inclusion criteria: (i) English-language publications; (ii) published between 2000 and 2019; (iii) published in peer-reviewed scientific journals, (iv) dietary scenario analysis is performed for a complete diet; (v) quantitative estimates of the effect on GHG emissions and/or land use and/or water demand of human dietary change are provided; (vi) information provided allows calculating a % reduction in one of the three environmental impacts associated to a shift to a vegetarian and/or vegan diet, from a comparable omnivore diet.
The inclusion criteria were set to increase the comparability between studies, to capture the effect of dietary change in the current food system, and to ensure that included articles were of acceptable quality. Determination of articles that meet the first five inclusion criteria was made based on information available in titles and abstracts of the articles, while the sixth criteria was assessed after a complete text review. In total, 34 articles fulfilled the criteria and were utilized in the review.
Information for the comparative LCA of burger patties was taken directly from Impossible Foods and Beyond Meat’s published LCA reports. The data from Beyond Meat was adjusted to reflect a smaller system boundary that does not include transportation impacts, as Impossible Foods’ report did not include this information. The assumption was made that plant-based and beef burgers have comparable transportation and distribution, and therefore low variation in impacts for these stages. Information on the environmental impacts and life cycle process of beef production was obtained from the USDA and [10].
2.1. Fair Comparisons of Different Diets
While the studies reviewed looked at different countries and diets, their results are comparable because they all provided or allowed for the estimation of the change in environmental impacts due to a switch from a comparable omnivorous diet to a vegetarian or vegan diet with the same caloric content. Our focus on the percent change from a diet switch relative to the environmental impacts of the baseline omnivorous diet described in each study, makes the findings comparable across papers. Within each paper, the environmental impacts of one diet are comparable to those of another diet because these are expressed as a function of calories provided, taking as a benchmark a requirement of between 2000 and 2700 kcal/person/day. Standardizing environmental impacts, per kcal/person/day, known as the Functional Unit (FU) in LCA, is required for a fair comparison between different diets. This choice of FU is better than the alternatives [11] because it guarantees that if a diet is found to have lower environmental impacts than others, this is not due to differences in the caloric values that would make it unsuitable for widespread adoption. Besides caloric content, there is growing consensus on the need to focus on nutritional content when analyzing diets’ sustainability. Therefore, most papers included in Table 1 provide information on omnivorous, vegetarian, and/or vegan diets that, besides having the same caloric content, are comparable because they all meet the same dietary guidelines. In a few cases, the papers analyze observed diets among individuals of the same region rather than modeled guideline-compliant diets. We have included those papers that provide information on impacts from observed omnivore diets and isocaloric observed vegetarian and/or vegan diets (i.e., [12,13]). Most of the reviewed articles (27) provide information on guideline-compliant omnivorous diets that we compare with a vegetarian/vegan guideline-compliant diet. This comparison among diets meeting the same dietary recommendations ensures that any environmental impact from vegetarian or vegan diets occurs independently of changes in calories or nutritional value.

Table 1.
Synopsis of 34 studies reviewed in this paper. All studies were published in the last decade and looked at the life cycle environmental impact, or footprint, of vegetarian and/or vegan diets.
Among the 34 articles compared, three ([14,15,16]) present literature reviews that calculate the percent differences between diets. For these, we report the average.
3. Findings: Current Knowledge on Environmental Sustainability of Human Diets
This section, summarizes the findings of 34 papers that study the environmental impacts of diet, selected following the protocol specified in Section 2. Table 1 presents the main attributes and results of each of the studies analyzed.
3.1. Diets Studied
The studies considered examine the environmental impacts of food in the light of three typical diets: omnivore, lacto-ovo vegetarian, and vegan/plant-based, and the adherence to dietary guidelines. Those categorized as omnivorous are based on either observed or modeled dietary guidelines that recommend nutrition from all food groups. Omnivorous diets include meat, seafood, dairy, eggs, legumes, fruits, vegetables, starches, and sweets. Diets categorized as vegetarian consist of all major food groups, but replace meat and seafood with non-meat or dairy products to meet the same nutritional or caloric needs, depending on the defined functional unit. Diets categorized as vegan replace all animal-based products, including milk and eggs, with plant-based foods, including non-dairy milk and soy products.
3.2. Main Finding: Vegetarian and Vegan Diets Have Lowest Impacts on Land Use, Water Use, and GHG Emissions
The reviewed studies find that the most significant environmental benefits across all three indicators of greenhouse gas emissions, water use, and land use can be achieved with vegan diets. All studies considered found that vegan diets contribute the least to GHG emissions. In addition, almost all studies found that vegan diets require less land and water. The only exceptions are two studies, [29,32], which found that vegetarian diets are preferable to reduce land and water use. As Figure 1 shows, the potential to reduce environmental impacts is reported as a relative change in greenhouse gas (GHG) emissions, land demand, and water demand from a baseline of omnivore diets. Various studies used different system boundaries, functional units, assumptions on direct and indirect land use change, and assumptions on blue and green water use. Nevertheless, as explained in Section 2, each paper maintained constant metrics within its analysis of diets and environmental impacts, so the relative percent changes between omnivore and vegetarian, and omnivore and vegan scenarios allow for comparison across studies.
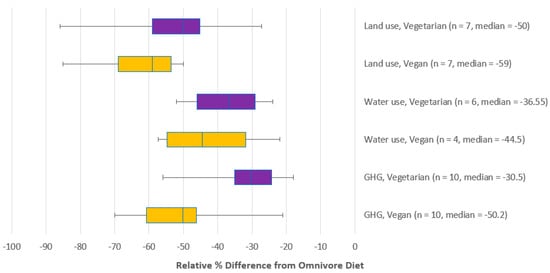
Figure 1.
Percent reductions that can be achieved in agricultural land use, water use, and GHG emissions with a vegetarian (purple) and vegan (orange) diet, as reported by the 34 studies listed on Table 1. Note: n = number of studies, midline represents the median, and error bars show minimum and maximum reductions recorded. Most points represent reductions among diets with the same caloric content adhering to the same dietary guidelines. The exception are three values (one for land use vegetarian, one for land use vegan, and one for GHG vegetarian) that reflect a comparison among observed diets standardized to same caloric content. The average reductions reported in the three systematic review’s papers are included as a single point.
3.2.1. Land Use Impacts of Vegetarian and Vegan Diets
In LCA, the land use demand of a food product is quantified as the area (e.g., m2 or hectares (ha)) of land required to produce one functional unit of food. Land can either be the territory converted to cropland or, in the case of animal-based foods, is the land occupied by the animals and their feed. Environmental impacts depend on more than just the size of terrestrial land occupied and are dependent on the type of land used, its purpose before agricultural conversion, and its geographic location [14]. Natural landscapes converted for agriculture are transformed into grazing land, perennial cropland, and cultivated cropland [29]. Omnivorous diets rely on all these three types, with grazing land for cattle and ruminants occupying over half of the total land required for food production, vegetarians rely primarily on perennial and cultivated cropland, and vegans only need cultivated cropland [29]. Peters et al. [29] found that for omnivore diet patterns (baseline and an omnivore healthy diet) approximately 20% of the available cropland was devoted to food crops (grains, fruit, vegetables, pulses, nuts, and sweeteners) and about 80% to primarily feed and forage crops (feed grains, oilseeds, hay, and pasture). The breakdown provides reasoning as to why plant-based diets have a smaller footprint with respect to land occupation.
Ten of the reviewed studies analyzed dietary scenarios’ land use. Collective results suggest that a shift to vegan or vegetarian diets has the largest potential to reduce the demand for agriculture land. Baseline diets had the highest requirements in all studies, and when included, observed dietary trends demanded larger land area than hypothetical omnivore models. Vegetarian scenarios were found to require 27% to 84% less land than omnivore scenarios with an average of 51%. Vegan scenarios were estimated to require 50% to 86% less with an average 62% reduction. Vegan scenarios resulted in greater estimated reductions in land use than vegetarian scenarios in all but one study, Peters et al., 2016.
3.2.2. Water Use Impacts of Vegetarian and Vegan Diets
The water footprint of agricultural products breaks down into three components: blue, green, and grey water footprint. The blue water footprint refers to the volume of surface and groundwater consumed throughout the production of a good. The green water footprint refers to the rainwater consumed, which is no longer available for other purposes. Grey water footprint refers to the volume of freshwater that is polluted by pesticides or manure from an agricultural site and needs treatment [45]. Studies typically measure blue and green water consumption as water use and consider grey water in a separate category, such as pollution or eutrophication potential. For the studies discussed in this review, green and blue water consumption are considered collectively as a metric of total water consumption.
Research shows that livestock is the greatest consumer of water per kg product [46]. The most apparent demand for water related to livestock production is drinking and servicing. Livestock consumes water through drinking, grazing, supplemental feed, and metabolic water produced by oxidation of nutrients and loses water through respiration, evaporation from the skin, defecation, and urination [46]. The amount of water needed by the animals varies drastically with the region’s climate and whether the farm is an industrial or grazing system. In industrialized farms, water is also required to clean production units, wash animals, and waste management [47]. Each processing step, from shipping live cattle and slaughtering to trimming and curing meat, requires water inputs [46]. While not all cattle are slaughtered for beef, even dairy production requires significant amounts of water, estimated at around 1020 L of water per kg of milk, with an even higher water dependency for derived products such as butter and cheese [48]. Plant-based foods generally have lower water requirements, with vegetables requiring 15 L/kg product and fruits requiring 45 L/kg [25]. However, vegans typically consume more nuts than omnivores, which require 9063 L/kg more water than milk does [25,49].
Eighteen of the studies analyzed looked at total water use under vegetarian dietary scenarios and six under vegan scenarios. According to the findings, switching from an omnivore diet to a vegan or vegetarian diet dramatically reduces the amount of freshwater consumed per capita. Compared to the baseline omnivore diet, vegetarian scenarios achieved reductions between 15% and 69% with an average of 27%, and vegan scenarios achieved between 22% and 70% reductions with an average of 43%.
3.2.3. Greenhouse Emission Impacts of Vegetarian and Vegan Diets
The 19 studies that looked at greenhouse gas emissions reported reductions from vegetarian and vegan diets. A vegan diet results in the greatest reduction of emissions with a 21% to 70% decrease in GHG emissions and an average of 50% reduction relative to comparable omnivore scenarios. Vegetarian diets were also found to result in significantly lower emissions, 24% to 56% with an average of 33%. Vegan scenarios achieved more significant reductions in GHG emissions than vegetarian scenarios in every study reviewed.
The three most common greenhouse gases (GHG) related to agriculture are methane (CH4), nitrous oxide (N2O), and carbon dioxide (CO2). Their impact on the atmosphere over 100 years is measured as global warming potential and standardized to CO2 equivalence, 1 ton of CH4 equal to 34 tons of CO2 and 1 ton of N2O equivalent to 298 tons of CO2 [50]. The food system produces greenhouse gas emissions at all stages in its life cycle, from the farming process itself to the manufacture, distribution and cold storage to food preparation, consumption in the home, and the disposal of waste [51]. For crops and feed, N2O is the most significant GHG emitted [52] as excess nitrogen from N fertilizers is converted to N2O by soil bacteria through the nitrification-denitrification process [1]. The life cycle of animal production of monogastric and ruminant animals is also a significant cause of GHG emissions. For monogastric animals such as pigs and poultry, the feed production accounts for most of the emissions, followed by manure management, and climate control [53]. Meanwhile, for ruminants such as cows, sheep, and goats, CH4 emissions are the greatest contributors to global warming potential (Steinfeld et al., 2006). Most methane originates from enteric fermentation, i.e., when feed is digested in the rumen, while a minor share comes from manure management [52]. Figure 2 illustrates the contribution of each food group to the estimated GHG emissions of modeled diets as estimated by Meier and Christen [27]. The figure shows that while meat accounts for the largest GHG share in omnivorous diets, dairy’s contribution is also significant. Dairy products are also responsible for more than half the estimated GHG emissions of a modeled vegetarian diet. The absence of both meat and dairy in a vegan diet results in a GHG emissions of less than half of those of an omnivorous healthy diet.
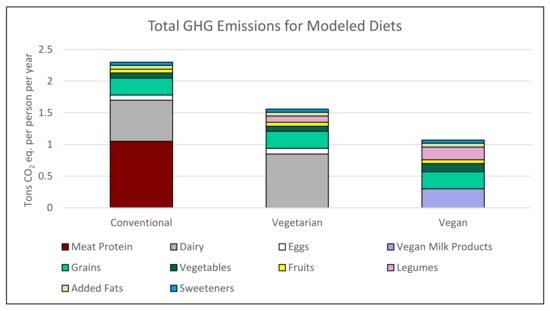
Figure 2.
Graph shows GHG emissions in tons CO2 eq. per person per year, caused by the intake of food groups within three modeled healthy diets. While nutrition remains relatively constant, total emissions are significantly higher with meat and dairy consumption. Data for CO2 emissions per food group from [27]. Depicted dietary recommendations for 2000 calorie diets were obtained from [12]. oil, natural flavors. Less than 2% of: potato protein, methylcellulose, yeast extract, cultured dextrose, modified food starch, soy leghemoglobin (Heme production fermentation, separation, concentration), salt, soy protein isolate. Heme is produced through fermentation, in which a genetically modified yeast strain expresses the naturally occurring leghemoglobin protein. Following fermentation, the leghemoglobin protein is isolated and concentrated from the fermentation media. Two wastewater streams exit the process: one with a high suspended solids content which is diverted to agricultural land application (high solid waste), the other has a lower suspended solids concentration and is treated in municipal wastewater (low solid waste).
4. Impacts of Processed, Plant-Based Meat
Healthy modelled vegetarian and vegan diets that replace meat products with legumes, cereals, and oils, may not be reflective of real consumers who follow a plant-based diet with processed meat replacements. This section compares the environmental impacts of two commercially available plant-based burgers to the impacts of a regular 80/20 beef patty. The comparison focuses on three impact categories: greenhouse gas emissions, water use, and land use, and is based on results from environmental lifecycle assessments made available by the manufacturers and the academic literature.
4.1. Background: Plant-Based Burgers
Recently, two major companies, Beyond Meat and Impossible Foods, have created plant-based burger patties that resemble meat in appearance, taste, and nutrition, but claim to have lower environmental impacts. The burgers not only appeal to vegetarians and vegans, but also to those who may not want to give up the flavor or experience of eating meat but want to reduce their environmental footprint. Beyond burgers are available for purchase at supermarkets while both plant-based burgers have become popular at fast food chains across the United States such as Burger King, Carle’s, Pizza Hut, and even Dunkin Donuts, making fast food more suitable for vegetarians, sparking the interest of meat eaters, and spreading awareness of the impacts of food choices. What makes Impossible and Beyond so unique from other plant-based burgers is that they truly mimic real 80/20 beef patties in terms of nutritional content and recreate the same taste color, texture, mouthfeel that people crave.
For examining the environmental impacts of Beyond and Impossible burgers, we have chosen a functional unit defined as a 4 oz. (quarter pound, 0.113 kg) uncooked burger patty. This is the marketed patty size of the Beyond Burger and a standard consumer product size for beef patties. Table 2 shows the nutritional components of the three burgers analyzed.
Table 2.
Nutritional comparison of Beyond Burger, Impossible Burger, and Conventional Beef.
While both plant-based burgers are made to replicate meat, they differ in their ingredients and manufacturing processes. The Beyond Burger available in stores and restaurants is made primarily from pea protein, canola oil, coconut oil, rice protein, cocoa butter, and mung bean protein. This ingredients’ list is from the current Beyond Meat website and differs slightly from the ingredients listed in the report, most likely due to recent improvements in flavor and texture. Since the main components have remained the same, the impact report is still considered valid. The ingredients in an Impossible Burger are soy protein concentrate, coconut oil, sunflower oil, and potato protein. Impossible is also unique in that the company engineered plant-based heme, “the molecule that gives meat its bloody taste when raw and creates the intense, meaty flavors and aromas when it’s cooked” [57] by extracting leghemoglobin from soy and genetically engineering yeast to ferment this molecule in a cost-effective way.
4.2. Comparison of Life Cycle Assessments
4.2.1. Scope and Boundaries
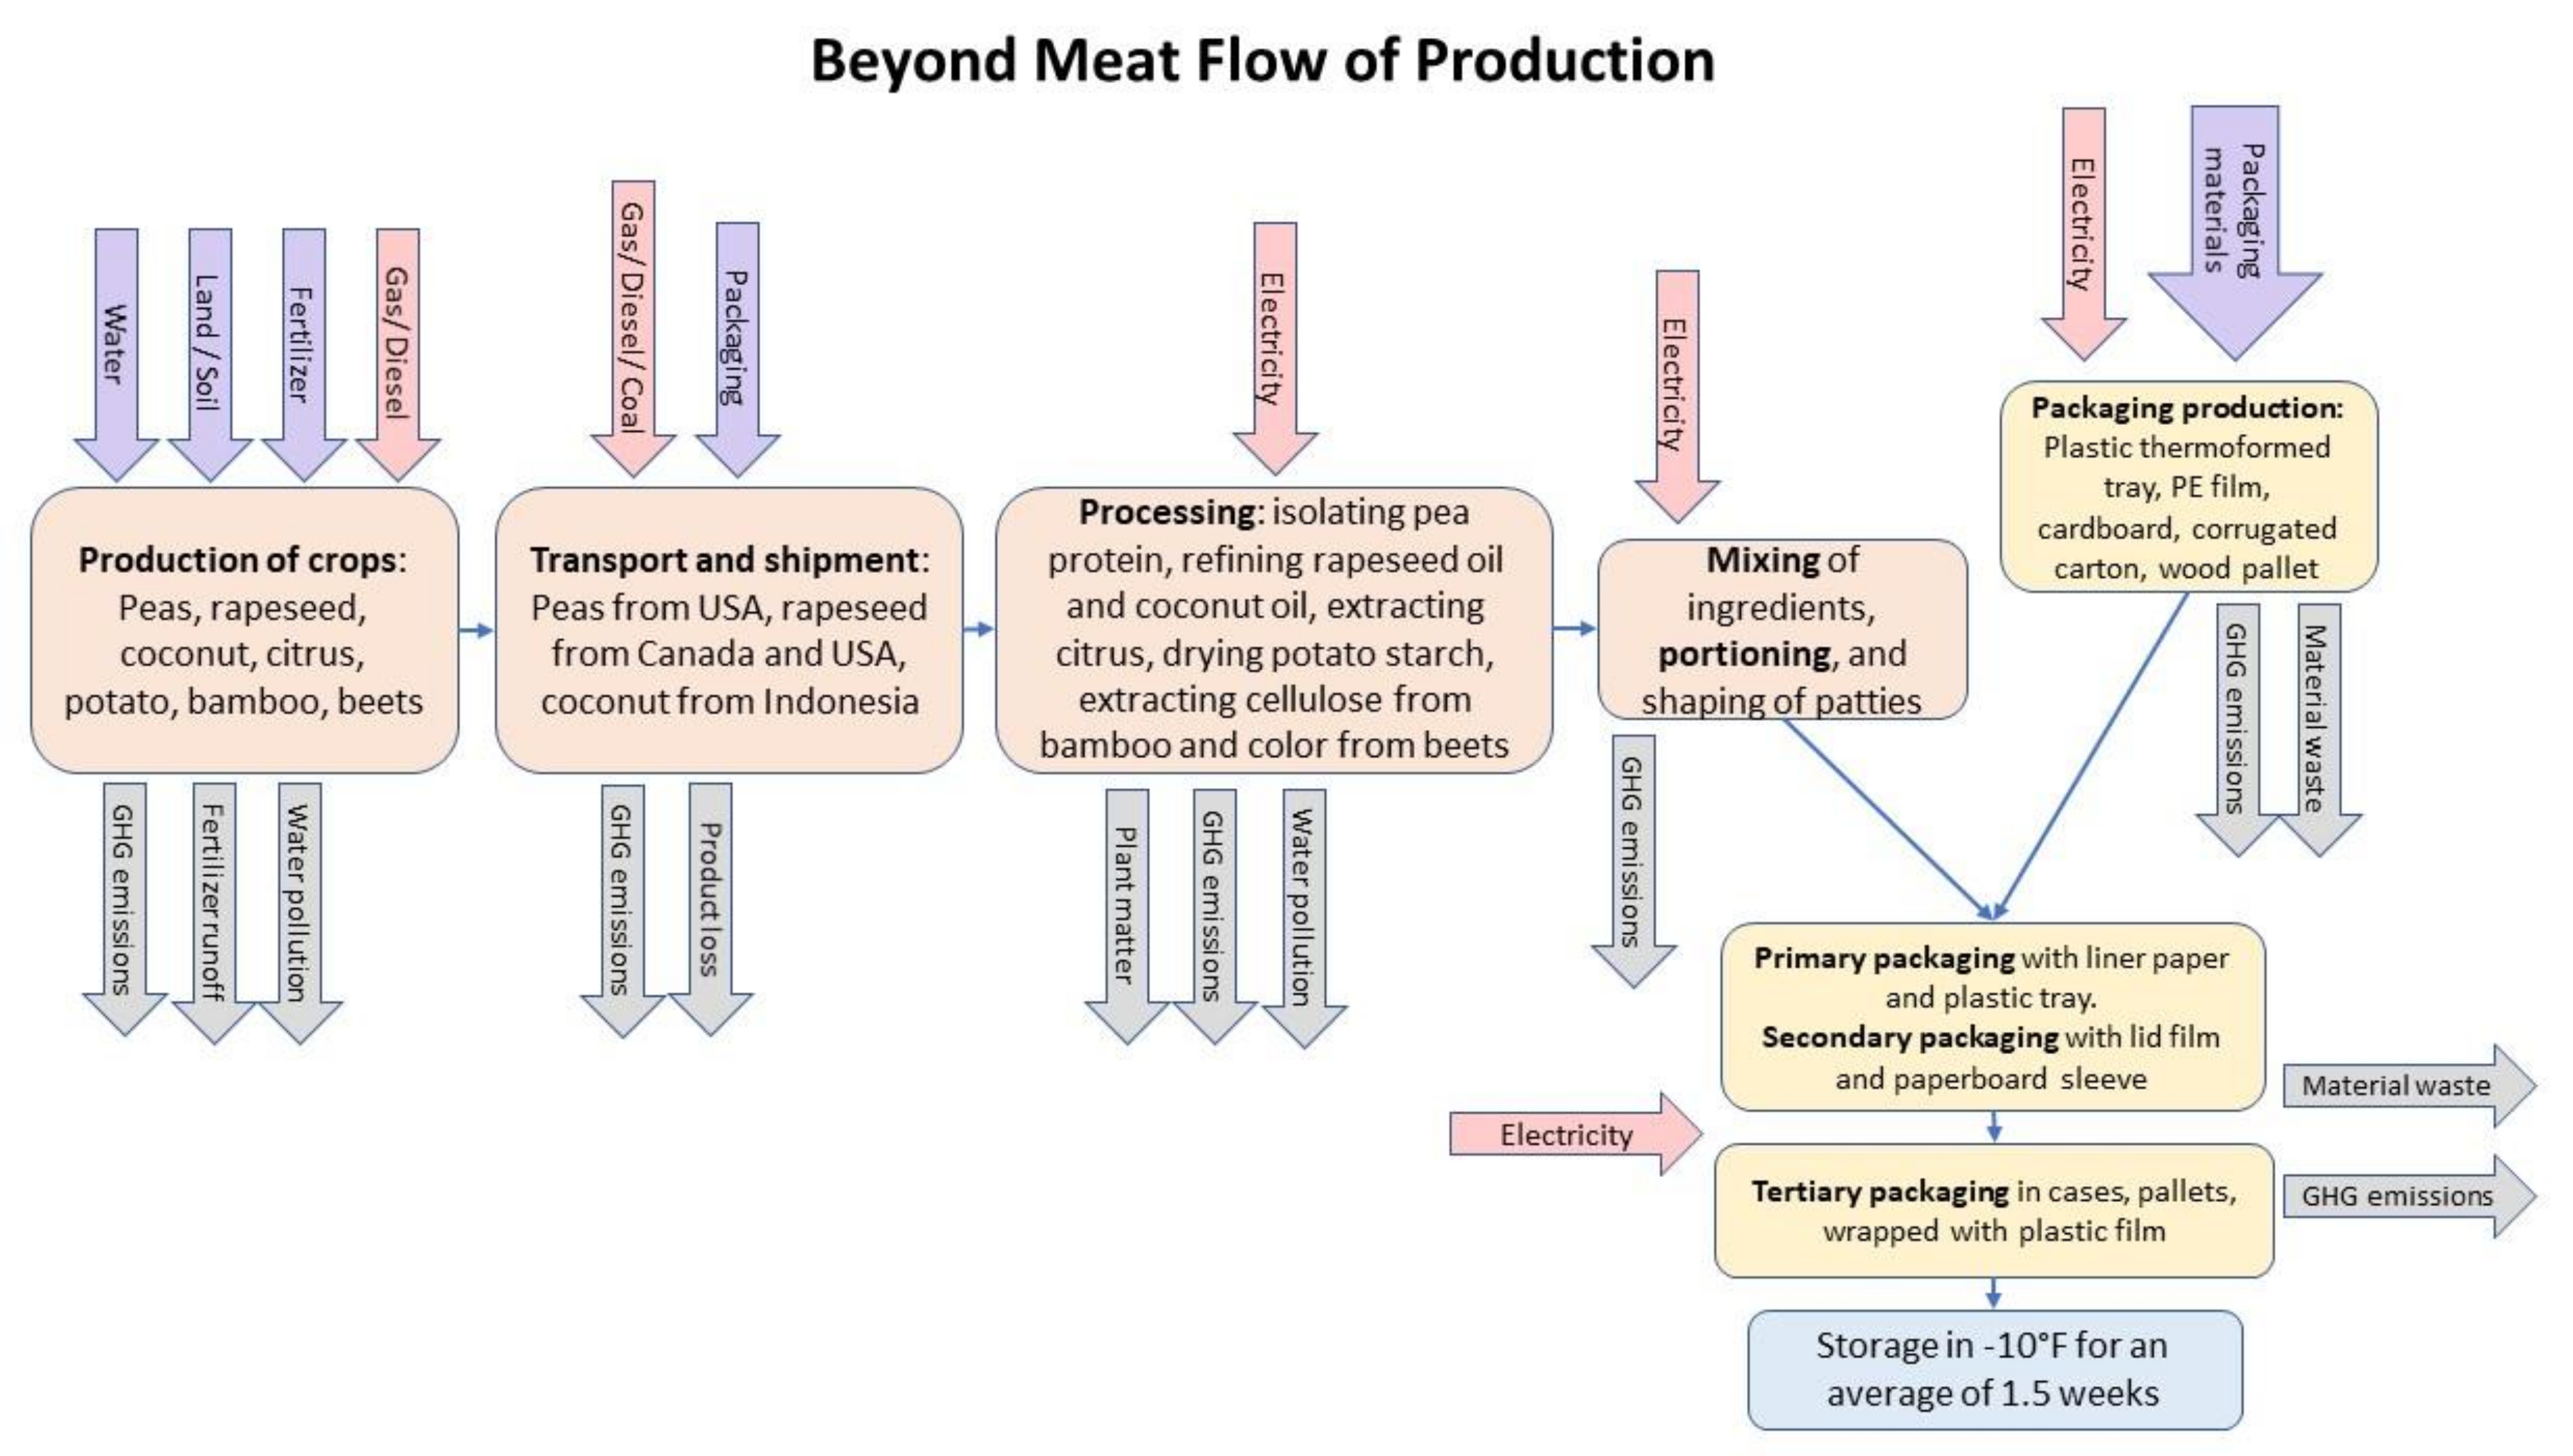
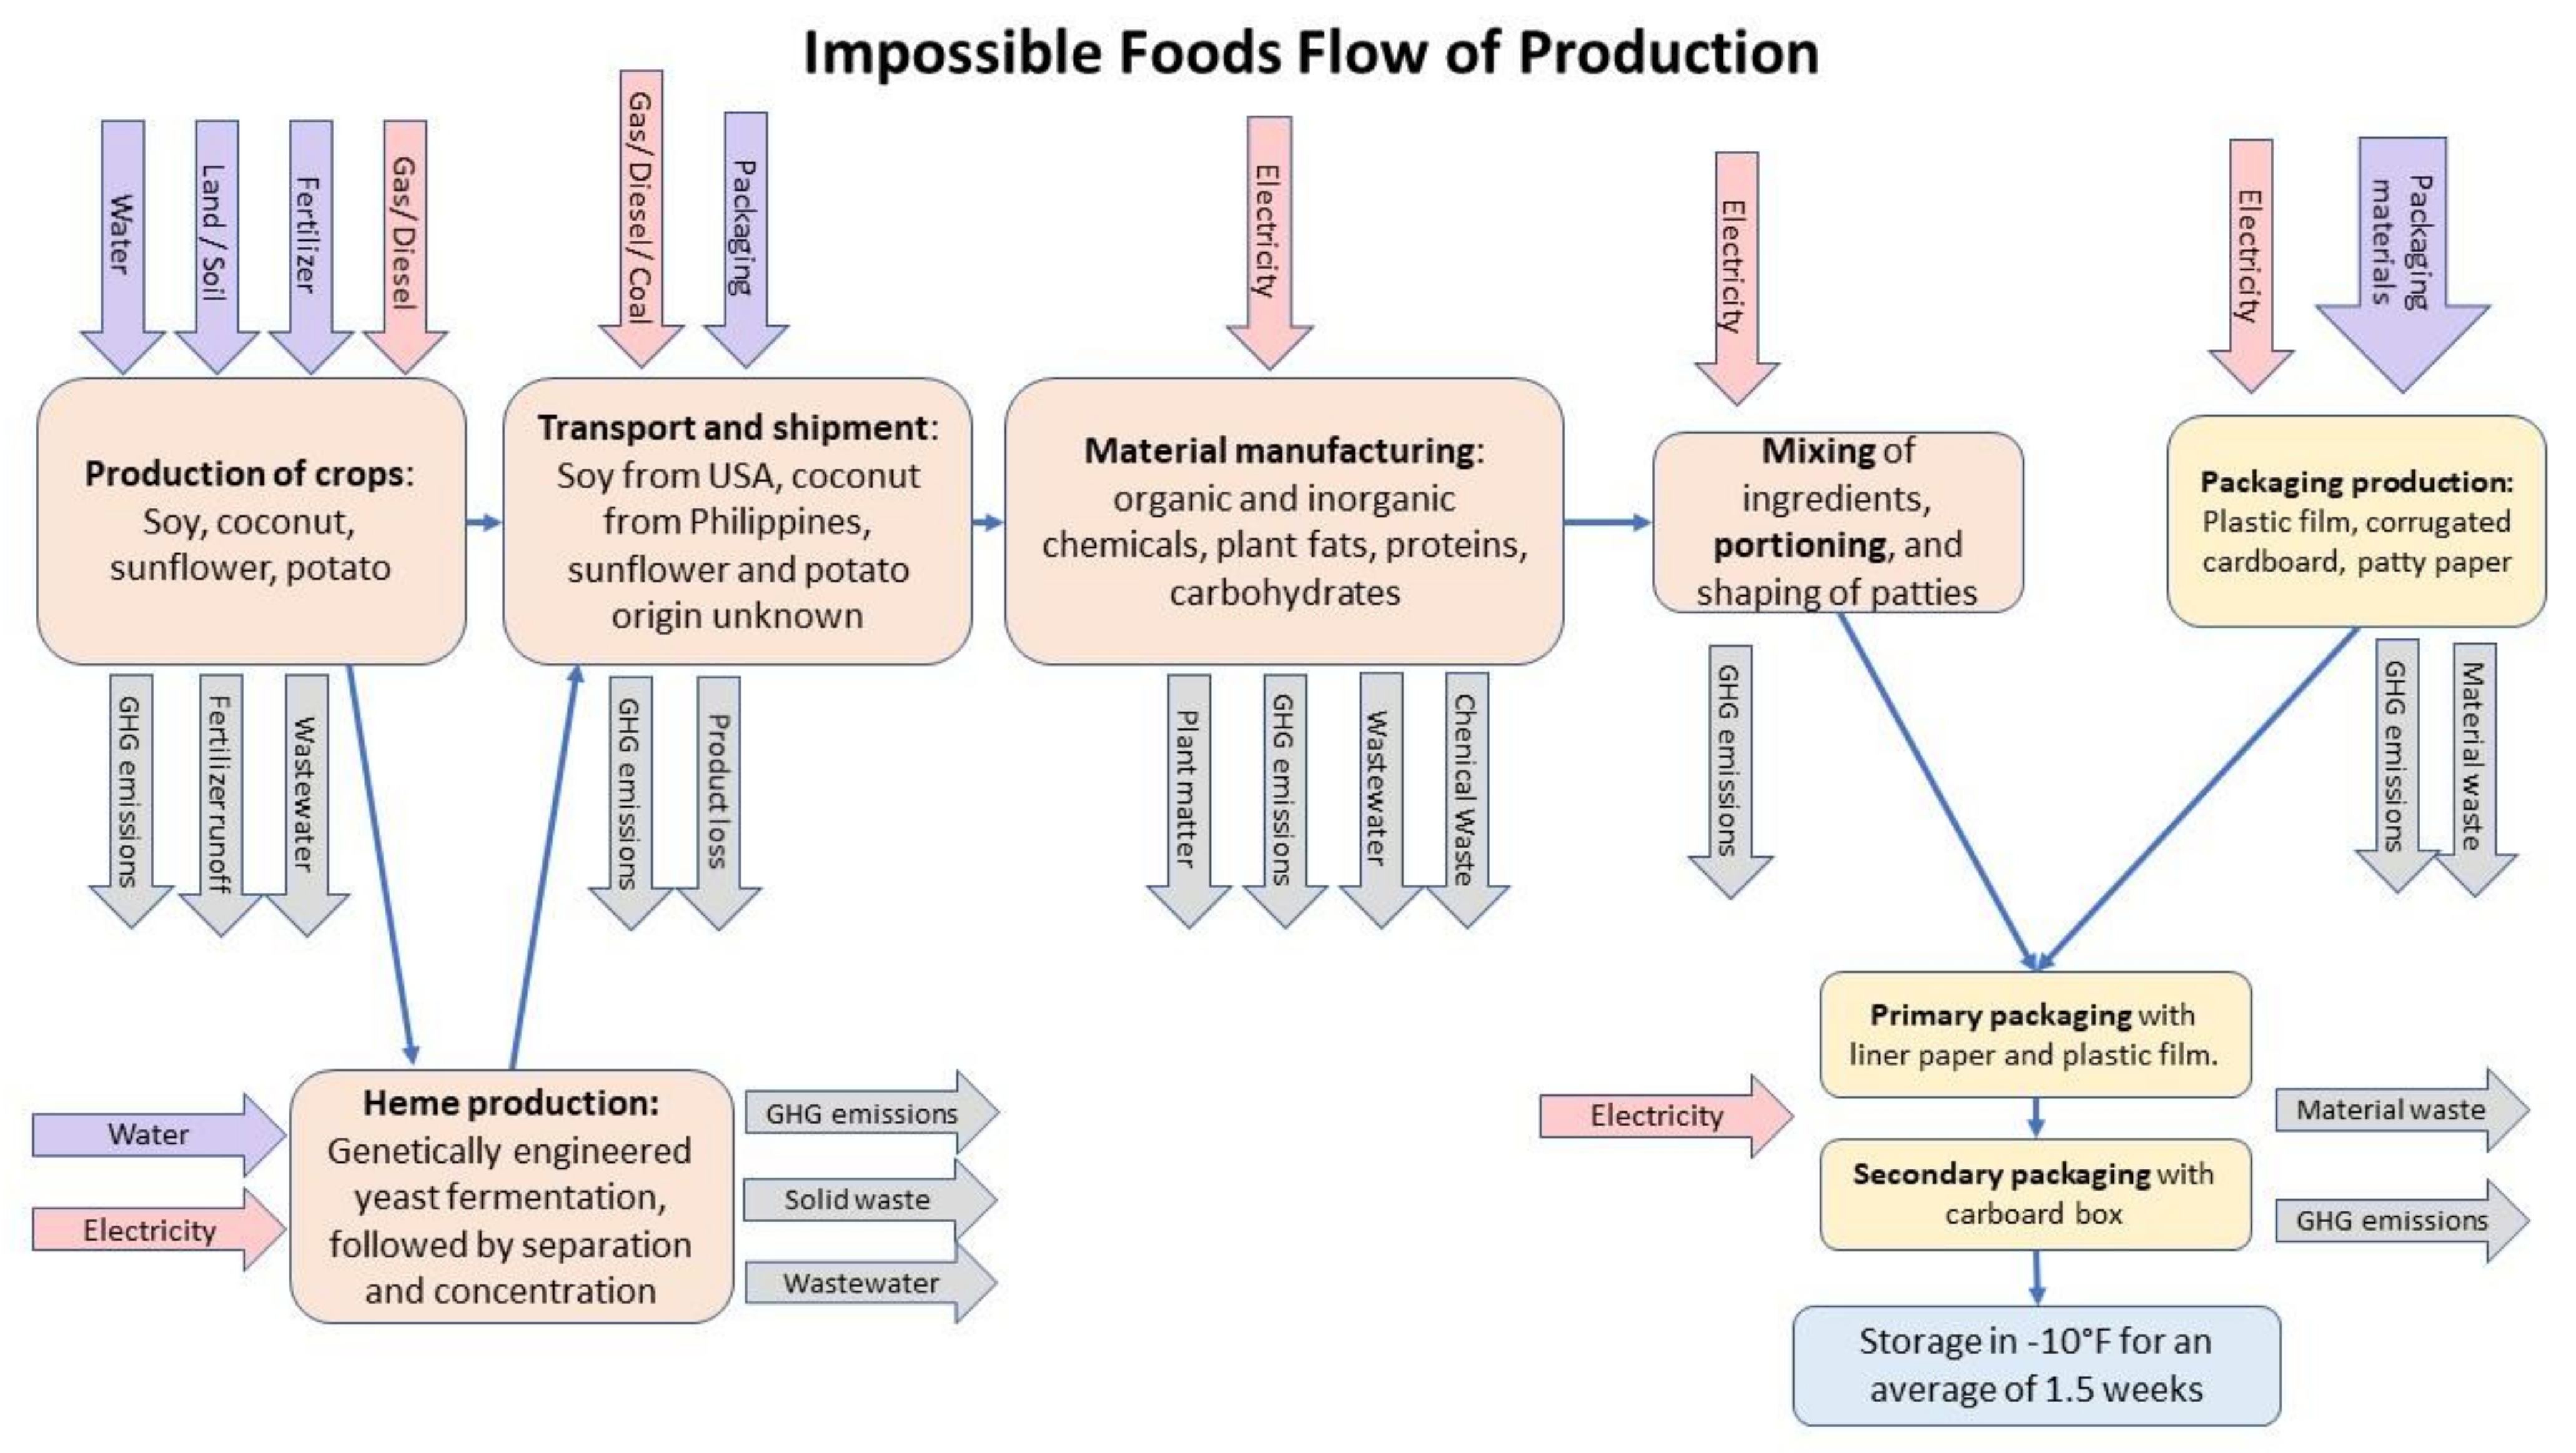
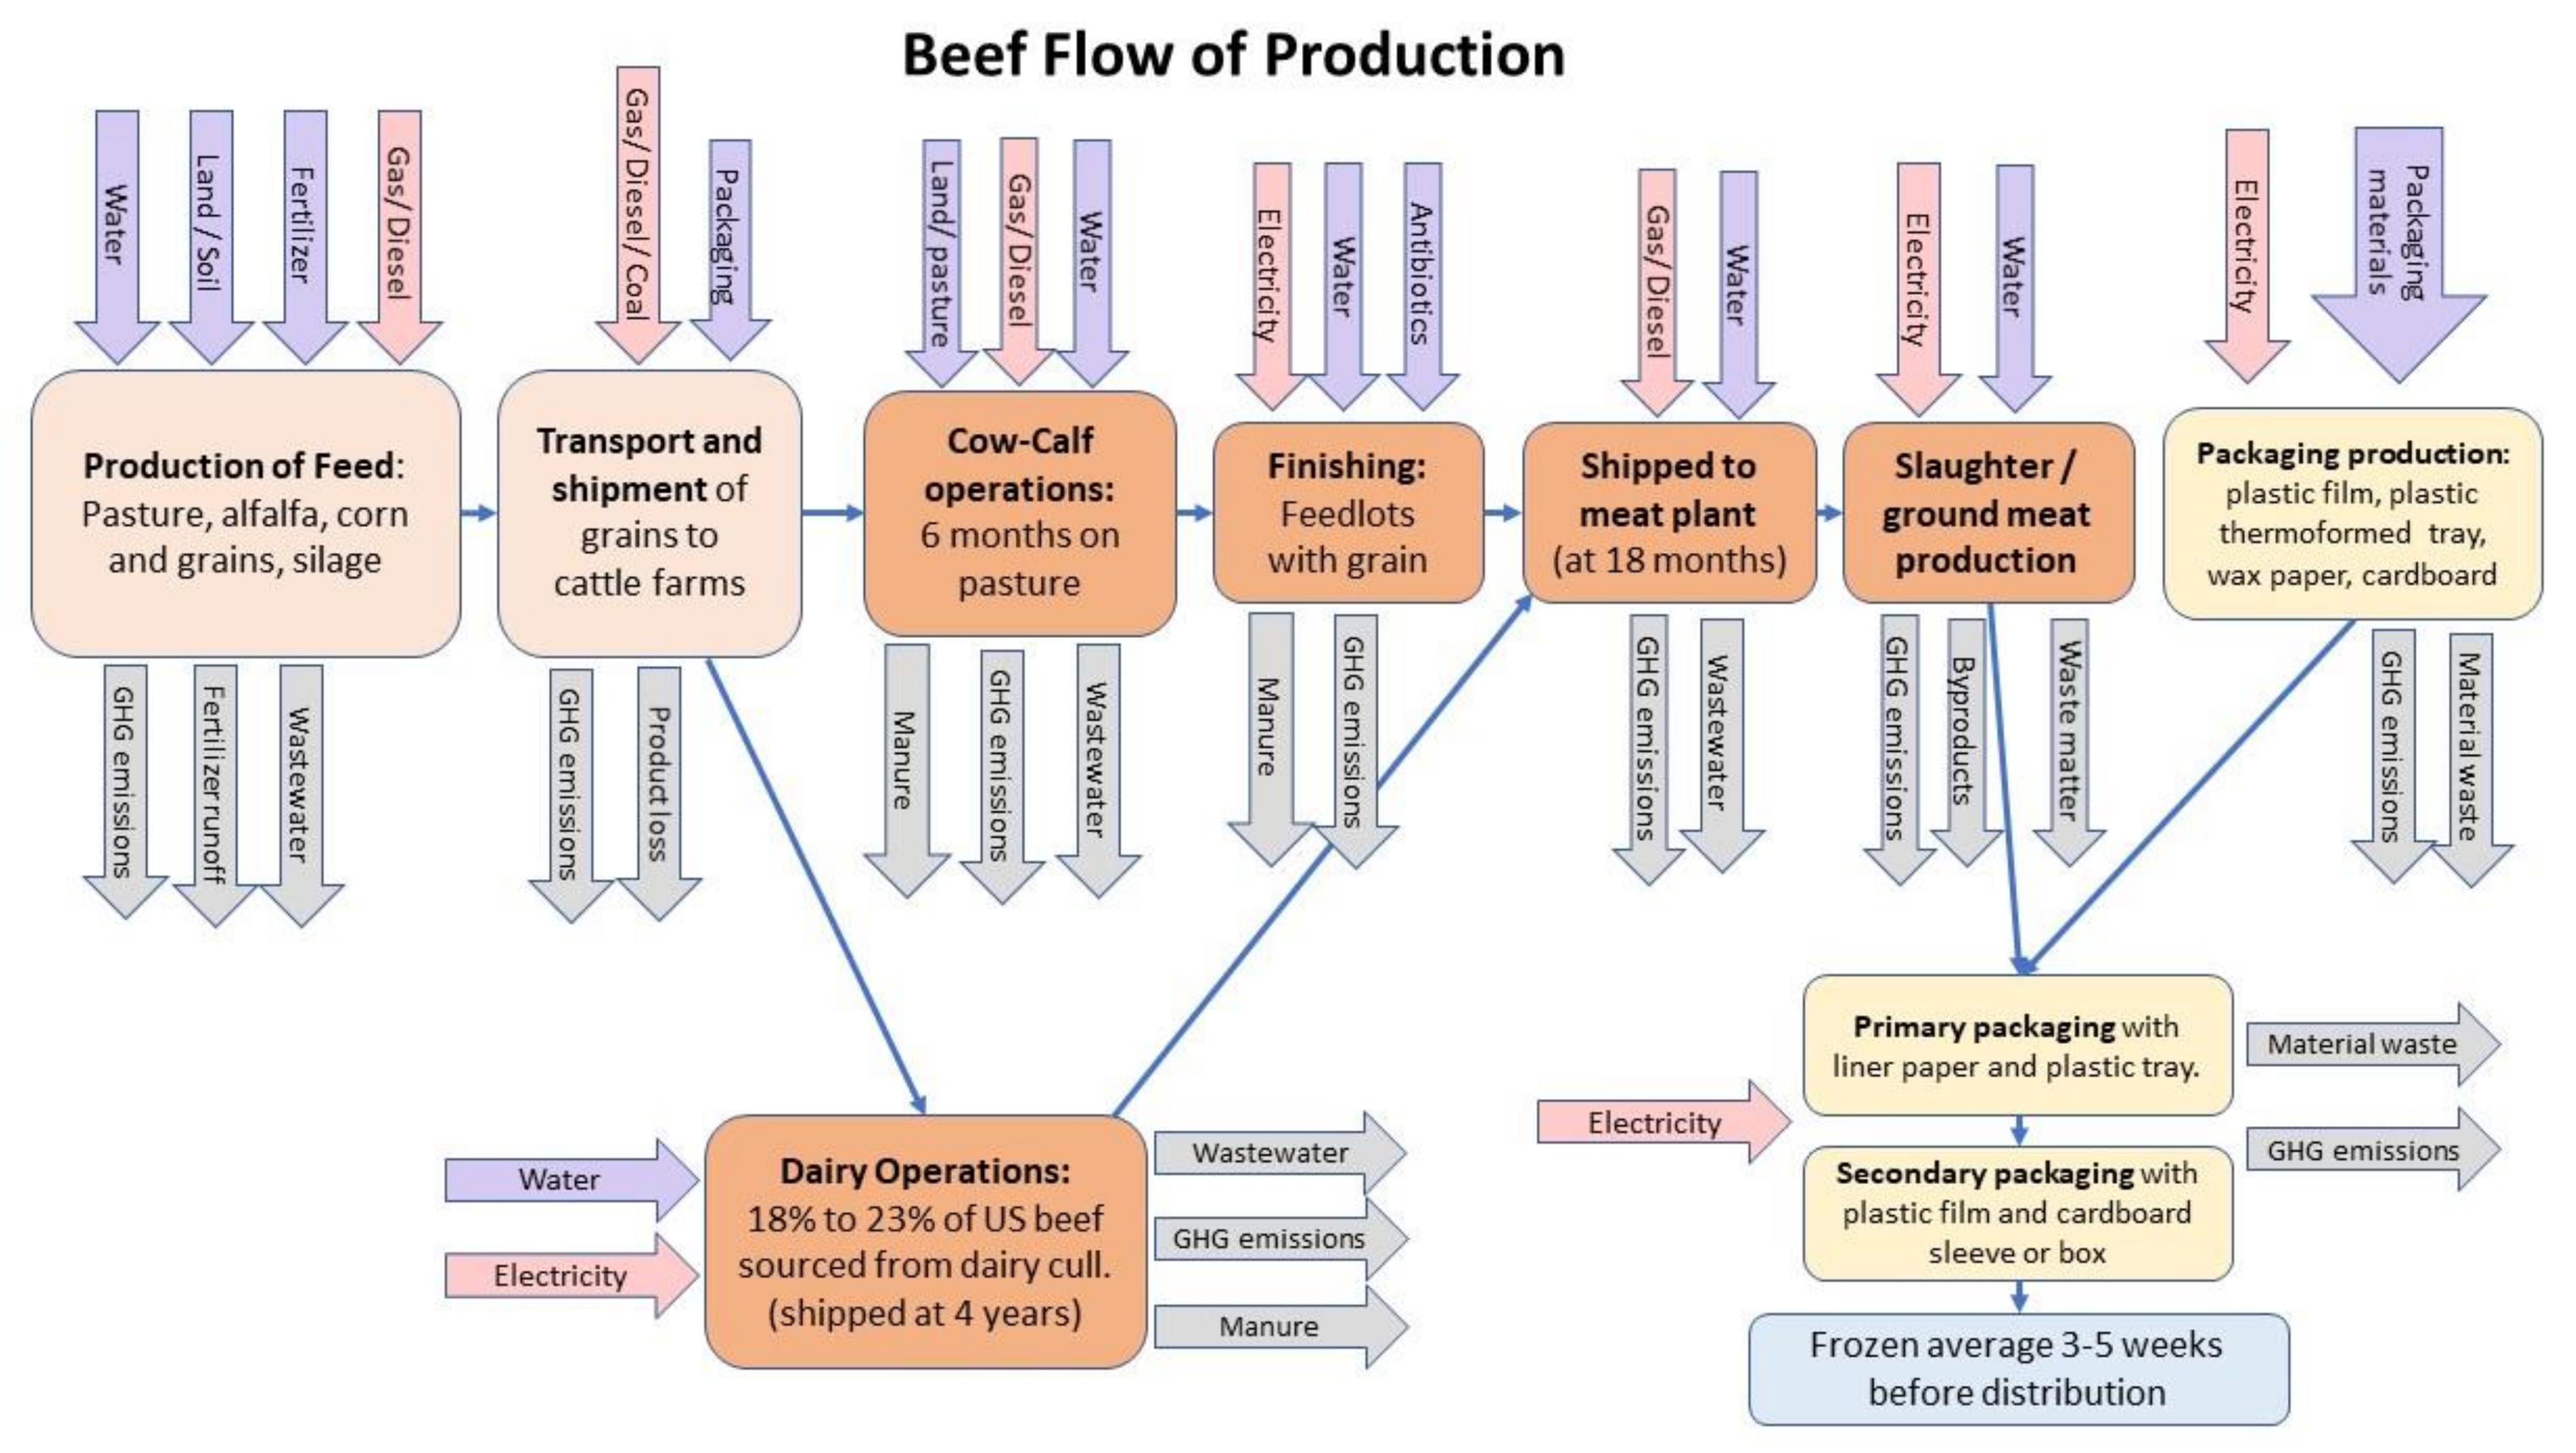
The scope of this comparative assessment is from cradle to gate, or from the production of crops (as ingredients or feed) to the final product being ready for shipment. This is the system boundary used by the Impossible Foods LCA report because unit processes beyond this stage, including shipping to retailers or restaurants, cooking, waste, and package disposal are essentially identical for all types of burgers, and therefore would not be of interest in a comparative study. Beyond Meat’s system boundaries included ingredient and raw material supply, processing and packaging operations, cold storage, distribution to point of sale, and disposal of packaging, therefore in this paper the environmental impact values were adjusted to disregard transportation and disposal for an equal comparison across products. The environmental impact of U.S. beef production was drawn from an existing LCA study commissioned by the National Cattleman’s Beef Association [10] which considers the average U.S. beef production with the cow’s first 6 months on a pasture and 12 months at a feedlot before slaughter. Figure 3, Figure 4 and Figure 5 depict the lifecycle stages considered in this study for the Beyond burgers, the Impossible foods, and an 80/20 beef patty. The ingredients for the Impossible and Beyond meats are listed in the captions of the figures.

Figure 3.
Flow chart depicting the production process of Beyond Burgers with inputs (energy inputs in blue, resource inputs in green) and outputs (red). The arrows indicate the flow of products throughout the system. The authors’ elaboration is based on data from [55]. Ingredients: filtered water, pea protein isolate (confidential process), refined rapeseed oil from crushing (70% Canadian, 30% U.S. production, transport by rail 1500 km, by truck 3254 km), refined coconut oil (Indonesian production, transport via ocean 22,224 km and truck 4835 km). Less than 2% of: citrus extract, flavor, dried potato starch, bamboo cellulose, methylcellulose, beet-based colorant (Heller and Keoleian, 2018) [55].

Figure 4.
Flow chart depicting the production process of Impossible Burgers with inputs (energy inputs in blue, resource inputs in green) and outputs (red). Arrows indicate flow of products throughout the system. Authors’ elaboration is based on data from [56]. Ingredients: Filtered water, soy protein concentrate (from Iowa, Minnesota, and Illinois), coconut oil (from Philippines; impacts modeled as average of palm, soybean, and cottonseed oil processing), sunflower.

Figure 5.
Flow chart depicting the production process of the average beef burgers. Energy inputs are in blue, resource inputs in green, and outputs in red. This system assumes that some beef is coming from dairy farms and that ground beef patties are packaged for retail. Arrows indicate the flow of products throughout the system. Authors’ elaboration based on data from [10]. Ingredients: 80% lean meat, 20% fat ground beef. Beef comes in a variety of packages, this packaging is based on pre-portioned patties available for purchase at a grocery store.
4.2.2. Unit Processes
The unit processes for the plant-based burgers and meat burgers differ significantly. The first key difference is that plant-based burger manufacturers receive ingredients from the Philippines, Canada, Indonesia, and other countries, while beef production usually only relies on crops from the USA or a single country of origin. Beyond and Impossible burgers include ingredients that require further processing such as refining oil and extracting starch, but Impossible goes further to utilize genetically modified yeast to ferment leghemoglobin as a key flavor component in their burgers. The ingredients are then mixed, burgers are portioned and packaged, and then finally stored for an average of 1.5 weeks in −10 °F. Beef burgers have a longer production process because it takes time to raise cattle to slaughtering weight. We assume that the production of the beef burgers is the U.S. standard process followed for an 80/20 patty, as described in Thoma et al., 2017. This process starts with the calves grazing on pasture for the first 6 months of their life, followed by a year in a feedlot where the farmer can control the amount and type of grain to ensure proper marbling of the meat. At around 18 months of age cows are shipped to a meat packing plant where they are slaughtered, skinned, and left hanging in a cooler for 48 h before removing the meat. Each cow provides a variety of meat cuts, including ground beef, which is packaged in plastic and boxes, and stored for an average of 3–5 weeks before shipment [10]. Retail, distribution, use, and end-of-life stages are excluded from the study, as these do not differ significantly between the Impossible Burger, Beyond Burger, and a traditional beef burger, and therefore bear similar environmental impacts. Both plant-based burgers have been designed to have a nutritional content similar to a beef burger as well as similar cook-time and shelf-life. The environmental impacts of these final stages have not shown to be a significant driver of the overall life cycle of such food products.
4.2.3. Impact Categories Reported
Impossible Foods reports four impact categories: aquatic eutrophication, global warming potential, land occupation, and water consumption. Beyond reports four categories as well: greenhouse gas emissions, energy use, land use, and water use. Therefore, a cross-comparison can be conducted on greenhouse gas emissions, land use, and water use.
4.3. Findings of Environmental Impact for Plant-Based Meats
4.3.1. Beyond Meat
Beyond Meat commissioned the Center for Sustainable Systems at the University of Michigan to conduct a cradle-to-distribution life-cycle assessment and to compare the Beyond Burger’s environmental impacts to a conventional beef burger patty. According to the report, “based on a comparative assessment of the current Beyond Burger production system with the 2017 beef LCA by [10], the Beyond Burger generates 90% less greenhouse gas emissions, requires 46% less energy, has >99% less impact on water scarcity and 93% less impact on land use than a ¼ pound of U.S. beef” [55]. The original published LCA reported characterizes land and water use impact, multiplying the amount of water used and not returned to the system with a water scarcity ratio of withdrawn water to available water in the region. The report calculates land use by considering the area and duration of occupation for specific land-cover types to determine total ecosystem damage. The resulting land use impact is smaller than the area of land occupied. Fortunately, absolute water consumption and land occupation data is included and a comparison across burger types could be conducted.
Production of the main ingredients in the Beyond Burger (pea protein, canola oil, coconut oil) contribute most significantly to environmental impacts, followed by packaging. The polypropylene tray has considerable energy and GHG impacts, while fiber production for cardboard and pallets contributes significantly to total land use. Primary packaging, and especially the thermoformed PP tray, was a notable contributor to all impact categories (tray is 11% of total GHGE, 21% of energy use, 14% of water use) [55]. These results are relevant because it presents an opportunity to re-design the primary packaging and make significant reductions in the overall product footprint. If the PP tray was manufactured from 100% post-consumer content, GHG emissions associated with packaging could be reduced by 2% and energy use by 10% [55].
4.3.2. Impossible Foods
According to the official LCA conducted by Impossible Foods, the Impossible Burger reduces environmental impacts across every impact category studied in this report: 87% less water, 96% less land, 89% fewer GHG emissions, and 92% less aquatic pollutants than conventional ground beef [56]. Rebekah Moses, the senior manager of impact strategy at Impossible Foods, states that the estimated impacts reduction is a conservative measure because most cattle production systems require even more inputs than those considered in their analysis.
The report breaks down the numbers to further explain how the Impossible Burger can reduce impacts so drastically. The most significant emissions and resource requirements for both systems are the raw material production stage, while packaging contributes the least to all impact categories. The production of heme, fats, and texture agents account for 42% to 82% of all impacts across the Impossible Burger life cycle, similarly, for beef, the cattle-raising stage represents between 41% and 93% of the total environmental impacts of a burger.
Emissions associated with aquatic eutrophication potential decrease due to the avoided manure emissions from raising beef cattle and significantly less fertilizer runoff from feed production. The global warming potential from all greenhouse gas emissions decreases with the Impossible Burger. The drastic reduction can be attributed to three major GHG sources from cattle production: roughly 79% comes from emissions associated with manure management and enteric fermentation, 11% from feed production and transportation, while an extra 10% comes from cattle slaughtering. Land occupation is reduced by the greatest amount, 96%, mainly by avoiding the need for grazing pasture. The demand for cropland is also reduced from 6.8 m2 per year for a kg of beef to 2.4 m2 per year due to the elimination of cattle feed. Finally, water consumption is reduced by 87% as a result of avoiding irrigation used for feed crops and maintaining sanitary conditions throughout slaughter.
4.3.3. Collective Results
The comparative life cycle assessment reports indicate that both plant-based burgers have lower impacts than beef in all three impact categories assessed, as shown in Table 3. Although there is uncertainty in the overall impacts of beef patties and the two plant-based substitutes, the best estimates show that the reduction in GHG emissions, water, and land use is above 87%. Even under the most conservative estimate of possible impact reductions (i.e., assuming the lowest bound of the confidence interval for beef’s impacts, and the highest bound of the confidence interval for plant-based burgers impacts) a transition from beef patties would result in >84% lower GHG emissions, >88% land use reductions, and >67% water use reductions. These conservative estimates of impact reductions from beef patties substitution with the plant-based burgers are higher than the upper bound estimates of impact reductions from shifting to a vegetarian or vegan diet from an omnivorous one (see Figure 1), which implies that the incorporation of plant-based burgers in vegan and vegetarian diets will not diminish the environmental benefits of these diets.
Table 3.
Comparison of total cradle-to-distribution impacts of quarter pound lb. U.S. beef, Beyond Burger, and Impossible Burger.
There is no significant difference between Beyond Meat and Impossible burgers regarding GHG emissions and land use, but Impossible is associated with increased absolute water use.
4.3.4. Environmental Gains from a Gradual Shift away from Beef: A Thought Exercise
The significant environmental benefits from the replacement of beef patties with plant-based alternatives encourage some provocative thought exercises. For example, consider that the modelled omnivorous diet of 2000 kcal/day of Figure 2 includes 5 oz. meat (beef, pork, chicken, turkey), of which 1.56 oz. is beef (USDA, 2015). If half of this beef were in the form of burgers and could be replaced with one of the plant-based alternatives by 30 million Americans, the reduction in land use (~14,000 sq. km) would be more than the entire area deforested in the Brazilian Amazon in 2020 (INPE, 2021). The annual decrease in GHG emissions (>7 million tons) would be equivalent to taking ~1.5 million typical cars from the road (US EPA, 2018). The reductions in water use would be the same as the annual consumption by >1.3 million people consuming 100 gallons/day, in Table 4.
Table 4.
Environmental benefits for replacement of beef by plant-based burgers.
5. Discussion
This paper compared the life - cycle impacts of different diets estimated in 34 recent studies to summarize current knowledge on the reduced environmental impact, expressed as changes in land use, water demand, and greenhouse gas emissions, achieved by shifting from omnivorous dietary patterns to vegetarian and vegan. While there is a substantial body of literature that describe GHG emissions concerning diets and their costs [60], the focus on land and water use is missing from many studies. However, the land use and water benefits reported by the studies are as significant as those concerning GHG. The land-use benefits attributed to vegetarian and vegan diets calculated in this review dispel a common misconception about the role of soy-based meat and dairy substitutes in the expansion of the soybean industry and associated deforestation and the displacement of indigenous peoples and small farmers [61]. This finding is consistent with the fact that only 7% of the global soybean production becomes tofu, soy milk, tempeh, edamame, and other foods for direct human consumption. In contrast, 77% of it becomes animal feed for dairy and meat production, and the rest table-oil, and biodiesel [62].
The overall reported environmental impacts of diet styles vary considerably between the different studies reviewed. Discrepancies can be partially attributed to geographical differences, which affect both the types of foods included and the environmental burden of such foods, but also to the type of comparison (observed diets or modeled diets adhering to nutritional and caloric guidelines), data sources, allocation rules, and the LCA boundary (e.g., whether cradle-to-fork or cradle-to-farm gate [63]).
While adhering to national dietary guidelines would reduce meat consumption in the United States and 32 of 36 other high and middle-income countries studied by Scherer et al. (meat consumption would increase in India, Russia, and South Korea) [64], the literature shows that following this dietary recommendation does not necessarily make diets more environmentally sustainable.
An important conclusion is that omnivore diets adhering to dietary guidelines do not always have significantly lower environmental impacts than observed diets surpassing caloric, protein, and sugar recommendations. While studies [17,18,27,28,29,35,36,37,38,39,40,41,42,43,65,66] that assessed both observed omnivore and modeled recommended diet scenarios, in the Americas and Europe, found that adhering to guidelines significantly reduces environmental impacts, others such as [24,30,67] have found the opposite. Tom et al. [67] found that a shift from current consumption patterns to a diet with the same calorie intake but with U.S. FDA food group recommendations would increase energy use, GHG emissions, and blue water use [67]. More strikingly yet is the finding from Kim et al. [68] that a recommended diet of 2000 kcal/day would increase GHG emissions by 9% relative to a current food consumption pattern with almost 550 additional kcal. This is due to the replacement of red meat calories with fish/seafood, milk/dairy, vegetables, and fruit. Indeed, replacing meat calories with fruit increases GHG [11]. However, better replacements are possible. Rehkamp [30] has shown that while hypothetical diets closely reflecting how Americans eat and compliant with dietary guidelines increase blue water use by 16%, it is possible to design equally healthy diets that achieve a 66% lower water footprint.
In any case, all studies demonstrate that whether the comparison is among current diets or among healthy diets, vegetarian and vegan food patterns are more environmentally sustainable than those including meat. These findings highlight the importance of studying the impacts of meat replacement with plant-based substitutes such us the two commercial vegan burgers analyzed here.
A comparative life cycle assessment of Beyond, Impossible, and beef burgers indicates that there are significant environmental benefits such as reduced land use, water consumption, and GHG emissions associated with plant-based meat products. By choosing a plant-based burger instead of a regular beef burger, consumers reduce impacts across every category studied between 87% and 96%. This finding is consistent with recent literature that shows that plant-based meat substitutes have the lowest overall environmental impacts per kilogram of protein [49].
While there is a certain degree of uncertainty and a wide variety of beef production systems including pasture-raised, grass-fed, and organic, there is no indication that a situation or condition may arise in which the environmental performance, as indicated by the categories considered here, of Beyond or Impossible burgers, would be worse than that of a beef burger. Findings from both LCA reports suggest that plant-based burgers can replicate meat closely without having the same degree of environmental degradation.
Overall results support the hypothesis that switching to a vegan or vegetarian diet can significantly reduce one’s impact on the environment with regard to all three of the aforementioned indicators. This is valid even when vegetarians and vegans choose to replace meat with highly processed plant-based alternatives. Animal production requires greater inputs due to the inefficiency of feed conversion, and therefore farmed animals consume more than they produce. Eliminating the inefficiency of feed conversion and directly consuming plant-based foods requires fewer resources and land.
While vegan diets on average have lower environmental impacts than vegetarian diets, some studies show that vegetarian diets are preferable for a sustainable future. In response to the notion that vegan diets are the most sustainable with regard to land use, one study [29] suggests that more people can be adequately fed with a vegetarian diet. The largest fraction of land needs for ruminant animals is from foraging and grazing lands, which are often grown on non-arable land. Thus, reducing the most land-intensive products in the diet does not necessarily equate to freeing up land for cultivation. Land use can be analyzed from two different perspectives, one that emphasizes carrying capacity, and another that values sustainability. If the goal is to maximize carrying capacity, a vegetarian diet is the most desirable because it utilizes barren land for housing dairy cows, which is land that cannot otherwise be used for farming crops. However, if overall sustainability considering multiple impacts is assessed, a vegan diet is preferred because it has only a slightly lower carrying capacity, and it would produce less greenhouse gas emissions due to the lack of ruminants. As an example, Van Kernebeek et al. estimated that in the Netherlands land would be used most efficiently if people derived 12% of dietary protein from animals, mainly in the form of milk [69].
Environmental Impacts and Factors Not Considered
Agricultural production can affect the environment in important ways that are unrelated to fossil energy use or GHG emissions. Other potential factors are excess of nutrients that contribute to eutrophication, which alters the composition and diversity of aquatic plants and disrupts the ecosystem and food web, the emission of pesticides and heavy metals, which are toxic to humans and ecosystems, and depletion of water resources, which leads to water scarcity and affects freshwater biodiversity. Land use is another simple metric for the amount of territory occupied by agriculture but does not fully encompass the reduction of CO2 sequestration from forests converted to farmland, land degradation, and terrestrial biodiversity loss. While this study finds that vegetarian and vegan diets use less land, less water, and emit less GHG compared to modeled or observed omnivore diets, it does not explore other impacts and does not consider changes to the current production processes. This paper does not look at the differences in impacts of diets sourced by organic vs. non-organic foods, nor does it look at the effects of newer agricultural technologies such as terrestrial aquaculture, aquaponic farming, lab-grown meat, and other modern systems that may drastically cut down on water use or GHG emissions.
While changes can be made to reduce the impacts of an omnivore diet, it should also be noted that there is no single agricultural system that is the most sustainable across all categories, and that different impacts may have higher or lower importance in a certain region. Studies have shown that, in comparing food production systems, the results for different environmental impacts are not necessarily correlated. For example, Ridoutt et al. [70] showed that in beef production systems in Australia, the system with the highest carbon footprint had the second-lowest water footprint, and the system with the highest water footprint had the lowest land-use footprint. One must also consider the distinction between collective and local impacts. An intensive cattle farm may have lower environmental impacts per cow than a pasture-based farm, but when assessed spatially it has significantly higher local emissions and water demand per area of land [71]. Low production systems might look promising in terms of local cumulative environmental pressures but could result in a larger overall footprint.
Additionally, out of the scope of this paper are other considerations such as the impacts of vegetarian and vegan diets on animal welfare and human health. While meat consumption in numerous countries is above dietary recommendations, an increase in foods of animal origin would produce beneficial health outcomes in constrained environments in places such as Uganda, Bangladesh, and Nepal [72].
6. Conclusions
This paper shows that plant-based diets and plant-based meat options are unambiguously better for the environment. This is true for modeled vegetarian and vegan diets as well as for observed diets that may include highly processed foods such as plant burgers.
Assessing diets from an environmental standpoint is complex and prone to wide-ranging results due to variation in the evaluated diets, production systems, methods of analysis, and assumptions. Nevertheless, LCA studies that consider all inputs and outputs, resources and emissions associated with the production of food, have analyzed individual products and their cumulative impacts when considered as part of a complete diet. This review finds that recent LCA studies identify vegan and vegetarian diets as more sustainable than omnivore diets with regard to land use, water consumption, and greenhouse gas emissions. These results support an argument for reducing food-related environmental impacts by limiting the consumption of animal-based food, although there is no significant difference between vegetarian and vegan dietary styles. Findings also show that the average diet is less sustainable than a healthy omnivore diet adhering to nutritional guidelines, suggesting that reducing caloric and fat intake to recommended levels can also reduce one’s environmental footprint. Consuming the recommended number of calories from plant-based sources further reduces environmental impacts associated with food.
This study also finds that incorporating industrially produced, highly processed plant-based meat replacement maintains the environmental benefits of vegan and vegetarian diets. Two plant-based burgers, Beyond and Impossible, have 87% to 96% lower impacts on water use, land use and GHG emissions than an equal serving of 80/20 beef. Considering that these two plant-based burgers have similar nutritional content, texture, and flavor, as real beef, results indicate that consumers do not have to sacrifice the experience of eating burgers in order to reduce their impact on the environment [73]. As plant-based alternatives such as Beyond Meat and Impossible Foods open a gateway into fast food restaurants and destigmatize vegan and vegetarian foods, their popularity and distribution may grow. Research shows that consumers have little awareness of their diets’ environmental impact, but many would be open to making more sustainable choices if it were easy to do so [34] or if they are informed of the difference in environmental impacts [74] via labels. The first stage in behavioral change is recognizing the problem and creating a sense of urgency, which requires knowledge about current unsustainable habits and the potentially catastrophic results if these habits are not changed [34]. Along with the option of a plant-based meal, consumers need to be convinced that plant-based is the more sustainable option, especially if it comes at a higher price. Signage at the location of purchase, education, and advice about how to make more sustainable choices is essential to popularizing and normalizing plant-based diets.
Supplementary Materials
The following are available online at https://www.mdpi.com/article/10.3390/su13179926/s1.
Author Contributions
Conceptualization, A.K. and D.P.-E.; methodology, A.K. and D.P.-E.; investigation, A.K. and D.P.-E.; writing—original draft preparation, A.K.; writing—review and editing, D.P.-E.; visualization, A.K. and D.P.-E.; supervision, D.P.-E.; project administration, D.P.-E.; funding acquisition, D.P.-E. All authors have read and agreed to the published version of the manuscript.
Funding
This research received no external funding.
Institutional Review Board Statement
This research did not involve human subjects.
Informed Consent Statement
This research did not involve human subjects.
Conflicts of Interest
The authors declare no conflict of interest.
References
- Goldstein, B.; Hansen, S.; Gjerris, M.; Laurent, A.; Birkved, M. Ethical aspects of life cycle assessments of diets. Food Policy 2016, 59, 139–151. [Google Scholar] [CrossRef] [Green Version]
- Regmi, A.; Meade, B. Demand side drivers of global food security. Glob. Food Secur. 2013, 2, 166–171. [Google Scholar] [CrossRef] [Green Version]
- Ripple, W.J.; Wolf, C.; Newsome, T.M.; Barnard, P.; Moomaw, W.R. World Scientists’ Warning of a Climate Emergency. BioScience 2019, 70, 8–12. [Google Scholar] [CrossRef]
- Gerland, P.; Raftery, A.E.; Sevčíková, H.; Li, N.; Gu, D.; Spoorenberg, T.; Alkema, L.; Fosdick, B.K.; Chunn, J.; Lalic, N.; et al. World population stabilization unlikely this century. Science 2014, 346, 234–237. [Google Scholar] [CrossRef] [PubMed] [Green Version]
- Bereżnicka, J.; Pawlonka, T. Meat Consumption as an Indicator of Economic Well-Being—Case Study of A Developed and Developing Economy. Acta Sci. Polonorum. Oeconomia 2018, 17. [Google Scholar] [CrossRef]
- Foley, J.A.; Ramankutty, N.; Brauman, K.A.; Cassidy, E.S.; Gerber, J.S.; Johnston, M.; Mueller, N.D.; O’Connell, C.; Ray, D.K.; West, P.C.; et al. Solutions for a cultivated planet. Nature 2011, 478, 337–342. [Google Scholar] [CrossRef] [Green Version]
- Smil, V. Eating Meat: Evolution, Patterns, and Consequences. Popul. Dev. Rev. 2002, 28, 599–639. [Google Scholar] [CrossRef]
- Stoll-Kleemann, S.; O’Riordan, T. The Sustainability Challenges of Our Meat and Dairy Diets. Environ. Sci. Policy Sustain. Dev. 2015, 57, 34–48. [Google Scholar] [CrossRef]
- Moher, D.; Shamseer, L.; Clarke, M.; Ghersi, D.; Liberati, A.; Petticrew, M.; Shekelle, P.; Stewart, L.A.; Group, P.-P. Preferred reporting items for systematic review and meta-analysis protocols (PRISMA-P) 2015 statement. Syst. Rev. 2015, 4, 1. [Google Scholar] [CrossRef] [Green Version]
- Thoma, G.; Putman, B.; Matlock, M.; Popp, J.; English, L. Sustainability Assessment of U.S. Beef Production Systems; University of Arkansas Resiliency Center: Fayetteville, AR, USA, 2017. [Google Scholar]
- Vieux, F.; Darmon, N.; Touazi, D.; Soler, L.G. Greenhouse gas emissions of self-selected individual diets in France: Changing the diet structure or consuming less? Ecol. Econ. 2012, 75, 91–101. [Google Scholar] [CrossRef]
- FoodData Central. 2019. Available online: https://fdc.nal.usda.gov/ (accessed on 6 June 2021).
- Soret, S.; Mejia, A.; Batech, M.; Jaceldo-Siegl, K.; Harwatt, H.; Sabaté, J. Climate change mitigation and health effects of varied dietary patterns in real-life settings throughout North America. Am. J. Clin. Nutr. 2014, 100, 490S–495S. [Google Scholar] [CrossRef] [PubMed] [Green Version]
- Hallström, E.; Carlsson-Kanyama, A.; Börjesson, P. Environmental impact of dietary change: A systematic review. J. Clean. Prod. 2015, 91, 1–11. [Google Scholar] [CrossRef]
- Aleksandrowicz, L.; Green, R.; Joy, E.J.M.; Smith, P.; Haines, A. The Impacts of Dietary Change on Greenhouse Gas Emissions, Land Use, Water Use, and Health: A Systematic Review. PLoS ONE 2016, 11, e0165797. [Google Scholar] [CrossRef] [PubMed] [Green Version]
- Fresán, U.; Sabaté, J. Vegetarian Diets: Planetary Health and Its Alignment with Human Health. Adv. Nutr. 2019, 10, S380–S388. [Google Scholar] [CrossRef] [Green Version]
- Arrieta, E.M.; González, A.D. Impact of current, National Dietary Guidelines and alternative diets on greenhouse gas emissions in Argentina. Food Policy 2018, 79, 58–66. [Google Scholar] [CrossRef] [Green Version]
- Baroni, L.; Cenci, L.; Tettamanti, M.; Berati, M. Evaluating the environmental impact of various dietary patterns combined with different food production systems. Eur. J. Clin. Nutr. 2007, 61, 279–286. [Google Scholar] [CrossRef] [PubMed] [Green Version]
- Blackstone, N.T.; El-Abbadi, N.H.; McCabe, M.S.; Griffin, T.S.; Nelson, M.E. Linking sustainability to the healthy eating patterns of the Dietary Guidelines for Americans: A modelling study. Lancet Planet Health 2018, 2, e344–e352. [Google Scholar] [CrossRef] [Green Version]
- Bruno, M.; Thomsen, M.; Pulselli, F.M.; Patrizi, N.; Marini, M.; Caro, D. The carbon footprint of Danish diets. Clim Chang. 2019, 156, 489–507. [Google Scholar] [CrossRef]
- Corrado, S.; Luzzani, G.; Trevisan, M.; Lamastra, L. Contribution of different life cycle stages to the greenhouse gas emissions associated with three balanced dietary patterns. Sci Total Env. 2019, 660, 622–630. [Google Scholar] [CrossRef] [PubMed]
- Goldstein, B.; Moses, R.; Sammons, N.; Birkved, M. Potential to curb the environmental burdens of American beef consumption using a novel plant-based beef substitute. PLoS ONE 2017, 12, e0189029. [Google Scholar] [CrossRef] [PubMed]
- Heller, M.; Keoleian, G.; Schenck, R.; Huizen, D. Greenhouse gas emissions of the U.S. diet: Aligning nutritional recommendations with environmental concerns. In Proceedings of the 9th International Conference on Life Cycle Assessment in the Agri-Food Sector (LCA Food 2014), San Francisco, CA, USA, 8–10 October 2014. [Google Scholar]
- Hitaj, C.; Rehkamp, S.; Canning, P.; Peters, C.J. Greenhouse Gas Emissions in the United States Food System: Current and Healthy Diet Scenarios. Env. Sci Technol 2019, 53, 5493–5503. [Google Scholar] [CrossRef]
- Hoekstra, A.Y. The hidden water resource use behind meat and dairy. Anim. Front. 2012, 2, 3–8. [Google Scholar] [CrossRef]
- Jalava, M.; Kummu, M.; Porkka, M.; Siebert, S.; Varis, O. Diet change—A solution to reduce water use? Environ. Res. Lett. 2014, 9, 074016. [Google Scholar] [CrossRef]
- Meier, T.; Christen, O. Environmental impacts of dietary recommendations and dietary styles: Germany as an example. Environ. Sci. Technol. 2013, 47, 877–888. [Google Scholar] [CrossRef]
- Pairotti, M.B.; Cerutti, A.K.; Martini, F.; Vesce, E.; Padovan, D.; Beltramo, R. Energy consumption and GHG emission of the Mediterranean diet: A systemic assessment using a hybrid LCA-IO method. J. Clean. Prod. 2015, 103, 507–516. [Google Scholar] [CrossRef]
- Peters, C.J.; Picardy, J.; Darrouzet-Nardi, A.F.; Wilkins, J.L.; Griffin, T.S.; Fick, G.W. Carrying capacity of U.S. agricultural land: Ten diet scenarios. Elem. Sci. Anthr. 2016, 4. [Google Scholar] [CrossRef] [Green Version]
- Rehkamp, S.; Canning, P. Measuring Embodied Blue Water in American Diets: An EIO Supply Chain Approach. Ecol. Econ. 2018, 147, 179–188. [Google Scholar] [CrossRef]
- Renault, D.; Wallender, W.W. Nutritional water productivity and diets. Agric. Water Manag. 2000, 45, 275–296. [Google Scholar] [CrossRef]
- Rosi, A.; Mena, P.; Pellegrini, N.; Turroni, S.; Neviani, E.; Ferrocino, I.; Di Cagno, R.; Ruini, L.; Ciati, R.; Angelino, D.; et al. Environmental impact of omnivorous, ovo-lacto-vegetarian, and vegan diet. Sci. Rep. 2017, 7, 6105. [Google Scholar] [CrossRef] [Green Version]
- Scarborough, P.; Appleby, P.N.; Mizdrak, A.; Briggs, A.D.M.; Travis, R.C.; Bradbury, K.E.; Key, T.J. Dietary greenhouse gas emissions of meat-eaters, fish-eaters, vegetarians and vegans in the UK. Clim. Chang. 2014, 125, 179–192. [Google Scholar] [CrossRef] [PubMed] [Green Version]
- Van Dooren, C.; Marinussen, M.; Blonk, H.; Aiking, H.; Vellinga, P. Exploring dietary guidelines based on ecological and nutritional values: A comparison of six dietary patterns. Food Policy 2014, 44, 36–46. [Google Scholar] [CrossRef]
- Vanham, D. The water footprint of Austria for different diets. Water Sci Technol 2013, 67, 824–830. [Google Scholar] [CrossRef] [PubMed]
- Vanham, D.; Hoekstra, A.Y.; Bidoglio, G. Potential water saving through changes in European diets. Environ. Int. 2013, 61, 45–56. [Google Scholar] [CrossRef]
- Vanham, D.; Mekonnen, M.M.; Hoekstra, A.Y. The water footprint of the EU for different diets. Ecol. Indic. 2013, 32, 1–8. [Google Scholar] [CrossRef]
- Vanham, D.; Bidoglio, G. The water footprint of Milan. Water Sci. Technol. 2014, 69, 789–795. [Google Scholar] [CrossRef]
- Vanham, D.; Bidoglio, G. The water footprint of agricultural products in European river basins. Environ. Res. Lett. 2014, 9, 064007. [Google Scholar] [CrossRef]
- Vanham, D.; Mak, T.N.; Gawlik, B.M. Urban food consumption and associated water resources: The example of Dutch cities. Sci. Total Environ. 2016, 565, 232–239. [Google Scholar] [CrossRef] [PubMed]
- Vanham, D.; del Pozo, S.; Pekcan, A.G.; Keinan-Boker, L.; Trichopoulou, A.; Gawlik, B.M. Water consumption related to different diets in Mediterranean cities. Sci. Total Environ. 2016, 573, 96–105. [Google Scholar] [CrossRef]
- Vanham, D.; Gawlik, B.M.; Bidoglio, G. Food consumption and related water resources in Nordic cities. Ecol. Indic. 2017, 74, 119–129. [Google Scholar] [CrossRef]
- Vanham, D.; Comero, S.; Gawlik, B.M.; Bidoglio, G. The water footprint of different diets within European sub-national geographical entities. Nat. Sustain. 2018, 1, 518–525. [Google Scholar] [CrossRef]
- Veeramani, A.; Dias, G.M.; Kirkpatrick, S.I. Carbon footprint of dietary patterns in Ontario, Canada: A case study based on actual food consumption. J. Clean. Prod. 2017, 162, 1398–1406. [Google Scholar] [CrossRef]
- Mekonnen, M.M.; Hoekstra, A.Y. The green, blue and grey water footprint of crops and derived crop products. Hydrol. Earth Syst. Sci. 2011, 15, 24. [Google Scholar] [CrossRef] [Green Version]
- Steinfeld, H.; Gerber, P.; Wassenaar, T.; Castel, V.; Rosales, M.; de Haan, C. Livestock’s Long Shadow; FAO’s Animal Production and Health Division: Rome, Italy, 2006. [Google Scholar]
- Hutson, S.; Barber, N.; Kenny, J.; Linsey, K.; Lumia, D.; Maupin, M. Estimated Use of Water in the United States in 2000; USGS: Reston, VA, USA, 2004. [Google Scholar]
- McGlade, J.; Werner, B.; Young, M.; Matlock, M.; Jefferies, D.; Sonneman, G.; Martinez-Aldaya, M.; Pfister, S.; Berger, M.; Farell, C.; et al. Measuring Water Use in a Green Economy, A Report of the Working Group on Water Efficiency to the International Resource Panel; United Nations Environment Programme: Nairobi, Kenya, 2012. [Google Scholar]
- Berardy, A.; Fresán, U.; Matos, R.A.; Clarke, A.; Mejia, A.; Jaceldo-Siegl, K.; Sabaté, J. Environmental Impacts of Foods in the Adventist Health Study-2 Dietary Questionnaire. Sustainability 2020, 12, 10267. [Google Scholar] [CrossRef]
- Forster, P.; Ramaswamy, V.; Artaxo, P.; Berntsen, T.; Betts, R.; Fahey, D.W.; Haywood, J.; Lean, J.; Lowe, D.C.; Myhre, G.; et al. Changes in Atmospheric Constituents and in Radiative Forcing Chapter 2; Cambridge University Press: Cambridge, UK, 2007. [Google Scholar]
- Millward, D.J.; Garnett, T. Plenary Lecture 3: Food and the planet: Nutritional dilemmas of greenhouse gas emission reductions through reduced intakes of meat and dairy foods. Proc. Nutr. Soc. 2010, 69, 103–118. [Google Scholar] [CrossRef] [Green Version]
- Sonesson, U.; Davis, J.; Ziegler, F. Food Production and Emissions of Greenhouse Gases; The Swedish Institute for Food and Biotechnology: Goteborg, Sweden, 2010. [Google Scholar]
- Gerber, P.J.; Steinfeld, H.; Henderson, B.; Mottet, A.; Optio, C.; Djkman, J.; Falcucci, A.; Tempio, G. Tackling Climate Change through Livestock: A Global Assessment of Emissions and Mitigation Opportunities; Food and Agriculture Organization of the United Nations (FAO): Rome, Italy, 2013; p. 139. [Google Scholar]
- USDA. 2015–2020 Dietary Guidelines for Americans; U.S. Department of Health and Human Services and U.S. Department of Agriculture USDA: Washington, DC, USA, 20 December 2015. [Google Scholar]
- Heller, M.C.; Keoleian, G.A. Beyond Meat’s Beyond Burger Life Cycle Assessment: A Detailed Comparison between a Plant-Based and an Animal-Based Protein Source; University of Michigan: Ann Arbor, MI, USA, 2018; pp. 1–38. [Google Scholar]
- Khan, S.; Loyola, C.; Dettling, J.; Hester, J.; Moses, R. Comparative Environmental LCA of the Impossible Burger® with Conventional Ground Beef Burger; Quantis: Lausanne, Switzerland, 2019. [Google Scholar]
- Eisen, M. How GMOs Can Save Civilization (and Probably Already Have); Impossible Foods: Redwood City, CA, USA, 2018. [Google Scholar]
- EPA. Greenhouse Gas Emissions from a Typical Passenger Vehicle; EPA: Washington, DC, USA, 2018. [Google Scholar]
- INPE. PRODES Amazonia: Monitoramento do Desmatamento da Floresta Amazônica Brasileira por Satélite; INPE: São José dos Campos, São Paulo, 2021. [Google Scholar]
- Errickson, F.; Kuruc, K.; McFadden, J. Animal-based foods have high social and climate costs. Nat. Food 2021, 2, 274–281. [Google Scholar] [CrossRef]
- Henders, S.; Persson, U.M.; Kastner, T. Trading forests: Land-use change and carbon emissions embodied in production and exports of forest-risk commodities. Environ. Res. Lett. 2015, 10, 125012. [Google Scholar] [CrossRef]
- Ritchie, H.; Roser, M. Forests and Deforestation. 2021. Available online: https://OurWorldInData.Org (accessed on 6 June 2021).
- Pernollet, F.; Coelho, C.R.V.; van der Werf, H.M.G. Methods to simplify diet and food life cycle inventories: Accuracy versus data-collection resources. J. Clean. Prod. 2017, 140, 410–420. [Google Scholar] [CrossRef]
- Scherer, L.; Behrens, P.; Tukker, A. Opportunity for a Dietary Win-Win-Win in Nutrition, Environment, and Animal Welfare. One Earth 2019, 1, 349–360. [Google Scholar] [CrossRef] [Green Version]
- Batlle-Bayer, L.; Bala, A.; Garcia-Herrero, I.; Lemaire, É.; Song, G.; Aldaco, R.; Fullana-i-Palmer, P. The Spanish Dietary Guidelines: A potential tool to reduce greenhouse gas emissions of current dietary patterns. J. Clean. Prod. 2019, 213, 588–598. [Google Scholar] [CrossRef]
- Chen, C.; Chaudhary, A.; Mathys, A. Dietary Change Scenarios and Implications for Environmental, Nutrition, Human Health and Economic Dimensions of Food Sustainability. Nutrients 2019, 11, 856. [Google Scholar] [CrossRef] [Green Version]
- Tom, M.; Fischbeck, P.; Hendrickson, C. Energy use, blue water footprint, and greenhouse gas emissions for current food consumption patterns and dietary recommendations in the US. Environ. Syst. Decis. 2015, 36, 92–103. [Google Scholar] [CrossRef]
- Kim, D.; Parajuli, R.; Thoma, G.J. Life Cycle Assessment of Dietary Patterns in the United States: A Full Food Supply Chain Perspective. Sustainability 2020, 12, 1586. [Google Scholar] [CrossRef] [Green Version]
- Van Kernebeek, H.R.J.; Oosting, S.J.; Van Ittersum, M.K.; Bikker, P.; De Boer, I.J.M. Saving land to feed a growing population: Consequences for consumption of crop and livestock products. Int. J. Life Cycle Assess. 2016, 21, 677–687. [Google Scholar] [CrossRef] [Green Version]
- Ridoutt, B.; Page, G.; Opie, K.; Huang, J.; Bellotti, W. Carbon, water and land use footprints of beef cattle production systems in southern Australia. J. Clean. Prod. 2014, 73, 24–30. [Google Scholar] [CrossRef]
- Kuempel, C.D.; Frazier, M.; Nash, K.L.; Jacobsen, N.S.; Williams, D.R.; Blanchard, J.L.; Cottrell, R.S.; McIntyre, P.B.; Moran, D.; Bouwman, L.; et al. Integrating Life Cycle and Impact Assessments to Map Food’s Cumulative Environmental Footprint. One Earth 2020, 3, 65–78. [Google Scholar] [CrossRef]
- Zaharia, S.; Ghosh, S.; Shrestha, R.; Manohar, S.; Thorne-Lyman, A.L.; Bashaasha, B.; Kabunga, N.; Gurung, S.; Namirembe, G.; Appel, K.H.; et al. Sustained intake of animal-sourced foods is associated with less stunting in young children. Nat. Food 2021, 2, 246–254. [Google Scholar] [CrossRef]
- Michel, F.; Hartmann, C.; Siegrist, M. Consumers’ associations, perceptions and acceptance of meat and plant-based meat alternatives. Food Qual. Prefer. 2021, 87, 104063. [Google Scholar] [CrossRef]
- Camilleri, A.R.; Larrick, R.P.; Hossain, S.; Patino-Echeverri, D. Consumers underestimate the emissions associated with food but are aided by labels. Nat. Clim. Chang. 2019, 9, 53–58. [Google Scholar] [CrossRef]


Publisher’s Note: MDPI stays neutral with regard to jurisdictional claims in published maps and institutional affiliations. |
© 2021 by the authors. Licensee MDPI, Basel, Switzerland. This article is an open access article distributed under the terms and conditions of the Creative Commons Attribution (CC BY) license (https://creativecommons.org/licenses/by/4.0/).