Article

Geographical Distribution and Modeling of the Impact of Women Driving Cars on the Sustainable Development of Saudi Arabia

1
Geography Department, College of Arts, Imam Abdulrahman Bin Faisal University, Dammam 34212, Saudi Arabia
2
Environmental Engineering Department, College of Engineering, Imam Abdulrahman Bin Faisal University, Dammam 34212, Saudi Arabia
*
Authors to whom correspondence should be addressed.
Sustainability 2021, 13(17), 9941; https://doi.org/10.3390/su13179941
Submission received: 7 August 2021 / Revised: 26 August 2021 / Accepted: 31 August 2021 / Published: 4 September 2021

Abstract

:
Background: This work investigated attitudes and public perception regarding the impact of allowing women to drive on social, environmental, and economic aspects of the sustainable development in the Kingdom of Saudi Arabia (KSA). The study includes the perspectives of both women and men towards the potential implications of this decree on society in general and women’s well-being in particular. Methods: The methodology consisted of an online survey that was conducted before and after the decree was activated in 2017, where 62,065 individuals participated from thirteen provinces of the KSA. Geographic information systems (GISs) and statistical methods were applied to the obtained datasets to examine the geographical distribution and modeling of the effect of women driving on sustainable development of the KSA. Results: The results show that the attitudes towards allowing women to drive are geographically and statistically diverse. The study revealed that the economic impact of women driving was the highest significance, especially in increasing employment opportunities for women and decreasing household travel expenses for women. Conclusion: Overall, 70.4% of respondents agreed that women driving will positively affect the sustainable development of the KSA in terms of social and economic impact. The study also revealed that geographic location is one of the dominating factors on the attitudes towards the social impact of women driving within 95% confidence interval. Additionally, participants strongly believe (with an agreement rate of 85.1%) that Saudi women driving will improve economic development and the female job market.

1. Introduction

Recently, the Kingdom of Saudi Arabia (KSA) has moved towards a remarkable revolution stated in Vision 2030 [1]. According to this vision, the country has established a roadmap for fulfilling its goals and creating a sustainable future for the Kingdom. The main themes of Vision 2030 are a vibrant society; a thriving economy; and an ambitious goal to achieve a decrease in KSA’s dependence on oil, diversify its economy, and enhance public service sectors. Women’s empowerment is at the topmost of the KSA’s plan, which will help achieve one of the most important goals to reduce the female unemployment rate. A remarkable change to empower women in the KSA is the royal decree delivered in September 2017, allowing women to get driving licenses. The female population of the KSA exceeds 15 million and accounts for more than 45% of the KSA’s population. It is expected that Saudi women’s social activities and participation in the workforce market will change significantly within the next few years. As a result, it is projected to be reflected positively in the country’s broader community, economy, and sustainability, as foreseen in Vision 2030. Simultaneously, permitting women to drive their own car will also generate new challenges that have to be delicately identified to achieve the aimed goals of sustainable development [1,2,3,4,5,6,7].
While the long-overdue policy of allowing women to drive in the KSA leads to new women drivers, many of them are inexperienced with this social experience and acceptance and may have enormous consequences from the transportation system and traffic safety [2,3]. The KSA made a courageous decision in 2017 and declared that Saudi women would be allowed to drive for the very first time. It is expected that this decision will help boost women’s contribution to economic growth and play a more prominent role in social life [1,4,5,6,7,8,9]. Moreover, empowering women could be considered a strong way to support the development, tolerance, and equality in the society as well as the values they may add to the whole enhancement of the country [10].
Many studies uncovered that the discrepancies between female and male vehicle use and mobility patterns impact social, economic, and environmental sustainability. Researchers tried to investigate this gap and explore the gender effect on car use, especially in male-dominant societies [3,5,7,8,11,12,13,14]. In the KSA, women usually have been reliant on male relatives, non-Saudi private drivers, or taxi transportation for work or shopping, as they were not allowed to drive until mid-2018. There is a strong belief that this prevented qualified women who chose to join the workforce. This led to Saudi women’s unemployment rate in 2016 being nearly six orders of magnitude than Saudi men’s [2,6].
Williams et al. [6] researched the relationship between the accessibility of various forms of transportation and women’s opportunity to join a job in the KSA. The study provides Riyadh’s comparative travel cost maps and explores commute costs for solo driving, private drivers, and taxi services. The study revealed that reducing commute costs, possibly by allowing women to drive themselves, raises the prospect for women’s employability.
Özkan and Lajunen [15] investigated how male and female roles were associated with their driving skills and involvement in an accident, including 217 young university student drivers at the Middle East Technical University in Ankara, Turkey. The impacts of sex and gender factors were analyzed on study variables, using Poisson and hierarchical regression analyses. It was found that being a male forecasted the number of involved active and passive accidents, as well as driving skills. On the other hand, the femininity factor predicted the safety skills positively in the study.
The qualitative research on the public’s perception of how autonomous vehicles (AVs) can be applied and the public attitude regarding self-driving vehicles in Austria was studied in September 2018 by Hilgarter and Granig [16]. The results showed that the type of transport plays a crucial role in community social life. For instance, in countryside areas, AVs may alter the transportation modes to public transportation instead of using private cars. This work shows various attributes of societal and economic challenges. Generally, the study reveals that the participants think positively about AVs.
Mohamed and Bromfield [9] analyzed the relationships between driving manners and accident engagement among 287 youthful male drivers and their attitudes towards traffic safety in the KSA. The study involves a structural equation modeling to forecast the associations between driving behaviors, attitudes, and accident contributions. The study findings clarified that the driving performance could be classified into three clusters: liability for error, violent driving attitude, and above-limit speed driving. In contrary to error making, both violent and high-speed driving attitudes are significantly affected by drivers’ behaviors towards road traffic safety, in addition to their significant influence on accident participation. The driving skill, education level, and socioeconomic factors presented no significant correlation with accident involvement in the performed study.
Shirgaokar and Lanyi-Bennett [17] in 2020 explored the effects of family and gender classification on work travel, daily time restrictions, and implications in Canada. The study methodology used a people sample with an unknown probability and conducted focus groups to determine how qualified women and men contemplate car-use and transportation alternatives daily. Furthermore, models of weighted robust regression were used to inspect the gender differences by using six groups of controls, including household and individual characteristics, full-day time car use, travel destination, and location aspects. The study results showed that women devote more time than men to household tasks, including grocery buying and child-rearing. This work highlights the significance of gender-related travel policies and transportation choices for multipart trip making.
Al-Garawi et al. [18] recently assessed traffic crashes among novice female drivers in the KSA. Their study concluded that single, divorced/widowed, employed, and high-income female novice drivers were at a higher danger of being involved in road-traffic crashes, whether they hired personal trainers or not. They have suggested that training programs of driving schools in the KSA should include additional on-road in-traffic driving lessons for drivers who have a general fear of driving.
This study aimed to investigate the geographical distribution and modeling of the impact of women driving cars on the sustainable development of the KSA, using geographic information systems (GIS) and statistical methods. This study tried to probe the public perception of women driving in the KSA regarding social, environmental, and economic influences. The study was conducted nationwide to cover all provinces of the KSA. This work is expected to establish the base for future researches targeting on women driving, since it is the first comprehensive and spatially distributed with an immense number of participants in the KSA.

2. Materials and Methods

2.1. Survey Design

An online questionnaire survey called “She Drives KSA” was designed to explore attitudes, responses, and perceptions of both females and males in the KSA to the women driving and its impacts on the sustainable development of the country. The first phase of the survey (Wave I) was conducted in June 2018 before the ban on women driving was lifted on 24 June 2018. The second phase of the survey (Wave II) was performed between June and November 2019. Several methods, such as text messages, e-mails, and social media posts, were used to invite individuals to participate in surveys. The invitations for Wave II were also sent to those who participated in Wave I.
The target of the study was to examine the behavior during the transition period from the initiation of the royal decree to allow women to drive and the actual women’s involvement in street driving, in addition to exploring the implementation preparedness. The questionnaire was prepared to explore the influence of women’s car use on sustainable development, including social, economic, and environmental aspects. The questionnaire was structured in four main sections, including sociodemographic characteristics of participants and attitudes towards women driving on social, economic, and environmental factors. The survey instruments conducted in the Wave I and Wave II are depicted in Table 1.

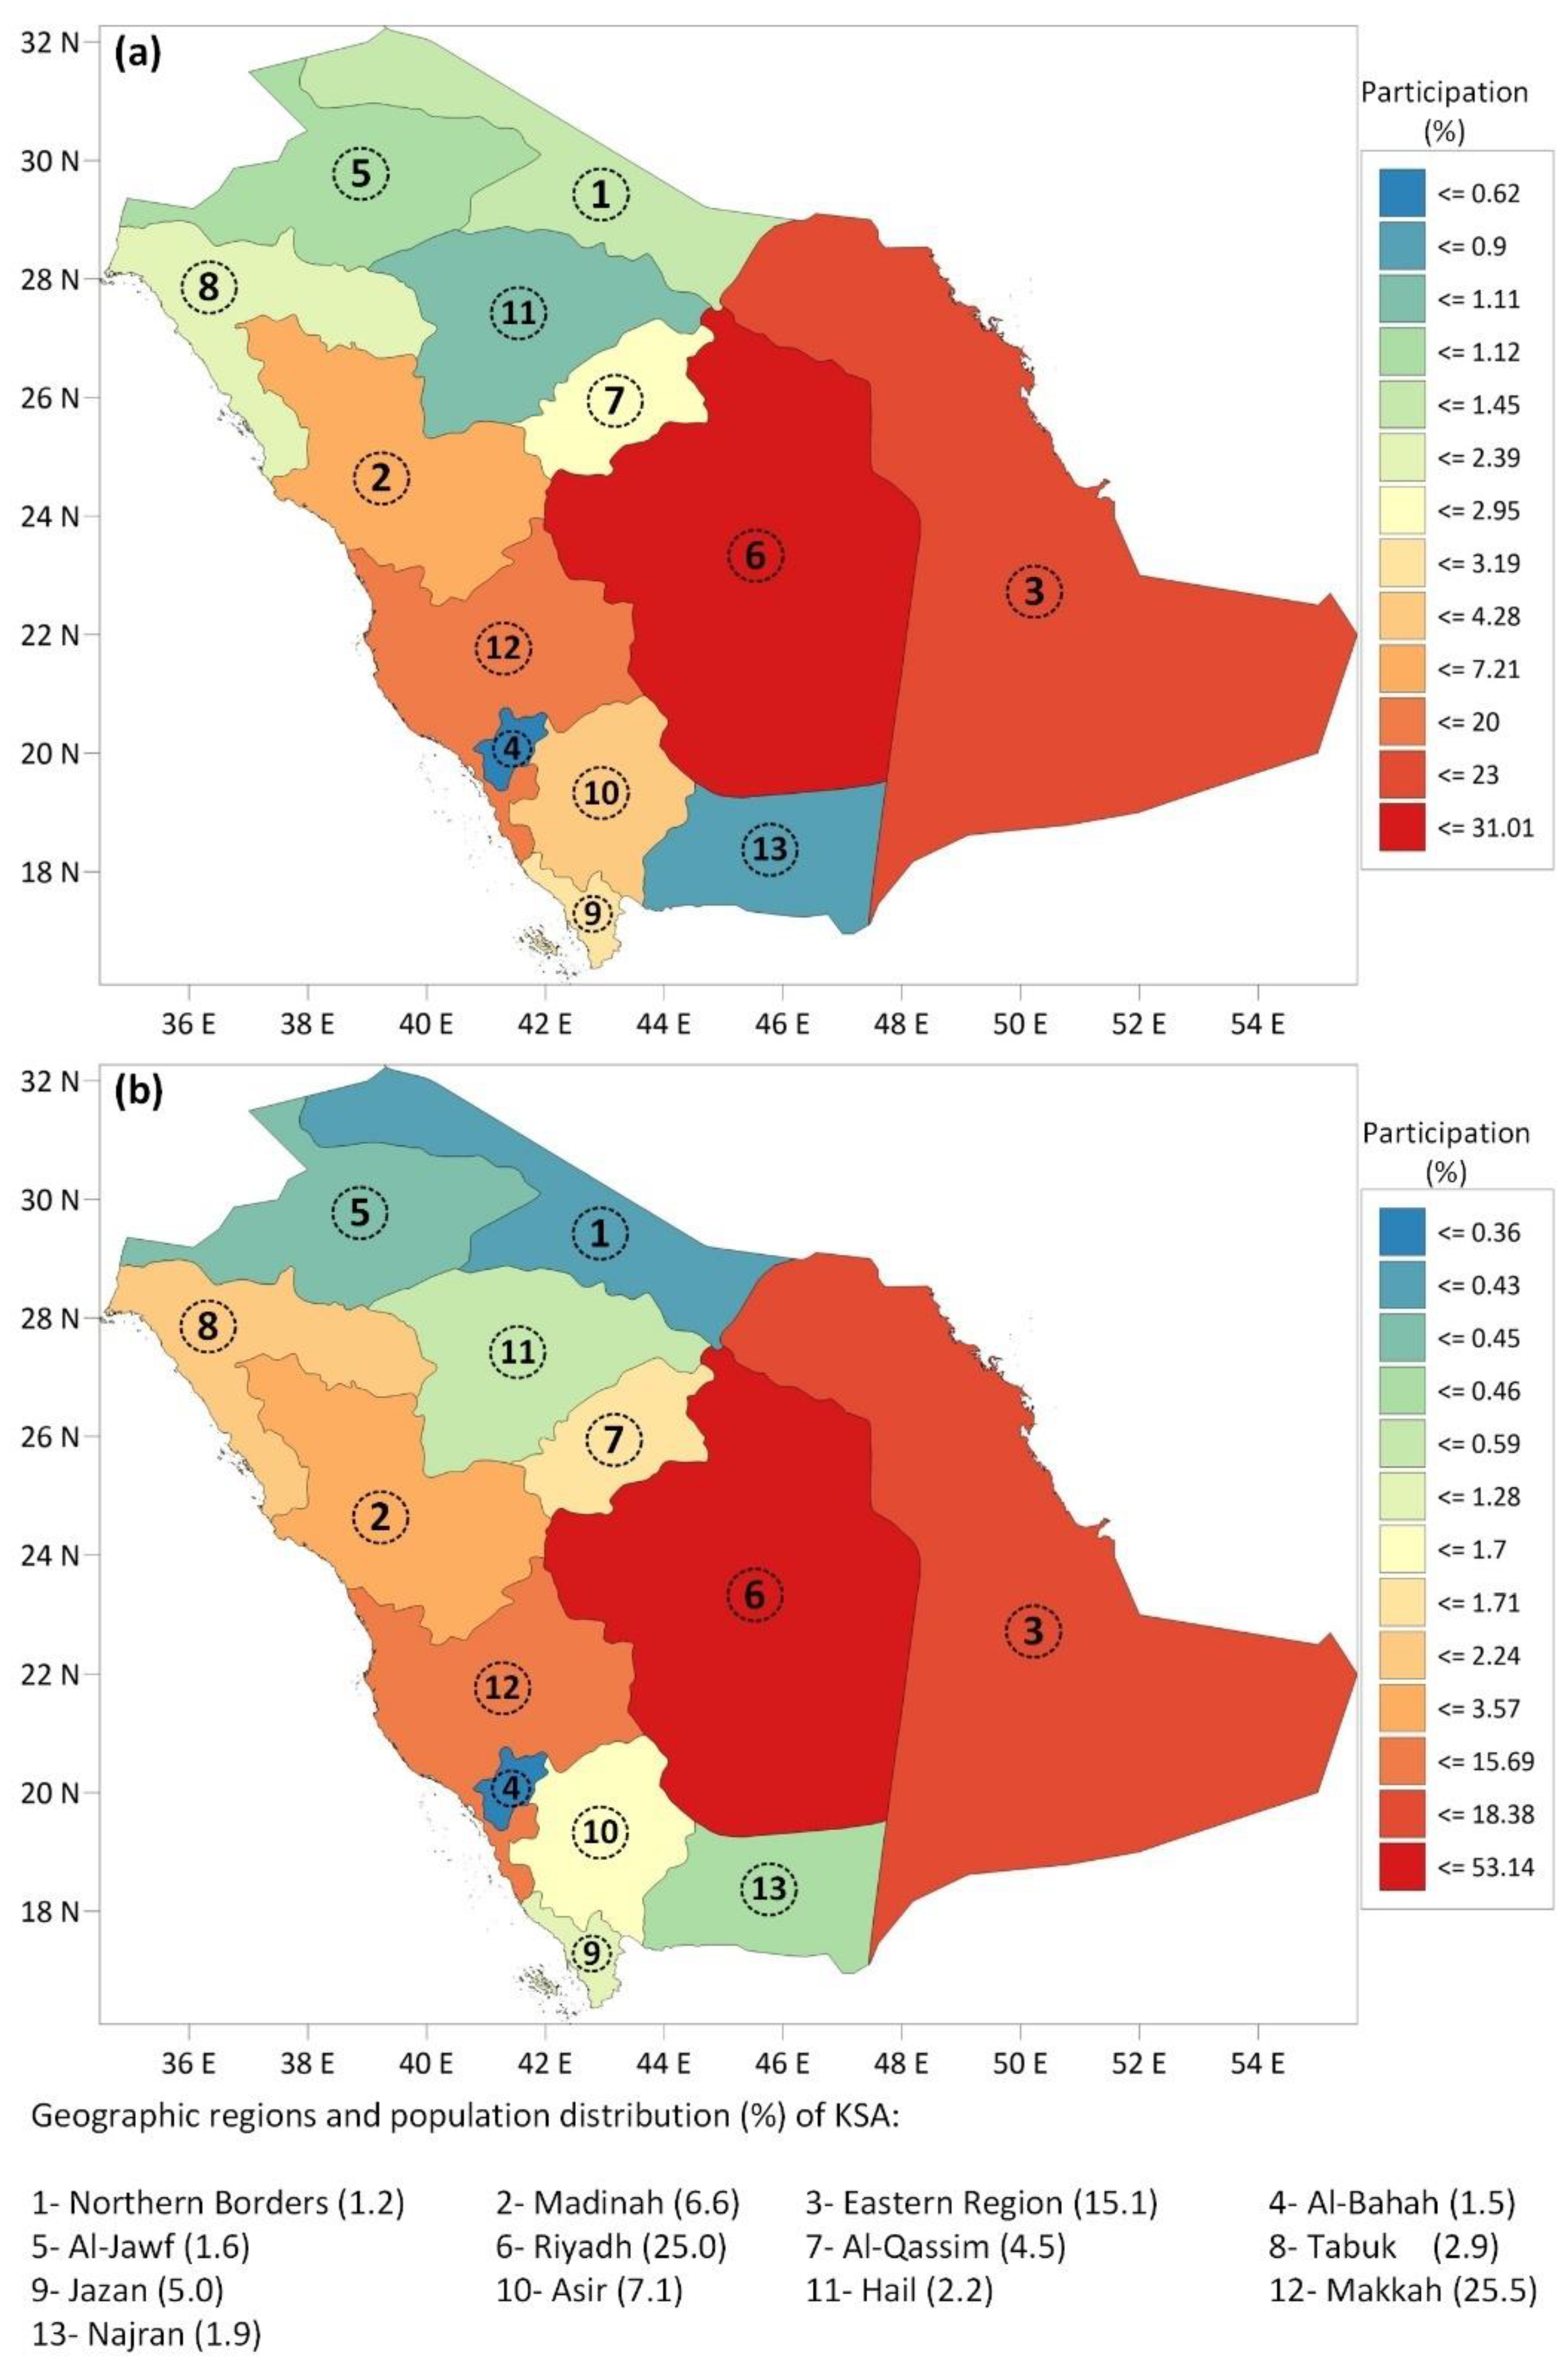
2.2. Participants’ Sociodemographic Characteristics

The sample used for the analysis in this study consists of 62,065 respondents. The numbers of respondents who completed the whole questionnaire of Wave I and Wave II were 31,426 and 30,639, respectively. Sociodemographic features of the respondents are described as a percentage (%) in Table 2.
The age group between 18 and 45 years old represented 86.8%, 89.1%, and 87.9% of the participants in the Wave I, Wave II, and the whole study, respectively. The highest participation was found to be 39.8% by the age group 26–35 through the entire study. The samples of the Wave I and Wave II consist of 36.5–69.3% women and 63.5–30.7% men, respectively. The combined data of the Wave I and Wave II indicated that women’s (52.4%) and men’s (47.6%) participation rates are quite close to each other. Regarding education level, the overall sample mainly consists of educated people, since the participants were invited only through text messages on their mobile phones, and those with lower education might not have the knowledge how to access and answer the survey. Among those, 58.4% have a college education, 25.3% obtained a secondary/high school diploma, and 11.5% hold a higher education degree (Master’s or PhD). The majority of the participants was employed, with a rate of 61.9%, while 38.1% of them were unemployed. Marital status data revealed that the single, married, and divorce/widowed ratio was 36.2%, 57.4%, and 6.41%, respectively.
Individuals from thirteen provinces of KSA were invited to the survey, while representativeness of respondents based on the KSA’s population were targeted. The province-wise geographic distribution of participation rates was visualized by using the QGIS software (ver. 3.16) in Figure 1. The Pearson’s correlation coefficient between the participation rates and population distribution of provinces based on the latest census data [19] was computed as 0.90, indicating a positively strong correlation and proportional participation from provinces compared to the population distribution of the KSA. The highest participation was provided from the Riyadh province, with a rate of 41.8%, which was followed by the Eastern (21.2%) and Makkah (17.9%) provinces.

2.3. Statistical Analysis and Modeling

The IBM® Statistical Package for Social Sciences (SPSS®, ver. 24, IBM Middle East, Riyadh/Saudi Arabia) software platform was used for statistical analysis and modeling of survey datasets. Descriptive parameters, such as mean, standard deviation, skewness, and kurtosis, were calculated to summarize the collected data. The hierarchical cluster analysis was applied to classify social, economic, and environmental statements of the survey. Between-groups linkage of cluster method and squared Euclidean distance of measure interval were selected in the hierarchical cluster analysis. The results depicted that social, economic, and environmental statements were clustered into (SOC-3, SOC-6, SOC-10, and SOC-14), (ECO-2, ECO-5, ECO-6, and ECO-9), and (ENV-2 and ENV-3), respectively. The automatic linear modeling tool, accelerating the data-analysis process via a number of automated mechanisms [20,21], was employed for modeling the selected social, economic, and environmental parameters. During the model setup, a forward-stepwise standard model with 95% confidence interval was selected. The target and predictor datasets were prepared automatically prior to modeling, including (i) adjustment of measurement level, (ii) outlier and missing value handling, and (iii) supervised merging steps. Prediction results were replicated by generating 54.8 × 10⁵ random seeds for the obtained survey dataset.

3. Results and Discussions

3.1. Social Impacts

Lifting the ban on women from driving has been one of the utmost socially significant reforms implemented by KSA’s government. The survey consisted of 14 attitudinal statements linked to the potential changes due to allowing women to drive that may join them to the society more efficiently. An overview of responses to the social-impact section of the survey is presented as a summary statistic comprising male-to-female ratio of mean scores (M/F), mean, standard deviation (STD), skewness, and kurtosis values in Table 3. Several interesting insights can be inferred from the results, as there are significant differences between responses to each statement and between the opinions of men and women regarding each statement. The ratio of men’s to women’s responses varied between 0.85 and 1.16 for most of the statements, suggesting that attitudes of women and men towards the social impact of women driving are diverse. Differences between men’s and women’s responses varying from 13.3% to 23.5% are noticed in statements such as the following (mean values are given in parenthesis):
  • “SOC-6—Women are capable of taking driving responsibilities”, for which men are neutral (3.49) and women agree (4.37).
  • “SOC-9—Women might be afraid to drive”, with men neutral (2.69), while women disagree (2.27).
  • “SOC-11—The time women spend driving will distract them from completing other tasks”, where men are neutral (2.70) while women disagree (2.31).
  • “SOC-12—Driving will make women want to show off their cars”, for which men are neutral (3.04), whereas women disagree (2.45).
  • “SOC-13—I am afraid that women will be abused while driving”, with men neutral (2.94), while women disagree (2.12).
In general, the frequency behavior of the statements in the social-impact category typically fits the normal distribution. On the other hand, frequency distributions of SOC-1, SOC-2, SOC-3, SOC-4, SOC-6, SOC-7, and SOC-14 statements slightly skewed to the left due to their negative skewness values ranged from −1.02 to −2.50, which could be attributed to the highly clustered scores between 4 and 5 (agree/completely agree). For the same statements mentioned above, the kurtosis values of Wave II are higher than those of Wave I. Kurtosis values of SOC-1, SOC-2, SOC-7, and SOC-14 are greater than 3 and fit the leptokurtic type of kurtosis. This type of distribution is because of highly grouped scores between 4 and 5 and low standard deviation values. These frequency distribution interpretations reveal that SOC-1, SOC-2, SOC-3, SOC-4, SOC-6, SOC-7, and SOC-14 statements received outnumbered higher scores in Wave II, implying that the start of women driving has contributed positively to social attitudes of the KSA.
Table 3. Summary statistics of responses to social-impact questionnaires.
CategoryWave IWave II
M/F *MeanSTDSkewnessKurtosisM/F *MeanSTDSkewnessKurtosis
SOC-10.903.921.54−1.02−0.610.924.630.74−2.507.19
SOC-20.953.941.51−1.04−0.500.904.470.91−1.953.63
SOC-30.963.591.48−0.55−1.090.914.320.90−1.361.59
SOC-40.933.621.57−0.62−1.170.894.370.97−1.662.30
SOC-50.953.231.64−0.22−1.530.853.721.27−0.61−0.74
SOC-60.853.651.55−0.67−1.100.794.271.02−1.481.57
SOC-70.894.071.42−1.230.000.884.490.86−1.963.84
SOC-81.032.661.660.35−1.511.112.461.290.52−0.82
SOC-91.192.591.530.39−1.281.142.351.210.57−0.64
SOC-101.122.831.630.17−1.541.162.561.280.37−0.95
SOC-111.172.601.610.40−1.411.142.391.260.60−0.70
SOC-121.152.991.610.01−1.541.232.451.260.47−0.82
SOC-131.212.851.580.16−1.471.422.151.190.80−0.32
SOC-140.934.021.44−1.15−0.200.924.391.03−1.953.25
* Male-to-female ratio of mean scores.
The distribution of overall survey results (Wave I and Wave II) based on the answer options given on a Likert-type scale ranging from 1 (completely disagree) to 5 (completely agree) is demonstrated in Figure 2. All positive statements on women driving in the social-impact category (SOC-1, SOC-2, SOC-3, SOC-4, SOC-5, SOC-6, SOC-7, and SOC-14) acquired high agreement levels (agree + completely agree) ranging between 51.9% and 79.9%. Respondents agreed the most with a rate greater than 78% on three statements: (i) “SOC-1—Driving is one of women’s rights”, (ii) “SOC-7—Driving will enable women to act in emergencies”, and (iii) “SOC-14—Driving would eliminate all the troubles accompanying employed drivers”. The agreements with the SOC-7 and SOC-14 statements signify a consensus that the status quo of women being able to drive results in limitations in case of emergencies and issues arising from the employed drivers. On the other hand, the majority of the respondents disagreed (completely disagree + disagree) with negative statements in regard to the social impact of women driving (SOC-8, SOC-9, SOC-10, SOC-11, SOC-12, and SOC-13), with ratios fluctuating between 46.7% and 55.4%. It is noteworthy to mention that levels of disagreement on negative statements are on average 20% lower than those of positive statements. This difference is the result of the respondents who were in doubt about the statements, with a neutral rate of 21.2% (±1.46). Generally, the mean scores of women (2.39 ± 0.21) were found to be 14.2% lower than those of men (2.79 ± 0.17) for the negative statements, suggesting that women are more confident than men on the idea that enabling women to drive will not negatively impact the social attitude of the KSA. Participants built a consensus on SOC-8, SOC-9, SOC-11, and SOC-13 statements. The necessity of women having drivers had been an important pain-point for families in the KSA until the ban on women from driving was lifted. Even though a majority of the respondents believe that women will not be dependent on employed drivers after ending the ban on women driving, the rate of the individuals believing that women should have drivers rather than drive themselves is 27.1%. Disagreement rates on SOC-9 (54.0%), SOC-11 (55.4), and SOC-13 (54.0%) statements specify that apprehensions on driving phobia, completing other tasks due to the time spent on driving, and traffic harassment which women drivers might experience have not been perceived as potential negative impacts of women driving on the KSA’s social life.
The effect of lifting the ban on women to drive on the attitudes towards the social impact was also investigated by comparing the results of Wave I and Wave II. Differences between response scores calculated for Wave I and Wave II are shown in Figure 3. It can be inferred from the comparison results that putting women driving into practice has positively affected attitudes towards the social impact due to increased agreement rates on positive statements and disagreement rates on negative statements as well. The most significant change was observed for SOC-13 (−24.5%), which was followed by SOC-4 (20.7%) and SOC-3 (20.3%) statements. The doubts on possible traffic harassment on women drivers have been relieved, as the KSA has enacted stringent penalties to protect women drivers against harassers and the experienced respectful behavior shown for women drivers. As the number of women drivers has increased and women adapted to being a part of traffic mobility, families have been more supportive of their women members driving, and the idea of women driving has become more socially acceptable, based on the results of Wave II.
The geographic distribution of average responses of attitudes towards the social impact being clustered into SOC-3, SOC-6, SOC-10, and SOC-14 statements is depicted in Figure 4. Geographically, average response scores on both “women driving is socially acceptable (SOC-3)” and “women are capable of taking driving responsibilities (SOC-6)” statements are the lowest in the Asir (3.34 and 3.40) and Al-Qassim (3.42 and 3.50) provinces, while average response scores of Riyadh (4.15 and 4.16) and Eastern Region (4.00 and 3.97) are the highest for the same statements. Participants from Riyadh, Eastern Region, Tabuk, Al-Jawf, and Makkah provinces were more supportive on the idea that the driving will not be an obstacle for women to fulfill their household responsibilities (SOC-10), whereas respondents from other provinces were neutral with it. Even though the statement “Driving would eliminate all the troubles accompanying employed drivers (SOC-14)” was agreed nationwide, the highest average response scores were provided by the participants from Riyadh (4.28), Northern Borders (4.23), Eastern Region (4.22), and Tabuk (4.21) provinces.
A multivariate correlation analysis was performed to statistically determine whether the geographic location plays a role in attitudes towards the social impact of women driving or not. Positive and strong correlation coefficients (p) within the range between 0.818 and 0.963 were found for province-wise response scores of SOC-3, SOC-6, and SOC-14 statements. Geographically, the negative statement “SOC-10” indicated negative and strong correlations with positive statements of SOC-3 (p = −0.893), SOC-6 (p = −0.893), and SOC-14 (p = −0.893), respectively. The multivariate correlation analysis results disclose that the geographic location is one of the dominating factors on the attitudes towards the social impact of women driving within 95% confidence interval.
SOC-3, SOC-6, SOC-10, and SOC-14 indicatory statements of the social-impact category were modeled by use of the automatic linear modeling. All sociodemographic parameters and statements in the social category were defined as predictors to model target indicatory statements. Prediction accuracies of linear models targeting SOC-3, SOC-6, SOC-10, and SOC-14 were found to be 52.7%, 60.6%, 53.5%, and 29.1%, respectively. Coefficients and percent importance of predictors and the intercept of the best performing model “SOC-6” are depicted in Figure 5.
The SOC-6 model is best explained by SOC-7 statement with 37.3% of importance, which was followed by SOC-5 (13.5%), SOC-4 (11.4%), and gender (10.0%). The total importance of the remaining predictors is 26.3%. The SOC-6 model results conclude that the necessity to act in emergencies, social and economic standing of being a driver, and family encouragement are key factors for women to take driving responsibilities.

3.2. Economic Impacts

The participation of women in KSA’s labor market is very low; one of the lowest in the world. With only approximately 20% of females in the KSA economically active [22], the country lags behind even the other Gulf countries, where participation averaged 42% in 2016 [23]. Recognizing this, the KSA administration made raising the female employment rate one of its main targets in the National Vision 2030 program, designed to modernize Saudi society. Summary statistics of responses to economic impact questionnaires are given in Table 4.
The ratio of men’s to women’s responses to the economic impact section ranged between 0.91 and 1.08, implying that attitudes of women and men towards the economic impact of women driving are positive and quite comparable. The highest differences between men’s and women’s responses varying from 8.9% to 9.7% are observed in statements below:
  • “ECO-1—Women driving might contribute to achieving the objectives of Vision 2030”, which men agree (3.95) and women agree/completely agree (4.55).
  • “ECO-2—Women driving might contribute to increasing income rates in the Kingdom”, where men’s and women’s average response scores are 3.79 and 4.35, respectively.
  • “ECO-4—Women driving might increase female’s empowerment in the Kingdom”, on which women’s agreement level (4.53) is more than those of men (3.92).
Mainly, the normal distribution describes most of the frequency behaviors of the statements in the economic impact category. Frequency distributions of the statements slightly skewed to the left because negative skewness values ranging between −0.55 and −1.92, which might be ascribed to the highly clustered scores between 4 and 5 (agree/completely agree). For all statements except ECO-10, the kurtosis values of the Wave II are higher than those of the Wave I. The average kurtosis value of ECO-5 statement in the whole survey study is greater than 3 and fits the leptokurtic type of kurtosis due to the highly grouped scores between 4 and 5 with the lowest standard deviation among other statements. The frequency distribution analysis concludes that all statements except ECO-10 statement obtained outnumbered higher scores in Wave II, inferring that the initiation of women driving has positively affected economic attitudes of the KSA.
Figure 6 represents the distribution of the whole survey results (Wave I and Wave II) regarding the response options given on a Likert-type scale ranging from 1 (completely disagree) to 5 (completely agree). All statements on women driving in the economic impact category received high agreement rates (agree + completely agree), fluctuating between 61.1% and 85.1%. Respondents agreed the most with a rate greater than 80% on four statements: (i) “ECO-3—Women driving might reduce the volume of international labor remittances”, (ii) “ECO-5—Women driving might increase car sales of car dealerships in the Kingdom for certain types”, (iii) “ECO-8—Women driving might reduce the number of private drivers in the Kingdom”, and (iv) “ECO-9—Women driving might create new female job opportunities”.
The participants of our study strongly believe that women driving will contribute to the reduction of international labor remittances, as now Saudi women will be able to undertake part of the job positions that are currently held by non-Saudis. Many business sectors have been expecting a boost. These include car manufacturers, car dealerships, driving schools, and insurers. The statement “Women driving might increase car sales of car dealerships in the Kingdom for certain types”, one of the strongest expectations of our survey participants, has received the highest agreement rate of 85.1%, among others. In addition, it is strongly believed that the royal decree on lifting the ban of women driving will have a positive impact on households’ expenses. The households’ expenses for women transportation are expected to drop, as women will not require a driver to escort them to their activities. As a consequence, survey respondents believe that the number of privately employed drivers by households will dramatically drop. Participants also strongly believe that allowing women to drive will contribute to women’s employment rates, as they will be able to commute independently without needing someone to drive them. Overall, both women and men participants expect a positive impact on the country’s economy due to lifting the ban on women driving. They are also confident that this decree will contribute to achieving the objectives of Vision 2030.
The impact of allowing women to drive on attitudes towards the economy was examined by comparing the results of Wave I and Wave II (Figure 7). As it was concluded from social-impact results (Section 3.1), the promulgation of women driving positively impacted attitudes towards the economic impact because of improved agreement rates on all statements in the Wave II, except ECO-10. Interestingly, the average response score of the statement “ECO-10—Women driving might increase fuel consumption in the Kingdom” decreased from 3.91 to 3.59 in comparison with the Wave I and Wave II. The increased agreement rate of the statement “ECO-5—Women driving might increase car sales of car dealerships in the Kingdom for certain types” compared to the Wave I is also expected to increase the agreement rate of the ECO-10 statement. This might be explained by the percent change of the statement “ECO-8—Women driving might reduce number of private drivers in the Kingdom” that is 3.6% more than that of the ECO-5 statement.
Figure 8 depicts the geographic distribution of average responses of attitudes towards the economic impact being grouped into ECO-2, ECO-5, ECO-6, and ECO-9 statements. Geographically, respondents from Najran and Riyadh provinces provided the highest average scores of 4.13 and 4.12, respectively, for “ECO-2—Women driving might contribute to increasing income rates in the Kingdom” statement. Average response scores of both “ECO-5—Women driving might increase car sales of car dealerships in the Kingdom for certain types” and “ECO-9—Women driving might create new female job opportunities” statements are the highest for the Eastern Region (4.48 and 4.45) and Riyadh (4.45 and 4.44) provinces. Respondents from Riyadh, Tabuk, and Makkah provinces were the most promoters on the notion that women driving might reduce women’s household’s monthly expenses for transportation (ECO-6). Contrarily, the lowest average scores of ECO-2, ECO-5, ECO-6, and ECO-9 statements were observed for the participants from Asir and Hail provinces. The multivariate correlation analysis results revealed that positive and strong correlation coefficients varying between 0.757 and 0.947 were found for province-wise response scores of ECO-2, ECO-5, ECO-6, and ECO-9 statements within a 95% confidence interval. It can be statistically concluded that geographic location plays a critical role in attitudes towards the economic impact of women driving.
All sociodemographic parameters and statements of the economic category were specified as predictors to model target indicatory statements of ECO-2, ECO-5, ECO-6, and ECO-9 during the automatic linear modeling. Prediction accuracies of linear models targeting ECO-2, ECO-5, ECO-6, and ECO-9 were computed to be 60.0%, 34.9%, 45.5%, and 55.3, respectively. Figure 9 indicates coefficients and percent importance of predictors and the intercept of the best performing model “ECO-2”. The ECO-2 model is best explained by ECO-1 statement with 46.2% of importance, followed by ECO-4 (30.8%) and ECO-3 (11.7%). The total importance of the remaining predictors on the model is found to be 10.4%. The ECO-2 model results explain that the contribution potential of women driving to the achievement of sustainability and Vision 2030 objectives, increasing women empowerment, and decreasing international labor remittances are driving factors for increasing income rates in the KSA.

3.3. Environmental Impacts

The survey included three attitudinal statements linked to the potential impacts on the environment due to allowing women to drive. A statistical overview of the statements that were submitted to respondents during the environmental impact section is presented in Table 5. Attitudes of women and men towards the environmental impact of women driving are quite similar for the statements “ENV-1—The infrastructure is not sufficient to support women driving” and “ENV-3—Driving would increase the number of electric cars in the Kingdom”, since the ratio of men’s to women’s response scores fluctuated within the range between 0.97 and 1.12. The highest difference between men’s and women’s responses (17.3%) was for the statement “ENV-2—Women driving will contribute to increasing environmental pollution”, which men are neutral (2.88) and women disagree (2.10). The frequency behaviors of all statements in the environmental impact category fit to normal distribution due to their low skewness and kurtosis values.
The distribution of the entire survey results (Wave I and Wave II) based on the answer options given on a Likert-type scale ranging from 1 (completely disagree) to 5 (completely agree) is depicted in Figure 10. A majority of the respondents agree (agree + completely agree, 43.8%) with that the infrastructure is not sufficient to support women driving, whereas 33.3% of the participants disagree with the same statement, and 22.9% of them are neutral with it. The highest consensus was observed for the statement “Women driving will contribute to increasing environmental pollution”, on which 53.5% of the respondents disagree (completely disagree + disagree). The agreement rate of the respondents (agree + completely agree) for the statement “ENV-3—Driving would increase the number of electric cars in the Kingdom” is 38.9%, while 37.6% of them are neutral and 23.6% of them disagree (completely disagree + disagree) with the same statement.
The effect of ending the ban on women driving on attitudes towards the environment was examined by comparing the results of Wave I and Wave II. Differences between response scores calculated for Wave I and Wave II are shown in Figure 11. The average response scores of ENV-1 and ENV-2 statements in Wave II decreased by 14.7% and 17.3%, respectively. These changes signify that participants’ doubts on the availability of infrastructure supporting women driving and the contribution of women driving to environmental pollution had been eased after putting women driving into practice. The respondent’s perception on the statement “ENV-3—Driving would increase the number of electric cars in the Kingdom” did not change significantly according to the Wave I.
The geographic distribution of average responses of attitudes towards the environmental impact being clustered into ENV-2 and ENV-3 statements is illustrated in Figure 12. The disagreement level for the statement “ENV-2—Women driving will contribute to increasing environmental pollution” was the highest for Riyadh (2.34), Tabuk (2.53), and Eastern Region (2.57) provinces. The geographic distribution of average responses to the ENV-3 statement indicated that there is a nationwide uncertainty on whether women driving would increase the number of electric cars in the KSA or not, since the province-wise mean score is 3.25 ± 0.07. The correlation analysis results revealed that the correlation between province-wise mean scores of ENV-2 and ENV-3 statements is weak (p = 0.162), and geographic location is not an important parameter on attitudes towards the environmental impact of women driving for this study.
Statements of the environmental impact category were modeled using the automatic linear modeling. All sociodemographic parameters and statements in the environmental category were selected as predictors to model the target statement. Prediction accuracies of linear models targeting ENV-1, ENV-2, and ENV-3 statements were found to be 29.0%%, 31.5%, and 4.2%, respectively. Figure 13 shows coefficients and percent importance of predictors and the intercept of the best performing model “ENV-2”. The ENV-2 model is explained best by the ENV-1 statement with 88.4% of importance, which is followed by gender (6.6%), ENV-3 (3.7%), and education (0.5%) predictors. It is noteworthy to mention that the model accuracies of environmental impact models are remarkably lower than those of social and economic impact models developed in this study. This could be attributed to the limited availability of predictors in environmental impact models compared to other models.

4. Conclusions

An overview of responses to the social-impact section of the survey indicated that the start of women driving has contributed positively to social attitudes of the KSA. Positive statements on women driving in the social-impact category acquired high agreement levels (72%). Participants built a consensus that (i) driving is one of women’s rights and a status symbol for women, (ii) women driving is socially acceptable and encouraged by most of the family members, (iii) allowing women to drive in alignment with KSA’s Vision 2030 will enhance the image of Saudi Arabia to the rest of the world, (iv) women are capable of taking driving responsibilities without distracting them from completing other tasks, and (v) driving will enable women to act more efficiently in emergencies and eliminate all difficulties arising from employed drivers. It is noteworthy to mention that women driving has become more socially acceptable, and families have been more supportive of their women members driving, as the number of women drivers has increased, and women adapted to being a part of traffic mobility in the KSA.
The response scores of the economic impact part of the survey revealed that the initiation of women driving has positively affected economic attitudes of the KSA. The majority of the respondents (76%) agreed that women driving will contribute to (i) achieving vibrant society, thriving economy, and ambitious nation objectives of Vision 2030 by increasing female’s empowerment and participation in the workforce, (ii) increasing income rates in the KSA through reducing women’s monthly expenses for transportation, increasing car sales of car dealerships, and decreasing the number of private drivers and volume of international labor remittances.
The summary of response scores of the environmental impact section of the survey implied that the infrastructure to support women driving is not sufficient. Building sufficient infrastructures, such as driving schools, driving training fields, and female-friendly driving environments, is suggested herein to overcome this drawback. In addition, most of the participants (54%) agreed on the notion that women driving will not be a contributing source to environmental pollution.
The multivariate correlation analysis results disclosed that the geographic location is one of the governing factors on the attitudes towards social and economic impacts of women driving within a 95% confidence interval. Participants from the Riyadh and Eastern Region provinces provided the highest agreement rates to the idea that the women driving will positively affect the sustainable development of the KSA in terms of social, economic, and environmental aspects, whereas respondents from Asir, Al-Qassim, and Hail provinces were mostly neutral with it.
Selected social and economic statements using the hierarchical cluster analysis were modeled with an automatic linear modeling approach. Satisfactory prediction accuracies of 60.6% and 60.0% were obtained for social and economic models, respectively. The car driving that enables women to act efficiently in emergencies was the most important predictor for the social model, while the economic model was best explained by the contribution of women driving to the achievement of Vision 2030’s objectives.
Furthermore, the study revealed that the participants were also confident that the royal decree allowing women to drive would contribute to achieving the sustainable development objectives and Vision 2030’s goals of the KSA. The fifth goal of the United Nation’s sustainable development goals (UN’s SDGs) aims to achieve gender equality and empower women. The KSA’s Vision 2030 is the main driving force behind the great change and granting women the right to drive. The right of women to drive, approved by the royal decree, has granted gender equality in car driving for all women in the KSA. This is in total alignment with the UN’s SDGs and Vision 2030 by increasing women’s participation in the workforce from 22% to 30%.
The authors strongly recommend performing a new survey to address the gaps in environmental-related issues where prediction accuracies of environmental models are non-significant with currently used statements in the environmental impact section of the survey. Moreover, new feedbacks on social, economic, and environmental attributes are needed to be evaluated, and the key performance of women’s car use should further be obtained.

Author Contributions

Conceptualization, N.A.-G.; methodology, N.A.-G. and I.A.; investigation, N.A.-G.; data curation, N.A.-G. and I.A.; writing—original draft preparation, N.A.-G. and I.A.; writing—review and editing, N.A.-G. and I.A.; visualization, I.A.; project administration, N.A.-G.; funding acquisition, N.A.-G. All authors have read and agreed to the published version of the manuscript.

Funding

This research received no external funding.

Institutional Review Board Statement

Not applicable.

Informed Consent Statement

Not applicable.

Data Availability Statement

The data presented in this study are available on request from the corresponding author.

Acknowledgments

Authors would like to thank Ömer Ağa for his tremendous support on this paper and his unwavering commitment to support us throughout the journey.

Conflicts of Interest

The authors declare no conflict of interest.

References

  1. Wheeler, D.L. Saudi Women Driving Change? Rebranding, Resistance, and the Kingdom of Change. J. Middle East Afr. 2020, 11, 87–109. [Google Scholar] [CrossRef]
  2. Najah, B.; Moqbel, B.; Qarawi, A.; Kamargianni, M. She Drives KSA: Phase 1 Survey Report; Imam Abdulrahman Bin faisal University: Dammam, Saudi Arabia, 26 September 2018. [Google Scholar]
  3. Kamargianni, M. She Drives KSA: Phase 2 Survey Results; Imam Abdulrahman Bin faisal University: Dammam, Saudi Arabia, February 2020; pp. 1–154. [Google Scholar]
  4. Elyas, T.; Al-Zhrani, K.A.; Mujaddadi, A.; Almohammadi, A. The representation(s) of Saudi women pre-driving era in local newspapers and magazines: A critical discourse analysis. Br. J. Middle East. Stud. 2020, 1–20. [Google Scholar] [CrossRef]
  5. Jarbou, R. Know your enemy: The Saudi women’s driving campaign from flyers and faxes to Youtube and hashtags. Fem. Media Stud. 2018, 18, 321–325. [Google Scholar] [CrossRef]
  6. Williams, S.; Qiu, W.; Al-awwad, Z.; Alfayez, A. Commuting for women in Saudi Arabia: Metro to driving-Options to support women employment. J. Transp. Geogr. 2019, 77, 126–138. [Google Scholar] [CrossRef]
  7. Khalil, A.; Storie, L.K. Social media and connective action: The case of the Saudi women’s movement for the right to drive. New Media Soc. 2020, 18, 80–100. [Google Scholar] [CrossRef]
  8. Ahmed, Z. Saudi Arabia women boost the automotive industry. In International Trade Administration, Market Intelligence. Available online: https://www.trade.gov/market-intelligence/saudi-arabia-women-boost-automotive-industry (accessed on 1 September 2021).
  9. Mohamed, M.; Bromfield, N.F. Attitudes, driving behavior, and accident involvement among young male drivers in Saudi Arabia. Transp. Res. Part F Traffic Psychol. Behav. 2017, 47, 59–71. [Google Scholar] [CrossRef]
  10. Rajkhan, S.F. Women in Saudi Arabia: Status, Rights, and Limitations; University of Washington Bothell: Bothell, WA, USA, 2014. [Google Scholar]
  11. Cubells, J.; Marquet, O.; Miralles-Guasch, C. Gender and age differences in metropolitan car use. Recent gender gap trends in private transport. Sustainability 2020, 12, 7286. [Google Scholar] [CrossRef]
  12. Hendriks, S. The role of financial inclusion in driving women’s economic empowerment. Dev. Pract. 2019, 29, 1029–1038. [Google Scholar] [CrossRef] [Green Version]
  13. Vinz, D. Gender and sustainable consumption: A german environmental perspective. Eur. J. Women’s Stud. 2009, 16, 159–179. [Google Scholar] [CrossRef]
  14. Taubman-Ben-Ari, O.; Lotan, T. The contribution of a novel intervention to enhance safe driving among young drivers in Israel. Accid. Anal. Prev. 2011, 43, 352–359. [Google Scholar] [CrossRef] [PubMed]
  15. Özkan, T.; Lajunen, T. What causes the differences in driving between young men and women? The effects of gender roles and sex on young drivers’ driving behaviour and self-assessment of skills. Transp. Res. Part F Traffic Psychol. Behav. 2006, 9, 269–277. [Google Scholar] [CrossRef]
  16. Hilgarter, K.; Granig, P. Public perception of autonomous vehicles: A qualitative study based on interviews after riding an autonomous shuttle. Transp. Res. Part F Traffic Psychol. Behav. 2020, 72, 226–243. [Google Scholar] [CrossRef]
  17. Shirgaokar, M.; Lanyi-Bennett, K. I’ll have to drive there: How daily time constraints impact women’s car use differently than men’s. Transportation 2020, 47, 1365–1392. [Google Scholar] [CrossRef]
  18. Al-Garawi, N.; Dalhat, M.A.; Aga, O. Assessing the Road Traffic Crashes among Novice Female Drivers in Saudi Arabia. Sustainability 2021, 13, 8613. [Google Scholar] [CrossRef]
  19. GASTAT. Population of Saudi Arabia by Age Groups and Gender; General Authority for Statistics of Saudi Arabia: Riyadh, Saudi Arabia, 2019.
  20. Yang, H. The Case for Being Automatic: Introducing the Automatic Linear Modeling (LINEAR) Procedure in SPSS Statistics. Mult. Linear Regres. Viewp. 2013, 39, 27–37. [Google Scholar]
  21. Cleophas, T.J.; Zwinderman, A.H. Automatic Linear Regression (35 Patients). In SPSS for Starters and 2nd Levelers; Springer International Publishing: Cham, Switzerland, 2016; pp. 35–40. [Google Scholar]
  22. GASTAT. Bulletin Gender Statistics; General Authority for Statistics of Saudi Arabia: Riyadh, Saudi Arabia, 2020.
  23. Daoud, Z. Saudi Arabia Insight: Women driving may reap more than Aramco. Bloomberg. Available online: https://www.bloomberg.com/professional/blog/saudi-arabia-insight-women-driving-may-reap-aramco (accessed on 1 September 2021).
Figure 1. Geographic distribution of participation rates of (a) Wave I and (b) Wave II.
Sustainability 13 09941 g001
Figure 2. Distribution of responses for social-impact category.
Sustainability 13 09941 g002
Figure 3. Changes in response scores of social-impact category compared to the Wave I.
Sustainability 13 09941 g003
Figure 4. Geographic distribution of average responses for social-impact clusters: SOC-3, SOC-6, SOC-10, and SOC 14.
Sustainability 13 09941 g004
Figure 5. Social-impact model targeting SOC-6 statement.
Sustainability 13 09941 g005
Figure 6. Distribution of responses for economic impact category.
Sustainability 13 09941 g006
Figure 7. Changes in response scores according to the Wave I.
Sustainability 13 09941 g007
Figure 8. Geographic distribution of average responses for economic impact clusters: ECO-2, ECO-5, ECO-6, and ECO-9.
Sustainability 13 09941 g008
Figure 9. Economic impact model targeting ECO-2 statement.
Sustainability 13 09941 g009
Figure 10. Distribution of responses for environmental impact category.
Sustainability 13 09941 g010
Figure 11. Changes in response scores according to the Wave I.
Sustainability 13 09941 g011
Figure 12. Geographic distribution of average responses for environmental impact clusters: ENV-2 and ENV-3.
Sustainability 13 09941 g012
Figure 13. Environmental impact model targeting ENV-2 statement.
Sustainability 13 09941 g013
Table 1. Survey instruments.
CategoryStatementScale
Demographic
DEM-1Age1–7
DEM-2Gender1–2
DEM-3Education1–5
DEM-4Employment1–2
DEM-5Marital Status1–4
Social
SOC-1Driving is one of women’s rights1–5
SOC-2Women driving will enhance the image of Saudi Arabia to the rest of the world1–5
SOC-3Women driving is socially acceptable1–5
SOC-4My family encourages women to drive1–5
SOC-5Driving is a status symbol for women1–5
SOC-6Women are capable of taking driving responsibilities1–5
SOC-7Driving will enable women to act in emergencies1–5
SOC-8There is no need for women to drive because they have drivers1–5
SOC-9Women might be afraid to drive1–5
SOC-10Women will be overwhelmed with more household responsibilities if they drive1–5
SOC-11The time women spend driving will distract them from completing other tasks1–5
SOC-12Driving will make women want to show off their cars1–5
SOC-13I am afraid that women will be abused while driving1–5
SOC-14Driving would eliminate all the troubles accompanying employed drivers1–5
Economic
ECO-1Women driving might contribute to achieving the objectives of Vision 20301–5
ECO-2Women driving might contribute to increasing income rates in the Kingdom1–5
ECO-3Women driving might reduce the volume of international labor remittances1–5
ECO-4Women driving might increase female’s empowerment in the Kingdom1–5
ECO-5Women driving might increase car sales of car dealerships in the Kingdom for certain types1–5
ECO-6Women driving might reduce a women’s household’s monthly expenses for transportation1–5
ECO-7Women driving might increase financial and legal burdens of women1–5
ECO-8Women driving might reduce the number of private drivers in the Kingdom1–5
ECO-9Women driving might create new female job opportunities1–5
ECO-10Women driving might increase fuel consumption in the Kingdom1–5
Environment
ENV-1The infrastructure is not sufficient to support women driving1–5
ENV-2Women driving will contribute to increasing environmental pollution1–5
ENV-3Driving would increase the number of electric cars in the Kingdom1–5
Table 2. Sociodemographic description of respondents.
Wave I (%)Wave II (%)Wave I and II (%)
Age<181.580.611.11
18–2520.722.921.7
26–3540.139.539.8
36–4526.026.726.3
46–559.157.988.58
56–652.162.152.16
>650.340.150.25
GenderMale63.530.747.6
Female36.569.352.4
EducationElementary/no education1.910.701.32
Intermediate4.602.053.36
Secondary/high school28.422.025.3
College53.863.358.4
Higher studies11.311.911.5
EmploymentEmployed64.958.761.9
Non-employed35.141.338.1
Marital StatusSingle 33.738.936.2
Married62.052.557.4
Divorced/widowed4.318.656.41
Table 4. Summary statistics of responses to economic impact questionnaires.
CategoryWave IWave II
M/F *MeanSTDSkewnessKurtosisM/F *MeanSTDSkewnessKurtosis
ECO-10.934.071.40−1.230.040.914.420.89−1.742.98
ECO-20.923.901.45−0.97−0.520.904.211.01−1.230.94
ECO-30.944.191.30−1.410.670.954.480.84−1.923.96
ECO-40.924.041.39−1.17−0.040.914.400.88−1.682.87
ECO-50.974.361.11−1.742.090.974.470.76−1.693.50
ECO-60.943.971.43−1.07−0.310.914.311.00−1.551.85
ECO-71.083.701.43−0.67−0.881.023.851.08−0.830.14
ECO-80.974.161.28−1.340.550.964.420.87−1.773.32
ECO-90.934.311.22−1.671.550.924.470.82−1.883.98
ECO-101.013.911.41−0.95−0.471.033.591.27−0.55−0.73
* Male-to-female ratio of mean scores.
Table 5. Summary statistics of responses to environmental impact questionnaires.
CategoryWave IWave II
M/F *MeanSTDSkewnessKurtosisM/F *MeanSTDSkewnessKurtosis
ENV-11.023.451.56−0.44−1.301.122.941.300.05−1.12
ENV-21.162.741.600.25−1.461.272.271.190.68−0.41
ENV-30.973.231.46−0.19−1.220.993.251.08−0.19−0.30
* Male-to-female ratio of mean scores.
Publisher’s Note: MDPI stays neutral with regard to jurisdictional claims in published maps and institutional affiliations.

