Abstract
Globally, climate change poses enormous threats to the livelihoods of rural communities in arid and semi-arid regions. Assessing the extent of vulnerability is critical to identify climate hot spots and develop appropriate adaptation policies and strategies. This paper uses the Livelihood Vulnerability Index (LVI) and the Livelihood Vulnerability Index—Intergovernmental Panel on Climate Change (LVI-IPCC) to compare vulnerability to climate change in the Exchange, Insukamini, and Ruchanyu smallholder irrigation schemes (SISs) in the Midlands Province of Zimbabwe. A questionnaire was used to collect data from a sample of 317 randomly selected households. Results show higher exposure and sensitivity to climate change in the Insukamini irrigation scheme despite the higher adaptive capacity. Both LVI and LVI-IPCC show that households in Insukamini irrigation scheme are more vulnerable to climate change than in Exchange and Ruchanyu irrigation schemes, attributed to water insecurity, poor social networks, and natural disasters and climate variability. The study recommends that development and investment in Insukamini and Ruchanyu should prioritize improving social networks while Exchange should primarily focus on improving livelihood strategies. Using the LVI-IPCC framework is a key methodology for understanding the vulnerability of communities in SISs and identifying areas that need prime development and investment. These results have implications on implementing investments and livelihood policies in SISs of Zimbabwe.
1. Introduction
Climate change poses a significant threat to smallholder agricultural systems in arid and semi-arid regions [1], in which a greater proportion of the population depends on the agricultural sector for food and income security [2]. The risk posed by climate change is now greater in developing countries, given high exposure and sensitivity coupled with a low adaptive capacity [3]. Understanding localised vulnerability of livelihood systems of poverty-stricken communities is highly prioritised given the need to develop National Adaptation Plans (NAPs). Currently, many countries in southern Africa, including Zimbabwe, are developing NAPS for improved adaptation to climate change as stipulated in the United Nations Framework Convention on Climate Change (UNFCCC) [4]. Available evidence suggests that Africa’s climate is changing, and the negative implications are dire in communities deriving livelihoods from climate-sensitive sectors [5,6]. In southern Africa, there has been an increase in both the frequency and severity of extreme events, particularly droughts [7], with negative consequences on the livelihoods of communities dependent on climate-sensitive sectors such as agriculture and natural resources [7,8]. In the absence of adaptation strategies, climate change poses a significant threat to the achievement of sustainable development.
Zimbabwe is one of the countries in southern Africa regarded as a climate hot spot. Over the past century, daily maximum and daily minimum temperatures in the country, have increased by 2.6 °C and 2.0 °C, respectively [9,10], while rainfall has dropped by approximately 10% over the same period [9,10]. Meanwhile, cyclones and droughts have become more severe in the past decade [9]. Empirical evidence suggests that climate change is expected to result in increased temperature and a more variable precipitation pattern, including high frequency and intensity of extreme weather events [11] with severe implications for human welfare [12,13,14]. The minimum temperature in Zimbabwe is projected to rise by 0.99 °C to 1.18 °C and by 1.55 °C to 1.98 °C in the 2030s and 2050s, respectively [15]. Similarly, the maximum temperature is expected to increase by 1.08 °C to 1.31 °C and by 1.8 °C to 2.27 °C in the 2030s and 2050s, respectively [15]. Meanwhile, projections for rainfall indicate that it will change its pattern, frequency, and intensity [11]. As a result, there is increased expectation that warm spell durations and heatwaves will escalate [11], with droughts and cyclones following suit. The droughts are projected to increase by 21% and 47% in the 2050s and 2080–2090s, respectively [15], while days of the subsequent dry spell are projected to increase by thirteen and twenty-five days per annum in the 2050s and 2090s, respectively [15]. Thus, a decline in precipitation pattern, a warming trend and an increase in the severity of weather extremes are expected to be the new norm for southern Africa, where Zimbabwe is located. However, the evaporation rate of 5.1 mm at maximum temperature of 24.9 °C reported in Zimbabwe will increase as climate change impacts worsen [16].
Zimbabwe, with 13.1 million people [17], is an agro-based economy [18,19]. It provides 60% of inputs to manufacturing industries [16], it is a market to 40% of industrial outputs [17,19], contributes 30% of export earnings [19], employs 60–70% of the national labour force, contributing up to 19% of the national GDP, and provides livelihoods for 70% of the national population [19]. In addition, it is a source of food and income security for over 67% of the population [20]. Despite the role of agriculture in socio-economic development, the sector, which is mainly rain-fed, is highly vulnerable to climate change and extreme weather events, particularly droughts [13,20]. For example, the severe drought of 1991/1992 resulted in a decline of the nation’s agricultural production by 45% and its GDP by 11%, respectively [21]. These extremes have severe implications for poverty. Empirical evidence suggests that over the past three decades, extreme poverty rose from 29% (4.7 million people) in 2018 to 34% (5.7 million people) in 2019 due to sub-normal rainfall [18]. Poverty will worsen land and forest degradation, further reducing the capacity of communities to absorb climate shocks [22]. In the absence of policies and strategies, smallholder farmers will have difficulties in sustainably increasing agricultural yields given high climate variability [23]. Therefore, to develop appropriate policies and adaptation strategies, it is critical to carry out vulnerability assessments in light of the significant investments the country has made in smallholder irrigation schemes. In total, 216,000 ha of irrigation land were developed in Zimbabwe by 2020, of which 26,000 ha are under smallholder irrigation farming [24]. Yet, currently, only 175 000 ha are functional and predominantly under overhead irrigation (77%) [24]. Thus, assessing vulnerability of the SISs using credible methods and tools is a priority research area given the risk posed by climate change.
The most useful method of assessing vulnerability, which is recently in use at the society level, is the Livelihood Vulnerability Index (LVI) adapted to the IPCC framework (LVI-IPCC) [25]. LIV-IPCC indices, developed by Hahn et al. (2009), were widely used to quantify vulnerability to climate change and variability [25,26,27,28,29]. LVI-IPCC maps LVI components into exposure, adaptive capacity, and vulnerability [30]. The LVI-IPCC indices can synthesize complex situations where a broad range of factors contribute to individuals’ and societies’ vulnerability [31]. It recognizes diversity in natural hazards, climatic conditions, and the socio-economic setup of communities [30]. LVI-IPCC can also be used to compare the vulnerability of systems by comparing factors that worsen vulnerability within the community [30]. Different scholars have analysed the vulnerability of Zimbabwean communities to climate change and variability and tried to develop adaptation strategies to climate hazards [13,32,33,34,35]. Since Hahn et al. (2009) conducted research using LVI-IPCC in 2009, no research was conducted using LVI-IPCC in Zimbabwe. The present research is the first of its kind to assess vulnerability using LVI-IPCC in Zimbabwe. The results of most of these studies are general and aggregate, and they do not focus on the vulnerability of smallholder farming communities in the nation. Although agriculture was identified among the extremely vulnerable sectors to climate change and variability in Zimbabwe [34], most studies focus on rain-fed agriculture, leaving the smallholder irrigation farming, something that has the potential to plunge the country into disaster, unnoticed. A handful of studies on vulnerability were conducted in Gokwe District [36], Muzarabani District [37], Epworth (Harare) [38], and Kariba resort town [39]. However, to the best of our knowledge, the vulnerability assessment studies conducted in the country do not capture the vulnerability of smallholder irrigation farmers in the country, nor do they use the LVI-IPCC approach. In order to close this lacuna, a study was undertaken in the Midlands province, which, despite having the presence of several SISs [35], is among the highly vulnerable provinces to climate change and variability in Zimbabwe [40]. Thus, it was essential to understand the sources of the vulnerability to climate change in the SISs in the province for informed decisions in adaptation planning.
2. Materials and Methods
2.1. Study Area
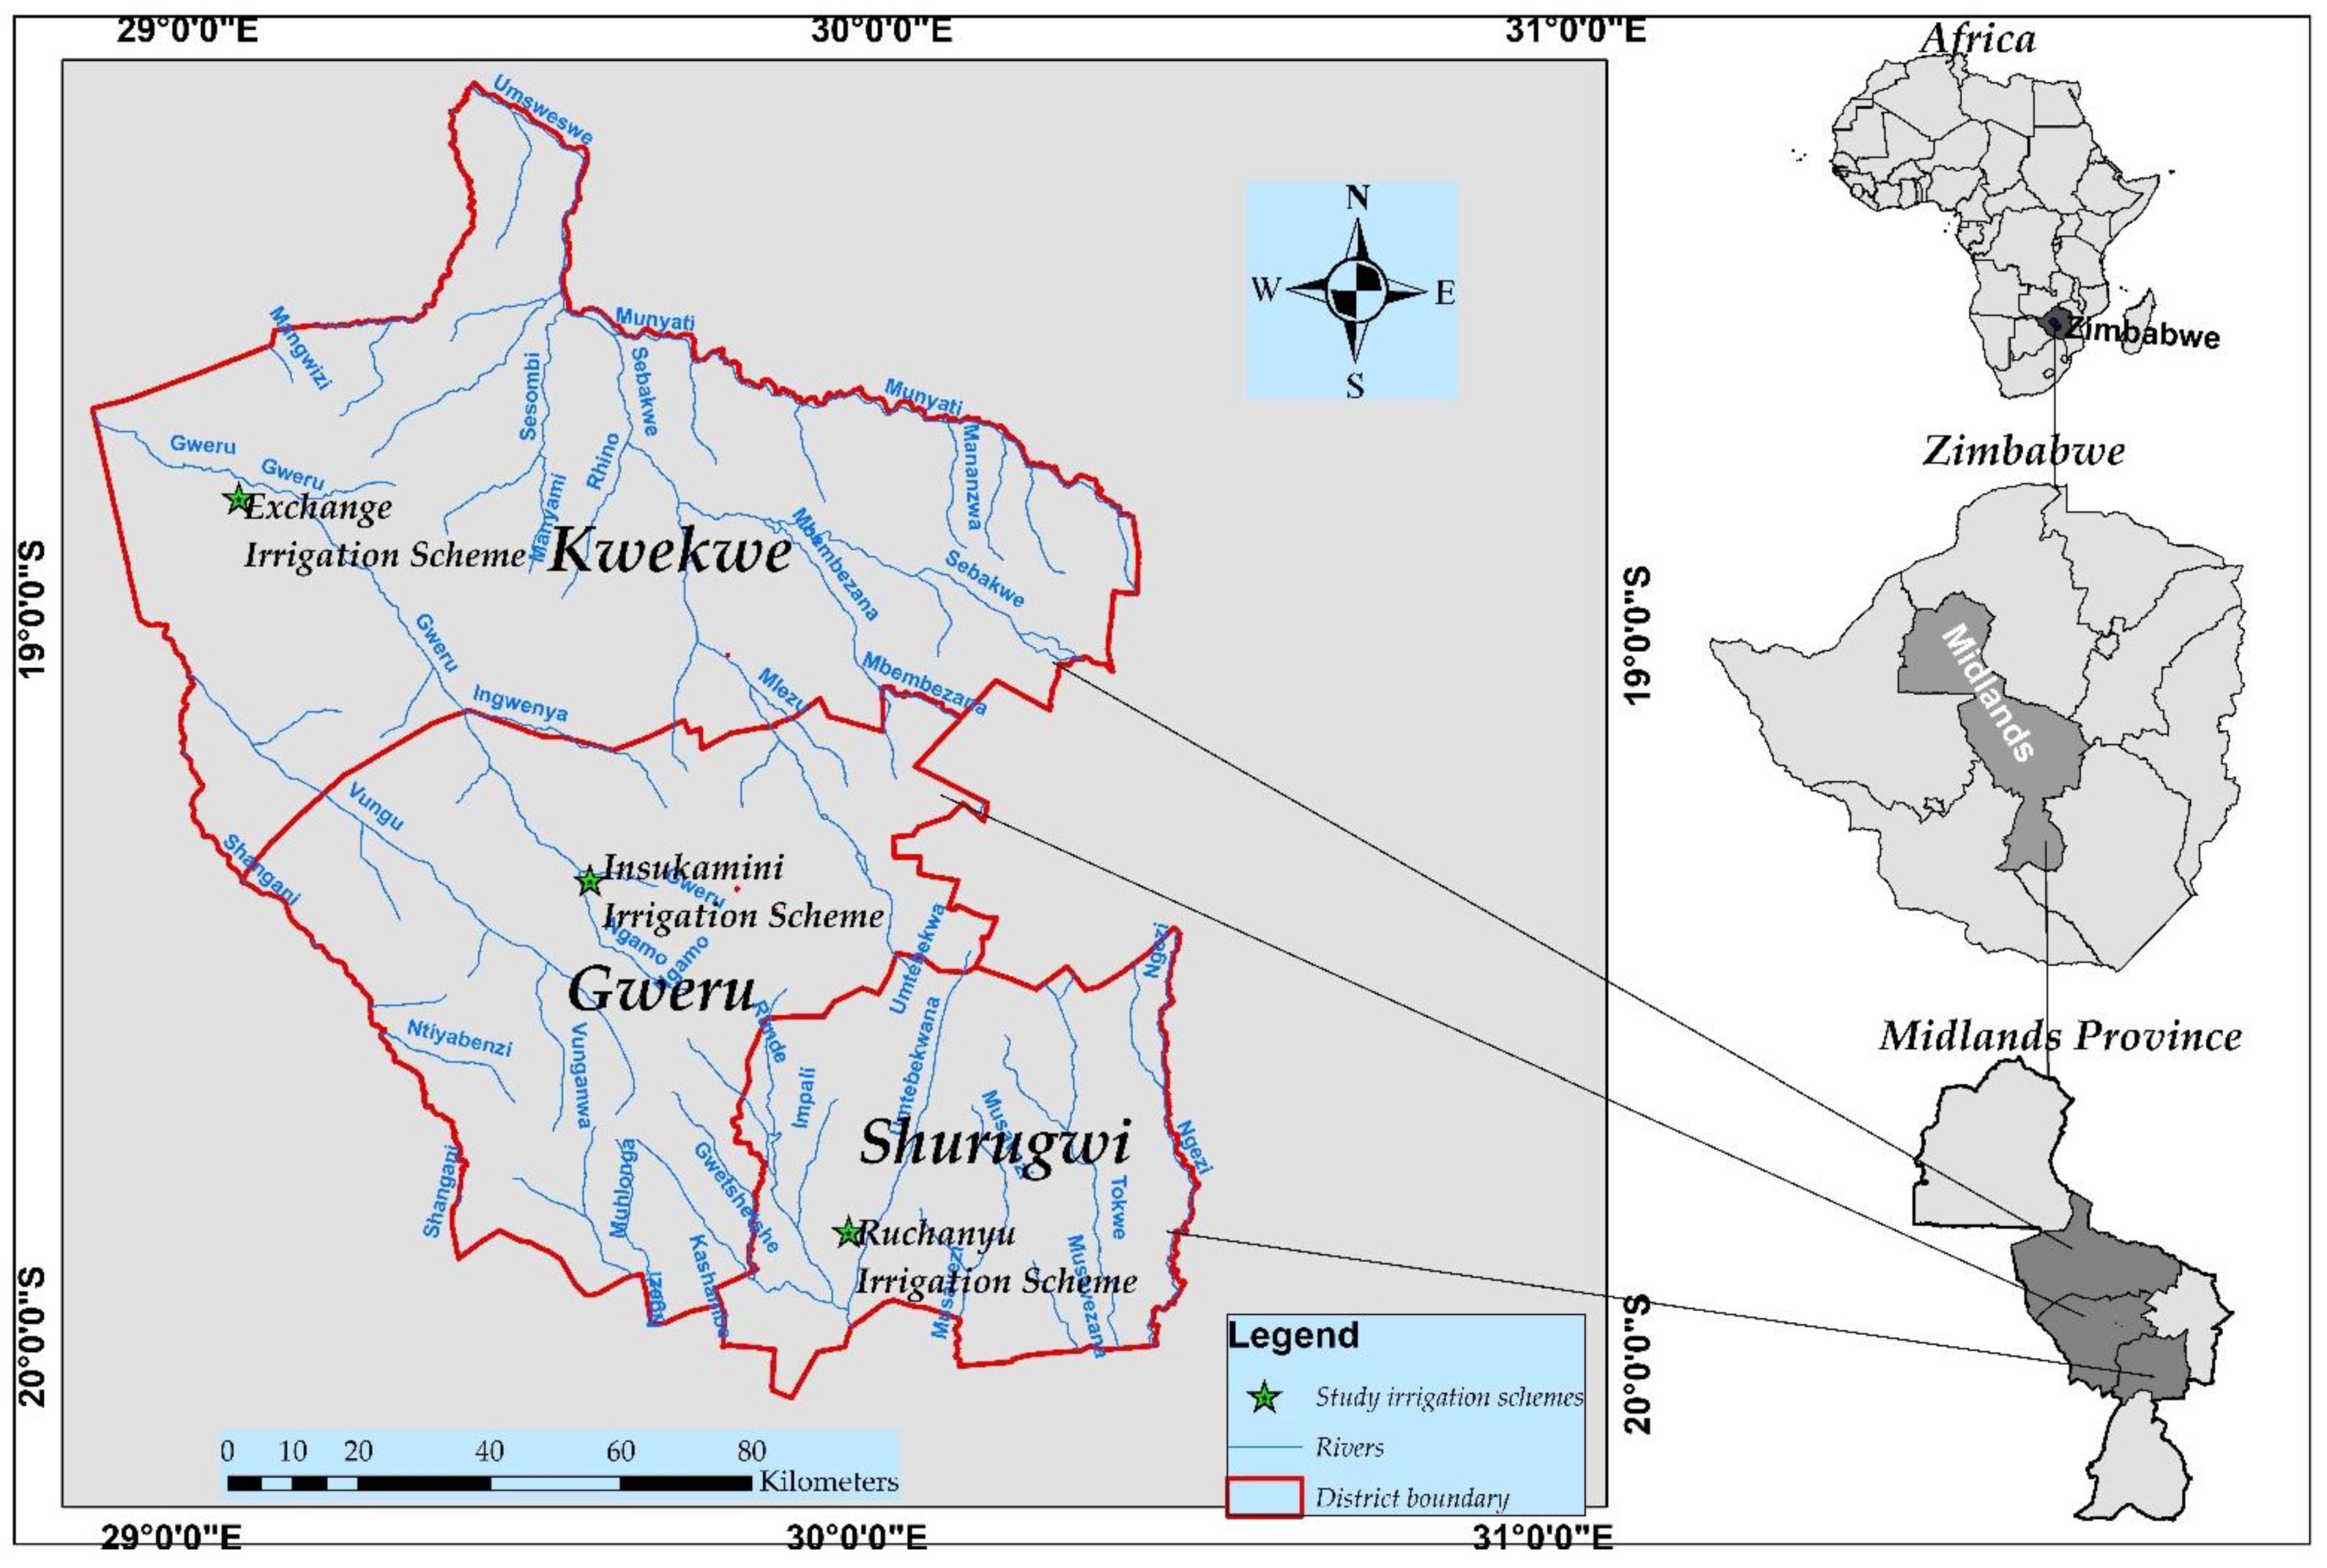
To address the objectives of this study, we assessed three SISs in the Midlands province of Zimbabwe (Figure 1). The Midlands province is among the top three provinces with the highest number of SISs in Zimbabwe [41]. Moreover, of the SISs in the province, only slightly above half (about 53%) are reportedly functional [41]. In addition, irrigation schemes in the province are presumably vulnerable to climate change [42]. Therefore, this study will be of significant reference to the vulnerability of SISs in Zimbabwe and across the region to climate change.

Figure 1.
Map of the study area.
This study looked at three SISs. First, the Exchange irrigation scheme in Zhombe communal land, Silobela in Kwekwe District is around 60 km North-West of Kwekwe town and 80 km North-West of the provincial town of Gweru [43]. It has a total irrigable area of about 168.8 ha irrigated arable land, occupied by 982 scheme farmers. It is in agroecological Zone 4, which is characterised by semi-arid climatic conditions, with average rainfall ranging from 450–650 mm and an average temperature of 26 °C [44,45]. The soils are mainly clay loam with high fertility [43]. The Exchange irrigation scheme was developed in two phases; 56 ha were developed from 1973 and 111.8 from 1985 [46]. The scheme draws its water from the Exchange dam which is temporarily stored in a night storage reservoir. Concrete-lined channels are used to deliver water to the plots. The Exchange irrigation scheme uses a surface irrigation system to deliver water at an application rate of 90 mm per ha per 6 days cycle (0.9 mega litres per ha). Maize and sugar beans have a gross irrigation water requirement of 450 to 600 mm per ha (4.5–6 mega litres) [47]. The main crops grown are maize and sugar beans. The scheme has an average yield of 7 tonnes for maize, 1 tonne for winter sugar beans, and 1.2 tonnes for summer sugar beans [46]. However, the market does not favour high-value crops due to the extended distance from the nearest towns and poor road network [48].
Second is the Insukamini irrigation scheme in the Lower Gweru district is approximately 46 km North-West of the provincial town of Gweru. The scheme has a total irrigable area of about 41 ha, occupied by 125 scheme farmers. It is in agroecological Zone 4 and receives annual precipitation between 600–800 mm and an average temperature of 16 °C [49]. Its soils are characterised as sandy loam and clay loam. Farmers in the scheme grow a wide range of crops, including wheat, maize, peas, rape, sugar beans, onions, cabbages, tomatoes, and garlic [48]. The scheme was established in 1988 by the government of Zimbabwe through its funded national resettlement programme following the construction of the Insukamini dam by DANIDA in 1986 [49]. It draws its water from the Insukamini dam, which is delivered gravitationally via a 1.6 km long open concrete canal. The Insukamini irrigation scheme uses a surface irrigation system to deliver water at an application rate of 90 mm per 6 days cycle (0.9 mega litres per ha). Maize, wheat, and sugar beans have a gross irrigation water requirement of 450 to 600 mm per ha (4.5–6 mega litres) [48]. The scheme farmers attain an average yield of maize of 4.4 tonnes per hectare and yields of 1.9 tonnes for sugar beans [50]. Farmers in the Insukamini irrigation schemes market their crops mainly to Gweru and Bulawayo towns. They use various market channels, including hawkers, farmgate sales, Grain Marketing Board (GMB), shops, and urban deliveries [49].
The third is the Ruchanyu irrigation scheme in Shurugwi District nearly 29 km South-West of Shurugwi town. It has a total irrigable area of 27 ha operated by 85 scheme farmers. The scheme uses sprinkler irrigation technique. The scheme is in agroecological Zone 3 and it receives an average annual rainfall between 650–850 mm and an average temperature of 16 °C [43]. It was established in the early 1980s. The scheme uses engines to pump water from the Mutevekwi River, but its pumping is challenged by vandalism of irrigation equipment (water pumps) and regular power cuts [43]. Soils are fertile sandy loam soils. Farmers market their product on the farm gate and in Shurugwi town. The Ruchanyu irrigation scheme uses a sprinkler irrigation system to deliver water at an application rate of 90 mm per 6 days cycle (0.6 mega litres per ha). Maize, the major crop grown in the scheme, has a gross irrigation water requirement of 450 to 600 mm per ha (4.5–6 mega litres per ha) [48]. However, the yields are low (less than 2 tonnes per hectare) due to the challenges of pumping water.
2.2. Data Collection
The study used questionnaire surveys, Focus Group Discussions (FGDs), and Key Informant Interviews (KIIs) to collect data. We collected data on demographic, livelihood strategies, food, water, health, social networks, and natural disaster profiles for estimating LVI. The questions that were asked under each profile were based on existing literature on vulnerability analysis (Table S1). Nonetheless, we conducted a pilot study to determine the suitability of the questionnaire for the study. Random sampling was used to select households to be interviewed based on the homogeneity of the households in each scheme. A statistically significant sample of 317 households (192 from Exchange irrigation scheme, 88 from Insukamini irrigation scheme, and 37 from Ruchanyu irrigation scheme) was selected for the study (p ≤ 5%). The sample size stated above was considered for this study because it is moderately small and thus, yields stronger estimates [51,52]. We used the power test to determine the chances of a null hypothesis being rejected because it is false [51]. We used stratified random sampling to obtain a reasonable sample from each scheme. To attain the desired power of estimates, we considered a margin error of 5%, a confidence level of 95%, and the assumption of a response rate of 50%. We randomly selected 10–15 household heads for the FGDs to help understand vulnerability to climate change in SISs. Key informant interviews provide expert information about the challenges of climate change in SISs. Data on rainfall, minimum, and maximum temperatures were obtained from the Department of Metrological Services of Zimbabwe.
2.3. Data Analysis
The LVI-IPCC framework by Hahn et al. (2009) is the approach used for data analysis in this study. It was used to measure the vulnerability of each SIS to climate change and to compare the vulnerability of the schemes. It identifies the factors that contribute to the vulnerability of each scheme to climate change. The LVI score, which ranges from 0 (least vulnerable) to 1 (most vulnerable), was used. In this work, we adopted the vulnerability classes used by Thuy and Anh, (2021) [53], where LVI scores are classified into four categories: low (0–0.25), moderate (0.25–0.5), high (0.5–0.75), and very high (0.75–1). Similarly, we classified LVI-IPCC scores into the following categories: low (−1–−0.5), moderate (−0.5–0), high (0–0.5), and very high (0.5–1). Following previous work by UNDP (2007) [54], Equation (1), which is used when calculating life expectancy, was applied to standardize the different variables that were measured using different scales.
where is the original subcomponent value of area and and are the minimum and maximum value of the subcomponent, respectively. Equation (2) was used to produce the value of major components.
where is the value of major component d in area j, is the indexed value of subcomponent i, and n is the number of subcomponents in major component .
The values of the seven major components—Socio-Demographic Profile (SDP), Livelihood Profile (LP), Social Network (SN), Health (H), Food (F), Water (W), or Natural Disasters and Climate Variability (NDCV)—were used to calculate LVI using Equations (3) and (4).
Equation (3) can be expanded to Equation (4)
where is the livelihood vulnerability index of area j; is the weight of component d; and , , , , , , are the weighed values of SDP, LP, SN, H, F, W, and NDCV profiles, respectively.
2.4. IPCC Framework of Calculating LVI
Calculating LVI using Hahn et al.’s (2009) IPCC framework approach starts by combining seven major components of LVI into three contributing factors to LVI: exposure (E), sensitivity (S), and adaptive capacity (AC), as in Equation (5). Adaptive capacity is composed of Socio-Demographic Profile, Livelihood Strategies, and Social Networks; Sensitivity is quantified by Health, Food, and Water profiles; while exposure is made up of Natural Disasters and Climate Variability.
where —LVI for area j expressed using IPCC vulnerability framework approach; —calculated exposure score for area j; —calculated sensitivity score for area j; and —calculated adaptive capacity score for area j.
3. Results
The results of our analysis are presented in two sections. The first section makes a comparative and contrasting analysis of the livelihood vulnerability index of the three irrigation schemes using the seven major components and sub-components. The second section deals with LVI contributing factors and LVI-IPCC.
Comparing LVI among Schemes
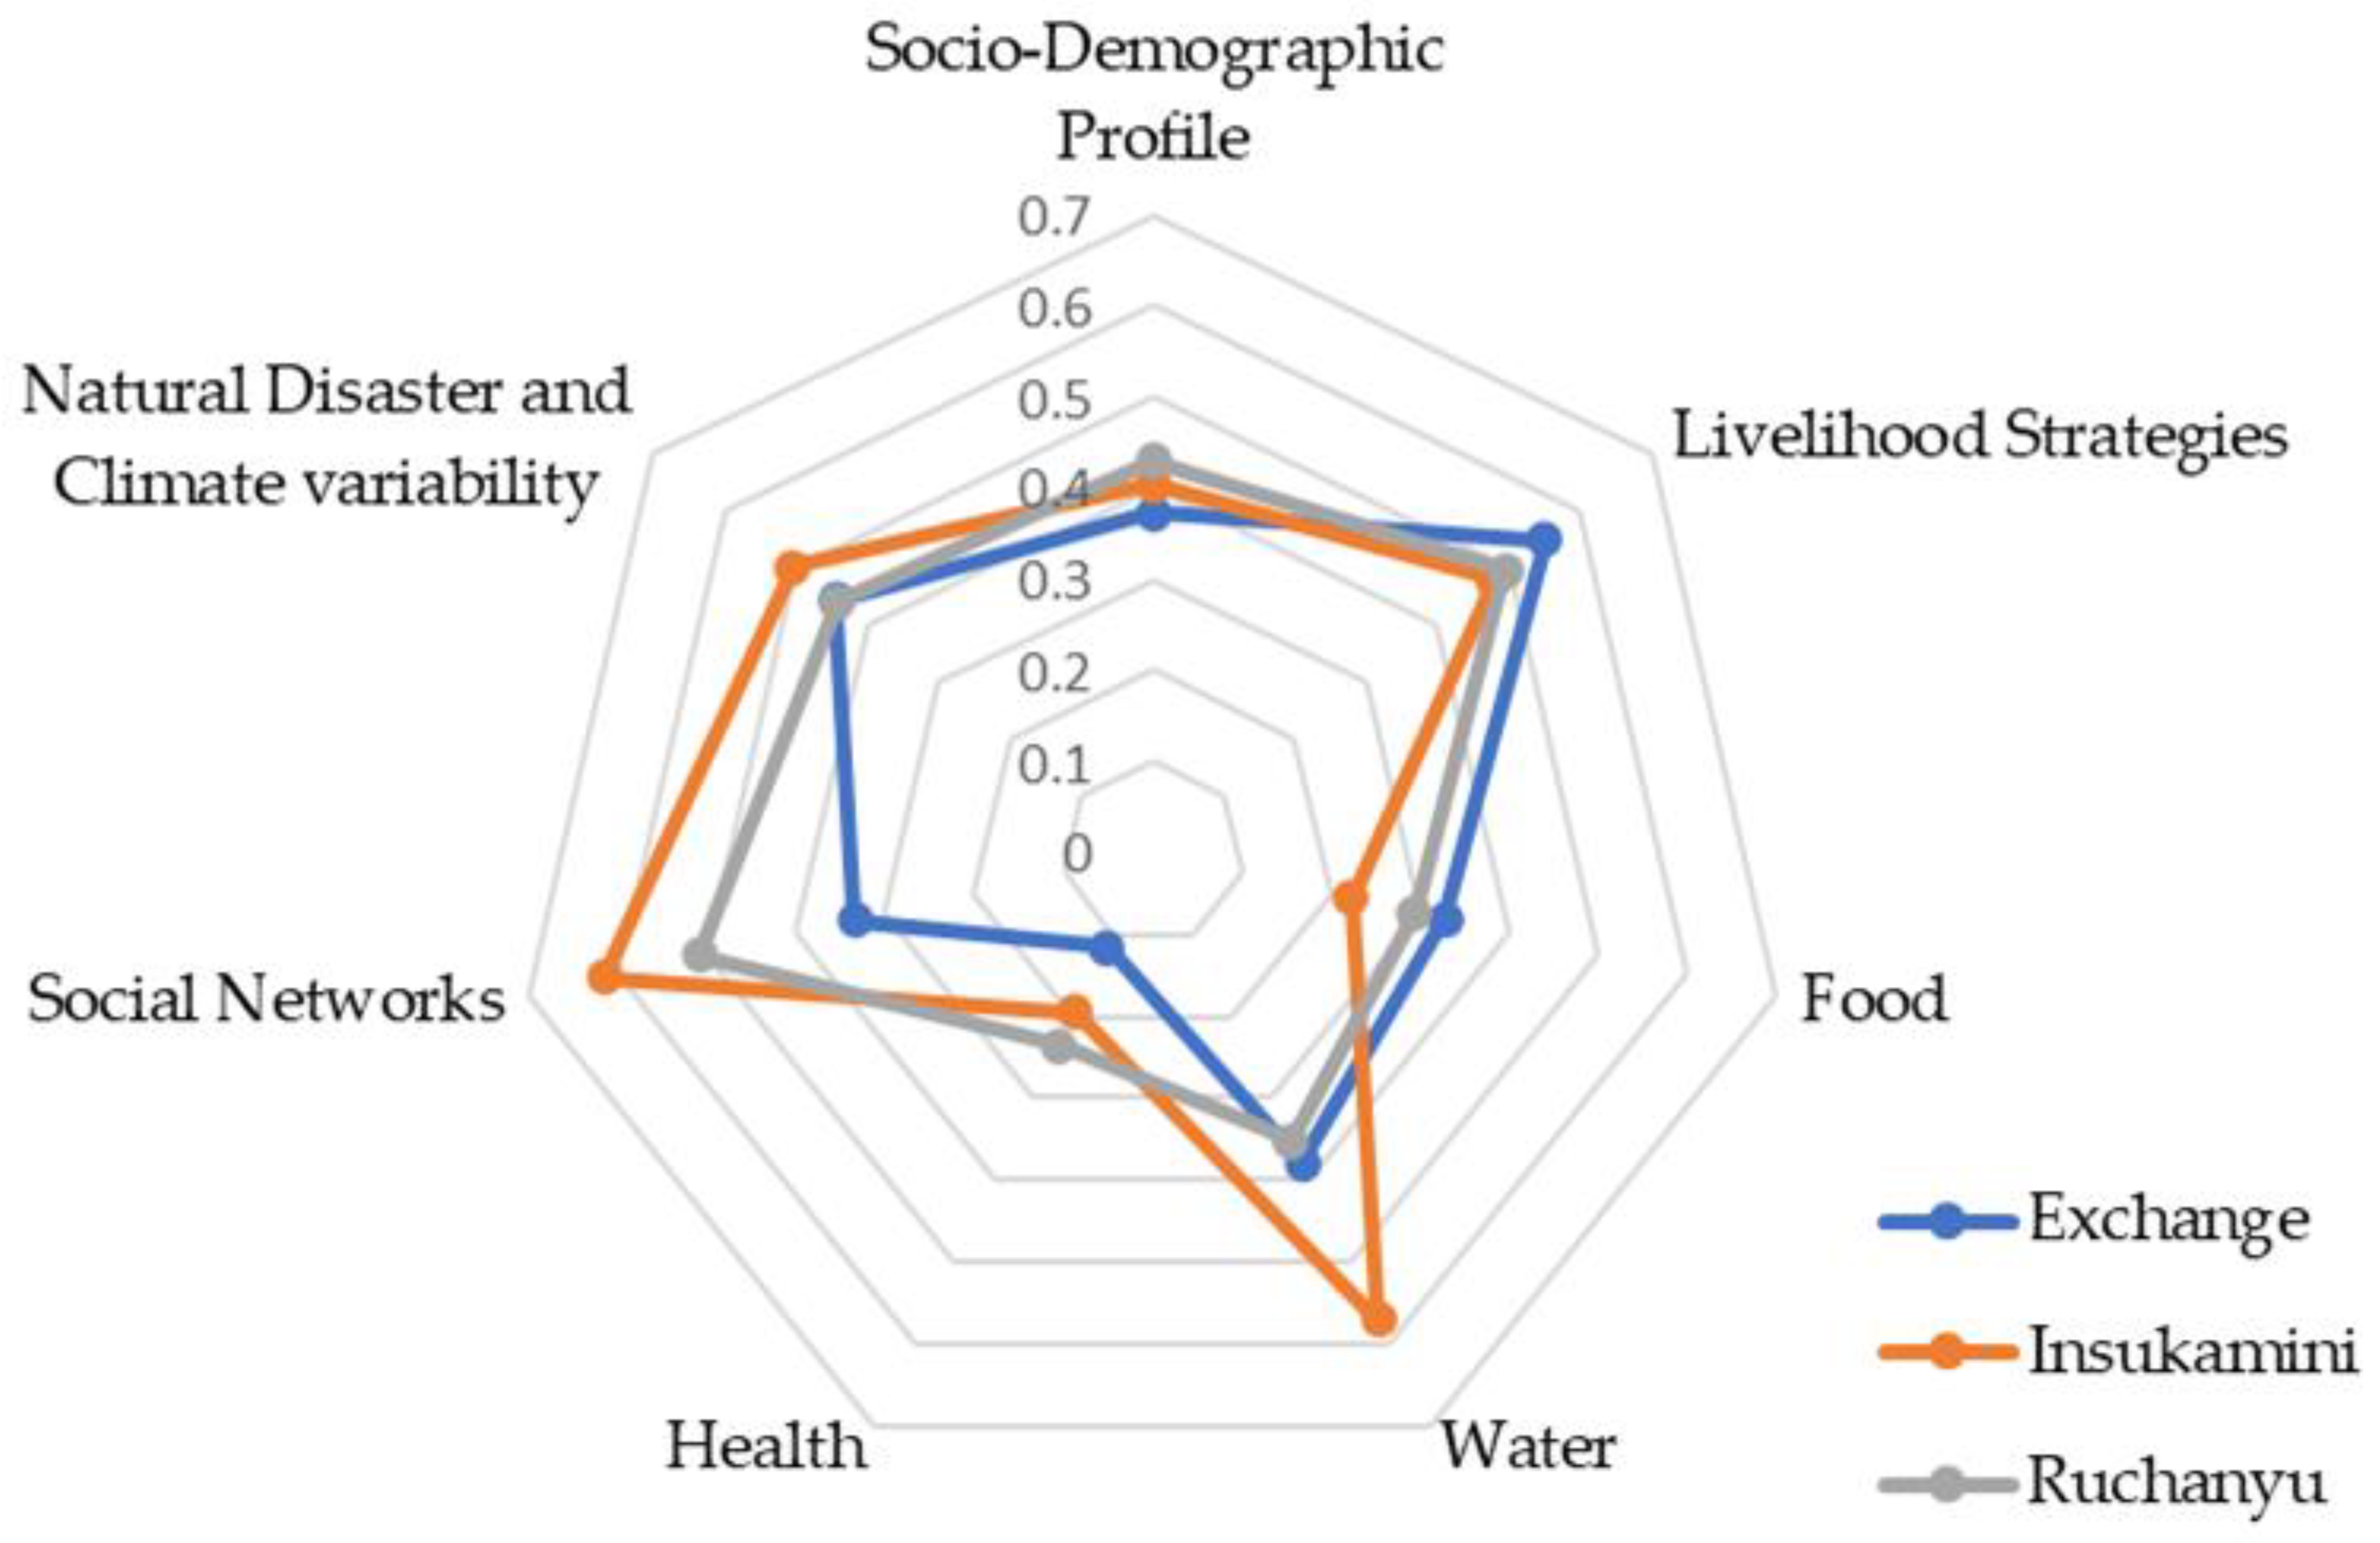
Figure 2 illustrates the LVI indices of the seven major components for the Exchange, Insukamini, and Ruchanyu irrigation schemes. Subsequently, Table 1 displays the indices of the sub-components of the LVI for each scheme. The results indicate that the dependency ratio was high among the three schemes as the number of orphans and aging household members are high. The female-headed households have a moderate vulnerability score in all schemes. The households headed by individuals without formal education have low vulnerability scores in all schemes. The majority of the household heads have attained at least a year of formal education.
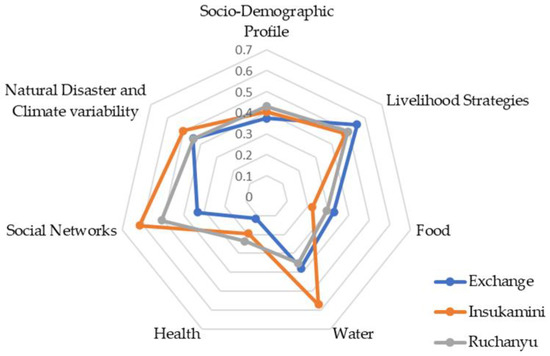
Figure 2.
Spider diagram of major components of the livelihood vulnerability of Exchange, Insukamini, and Ruchanyu irrigation schemes.

Table 1.
Sub-components, components, and LVI of Exchange, Insukamini, and Ruchanyu irrigation schemes.
Additionally, the households looking after orphans have a high vulnerability score in Ruchanyu, a moderate vulnerability score in Insukamini, and a low vulnerability score in Exchange. Insukamini has a high vulnerability score in relation to the age of household heads, whereas in Ruchanyu and Exchange, the vulnerability scores are moderate. Overall, the three schemes yielded a moderate vulnerability score on the socio-demographic profile index.
The households with members working in other communities have high vulnerability scores across the three schemes as youths in rural communities move to urban areas and neighbouring countries to seek employment. Furthermore, the households solely dependent on agriculture for their livelihoods have very high vulnerability scores in all three schemes. However, a low vulnerability score was attained in the three schemes for the livelihood diversification index. Most of the scheme farmers have various livelihood options: crafting, fishing, artisanal mining and gathering, trading wild fruits and wild insects. Ruchanyu has a high vulnerability score for livelihood strategies, while Exchange and Insukamini attained moderate vulnerability scores.
The receive-give ratio yielded very high vulnerability scores in all three schemes. However, all of them had moderate scores for the borrow-lend ratio. In addition, the households that have not received any assistance from the government and NGOs have a moderate vulnerability score in Insukamini but low scores in low Exchange and Ruchanyu.
The households dependent on the family farm for food have scored very high vulnerability scores for the three schemes, as scheme farmers primarily rely on the family farm for food. Generally, households in rural areas rely on the family farm for food. Households in the three schemes have low vulnerability scores for the number of months households struggle to find enough food for their families during the year. They rely on irrigation farming for food and have a culture to save food for the future season. Households in Exchange and Ruchanyu have high vulnerability scores in relation to crop diversification index compared to Insukamini, which recorded a low vulnerability score for this sub-component. Farmers in Exchange are limited to the production of maize and sugar beans for household consumptions. In addition, farmers in Ruchanyu face challenges accessing water due to pump breakdown, inability to pay electricity bills, and regular power cuts.
Moreover, the households that do not save harvested crops for consumption during the greater part of the year have low vulnerability scores in the three schemes. The households that do not save seeds have a moderate vulnerability score in Exchange but low scores in Insukamini and Ruchanyu. Generally, vulnerability scores of food component were moderate in Exchange and Ruchanyu but low in Insukamini.
Water conflicts have moderate vulnerability scores across all schemes in the study. The vulnerability score in relation to the average time to clean water source was high in Insukamini, moderate in Exchange, and low in Ruchanyu. A moderate vulnerability score of lack of access to a constant clean water supply was observed among the households in Insukamini compared to the other two schemes, which scored low vulnerability scores. The Insukamini dam regularly dries up during the summer season of the year. In relation to the water-related subcomponents, the vulnerability scores of water were moderate in Insukamini and Exchange but low in Ruchanyu. Ruchanyu has high water sensitivity in relation to irrigation infrastructure maintenance compared to Insukamini with a moderate score and Exchange with a low score. The vulnerability score of households not satisfied with water distribution in the scheme was moderate for the three schemes. Similarly, poor conflict resolution in schemes attained a moderate vulnerability score for the three schemes. However, the three schemes reported high vulnerability scores on the decline in irrigation water supply. Households not participating in water scheduling yielded higher vulnerability scores in Exchange and Insukamini and low scores in Ruchanyu. Insukamini has a higher vulnerability score for households not participating in water-related training, while Exchange and Ruchanyu attained moderate scores.
Vulnerability in relation to time to the nearest health facility has low vulnerability scores in the three schemes. A moderate vulnerability score was obtained in Ruchanyu for the percentage of households with chronically ill members, while Exchange and Insukamini have low scores. However, Insukamini and Ruchanyu have both reported moderate vulnerability scores for the percentage of people who were so sick two weeks prior to the survey, while Exchange reported a low score. Based on health-related sub-component, the three schemes recorded low vulnerability scores.
Insukamini has a very high vulnerability score for cooperative membership, while Ruchanyu has a high score and Exchange has a low score. The overall vulnerability scores of the social network component were high in Insukamini and Ruchanyu, while low in Exchange.
The percentage of households that did not receive warnings of pending natural hazards indicated a moderate vulnerability score in Insukamini and low scores in Ruchanyu and Exchange. The vulnerability score in relation to incidences of natural hazards (droughts and floods events) was high in Insukamini and moderate in Exchange and Ruchanyu. The percentage of livestock fatalities due to floods and droughts produced high vulnerability scores in the three schemes. The households that reported death or injury due to natural hazards reported low vulnerability scores in all schemes. The household members that reported a rise in drought incidences have very high vulnerability scores among the three schemes. The mean standard deviation of monthly rainfall was high among all schemes. In addition, the mean standard deviation of monthly average maximum daily temperature showed high vulnerability scores in all the schemes. Overall, Insukamini has a high vulnerability score of natural disasters and climate variability index, whereas Ruchanyu and Exchange recorded moderate scores.
All three schemes have moderate vulnerability scores for LVI. The results of major components are illustrated using a graphical diagram, with a scale that ranges from 0 (less vulnerable) to 1 (more vulnerable) (Figure 2). Figure 2 shows that Insukamini is more vulnerable in terms of social networks, water, and natural disasters and climate variability, while Exchange is more vulnerable in terms of livelihood strategies and food. Ruchanyu has a comparatively higher vulnerability in terms of socio-demographic profile and health.
Figure 3 below and Table S3 shows LVI contributing factors for Exchange, Insukamini, and Ruchanyu irrigation schemes.
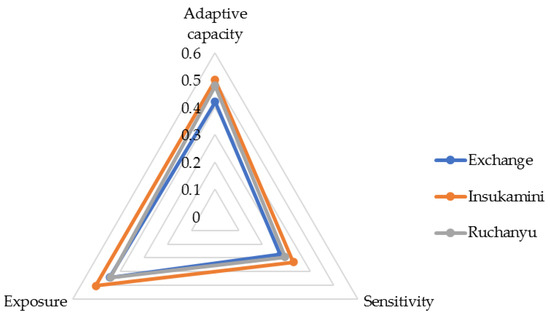
Figure 3.
Triangle diagram for contributing factors of LVI-IPCC.
4. Discussion
The use of indexed vulnerability analysis shows significant differences in the levels of vulnerability among the households in the three schemes (p ≤ 0.05). Recently, indexed vulnerability analysis has similarly found differences in vulnerability of communities in Bangladesh [55], Ghana [56], and Indonesia [57]. To better understand the sources of differences in vulnerabilities of the three schemes, we compared the three contributing factors to vulnerability: exposure, sensitivity, and adaptive capacity. Our results indicate that there were no significant differences in exposure among the three schemes (p ≥ 0.10). This revelation that shows that communities with the same exposure can have differences in vulnerabilities is consistent with literature that much of the vulnerability does not emerge from the sky [58]. The majority of the households in the schemes were affected by natural hazards such as droughts, cyclones, and floods.
Nevertheless, most of the farmers in the three schemes reported an increasing trend of droughts. It has been previously noted that schemes in Zimbabwe are facing increased water stress as drought worsens [40,59]. Droughts are among the disasters that have been reported to be on the rise in Zimbabwe due to climate change [39,60]. Vulnerability indices in Table 1 show that a high percentage of households in the three schemes lost their livestock due to droughts. Previous studies have reported a loss of livestock during the drought periods of 1992 [61,62]. Although the differences in exposure to climate change are high, households in Insukamini indicated limited access to natural disaster warnings. Early warnings of projected natural disasters and future weather patterns help households prepare, reduce, or prevent the impact of the climatic event [29], enabling scheme farmers to develop and adopt water use strategies during such seasons to meet their crop water needs. Consequently, there is no significant variation in natural disasters and climate among the households in the three schemes.
Nonetheless, we were cognisant of the existence of memory illusions when data are collected through toad science. Memory illusions refer to a situation where participants may exaggerate climate trends due to recent climate extremes experienced in an area [63]. The recent occurrence of climate extremes may mask the perception of people who tend to remember the recent extremes [64]. To overcome the problem of memory illusion, standardising findings using the existing recorded trends is necessary. Most households in Insukamini recorded the highest number of members injured or died due to natural disasters. Most of the participants in Insukamini reported a rise in incidences of droughts over the years.
Climate data from Thornhill Airbase in Gweru were used as a standard for the three study sites since it was the only one containing rainfall and temperature data that have acceptable gaps. In Zimbabwe, meteorological trend analysis is hampered by inadequate weather network coverage. For example, at least two-thirds of the 64 synoptic stations in Zimbabwe are situated in the central watersheds, while there remains inadequate network coverage in arid and semi-arid regions of the country, where rainfall is highly erratic [65]. The limited coverage of rural communities makes tracking the impact of climate change in rural areas notoriously challenging and biased.
The sensitivity of the three schemes of the study significantly varies (p ≤ 0.05) due to the schemes’ variation of water and health components. However, the water challenges in Insukamini influence the scheme’s overall sensitivity, given that Ruchanyu, with significantly high vulnerability, has a lower sensitivity index than Insukamini. Water is an essential source of livelihood in SISs in Zimbabwe; nevertheless, water conflicts are prevalent in smallholder irrigation farming across the country due to the systems’ common pool resource nature and imbalance of demand and supply of freshwater [66]. A moderate vulnerability score of water conflicts resolution in the three schemes reflects limited water access. Nonetheless, households in Insukamini are relatively more vulnerable regarding water (p ≤ 0.01) due to higher distances to clean water sources and scarcity of water during dry seasons of the year. A majority of the farmers in Insukamini and Exchange travel long distances to the nearest water source during the dry season. On average, households in Exchange and Insukamini travel at least double the distance households in Ruchanyu travel to the water source. However, distance to water sources signifies water insecurity, diminishes available labour force, contributes to poor health, and worsens women’s burden, given their primary responsibility of collecting water [67]. Water becomes scarcer during the year’s dry season, compromising Insukamini households’ access to water for day-to-day use and irrigation purposes.
Similarly, the involvement of most households in the Insukamini irrigation scheme in commercial market gardening of vegetables that demand a constant water supply makes water supply challenges more visible than in other schemes [68]. Improving water security is likely to improve the livelihoods of households in schemes since it is closely associated with food security, health security, and other livelihood options [69]. However, water scarcity is projected to be more severe with climate change, worsening water stress and water shortages [69].
Households in Ruchanyu reported poor participation in irrigation infrastructure maintenance. This study confirms the findings by Mutambara and Munodawafa (2014) that scheme farmers using sprinkler irrigation systems have limited participation in operation and maintenance. Limited knowledge of basic operation and maintenance of pumps and sprinkler systems have been cited as the basic limitation to scheme infrastructure maintenance. Challenges in conflict resolution might be related to satisfaction with water distribution since they both have a moderate vulnerability index in the three schemes. Conflicts affect the development of the scheme [70]. The high vulnerability score for the decrease in irrigation water supply reported in the three schemes is related to climate change and increased demand for water from other sectors. In Exchange and Insukamini, the scheme committees are responsible for the watering schedule.
Although households in the Exchange irrigation scheme reported a longer average time to the nearest clinic, households in Ruchanyu are more vulnerable regarding the health index (p ≤ 0.05). The study shows that it takes almost twice as much time to reach the nearest healthcare centre in Exchange compared to Insukamini and Ruchanyu. This reflects lack of access to health services. Ruchanyu has reported relatively more households with chronically ill members and more households with members who have been sick in the past two weeks. The higher prevalence of chronic illness and ill members in the past two weeks relates to the higher proportion of the working-age population involved in artisanal mining [71,72]. The dominance of artisanal mining leads to increased prevalence of infectious diseases such as the HIV/AIDS pandemic in Shurugwi following increased moral decay as prostitutes and drug abusers invade the area [71]. Mutambara and Munodawafa (2014) postulate that diseases including HIV/AIDS makes smallholder irrigation farming more vulnerable to shocks such as climate change. HIV/AIDS hit the rural population hard in the late 1990s, making households more vulnerable [73]. However, basing vulnerability analysis on current illness incidences undermines the harm caused by previous health incidences in current and future vulnerability to climate change.
The households in the three schemes have moderate vulnerability scores for food component with minimal differences (p ≥ 0.10). The majority of households in the three schemes of the study depend on the family farm for food. Households that primarily depend on the family farm for food have lesser scope to diversify their livelihood [74]. However, the number of months without food was low as the majority of the households save food. The study reveals that the majority of the households in the schemes save seed. Our findings support findings by Moyo et al. (2017) that most scheme farmers depend on retained seed that is poor yielding and disease-prone, making them more vulnerable to climate change. Households in the three schemes practice diversified farming since vulnerability based on crop diversification is low. High diversification index could be a strategy to adapt to climate change [73].
Variation in adaptive capacity among the three schemes was attributed to their significant differences in socio-demographic profiles, livelihood strategies, and social network components. Households in the three schemes have a high dependency ratio, and this translates to a lower active working population than minors and aging household members compared to Insukamini and Exchange. Our findings concur with other findings in rural areas in Zimbabwe, where the dependency ratio was found to be high [75,76]. The higher dependency ratio in Ruchanyu was attributed to higher numbers of orphans compared to the other two schemes. This implies that a smaller sized labour force will actively engage in minimum livelihood activities. This is worsened by the need to divert their labour for the dependent household members [75]. Households with a larger labour force have a higher affinity for engaging in multiple livelihood activities [77]. High dependency ratio may likely contribute to households’ financial exclusion in the Ruchanyu irrigation scheme, affecting their ability to participate in economic activities fully and challenging their adaptation to climate change [78]. Such findings suggest that a high dependency ratio diminishes household income. However, a high dependency ratio and large numbers of households with orphans in Ruchanyu are attributed to a significantly higher vulnerability index of socio-demographic profile (p ≤ 0.10).
Nonetheless, minors and aging people in rural areas of Zimbabwe are frequently involved in household working, contributing to household income and food access [67]. A high dependency ratio worsens the multi-faceted responsibilities of women who primarily provide labour in schemes [50]. There were moderate female-headed households among the three schemes of the study. This study supports the results that female household heads who own plots in SISs actively participate in scheme farming [49]. Gender influences farming decisions as women have limited influence and resources to make crucial decisions in response to the impacts of climate change [77]. The gender of the household head also has implications for the inequality of land allocation [77]. Vulnerability to climate change and variability is gendered and socially constructed [50]. Women in rural areas face more challenges than their male counterparts because of their roles in societies that are more sensitive to climate change [68]. Child-rearing activities and household duties limit female household heads from exploring potential livelihood opportunities [79]. However, the majority of female household heads are not married. Makate et al. (2019) postulate that marital status signifies the family system’s strength, affecting decision-making, adoption of technology, productivity, and land use. In all the schemes, the majority of household heads have attained formal education with an average of 8.9 years; hence, integrating technology to adapt to climate change is likely to face minimum challenges. Formal education better positions them to access information, make better decisions, use effective land, embrace technologies and techniques, access support from more comprehensive sources and more livelihood strategies, and adapt to climate change [28,77]. However, the vulnerability index of the socio-demographic index is significantly higher in Ruchanyu due to the high dependency ratio and the high number of households with orphans.
Households in the three schemes have a high percentage of households with members working outside the scheme community. Members outside the irrigation communities improve the food security of their households through the provision of remittances [80]. Previous studies noted that the majority (76.7%) of Zimbabwean youth migrate from rural areas to foreign countries and they send remittances to their place of origin to reduce potential vulnerability [81]. The households in the three schemes solely depend on agriculture for their livelihood since they all attained a very high vulnerability score for dependency on agriculture. The results from this study support previous research findings that majority of the households in rural areas of Zimbabwe directly depend on agriculture for their livelihoods [19]. Primary dependency on agriculture implies that scheme farmers are more prone to climate change-induced disasters. Despite the three sub-components of livelihood strategies within the same vulnerability scores, Exchange was significantly more vulnerable in terms of livelihood strategies (p ≤ 0.01).
Limited horizontal and vertical linkages among the communities in Insukamini have resulted in significantly high vulnerability in relation to social networks (p ≤ 0.01). Reliable horizontal and vertical linkages strengthen the structural and functional relationships in an institution and beyond, improve institutional resilience, bond and bridge social capital, and create a space of exchange [82]. The engagement of farmers in Insukamini with government and NGO programs was found to be very low compared to the other two schemes. Findings from this study support the findings by Mutambara and Munodawafa (2014) that government and NGO participation is dominant to other groups of farmers, disadvantaging others. Government and NGOs were emulated for providing support to farmers in rural areas. Many households in Exchange reported the ongoing participation of the Smallholder Irrigation Revitalization Programme (SIRP) in the maintenance of scheme infrastructure. Their limited engagement with government and NGOs may relate to commercial-oriented production, hence, limited reliance on handouts. Similarly, their participation within the community through resource sharing and engagement in cooperatives is still at its infant level.
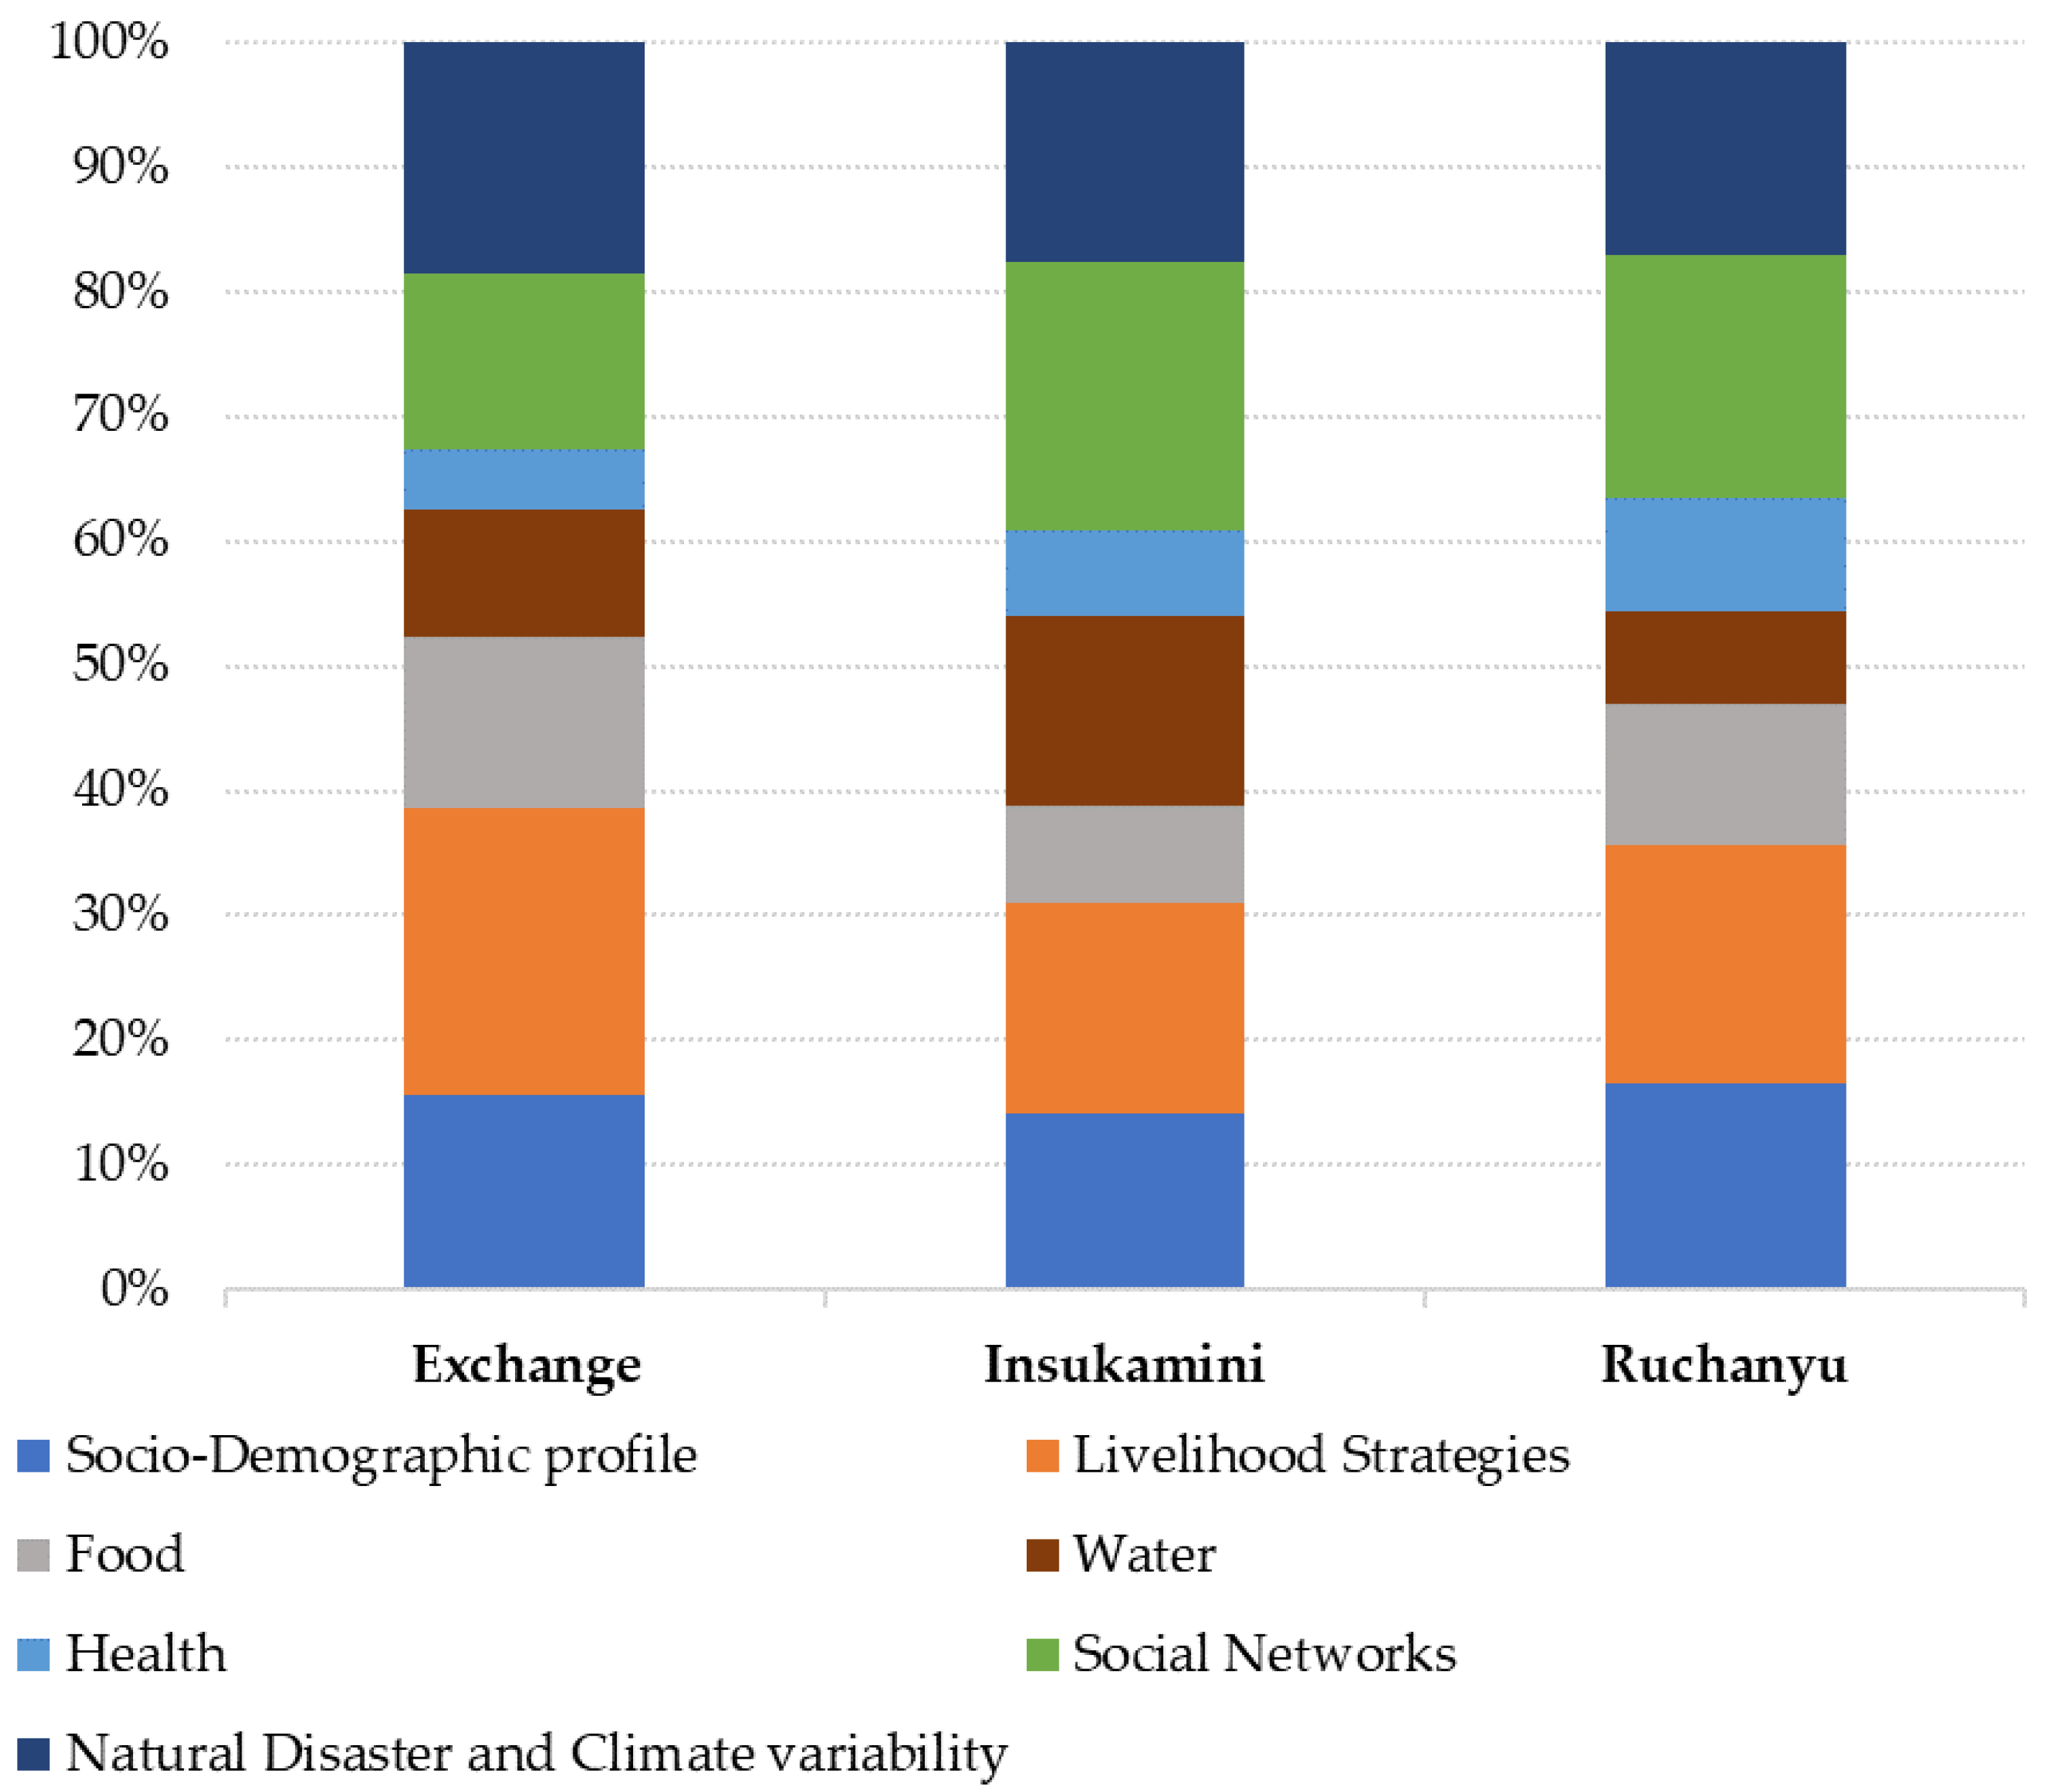
Figure 4 shows the major components contributing to livelihood vulnerability of communities in the Exchange, Insukamini, and Ruchanyu irrigation schemes. Figure 4 reflects that communities in the Exchange irrigation scheme are more vulnerable to livelihood strategies, natural disasters and climate variability, socio-demographic profile, social networks, and food. In contrast, in Insukamini, they are more vulnerable to social networks, natural disasters and climate variability, livelihood strategies, social demographic profile, and water. Furthermore, communities in Ruchanyu are more vulnerable to social networks, livelihood strategies, socio-demographic profiles, natural disasters, and climate variability.
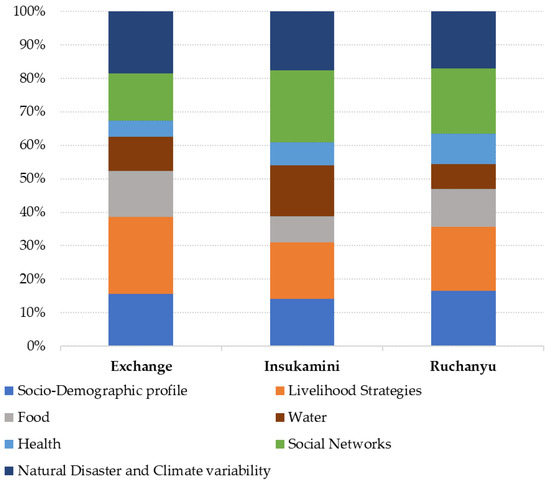
Figure 4.
Major components contributing to vulnerability of communities in Exchange, Insukamini, and Ruchanyu irrigation schemes.
Given that SISs grow different crops does not mean that growing crops from the least vulnerable scheme will solve the situation of the most vulnerable scheme. As illustrated in Figure 4, the main influencing factors to vulnerability in Insukamini and Ruchanyu are social networks, while in Exchange are livelihood strategies. Social networks should be prioritized in Insukamini and Ruchanyu irrigation schemes due to their higher severity compared to other components. Livelihood strategies should be prioritized in Exchange due to its higher severity compared to other components. The focus area for development varies from one scheme to another. Focusing development and innovation on the key profile in each scheme will likely be an effective way of improving other profiles, given a close interconnection of the profiles and their subcomponents.
IPCC Framework of Calculating LVI
Households in Insukamini have significantly high indices of adaptive capacity and sensitivity (Table S2). However, the LVI-IPCC score for Insukamini was significantly higher than that of households in Ruchanyu and Exchange. This implies that the Insukamini irrigation scheme is overall more vulnerable to climate change and variability than the Ruchanyu and Exchange irrigation schemes. Considering that exposure was not significantly different, sensitivity and adaptive capacity significantly contribute to the variation in vulnerability to climate change among the three schemes. The possibility of reducing vulnerability to climate change should be through improving adaptive capacity and consequently addressing the sensitivity of the scheme communities. The dependency of the scheme households on the farm as a primary source of food is a significant setback in the face of increased water stress in irrigated agriculture due to climate change [75]. Livelihood diversifying with both agricultural and non-agricultural activities will improve households’ adaptation to the impacts of climate change.
Given that most household heads have attained formal education, their potential to adapt to innovations and livelihood options is very high. However, most of the farmers in the schemes are aged; hence, their likelihood to venture into new livelihood options is likely to be limited by their advanced age, which challenges coping with the rapidly changing technologies whenever needed. In addition, a generally high dependency ratio robs the farmers of potential investment income given that most of them also have an additional responsibility of caring for orphans.
5. Conclusions
This paper uses the LVI-IPCC to understand the vulnerability to climate change of households in SISs. This assessment is critical to understand the vulnerability to climate change of SISs in Zimbabwe and to develop a tailor-made intervention to make households in SIS more sustainable in the face of climate change. Our results indicate that households in the Insukamini irrigation scheme are more vulnerable to climate change and variability. Natural disasters and climate variability, social networks, and water security contribute to high vulnerability in Insukamini irrigation scheme. The LVI-IPCC shows that households in the Insukamini irrigation scheme have a higher vulnerability to climate change than those in Exchange and Ruchanyu. Interventions to address vulnerability to climate change in Insukamini should prioritize strengthening social networks, improving water security, and raising awareness of pending natural hazards and future weather trends. There is a need to ensure that disseminating early warning information of natural disasters is carried out timeously, particularly in the Insukamini irrigation scheme. Broadcasting climate information using SMSs, radio, and TVs is wide-ranging and thus, unlikely to address the needs of a specific area. The role of extension workers of disseminating natural disaster and weather information must be strengthened as farmers tend to be more reliant on them for a wide range of information.
Supplementary Materials
The following are available online at https://www.mdpi.com/article/10.3390/su131810023/s1, Table S1: Variable selection for LVI-IPCC. Table S2: LVI sub-component values, minimum and muximum for Exchange, Insukamini and Ruchanyu. Table S3: Contributing factors to LVI-IPCC.
Author Contributions
Conceptualisation, L.M.; methodology, L.M. and R.M.; software, L.M.; validation, R.M.; formal analysis, L.M.; investigation, L.M. and R.M.; resources, P.L.M.; data curation, L.M.; writing—original draft preparation, L.M.; writing—review and editing, L.M. and R.M.; visualisation, L.M.; supervision, R.M. and P.L.M.; project administration, R.M. and P.L.M.; funding acquisition, P.L.M. All authors have read and agreed to the published version of the manuscript.
Funding
This research was funded by South Africa’s National Research Foundation (NRF), grant number 86893 for funding the study and data collection.
Institutional Review Board Statement
The study was conducted according to the guidelines of the Declaration of Helsinki, and approved by the Institutional Review Board of University of KwaZulu-Natal (HSSREC/00003196/2021).
Informed Consent Statement
Informed consent was obtained from all subjects involved in the study.
Data Availability Statement
Data available on request due to restrictions.
Acknowledgments
The authors acknowledge AGRITEX Management in the Midlands Province (headed by Magwenzi) for their support on logistical arrangements and providing technical information about the three schemes during the study. We would also like to thank the extension workers and farmers in Exchange, Insukamini and Ruchanyu irrigation schemes for their patience in responding to the questionnaire. We also acknowledge the enumerators who worked relentlessly during the survey period.
Conflicts of Interest
The authors declare no conflict of interest. The funders had no role in the design of the study; in the collection, analyses, or interpretation of data; in the writing of the manuscript, or in the decision to publish the results.
References
- Mavhura, E.; Manatsa, D.; Mushore, T. Adaptation to drought in arid and semi-arid environments: Case of the Zambezi Valley, Zimbabwe. Jàmbá J. Disaster Risk Stud. 2015, 7, 1–7. [Google Scholar] [CrossRef] [PubMed] [Green Version]
- Mukwada, G.; Manatsa, D. Is climate change the Nemesis of rural development? An analysis of patterns and trends of Zimbabwean droughts. In Climate Change, Extreme Events and Disaster Risk Reduction; Springer: Berlin/Heidelberg, Germany, 2018; pp. 173–182. [Google Scholar]
- Leal Filho, W.; Balogun, A.-L.; Olayide, O.E.; Azeiteiro, U.M.; Ayal, D.Y.; Muñoz, P.D.C.; Nagy, G.J.; Bynoe, P.; Oguge, O.; Toamukum, N.Y. Assessing the impacts of climate change in cities and their adaptive capacity: Towards transformative approaches to climate change adaptation and poverty reduction in urban areas in a set of developing countries. Sci. Total Environ. 2019, 692, 1175–1190. [Google Scholar] [CrossRef] [PubMed]
- Chagutah, T. Climate Change Vulnerability and Adaptation Preparedness in Southern Africa: Zimbabwe Country Report; Heinrich Böll Stiftung Southern Africa: Cape Town, South Africa, 2010. [Google Scholar]
- Perez, C.; Jones, E.; Kristjanson, P.; Cramer, L.; Thornton, P.K.; Förch, W.; Barahona, C.A. How resilient are farming households and communities to a changing climate in Africa? A gender-based perspective. Glob. Environ. Chang. 2015, 34, 95–107. [Google Scholar] [CrossRef] [Green Version]
- Kotir, J.H. Climate change and variability in Sub-Saharan Africa: A review of current and future trends and impacts on agriculture and food security. Environ. Dev. Sustain. 2011, 13, 587–605. [Google Scholar] [CrossRef]
- Davis, C.L.; Vincent, K. Climate Risk and Vulnerability: A Handbook for Southern Africa; CSIR: Pretoria, South Africa, 2017. [Google Scholar]
- Kula, N.; Haines, A.; Fryatt, R. Reducing vulnerability to climate change in sub-Saharan Africa: The need for better evidence. PLoS Med. 2013, 10, e1001374. [Google Scholar] [CrossRef] [Green Version]
- Bhatasara, S. Rethinking climate change research in Zimbabwe. J. Environ. Stud. Sci. 2017, 7, 39–52. [Google Scholar] [CrossRef]
- Simba, F.; Chikodzi, D.; Murwendo, T. Climate change scenarios, perceptions and crop production: A case study of Semi-arid Masvingo province in Zimbabwe. J. Earth Sci. Clim. Chang. 2012, 3, 2. [Google Scholar]
- IPCC. IPCC WGII AR5 Chapter 22. Africa; IPCC: Geneva, Switzerland, 2014. [Google Scholar]
- Mpambela, M.; Mabvurira, V. Effects of climate change and their indelible impact on social work profession in Zimbabwe. Afr. J. Soc. Work. 2017, 7, 30–35. [Google Scholar]
- Brown, D.; Chanakira, R.R.; Chatiza, K.; Dhliwayo, M.; Dodman, D.; Masiiwa, M.; Muchadenyika, D.; Mugabe, P.; Zvigadza, S. Climate Change Impacts, Vulnerability and Adaptation in Zimbabwe; International Institute for Environment and Development London: London, UK, 2012. [Google Scholar]
- Manyeruke, C.; Hamauswa, S.; Mhandara, L. The effects of climate change and variability on food security in Zimbabwe: A socio-economic and political analysis. Int. J. Humanit. Soc. Sci. 2013, 3, 270–286. [Google Scholar]
- World Bank. Zimbabwe: Agriculture Sector Disaster Risk Assessment; World Bank: Washington, DC, USA, 2020. [Google Scholar]
- Simba, F.; Matorevhu, A.; Chikodzi, D.; Murwendo, T. Exploring Estimation of Evaporation in Dry Climates Using a Class ‘A’Evaporation Pan. Irrig. Drain. Sys Eng. 2013, 2, 2. [Google Scholar]
- ZIMSTAT. Population Projections Thematic Report; ZIMSTAT: Harare, Zimbabwe, 2016. [Google Scholar]
- Green, E. Innovations in Poverty Eradication in Zimbabwe. Available online: https://borgenproject.org/innovations-in-poverty-eradication-in-zimbabwe/ (accessed on 27 May 2021).
- Chanza, N.; Gundu-Jakarasi, V. Deciphering the climate change conundrum in Zimbabwe: An exposition. In Global Warming and Climate Change; IntechOpen Limited: London, UK, 2020. [Google Scholar]
- World Bank. World Population Prospects 2019; World Bank: Washington, DC, USA, 2019. [Google Scholar]
- Bhaga, T.D.; Dube, T.; Shekede, M.D.; Shoko, C. Impacts of climate variability and drought on surface water resources in sub-saharan Africa using remote sensing: A review. Remote Sens. 2020, 12, 4184. [Google Scholar] [CrossRef]
- Thomalla, F.; Downing, T.; Spanger-Siegfried, E.; Han, G.; Rockström, J. Reducing hazard vulnerability: Towards a common approach between disaster risk reduction and climate adaptation. Disasters 2006, 30, 39–48. [Google Scholar] [CrossRef]
- Adu, D.T.; Kuwornu, J.K.; Anim-Somuah, H.; Sasaki, N. Application of livelihood vulnerability index in assessing smallholder maize farming households’ vulnerability to climate change in Brong-Ahafo region of Ghana. Kasetsart J. Soc. Sci. 2018, 39, 22–32. [Google Scholar] [CrossRef]
- GoZ. Accelerated Irrigation Rehabilitation and Development 2021–2025; Ministry of Land Agriculture, Water and Rural Development; Government Printers: Harare, Zimbabwe, 2020.
- Hahn, M.B.; Riederer, A.M.; Foster, S.O. The livelihood vulnerability index: A pragmatic approach to assessing risks from climate variability and change—A case study in Mozambique. Glob. Environ. Chang. 2009, 19, 74–88. [Google Scholar] [CrossRef]
- Sarker, M.N.I.; Wu, M.; Alam, G.; Shouse, R.C. Livelihood vulnerability of riverine-island dwellers in the face of natural disasters in Bangladesh. Sustainability 2019, 11, 1623. [Google Scholar] [CrossRef] [Green Version]
- Sujakhu, N.M.; Ranjitkar, S.; He, J.; Schmidt-Vogt, D.; Su, Y.; Xu, J. Assessing the livelihood vulnerability of rural indigenous households to climate changes in Central Nepal, Himalaya. Sustainability 2019, 11, 2977. [Google Scholar] [CrossRef] [Green Version]
- Abeje, M.T.; Tsunekawa, A.; Haregeweyn, N.; Nigussie, Z.; Adgo, E.; Ayalew, Z.; Tsubo, M.; Elias, A.; Berihun, D.; Quandt, A. Communities’ livelihood vulnerability to climate variability in Ethiopia. Sustainability 2019, 11, 6302. [Google Scholar] [CrossRef] [Green Version]
- Amuzu, J.; Kabo-Bah, A.T.; Jallow, B.P.; Yaffa, S. Households’ livelihood vulnerability to climate change and climate variability: A case study of the Coastal Zone, the Gambia. J. Environ. Earth Sci. 2018, 8, 35–46. [Google Scholar]
- Simane, B.; Zaitchik, B.F.; Foltz, J.D. Agroecosystem specific climate vulnerability analysis: Application of the livelihood vulnerability index to a tropical highland region. Mitig. Adapt. Strateg. Glob. Chang. 2016, 21, 39–65. [Google Scholar] [CrossRef] [PubMed] [Green Version]
- Botero, D.G.; Salinas, A.B. Assessing Farmers’ Vulnerability to Climate Change: A Case Study in Karnataka, India; UAB Universitat Autonoma de Barcelona: Barcelona, Spain, 2013. [Google Scholar]
- Jiri, O.; Mafongoya, P.L. Managing vulnerability to drought and enhancing small holder farmers resilience to climate change risks in Zimbabwe. In Handbook of Climate Change Resilience; Springer Nature: Cham, Switzerland, 2018; pp. 1–17. [Google Scholar]
- Jiri, O.; Mafongoya, P.L.; Chivenge, P. Building climate change resilience through adaptation in smallholder farming systems in semi-arid Zimbabwe. Int. J. Clim. Chang. Strateg. Manag. 2017, 9, 151–165. [Google Scholar] [CrossRef]
- Chanza, N. Limits to climate change adaptation in Zimbabwe: Insights, experiences and lessons. In Limits to Climate Change Adaptation; Springer: Berlin/Heidelberg, Germany, 2018; pp. 109–127. [Google Scholar]
- Utete, B.; Phiri, C.; Mlambo, S.S.; Muboko, N.; Fregene, B.T. Vulnerability of fisherfolks and their perceptions towards climate change and its impacts on their livelihoods in a peri-urban lake system in Zimbabwe. Environ. Dev. Sustain. 2019, 21, 917–934. [Google Scholar] [CrossRef]
- Gwimbi, P. Cotton farmers’ vulnerability to climate change in Gokwe District (Zimbabwe): Impact and influencing factors. JAMBA J. Disaster risk Stud. 2009, 2, 81–92. [Google Scholar] [CrossRef]
- Mavhura, E.; Manyena, B.; Collins, A.E. An approach for measuring social vulnerability in context: The case of flood hazards in Muzarabani district, Zimbabwe. Geoforum 2017, 86, 103–117. [Google Scholar] [CrossRef]
- Tawodzera, G. Vulnerability in crisis: Urban household food insecurity in Epworth, Harare, Zimbabwe. Food Secur. 2011, 3, 503–520. [Google Scholar] [CrossRef]
- Dube, K.; Nhamo, G. Vulnerability of nature-based tourism to climate variability and change: Case of Kariba resort town, Zimbabwe. J. Outdoor Recreat. Tour. 2020, 29, 100281. [Google Scholar] [CrossRef]
- Moyo, M.; Van Rooyen, A.; Moyo, M.; Chivenge, P.; Bjornlund, H. Irrigation development in Zimbabwe: Understanding productivity barriers and opportunities at Mkoba and Silalatshani irrigation schemes. Int. J. Water Resour. Dev. 2017, 33, 740–754. [Google Scholar] [CrossRef] [Green Version]
- IFAD. Smallholder Irrigation Revitalization Programme Final Project Design Report; IFAD: Harare, Zimbabwe, 2016. [Google Scholar]
- Mhembwe, S.; Chiunya, N.; Dube, E. The contribution of small-scale rural irrigation schemes towards food security of smallholder farmers in Zimbabwe. Jàmbá J. Disaster Risk Stud. 2019, 11, 1–11. [Google Scholar] [CrossRef]
- Nyamayevu, D.; Chinopfukutwa, G.L. An assessment of the reliability and adequacy of irrigation water in small holder irrigation schemes. Int. J. Sci. Eng. Res. 2018, 6, 14–19. [Google Scholar]
- Chanza, N.; Chigona, A.; Nyahuye, A.; Mataera-Chanza, L.; Mundoga, T.; Nondo, N. Diagnosing barriers to climate change adaptation at community level: Reflections from Silobela, Zimbabwe. GeoJournal 2019, 84, 771–783. [Google Scholar] [CrossRef]
- Chivandi, E.; Cave, E.; Davidson, B.C.; Erlwanger, K.H.; Moyo, D.; Madziva, M.T. Suppression of Caco-2 and HEK-293 cell proliferation by Kigelia africana, Mimusops zeyheri and Ximenia caffra seed oils. Vivo 2012, 26, 99–105. [Google Scholar]
- Chancellor, F.; Hide, J. Smallholder Irrigation: Ways Forward. In Guidelines for Achieving Appropriate Scheme Design; HR Wallingford: Oxford, UK, 1997; Volume 2. [Google Scholar]
- SEEDCO. Farmers’ Guide: Grain Crops. Harare. Available online: https://www.seedcogroup.com/zw/sites/default/files/Agronomy%20Manual.pdf (accessed on 30 July 2021).
- Hettige, H. When Do Rural Roads Benefit the Poor and How? An In-Depth Analysis Based on Case Studies; Asian Development Bank: Mandaluyong, Philippines, 2006. [Google Scholar]
- Mark, M. Crop diversity measurement at Dufuya gardens and Insukamini irrigation scheme in lower Gweru communal lands. J. Environ. Sci. Eng. B 2012, 1, 673–681. [Google Scholar]
- Matandare, M.A.; Matandare, T.O. Effects of water management practices on crop yields at Insukamini irrigation scheme, lower Gweru, Zimbabwe. Int. J. Sci. Eng. Res. 2015, 6, 45–48. [Google Scholar]
- Sadiq, M.A.; Kuwornu, J.K.; Al-Hassan, R.M.; Alhassan, S.I. Assessing maize farmers’ adaptation strategies to climate change and variability in Ghana. Agriculture 2019, 9, 90. [Google Scholar] [CrossRef] [Green Version]
- Dechartres, A.; Trinquart, L.; Boutron, I.; Ravaud, P. Influence of trial sample size on treatment effect estimates: Meta-epidemiological study. BMJ 2013, 346, f2304. [Google Scholar] [CrossRef] [Green Version]
- Thuy, N.; Anh, H. Determinants of livelihood vulnerability of smallholder tea farmers in Lam Dong province, Vietnam. IOP Conf. Ser. Earth Environ. Sci. 2021, 653, 012094. [Google Scholar] [CrossRef]
- UNDP. Human Development Reports; UNDP: New York, NY, USA, 2007. [Google Scholar]
- Mudasser, M.; Hossain, M.; Rahaman, K.R.; Ha-Mim, N.M. Investigating the climate-induced livelihood vulnerability index in coastal areas of Bangladesh. World 2020, 1, 149–170. [Google Scholar] [CrossRef]
- Williams, P.A.; Crespo, O.; Abu, M. Assessing vulnerability of horticultural smallholders’ to climate variability in Ghana: Applying the livelihood vulnerability approach. Environ. Dev. Sustain. 2020, 22, 2321–2342. [Google Scholar] [CrossRef]
- Yulisa, M.; Safrida, S.; Indra, I. Analysis of the livelihood vulnerability index for rice farmers households due to climate change in Aceh Besar district. Int. J. Multicult. Multireligious Underst. 2021, 8, 188–196. [Google Scholar]
- Ribot, J. Vulnerability does not just fall from the sky: Toward multi-scale pro-poor climate policy. In Handbook on Climate Change and Human Security; Edward Elgar Publishing: Cheltenham, UK, 2013. [Google Scholar]
- Magrath, J.; Tshabangu, L.; Mativenga, S. Irrigation Schemes and Weather Extremes: The challenge for Zimbabwe; Oxfam: London, UK, 2014. [Google Scholar]
- Chigavazira, T.; Zandamela, H.L. Behaviour change in drought response and management: Case study of Mudzi district, Zimbabwe. J. Public Adm. Gov. 2021, 11, 294316. [Google Scholar]
- Matope, A.; Zindove, T.J.; Dhliwayo, M.; Chimonyo, M. Mitigating the effects of drought on cattle production in communal rangelands of Zimbabwe. Trop. Anim. health Prod. 2020, 52, 321–330. [Google Scholar] [CrossRef]
- Belle, J.; Sithabile, M.; Ogundeji, A.A. Assessing communal farmers’ preparedness to drought in the Umguza District, Zimbabwe. Int. J. Disaster Risk Reduct. 2017, 22, 194–203. [Google Scholar] [CrossRef]
- Labarrere, C.A.; Woods, J.; Hardin, J.; Campana, G.; Ortiz, M.; Jaeger, B.; Reichart, B.; Bonnin, J.; Currin, A.; Cosgrove, S. Early prediction of cardiac allograft vasculopathy and heart transplant failure. Am. J. Transplant. 2011, 11, 528–535. [Google Scholar] [CrossRef]
- Nhemachena, A.; Warikandwa, T.V. From African Peer Review Mechanisms to African Queer Review Mechanisms? RPCIG: Langaa, Bamenda, 2019. [Google Scholar]
- GoZ. National Budget Statement; Ministry of Finance and Economic Development: Harare, Zimbabwe, 2016.
- Duker, A.; Mawoyo, T.; Bolding, A.; de Fraiture, C.; van der Zaag, P. Shifting or drifting? The crisis-driven advancement and failure of private smallholder irrigation from sand river aquifers in southern arid Zimbabwe. Agric. Water Manag. 2020, 241, 106342. [Google Scholar] [CrossRef]
- Irianti, S.; Prasetyoputra, P. The struggle for water in Indonesia: The role of women and children as household water fetcher. J. Water Sanit. Hyg. Dev. 2019, 9, 540–548. [Google Scholar] [CrossRef]
- Dube, K. Implications of rural irrigation schemes on household economy. A case of lower Gweru Irrigation scheme, Zimbabwe. South Afr. J. Agric. Ext. 2016, 44, 75–90. [Google Scholar] [CrossRef]
- Cook, C.; Bakker, K. Water security: Debating an emerging paradigm. Glob. Environ. Chang. 2012, 22, 94–102. [Google Scholar] [CrossRef]
- Mutambara, S.; Munodawafa, A. Production challenges and sustainability of smallholder irrigation schemes in Zimbabwe. J. Biol. Agric. Healthc. 2014, 4, 87–96. [Google Scholar]
- Mutambara, J.; Vandirayi, S.; January, J.; Zirima, H. Factors that influence HIV status disclosure among the elderly: Perspectives from Shurugwi, Zimbabwe. AIDS Care 2021, 1–6. [Google Scholar] [CrossRef]
- Makore, G.; Zane, V. Mining Within Zimbabwe’s Great Dyke: Extent, Impacts & Opportunities; Zimbabwe Environmental Law Association (ZELA): Harare, Zimbabwe, 2012. [Google Scholar]
- Mushongah, J.; Scoones, I. Livelihood change in rural Zimbabwe over 20 years. J. Dev. Stud. 2012, 48, 1241–1257. [Google Scholar] [CrossRef] [Green Version]
- Mukherjee, N.; Siddique, G. Assessment of climatic variability risks with application of livelihood vulnerability indices. Environ. Dev. Sustain. 2019, 22, 5077–5103. [Google Scholar] [CrossRef]
- Frischen, J.; Meza, I.; Rupp, D.; Wietler, K.; Hagenlocher, M. Drought risk to agricultural systems in Zimbabwe: A spatial analysis of hazard, exposure, and vulnerability. Sustainability 2020, 12, 752. [Google Scholar] [CrossRef] [Green Version]
- Musemwa, L.; Musara, J.P. Impacts of improved sorghum varieties intensification on household welfare in the mid-Zambezi Valley of Zimbabwe. Agrekon 2020, 59, 254–267. [Google Scholar]
- Makate, C.; Mango, N.; Makate, M. Socioeconomic status connected imbalances in arable land size holding and utilization in smallholder farming in Zimbabwe: Implications for a sustainable rural development. Land Use Policy 2019, 87, 104027. [Google Scholar] [CrossRef]
- Agyemang-Badu, A.A.; Agyei, K.; Kwaku Duah, E. Financial inclusion, poverty and income inequality: Evidence from Africa. Spiritan Int. J. Poverty Stud. 2018, 2, 2. [Google Scholar]
- Mazuru, N. Necroclimatism in a Spectral World (Dis) order? Rain petitioning, climate and weather engineering in 21st century Africa. In Chapter Nine Climate Change in Zimbabwe: Challenges and Prospects for Rural Women in Bikita District; RPCIG: Langaa, Bamenda, 2019; p. 255. [Google Scholar]
- Nhundu, K.; Gwata, C.; Mushunje, A. Impacts of Zimbabwe European Union micro-project programme (Zim/Eu MPP) in funding smallholder irrigation projects on food security and income levels: A case study of Mopane irrigation scheme in Zvishavane, Midlands province, Zimbabwe. Afr. J. Agric. Res. 2010, 5, 1759–1771. [Google Scholar]
- Sithole, S.; Dinbabo, M.F. Exploring youth migration and the food security nexus: Zimbabwean youths in Cape Town, South Africa. Afr. Hum. Mobil. Rev. 2016, 2, 512–537. [Google Scholar]
- Tompkins, E.L. Planning for climate change in small islands: Insights from national hurricane preparedness in the Cayman Islands. Glob. Environ. Chang. 2005, 15, 139–149. [Google Scholar] [CrossRef]

Publisher’s Note: MDPI stays neutral with regard to jurisdictional claims in published maps and institutional affiliations. |
© 2021 by the authors. Licensee MDPI, Basel, Switzerland. This article is an open access article distributed under the terms and conditions of the Creative Commons Attribution (CC BY) license (https://creativecommons.org/licenses/by/4.0/).