
Effects of Total Quality Management (TQM) Dimensions on Innovation—Evidence from SMEs

 ,
,  , and
, and
Abstract
:1. Introduction
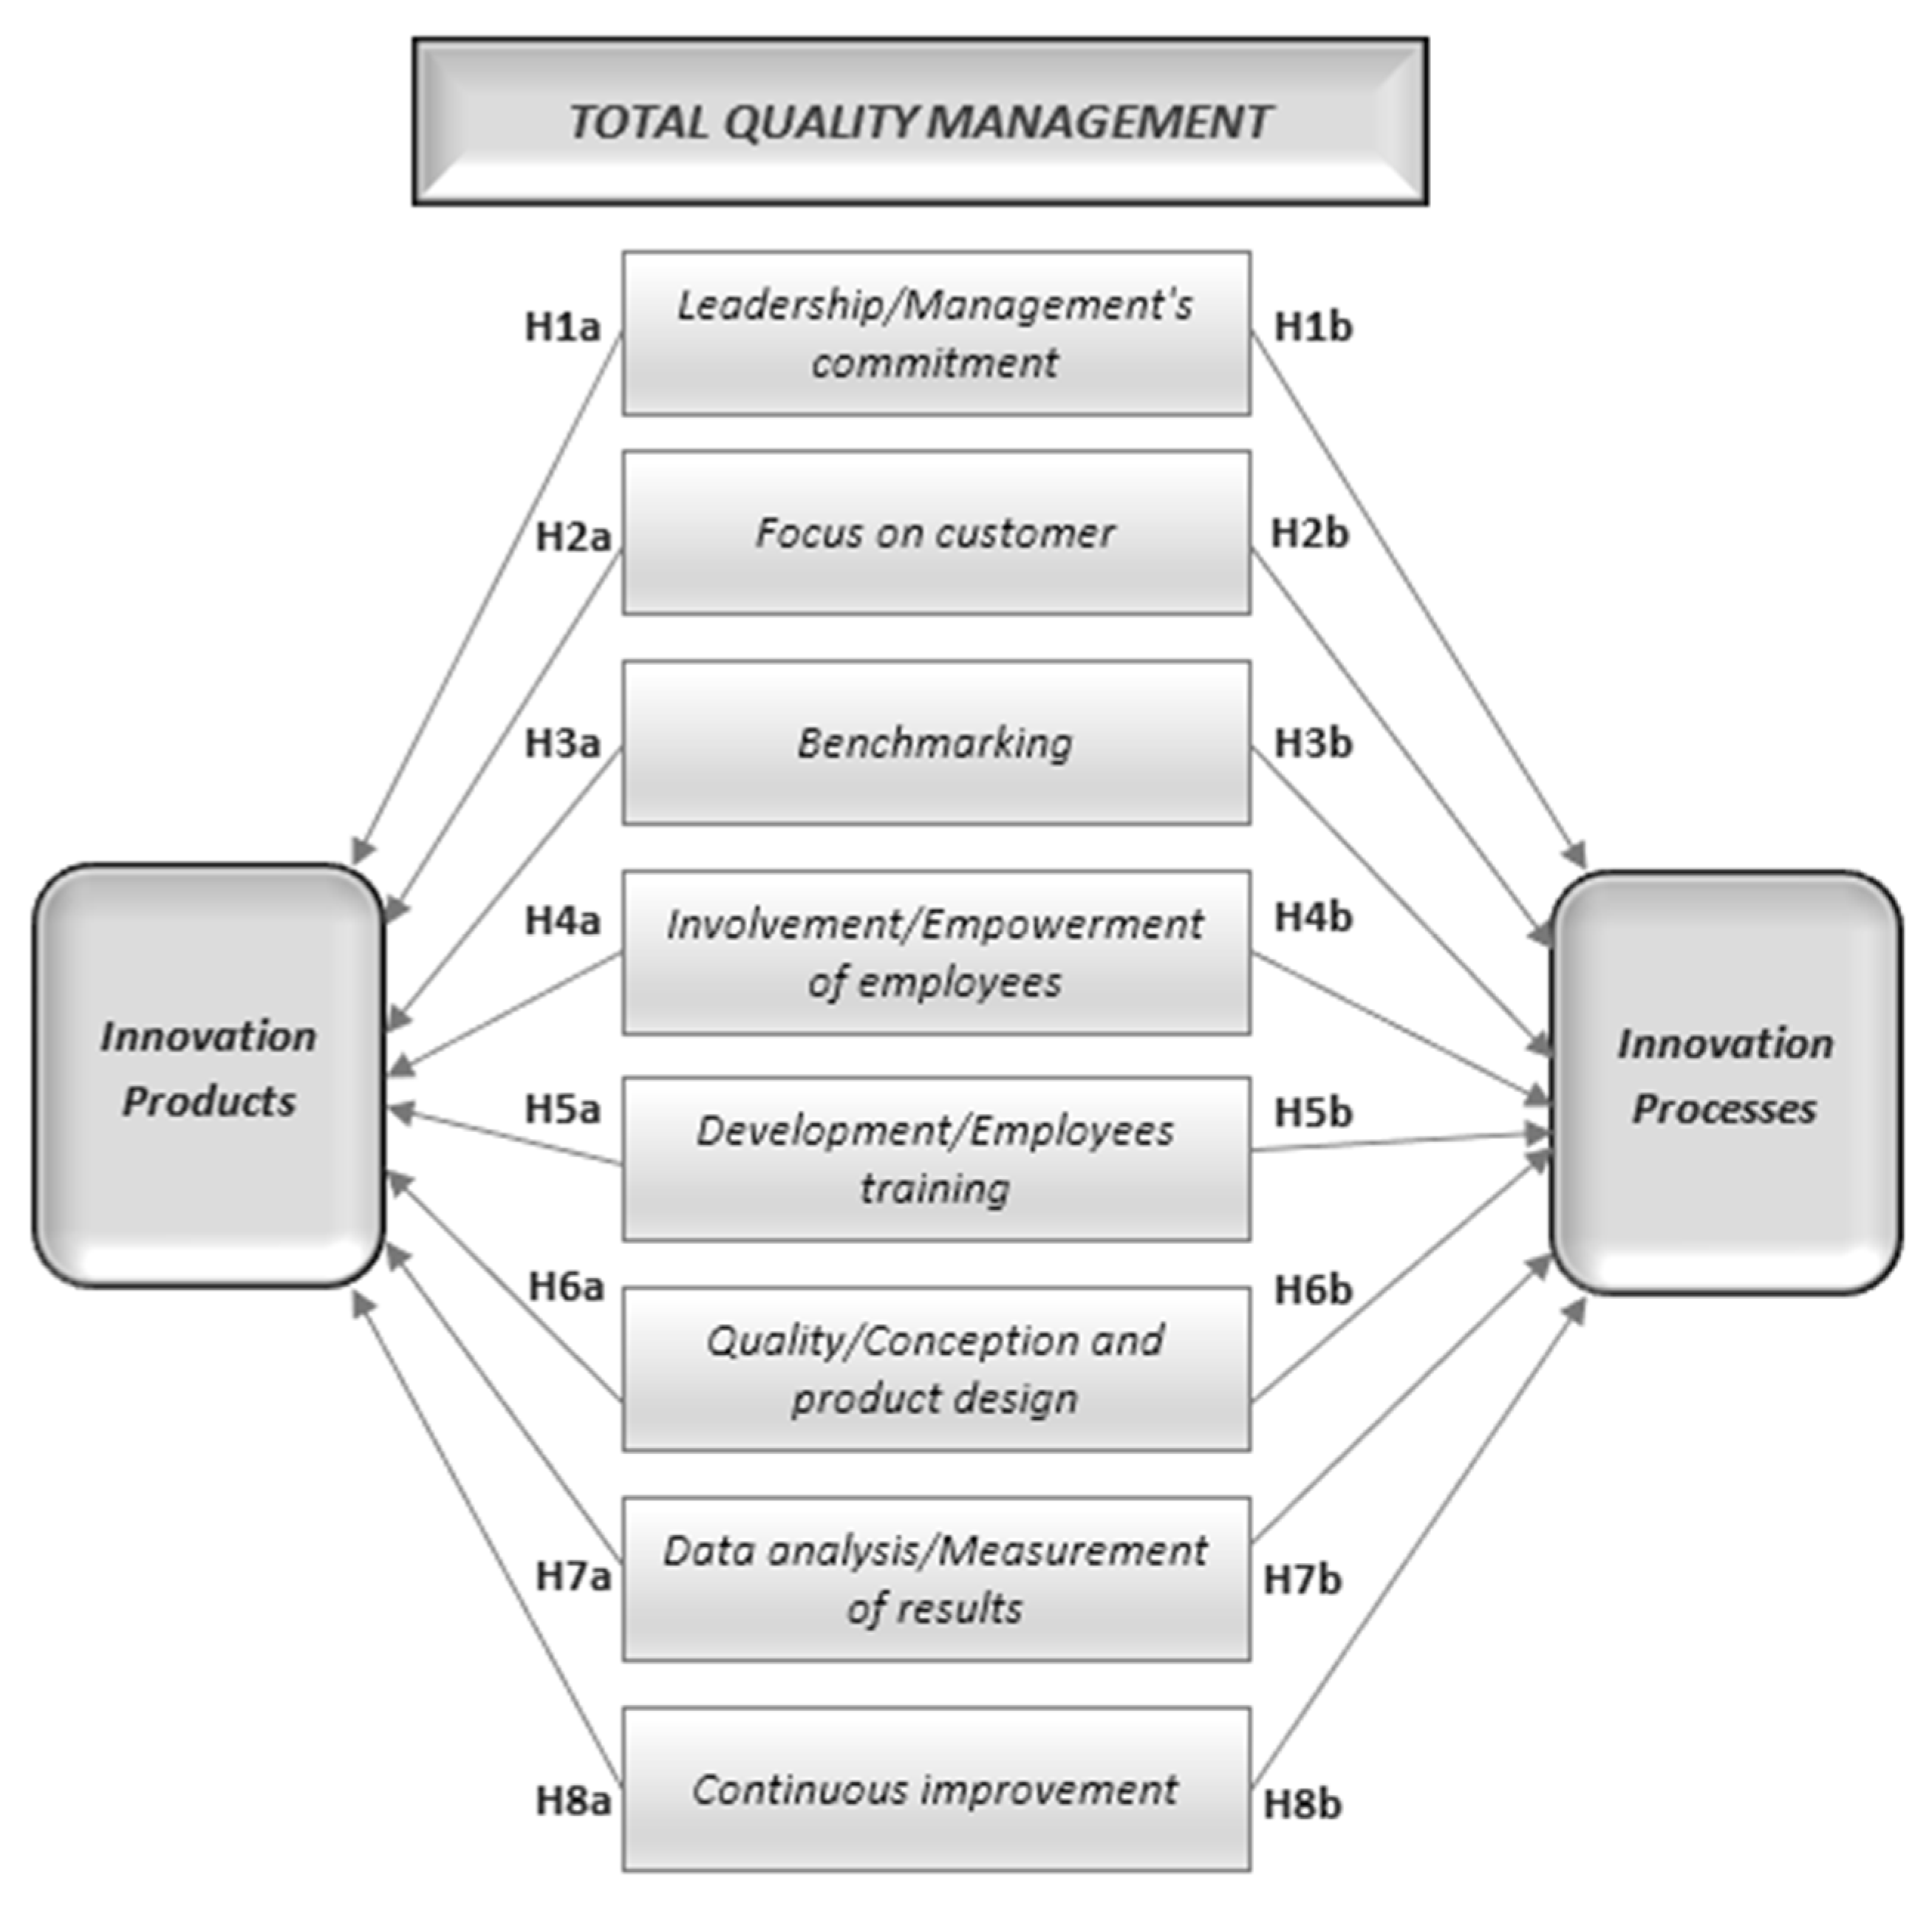
2. The Linkage between TQM Dimensions and Innovation Strategies
3. Materials and Methods
4. Empirical Research
4.1. Sample Characterization and Questionnaire Development
4.2. Data Analysis
and
Y (P2) = b0 + b1 (X1) + b2 (X2) + b3 (X3) + b4 (X4) + b5 (X5) + b6 (X6) + b7 (X7) + b8 (X8) + e
Y (P2) = Dependent variable (innovation processes), b0 = Constant, e = Error
5. Conclusions
Author Contributions
Funding
Institutional Review Board Statement
Informed Consent Statement
Data Availability Statement
Acknowledgments
Conflicts of Interest
Appendix A

| Innovation | Questions |
|---|---|
| Innovation of Products |
|
| Innovation of Processes |
|
| Total Quality Management Dimensions | Questions |
| Leadership/management’s commitment |
|
| Focus on customer |
|
| Benchmarking |
|
| Involvement/empowerment of employees |
|
| Development/employees training |
|
| Quality/conception and product design |
|
| Data analysis/measurement of results |
|
| Continuous improvement |
|
References
- Prajogo, D.I.; Brown, A. The relationship between TQM practices and quality performance and the role of formal TQM programs: An Australian empirical study. Qual. Manag. J. 2004, 11, 31–42. [Google Scholar] [CrossRef]
- Antunes, M.G.; Mucharreira, P.R.; Justino, M.R.; Texeira Quirós, J. Total quality management and quality certification on services corporations. Int. J. Qual. Res. 2020, 14, 847–864. [Google Scholar] [CrossRef]
- Segarra-Ciprés, M.; Escrig-tena, A.B.; García-juan, B. The link between quality management and innovation performance: A content analysis of survey-based research. Total Qual. Manag. Bus. Excell. 2020, 31, 1–22. [Google Scholar] [CrossRef]
- Martínez-Costa, M.; Martínez-Lorente, A. Does quality management foster or hinder innovation? An empirical study of Spanish companies. Total Qual. Manag. 2008, 19, 209–221. [Google Scholar] [CrossRef]
- Nowak, A. Strategic relationship between quality management and product innovation. Mid-Atl. J. Bus. 1997, 33, 119–135. [Google Scholar]
- Arumugam, V.; Ooi, K.B.; Fong, T.C. TQM practices and quality management performance—An investigation of their relationship using data from ISO 9001:2000 firms in Malaysia. TQM J. 2008, 20, 636–650. [Google Scholar] [CrossRef]
- Prajogo, I.D.; Sohal, S.A. The relationship between TQM practices, quality performance, and innovation performance: An empirical examination. Int. J. Qual. Reliab. Manag. 2003, 20, 901–918. [Google Scholar] [CrossRef] [Green Version]
- Oakland, J.S. Total Quality Management: The Route to Improving Performance; Butterworth-Heinemann: Oxford, UK, 1993. [Google Scholar]
- Terziovski, M. Quality management practices and their relationship with customer satisfaction and productivity improvement. Manag. Res. News 2006, 29, 414–424. [Google Scholar] [CrossRef]
- Mohanty, R.P.; Behera, A.K. TQM in the service sector. Work. Study 1996, 45, 13–17. [Google Scholar] [CrossRef]
- Claver-Cortés, E.; Pereira-Moliner, J.; Tarí, J.J.; Molina-Azorín, J.F. TQM, managerial factors and performance in the Spanish hotel industry. Ind. Manag. Data Syst. 2008, 108, 228–244. [Google Scholar] [CrossRef]
- Teh, P.L.; Ooi, K.B.; Yong, C.C. Does TQM impact on role stressors? A conceptual model. Ind. Manag. Data Syst. 2008, 108, 1029–1044. [Google Scholar] [CrossRef]
- Jimenez-Jimenez, D.; Valle, R.S.; Hernandez-Espallardo, M. Fostering innovation. The role of market orientation and organizational learning. Eur. J. Innov. Manag. 2008, 11, 389–412. [Google Scholar] [CrossRef]
- Martínez-Costa, M.; Choi, T.; Martínez, J.; Martínez-Lorente, A. ISO 9000/1994, ISO 9001/2000 and TQM: The performance debate revisited. J. Oper. Manag. 2009, 27, 495–511. [Google Scholar] [CrossRef] [Green Version]
- Mucharreira, P.R.; Antunes, M.G.; Abranja, N.; Justino, M.R.; Texeira Quirós, J. The relevance of tourism in financial sustainability of hotels. Eur. Res. Manag. Bus. Econ. 2019, 25, 165–174. [Google Scholar] [CrossRef]
- Sotirelis, P.; Grigoroudis, E. Total quality management and innovation: Linkages and evidence from the agro-food industry. J. Knowl. Econ. 2020. [Google Scholar] [CrossRef]
- Gharakhani, D.; Hossein, R.; Mohammad, R.; Farahmandian, A. Total quality management and organizational performance. Am. J. Ind. Eng. 2013, 1, 46–50. [Google Scholar]
- Antunes, M.G.; Texeira Quirós, J.; Justino, M.R. The relationship between innovation and total quality management and the innovation effects on organizational performance. Int. J. Qual. Reliab. Manag. 2017, 34, 1474–1492. [Google Scholar] [CrossRef]
- Madanat, H.; Khasawneh, G. Impact of total quality management implementation on effectiveness of human resource management in the jordanian banking sector from employee’s perspective. Acad. Strateg. Manag. J. 2017, 16, 114–148. [Google Scholar]
- Sule, J.G.; Ogbadu, E.E.; Nafiu, A.T. Factor analysis of total quality management adoption by SMEs in Nigeria. Facta Univ. 2017, 13, 365. [Google Scholar] [CrossRef] [Green Version]
- Bouranta, N.; Psomas, E.; Suárez-Barraza, M.F.; Jaca, C. The key factors of total quality management in the service sector: A cross-cultural study. Benchmarking Int. J. 2019, 26, 893. [Google Scholar] [CrossRef]
- Mehta, N.; Diwakar, N.; Arya, R. Evaluating comparative performance of Indian engineering educational institutes based on TQM criteria for internal benchmarking. Benchmarking Int. J. 2019, 26, 221–245. [Google Scholar] [CrossRef]
- Kanji, G.K.; Wallace, W. Business excellence through customer satisfaction. Total Qual. Manag. 2000, 11, 979–998. [Google Scholar] [CrossRef]
- Hipp, C.; Tether, B.S.; Miles, I. The incidence and effect of innovation in services. Int. J. Innov. Manag. 2000, 4, 417–453. [Google Scholar] [CrossRef]
- Damanpour, F. Organizational innovation: A meta-analysis of effects of determinants and moderators. Acad. Manag. J. 1991, 34, 555–590. [Google Scholar]
- Kirner, E.; Kinkel, S.; Jaeger, A. Innovation paths and the innovation performance of low-technology firms—An empirical analysis of German industry. Res. Policy 2009, 38, 447–458. [Google Scholar] [CrossRef]
- Scott, S.V.; Van Reenen, J.; Zachariadis, M. The long-term effect of digital innovation on bank performance: An empirical study of SWIFT adoption in financial services. Res. Policy 2017, 46, 984–1004. [Google Scholar] [CrossRef] [Green Version]
- Martínez-Costa, M.; Jimenez-Jimenez, D.; Castro-del-Rosario, Y. The performance implications of the UNE 166.000 standardised innovation management system. Eur. J. Innov. Manag. 2018, 22, 281–301. [Google Scholar] [CrossRef]
- Wang, X.; Dass, M. Building innovation capability: The role of top management innovativeness and relative-exploration orientation. J. Bus. Res. 2017, 76, 127–135. [Google Scholar] [CrossRef]
- Kadar, M.; Moise, I.; Colomba, C. Innovation management in the globalized digital society. Soc. Behav. Sci. 2014, 143, 1083–1089. [Google Scholar] [CrossRef] [Green Version]
- Feng, J.; Prajogo, D.I.; Tan, K.C.; Sohal, A.S. The impact of TQM practices on performance: A comparative study between Australian and Singaporean organizations. Eur. J. Innov. Manag. 2006, 9, 269–278. [Google Scholar] [CrossRef]
- Augusto, M.G.; Lisboa, J.V.; Yasin, M.M. Organisational performance and innovation in the context of a total quality management philosophy: An empirical investigation. Total Qual. Manag. Bus. Excell. 2014, 25, 1141–1155. [Google Scholar] [CrossRef]
- Miranda Silva, G.; Gomes, P.; Filipe Lages, L.; Lopes Pereira, Z. The role of TQM in strategic product innovation: An empirical assessment. Int. J. Oper. Prod. Manag. 2014, 34, 1307–1337. [Google Scholar] [CrossRef] [Green Version]
- Terziovski, M.; Guerrero, J.L. ISO 9000 quality system certification and its impact on product and process innovation performance. Int. J. Prod. Econ. 2014, 158, 197–207. [Google Scholar] [CrossRef]
- Long, C.; Abdul Aziz, M.; Kowang, T.; Ismail, W.K. Impact of TQM practices on innovation performance among manufacturing companies in malaysia. S. Afr. J. Ind. Eng. 2015, 26, 75–85. [Google Scholar] [CrossRef]
- Moreno-Luzon, M.D.; Valls-Pasola, J. Ambidexterity and quality management: Towards a research agenda. Manag. Decis. 2011, 49, 927–947. [Google Scholar] [CrossRef]
- Aoun, M.; Hasnan, N. Lean production and TQM: Complementary or contradictory driving forces of innovation performance? Int. J. Innov. Sci. 2013, 5, 237–252. [Google Scholar] [CrossRef]
- Hoang, D.H.; Igel, B.; Laosirihongthong, T. The impact of total quality management on innovation: Findings from a developing country. Int. J. Qual. Reliab. Manag. 2006, 23, 1092–1117. [Google Scholar] [CrossRef]
- Prajogo, D.I.; Sohal, A.S. Transitioning from total quality management to total innovation management: An Australian case. Int. J. Qual. Reliab. Manag. 2004, 21, 861–875. [Google Scholar] [CrossRef]
- Prajogo, D.I.; Sohal, A.S. The multidimensionality of TQM practices in determining quality and innovation performance—An empirical examination. Technovation 2004, 24, 443–453. [Google Scholar] [CrossRef]
- Jong, J.P.J.; Hartog, D.N. How leaders influence employees’ innovative behavior. Eur. J. Innov. Manag. 2007, 10, 41–64. [Google Scholar] [CrossRef]
- Ravichandran, T.; Rai, A. Quality management in systems development: An organizational system perspective. MIS Q. 2000, 24, 381–415. [Google Scholar] [CrossRef] [Green Version]
- Flynn, B.B.; Schroeder, R.G.; Sakakibara, S. A framework for quality management research and an associated measurement instrument. J. Oper. Manag. 1994, 11, 339–366. [Google Scholar] [CrossRef]
- Garcia-Morales, V.J.; Matias-Reche, F.; Hurtado-Torres, N. Influence of transformational leadership on organizational innovation and performance depending on the level of organizational learning in the pharmaceutical sector. J. Organ. Chang. Manag. 2008, 21, 188–212. [Google Scholar] [CrossRef]
- Rahman, S. Leadership and HR focus in TQM research in Australia: An assessment and agenda. Benchmarking Int. J. 2002, 9, 485–505. [Google Scholar] [CrossRef] [Green Version]
- Prajogo, D.; Sohal, A. TQM and innovation: A literature review and research framework. Technovation 2001, 21, 539–558. [Google Scholar] [CrossRef]
- Fuentes, M.; Montes, F.; Fernández, L. Total quality management, strategic orientation, and organizational performance: The case of Spanish companies. Total Qual. Manag. Bus. Excell. 2006, 17, 303–323. [Google Scholar] [CrossRef]
- Perdomo-Ortiz, J.; González-Benito, J.; Galende, J. Total quality management as a forerunner of business innovation capability. Technovation 2006, 26, 1170–1185. [Google Scholar] [CrossRef]
- Marôco, J. Análise de Equações Estruturais: Fundamentos Teóricos, Software e Aplicações; Report Number: Pêro Pinheiro, Portugal, 2010. [Google Scholar]


| L_MC | FC | B | I_EE | D_ET | Q_CPD | DA_MR | CI | INOPD | INOVPC | |
|---|---|---|---|---|---|---|---|---|---|---|
| L_MC | 1 | |||||||||
| FC | 0.693 ** | 1 | ||||||||
| B | 0.543 ** | 0.586 ** | 1 | |||||||
| I_EE | 0.685 ** | 0.668 ** | 0.615 ** | 1 | ||||||
| D_ET | 0.738 ** | 0.627 ** | 0.512 ** | 0.732 ** | 1 | |||||
| Q_CPD | 0.733 ** | 0.605 ** | 0.537 ** | 0.722 ** | 0.762 ** | 1 | ||||
| DA_MR | 0.747 ** | 0.755 ** | 0.564 ** | 0.785 ** | 0.778 ** | 0.778 ** | 1 | |||
| CI | 0.760 ** | 0.749 ** | 0.596 ** | 0.721 ** | 0.737 ** | 0.757 ** | 0.842 ** | 1 | ||
| INOVPD | 0.405 ** | 0.364 ** | 0.428 ** | 0.413 ** | 0.356 ** | 0.488 ** | 0.377 ** | 0.479 ** | 1 | |
| INOVPC | 0.575 ** | 0.572 ** | 0.565 ** | 0.639 ** | 0.527 ** | 0.549 ** | 0.579 ** | 0.647 ** | 0.651 ** | 1 |
| INOVPD | L/MC | I/EE | FC | B | D/ET | Q/CPD | DA/MR | CI |
|---|---|---|---|---|---|---|---|---|
| Correlation Significance (two-tailed) | 0.016 0.795 | 0.063 0.292 | −0.005 0.938 | 0.164 0.006 | −0.089 0.139 | 0.236 0.000 | −0.154 0.010 | 0.199 0.001 |
| INOVPC | L_MC | I_EE | FC | B | D_ET | Q_CPD | DA_MR | CI |
|---|---|---|---|---|---|---|---|---|
| Correlation Significance (two-tailed) | 0.075 0.208 | 0.248 0.000 | 0.063 0.296 | 0.184 0.002 | −0.045 0.452 | 0.005 0.940 | −0.096 0.109 | 0.230 0.000 |
| Dimensions | Number of Questions | Cronbach’s Alpha |
|---|---|---|
| Product innovation | Q1, Q2, Q3, Q4 | 0.858 |
| Process innovation | Q5, Q6, Q7, Q8 | 0.894 |
| Total quality management | ||
| Leadership/management’s commitment | Q9, Q10, Q11, Q12 | 0.875 |
| Focus on customer | Q13, Q14, Q15, Q16 | 0.842 |
| Benchmarking | Q17, Q18, Q19, Q20 | 0.927 |
| Involvement/empowerment of employees | Q21, Q22, Q23, Q24 | 0.851 |
| Development/employees training | Q25, Q26, Q27, Q28 | 0.924 |
| Quality/conception and product design | Q29, Q30, Q31, Q32 | 0.859 |
| Data analysis/measurement of results | Q33, Q34, Q35, Q36 | 0.947 |
| Continuous improvement | Q37, Q38, Q39, Q40 | 0.939 |
| Component | Eigenvalues | Percentage of Variance | Loading Item—Factor | |
|---|---|---|---|---|
| Product innovation (Y1) (KMO = 0.823) | items | Loading-weights | ||
| 1 | 2.816 | 70.393 | Q1 | 0.855 |
| 2 | 0.467 | 11.675 | Q2 | 0.855 |
| 3 | 0.362 | 9.044 | Q3 | 0.818 |
| 4 | 0.356 | 8.888 | Q4 | 0.827 |
| Process innovation (Y2) (KMO = 0.811) | ||||
| 1 | 3.039 | 75.984 | Q5 | 0.858 |
| 2 | 0.398 | 9.943 | Q6 | 0.876 |
| 3 | 0.337 | 8.429 | Q7 | 0.882 |
| 4 | 0.226 | 5.645 | Q8 | 0.870 |
| Leadership/management’s commitment (X1) (KMO = 0.773) | ||||
| 1 | 2.920 | 72.997 | Q9 | 0.810 |
| 2 | 0.559 | 13.965 | Q10 | 0.866 |
| 3 | 0.304 | 7.611 | Q11 | 0.889 |
| 4 | 0.217 | 5.426 | Q12 | 0.851 |
| Focus on customer (X2) (KMO = 0.746) | ||||
| 1 | 2.728 | 68.196 | Q13 | 0.844 |
| 2 | 0.681 | 17.014 | Q14 | 0.857 |
| 3 | 0.337 | 8.423 | Q15 | 0.860 |
| 4 | 0.255 | 6.367 | Q16 | 0.736 |
| Benchmarking (X3) (KMO = 0.858) | ||||
| 1 | 3.282 | 82.040 | Q17 | 0.877 |
| 2 | 0.307 | 7.676 | Q18 | 0.919 |
| 3 | 0.233 | 5.817 | Q19 | 0.900 |
| 4 | 0.179 | 4.467 | Q20 | 0.926 |
| Involvement/empowerment of employees (X4) (KMO = 0.763) | ||||
| 1 | 2.784 | 69.604 | Q21 | 0.817 |
| 2 | 0.610 | 15.255 | Q22 | 0.835 |
| 3 | 0.328 | 80.207 | Q23 | 0.834 |
| 4 | 0.277 | 6.934 | Q24 | 0.850 |
| Development/employees training (X5) (KMO = 0.838) | ||||
| 1 | 3.263 | 81.576 | Q25 | 0.903 |
| 2 | 0.324 | 8.097 | Q26 | 0.931 |
| 3 | 0.258 | 6.456 | Q27 | 0.905 |
| 4 | 0.155 | 3.872 | Q28 | 0.873 |
| Quality/conception and product design (X6) (KMO = 0.793) | ||||
| 1 | 2.829 | 70.730 | Q29 | 0.862 |
| 2 | 0.494 | 12.342 | Q30 | 0.849 |
| 3 | 0.402 | 1.062 | Q31 | 0.830 |
| 4 | 0.275 | 6.867 | Q32 | 0.823 |
| Data analysis/measurement of results (X7) (KMO = 0.859) | ||||
| 1 | 3.454 | 86.342 | Q33 | 0.901 |
| 2 | 0.258 | 6.460 | Q34 | 0.941 |
| 3 | 0.156 | 3.899 | Q35 | 0.933 |
| 4 | 0.132 | 3.299 | Q36 | 0.941 |
| Continuous improvement (X8) (KMO = 0.840) | ||||
| 1 | 3.381 | 84.534 | Q37 | 0.913 |
| 2 | 0.294 | 7.338 | Q38 | 0.933 |
| 3 | 0.177 | 4.425 | Q39 | 0.919 |
| 4 | 0.148 | 3.703 | Q40 | 0.912 |
| n | Minimum | Maximum | Mean | Standard Deviation | |
|---|---|---|---|---|---|
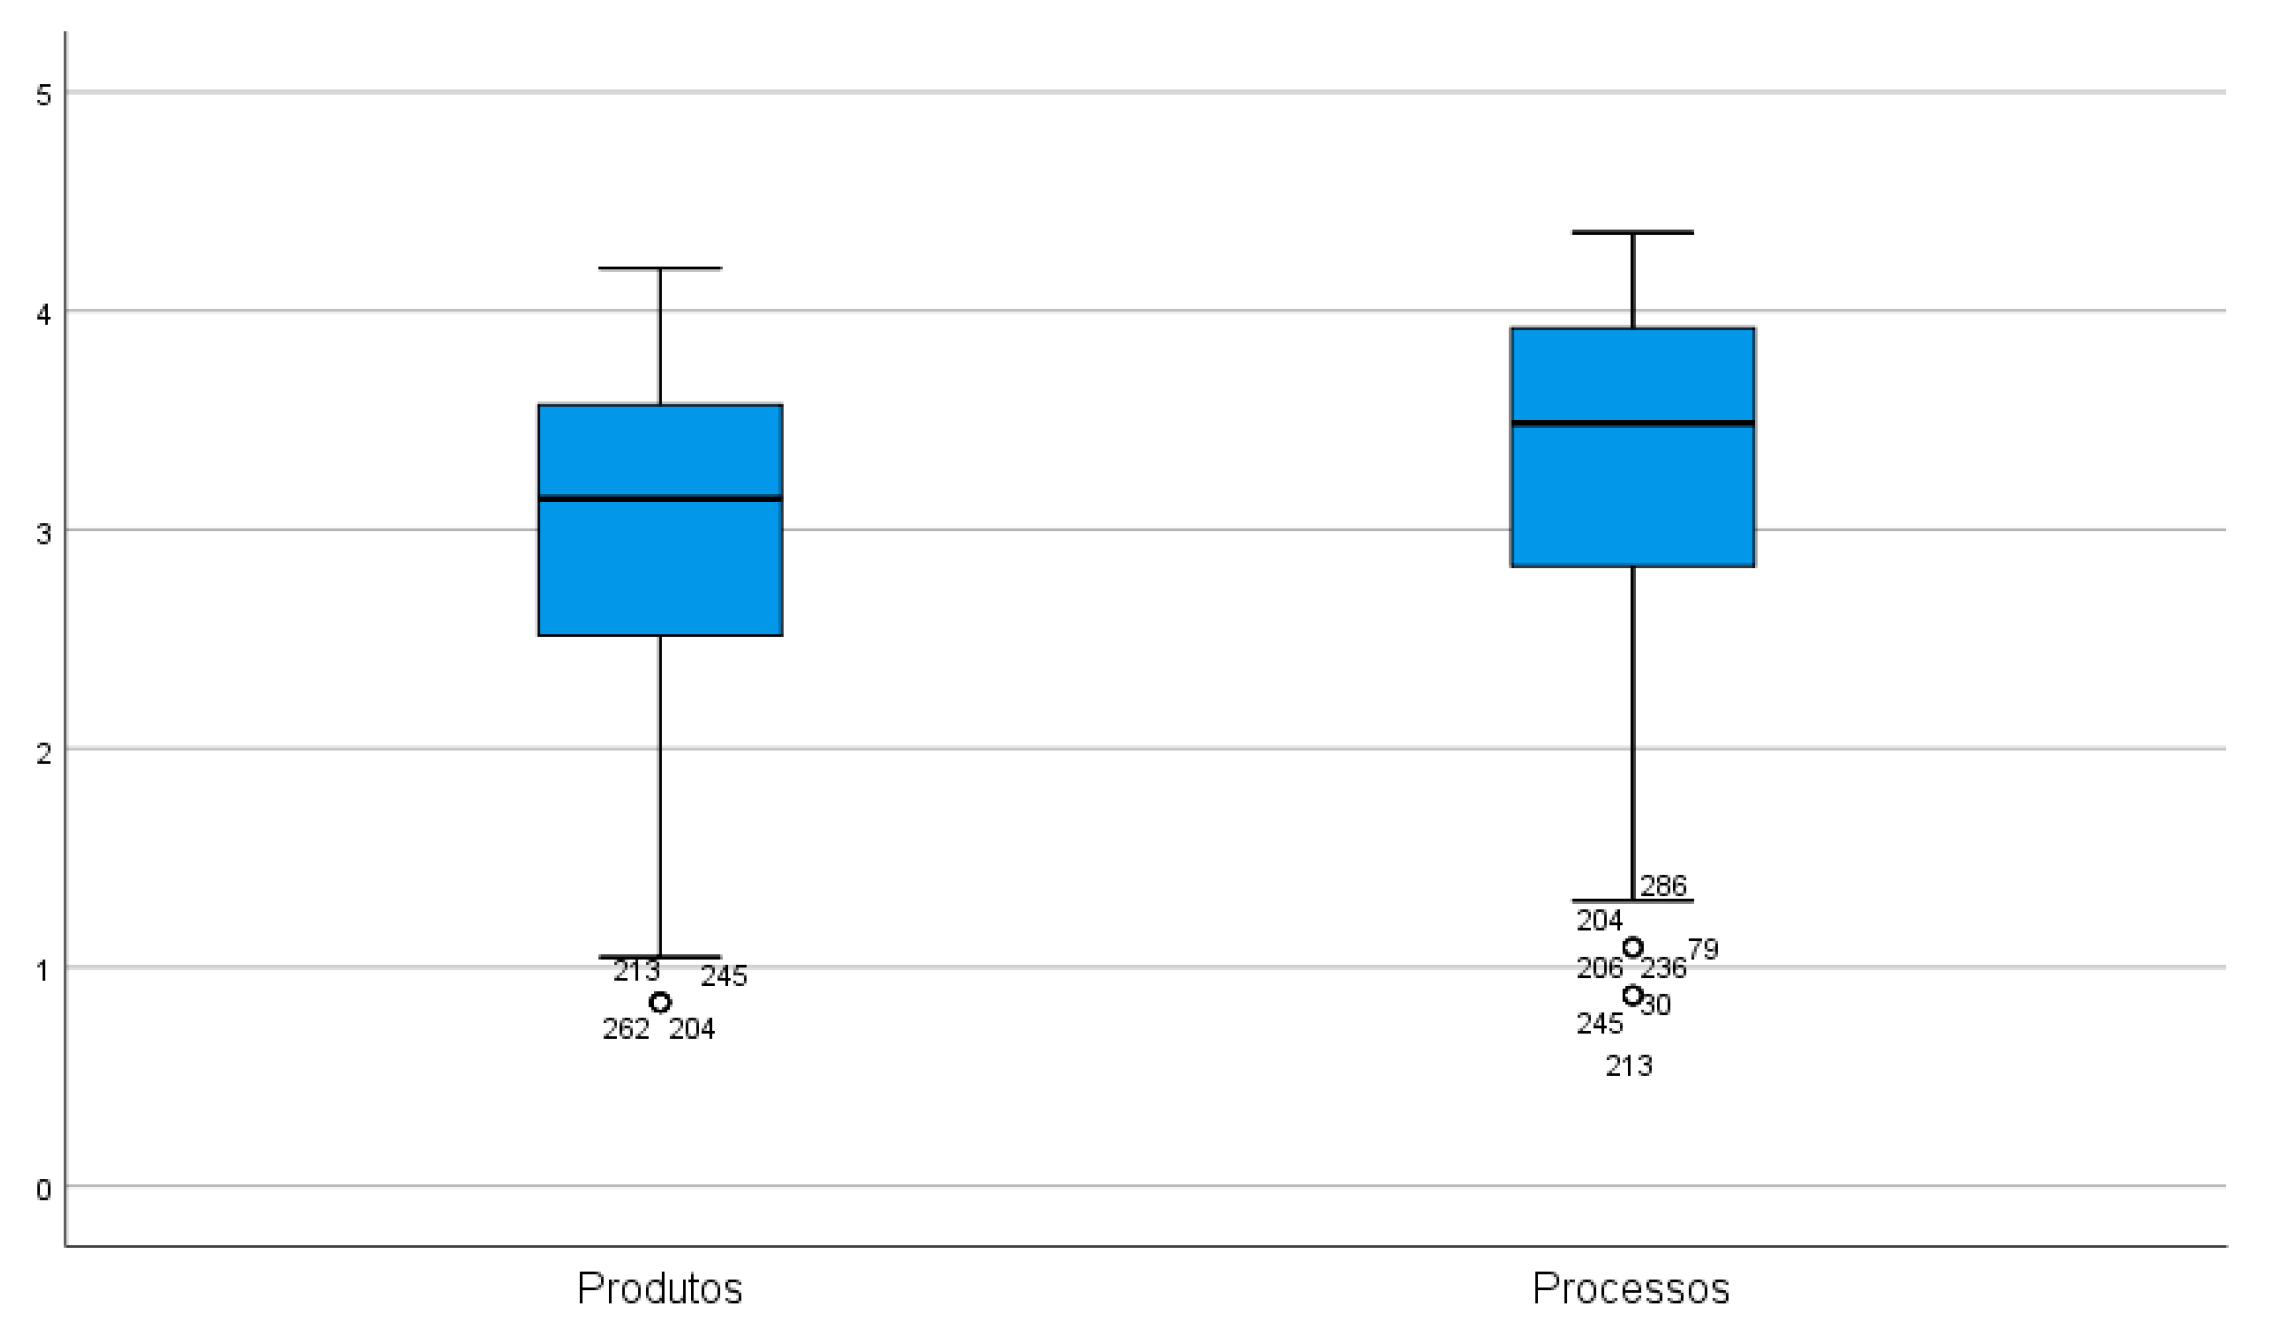
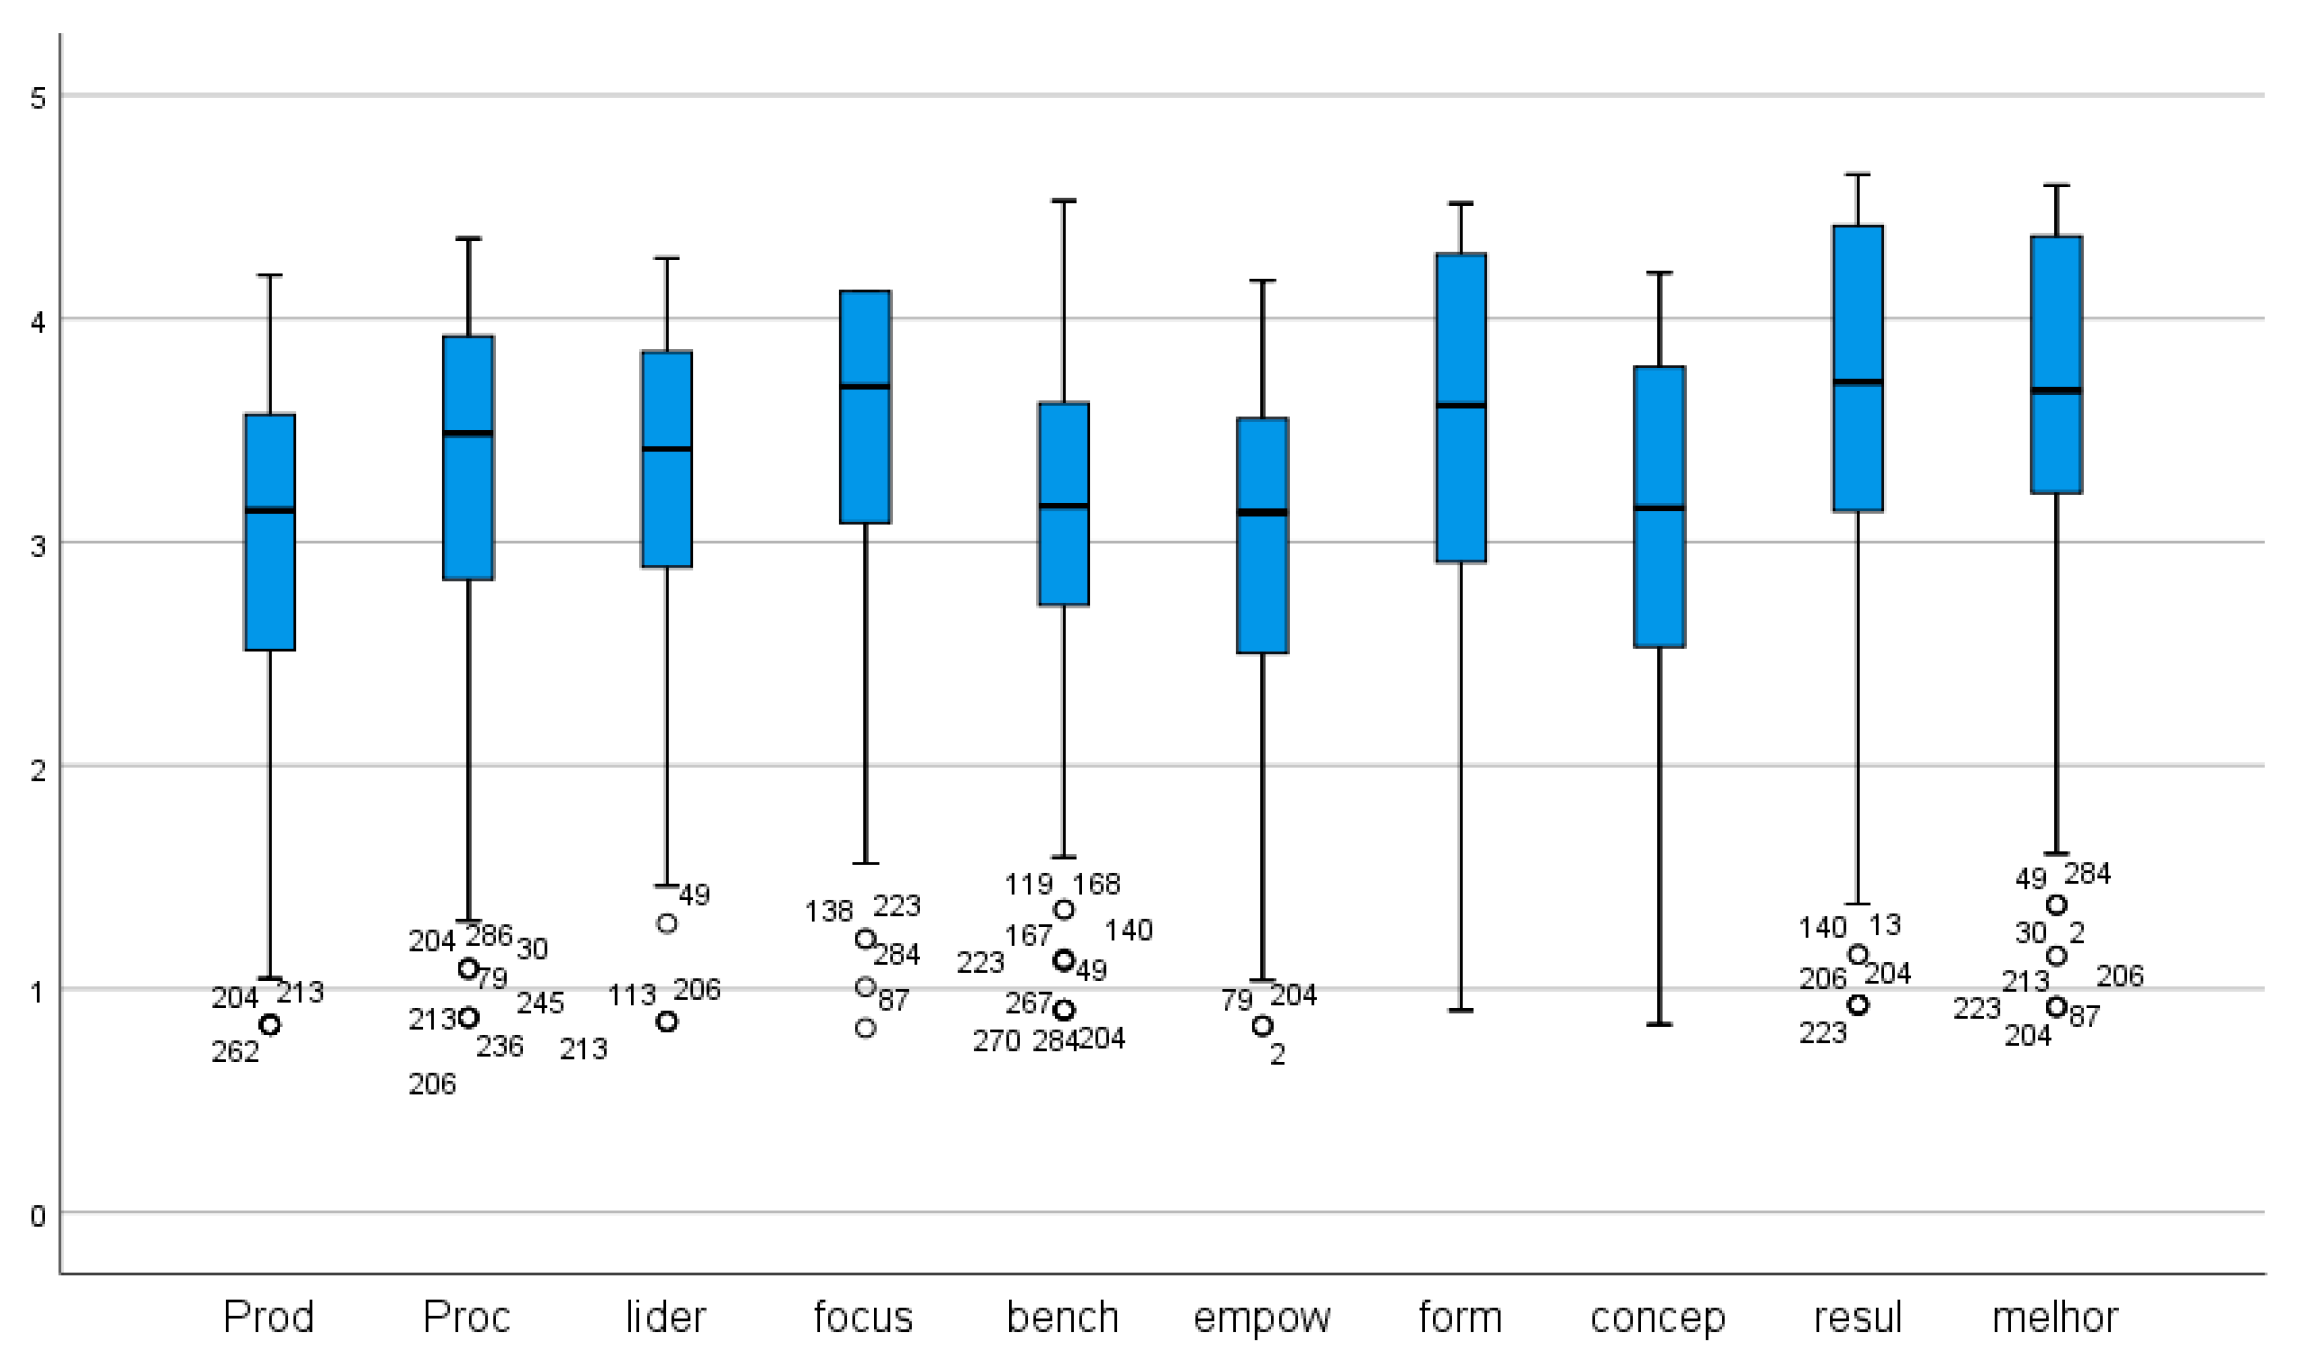
| Product innovation | 287 | 0.84 | 4.19 | 2.9296 | 0.83247 |
| Process innovation | 287 | 0.87 | 4.36 | 3.2732 | 0.83768 |
| Leadership/management’s commitment | 287 | 0.85 | 4.27 | 3.3305 | 0.76047 |
| Focus on customer | 287 | 0.82 | 4.12 | 3.4826 | 0.66102 |
| Benchmarking | 287 | 0.91 | 4.53 | 3.1152 | 0.87836 |
| Involvement/empowerment of employees | 287 | 0.83 | 4.17 | 3.0599 | 0.77015 |
| Development/employees training | 287 | 0.90 | 4.52 | 3.4055 | 0.94950 |
| Quality/conception and product design | 287 | 0.84 | 4.21 | 3.0945 | 0.78114 |
| Data analysis/measurement of results | 287 | 0.93 | 4.65 | 3.6604 | 0.90225 |
| Continuous improvement | 287 | 0.92 | 4.60 | 3.6680 | 0.85796 |
| Model | Unstandardized Coefficients | Standardized Coefficients | t | p | Robust | |||
|---|---|---|---|---|---|---|---|---|
| B | Standard Error | Beta | B | Standard Error | t Value | |||
| (Constant) | 0.927 | 0.229 | 4.043 | 0.000 | 0.647 | 0.222 | 2.914 | |
| Leadership/management’s commitment | 0.022 | 0.097 | 0.020 | 0.228 | 0.820 | 0.022 | 0.094 | 0.236 |
| Focus on customer | −0.005 | 0.106 | −0.004 | −0.050 | 0.960 | 0.062 | 0.103 | 0.602 |
| Benchmarking | 0.176 | 0.063 | 0.186 | 2.778 | 0.006 | 0.171 | 0.061 | 2.783 |
| Involvement/empowerment of employees | 0.101 | 0.097 | 0.093 | 1.036 | 0.301 | 0.064 | 0.094 | 0.676 |
| Development/employees training | −0.116 | 0.080 | −0.133 | −1.453 | 0.147 | −0.076 | 0.077 | −0.983 |
| Quality/conception and product design | 0.397 | 0.098 | 0.372 | 4.045 | 0.000 | 0.425 | 0.095 | 4.466 |
| Data analysis/measurement of results | −0.274 | 0.106 | −0.297 | −2.574 | 0.011 | −0.336 | 0.103 | −3.261 |
| Continuous improvement | 0.344 | 0.102 | 0.354 | 3.363 | 0.001 | 0.401 | 0.099 | 4.054 |
| Model | Unstandardized Coefficients | Standardized Coefficients | t | p | Robust | ||||
|---|---|---|---|---|---|---|---|---|---|
| B | Standard Error | Beta | B | Standard Error | t Value | p | |||
| (Constant) | 0.959 | 0.192 | 4.987 | 0.000 | 0.751 | 0.185 | 4.053 | <0.001 | |
| Quality/conception and product design | 0.375 | 0.089 | 0.352 | 4.237 | 0.000 | 0.408 | 0.085 | 4.779 | <0.001 |
| Benchmarking | 0.192 | 0.059 | 0.203 | 3.237 | 0.001 | 0.190 | 0.057 | 3.327 | <0.001 |
| Continuous improvement | 0.333 | 0.096 | 0.343 | 3.481 | 0.001 | 0.415 | 0.092 | 4.500 | <0.001 |
| Data analysis/measurement of results | −0.276 | 0.092 | −0.299 | −2.989 | 0.003 | −0.318 | 0.089 | −3.572 | <0.001 |
| Model | Unstandardized Coefficients | Standardized Coefficients | t | p | Robust | |||
|---|---|---|---|---|---|---|---|---|
| B | Standard Error | Beta | B | Standard Error | t Value | |||
| (Constant) | 0.423 | 0.195 | 2.173 | 0.031 | 0.297 | 0.177 | 1.676 | |
| Leadership/management’s commitment | 0.102 | 0.082 | 0.093 | 1.242 | 0.215 | 0.200 | 0.075 | 2.663 |
| Focus on customer | 0.096 | 0.090 | 0.075 | 1.059 | 0.291 | 0.067 | 0.082 | 0.815 |
| Benchmarking | 0.169 | 0.054 | 0.177 | 3.141 | 0.002 | 0.134 | 0.049 | 2.743 |
| Involvement/empowerment of employees | 0.353 | 0.083 | 0.324 | 4.270 | 0.000 | 0.304 | 0.075 | 4.038 |
| Development/employees training | −0.050 | 0.068 | −0.056 | −0.732 | 0.465 | −0.074 | 0.062 | −1.190 |
| Quality/conception and product design | 0.004 | 0.083 | 0.004 | 0.050 | 0.960 | −0.013 | 0.076 | −.177 |
| Data analysis/measurement of results | −0.146 | 0.090 | −0.157 | −1.615 | 0.108 | −0.104 | 0.082 | −1.264 |
| Continuous improvement | 0.344 | 0.087 | 0.352 | 3.961 | 0.000 | 0.395 | 0.079 | 5.000 |
| Model | Unstandardized Coefficients | Standardized Coefficients | t | p | Robust | ||||
|---|---|---|---|---|---|---|---|---|---|
| B | Standard Error | Beta | B | Standard Error | t Value | p | |||
| (Constant) | 0.577 | 0.163 | 3.532 | <0.001 | 0.371 | 0.153 | 2.424 | 0.002 | |
| Leadership/management’s commitment | - | - | - | - | - | 0.150 | 0.067 | 2.222 | 0.003 |
| Continuous improvement | 0.319 | 0.061 | 0.326 | 5.186 | <0.001 | 0.350 | 0.064 | 5.476 | <0.001 |
| Involvement/empowerment of employees | 0.308 | 0.070 | 0.283 | 4.419 | <0.001 | 0.238 | 0.065 | 3.657 | <0.001 |
| Benchmarking | 0.188 | 0.053 | 0.197 | 3.569 | <0.001 | 0.141 | 0.048 | 2.952 | <0.001 |
Publisher’s Note: MDPI stays neutral with regard to jurisdictional claims in published maps and institutional affiliations. |
© 2021 by the authors. Licensee MDPI, Basel, Switzerland. This article is an open access article distributed under the terms and conditions of the Creative Commons Attribution (CC BY) license (https://creativecommons.org/licenses/by/4.0/).
Share and Cite
Antunes, M.G.; Mucharreira, P.R.; Justino, M.R.T.; Texeira-Quirós, J. Effects of Total Quality Management (TQM) Dimensions on Innovation—Evidence from SMEs. Sustainability 2021, 13, 10095. https://doi.org/10.3390/su131810095
Antunes MG, Mucharreira PR, Justino MRT, Texeira-Quirós J. Effects of Total Quality Management (TQM) Dimensions on Innovation—Evidence from SMEs. Sustainability. 2021; 13(18):10095. https://doi.org/10.3390/su131810095
Chicago/Turabian StyleAntunes, Marina Godinho, Pedro Ribeiro Mucharreira, Maria Rosário Texeira Justino, and Joaquín Texeira-Quirós. 2021. "Effects of Total Quality Management (TQM) Dimensions on Innovation—Evidence from SMEs" Sustainability 13, no. 18: 10095. https://doi.org/10.3390/su131810095
APA StyleAntunes, M. G., Mucharreira, P. R., Justino, M. R. T., & Texeira-Quirós, J. (2021). Effects of Total Quality Management (TQM) Dimensions on Innovation—Evidence from SMEs. Sustainability, 13(18), 10095. https://doi.org/10.3390/su131810095