Article

Using Multivariate Regression and ANN Models to Predict Properties of Concrete Cured under Hot Weather

1
Department of Civil Engineering, COMSATS University Islamabad, Wah Cantt 47040, Pakistan
2
Department of Earth Sciences, Quaid-i-Azam University, Islamabad 45320, Pakistan
3
School of Civil Engineering and Surveying, University of Southern Queensland, Springfield Central, QLD 4300, Australia
4
School of Engineering, Deakin University, Geelong, VIC 3216, Australia
*
Author to whom correspondence should be addressed.
Sustainability 2021, 13(18), 10164; https://doi.org/10.3390/su131810164
Submission received: 18 August 2021 / Revised: 7 September 2021 / Accepted: 8 September 2021 / Published: 10 September 2021

Abstract

:
Concrete is an important construction material. Its characteristics depend on the environmental conditions, construction methods, and mix factors. Working with concrete is particularly tricky in a hot climate. This study predicts the properties of concrete in hot conditions using the case study of Rawalpindi, Pakistan. In this research, variable casting temperatures, design factors, and curing conditions are investigated for their effects on concrete characteristics. For this purpose, water–cement ratio (w/c), in-situ concrete temperature (T), and curing methods of the concrete are varied, and their effects on pulse velocity (PV), compressive strength (fc), depth of water penetration (WP), and split tensile strength (ft) were studied for up to 180 days. Quadratic regression and artificial neural network (ANN) models have been formulated to forecast the properties of concrete in the current study. The results show that T, curing period, and moist curing strongly influence fc, ft, and PV, while WP is adversely affected by T and moist curing. The ANN model shows better results compared to the quadratic regression model. Furthermore, a combined ANN model of fc, ft, and PV was also developed that displayed higher accuracy than the individual ANN models. These models can help construction site engineers select the appropriate concrete parameters when concreting under hot climates to produce durable and long-lasting concrete.

1. Introduction and Background

In the era of globalization and immense focus on the construction of critical facilities, various construction materials and their properties are investigated by researchers worldwide. In line with this wave of construction, ordinary Portland concrete (OPC) has emerged as one of the commonly used construction materials [1]. The mechanical and physical properties of concrete are complex in comparison to other materials, since these are influenced by the environment, especially hot conditions [2]. Placing concrete in hotter conditions and climates presents additional challenges [3]. In addition to the hotter temperatures, high ambient air temperature, high wind speeds, low relative humidity, and direct solar radiation or exposure to sunlight also affect the properties of concrete. These factors contribute to rapid water evaporation that negatively affects concrete [4,5,6]. Accordingly, structures constructed in hotter conditions require large funding for annual repairs, maintenance, and rehabilitation.
Concrete can develop undesirable characteristics when mixed, transported, or placed in hot weather. Hot climate adversely affects concrete, leading to increased mix water demand, increased slump loss and plastic shrinkage, decreased setting times, difficulty in finishing, and diminished control of entrained air content [7]. Further, hot weather concreting leads to increased evaporation, changes in w/c, reduced strength, and lower workability. The hot climate also leads to a decrease in the ultimate strength of concrete. In addition, it increases the formation of cracks and decreases the durability of concrete. Plastic shrinkage and cracking of concrete are increased in windy, dry, and hot climates. Such cracking results in an increased corrosion of steel [8]. Thus, to have more sustainable and durable concrete, it is imperative to investigate the effect of climate conditions on concrete.
The elevated temperature in hot climates leads to the increased evaporation of water in concrete. The slump loss is also increased, which increases the difficulty in transporting and placing the concrete. To maintain the needed workability and slump loss, admixtures are added to the concrete. Further, different concreting methods and technologies are used to deal with these issues while concreting in hot climates. These include the addition of self-curing admixtures [5], phase change materials [9], ground granulated blast furnace slag [10], date palm fibers [11], and other materials. Similarly, concrete with modified properties such as self-compacting concrete [10] and high-strength flowable concrete [12], as well as the use of various curing techniques, have also been reported in the pertinent literature. In line with these studies, the current study targets this area and investigates the effects of high temperature on the properties of concrete in a hot climate zone (Rawalpindi, Pakistan). The study highlights the best curing method and w/c for concreting in such hot climates. The impact of the hot climate on the properties of concrete is analyzed in this study using artificial neural network (ANN) and regression models. In this study, first, the ANN and regression models are used to forecast the characteristics of concrete in hot climates. Then, the results are compared to find the most accurate forecasting method for predicting concrete properties.
ANN is an advanced computing technique and a powerful analysis tool for dealing with nonlinear and complex generalizations. It acts like a human brain when processing a problem. ANN models use many layers and activation functions to analyze the data. It has become a popular technique because of its sophisticated computing power. It can learn from experience by analyzing the huge amount of data fed to it, known as the training data. It adapts by assigning weights to variables and adjusting them accordingly [13,14,15].
ANN models are incredibly adaptive and can solve many civil engineering problems. Due to this adaptability, these are used to model nonlinear multivariant relationships between setting time and strength of concrete [16]. These have also been used by researchers for developing prediction models for reservoir discharge calculations [17], municipal solid waste management [18], rainfall prediction [19], sediment transport [20], and rock strength prediction [21]. al-Swaidani and Khwies [22] developed an ANN model to investigate five parameters for predicting the properties of concrete. These parameters include the curing period, w/c, volcanic scoria, and super plasticizer content. The authors used 21 different mixes of concrete with three w/c: 0.5, 0.6, and 0.7. Similarly, Wu [23] used the radial basis function with an ANN model to predict the 28 day strength of concrete.
Regression is the second technique used in this study. It has been used in multiple concrete-related studies. For example, a multiple linear regression model was used by Kiambigi et al. to forecast the strength of concrete using its w/c, mix design ratios, and properties of aggregates [24]. These factors were used for forecasting the strength of concrete after 7, 14, 28, 56, 112, and 180 days of curing. Similarly, in another study, a regression model was used to investigate the impact of various curing techniques on the strength of concrete [25]. The authors prepared 69 samples of concrete, cured them using different techniques, and performed water penetration (WP) tests to find the strength.
The current paper centers around the utilization of computational methods (ANN and Regression) to forecast the compressive strength (fc), depth of WP, ultrasonic pulse velocity (PV), and split tensile strength (ft) of concrete at high temperatures. Concrete’s properties are very sensitive to changes in temperature. For example, Farzampour [26] analyzed the impact of low temperature on fc of concrete and found that concrete does not perform well below 15 °C. Further, the fc of concrete is reduced by 20% at such temperatures. Another study highlighted that the properties of concrete are affected by different types of environments (unsheltered, sheltered, and laboratory environments) [27]. Similarly, the bond strength of concrete is affected by salts (NaCl solution). Accordingly, the bond strength is reduced by 32%, 28%, and 8% in the first year when exposed to salts. Thus, it is evident that concrete properties are affected by different environments. As a result, researchers are actively investigating the effects of different types of environments on concrete properties.
Overall, the factors that affect the characteristics of concrete are w/c, curing time and method, and temperature [28]. However, the effects of hot climates on concrete properties have not been rigorously investigated, presenting a gap targeted in the current study. Among the few relevant studies targeting this area, Nasir et al. [29] explored the influence of the hot climate of UAE on the properties of concrete. However, a comprehensive study has not been conducted for concreting in the hot climate of Pakistan so far. This gap is targeted in the current study. For this purpose, ANN and regression models are used in the current study to forecast the characteristics of the concrete in hot climates. These models can help the construction engineers and site managers to develop durable and tough concrete suitable for hot climatic conditions.

1.1. Concreting under Hot Climate

Favorable characteristics of concrete can be achieved by following the global standards of the American Concrete Institute (ACI), the American Society for Testing and Materials (ASTM), and the British Standards (BS). ACI 305 recommends keeping the concrete evaporation rate under 1 kg/m2 to avoid plastic shrinkage. According to ACI 305.1−06, the in-situ temperature of concrete should be less than 35 °C. Different techniques can be used to maintain this temperature, such as shading the aggregate stockpiles, sprinkling water on coarse aggregate stockpiles, using cold water or ice as mix water, and quick placement and finishing [30]. Mouret et al. [31] investigated the effects of aggregates temperature between 20 and 70 °C on concrete properties. The authors outline that the water requirement will increase with the increase in aggregates temperature, causing the fc of concrete to decrease by 15%. Hasanain et al. [32] studied the impacts of using shaded and non-shaded aggregates on fresh concrete characteristics. The investigation highlighted that shaded aggregates reduce the loss of mixing water by 50% compared to non-shaded aggregates.
Similarly, various studies considered the effect of placement, distribution, and mixing on the characteristics of fresh concrete [33,34,35,36]. These studies revealed that maintaining the evaporation rate of mix water under 0.2 kg/m2 controlled the development of plastic shrinkage cracks. Further, delaying the mixing time and casting between 40–60 min has no negative influence on concrete characteristics.
Almusallam [37] prepared concrete samples in a special chamber at an atmospheric temperature of 30 to 45 °C. The author concluded that casting the samples at a higher temperature increases the fc of concrete initially. However, it will go down after some time. Kim et al. [38] prepared concrete samples using different types of cement and checked the effect of curing temperature on the samples. The temperature was kept between 10 to 50 °C, and the fc and ft of concrete were observed. By curing the concrete for up to 28 days, the authors found that the strength increases at an early age with an increase in the temperature and then goes down at later ages. Klieger [39] reported that increasing the curing temperature at the initial stages for up to seven days will increase the strength of concrete. However, after seven days, the samples made at 41 °C observe a strength reduction up to 15% compared to the sample prepared at 23 °C or below. Nasir et al. [40] and Ortiz et al. [33] stated that ideal characteristics of concrete are attained when the temperature difference between atmosphere and concrete is minimum. This is because the temperature difference between concrete and the atmosphere elevates the escape of moisture from concrete to the atmosphere. This results in the development of microcracks, causing loss of strength and life of the concrete structure.
w/c is an important concrete parameter that affects the properties of concrete [41]. ACI318 and BS8110 suggested using a low w/c if the structure is to be exposed to severe atmospheric conditions. Similarly, for maintaining workability, the recommendation is to use water-reducing admixtures. Al-Amoudi and Maslehuddin [42] found that if the w/c is less than 0.45, the permeability of concrete will be reduced. Ait-Aider et al. [43] recommended using high w/c under hot climate conditions. According to the authors, hot weather has no negative effect on the fc of concrete. The authors discussed that evaporation increases in hot weather. Therefore, a high w/c should be used in hot climates so that water is available for hydration reaction and workability is not disturbed. ACI 318 recommends using lower w/c with a proper quantity of admixture to achieve the optimum workability and strength conditions.
Curing is another significant parameter to be considered when concreting under hot weather conditions. It is used to complete the hydration of cement in hot weather by controlling the temperature and moisture movement in and out of the concrete [44,45]. Selecting the most suitable curing technique depends on labor, budget, and w/c [28]. Sldozian and Hamad [46] explored the effects of different curing techniques on the fc of concrete. The authors used immersive, quickened warm water and wet gunny bag curing strategies. As per the authors, immersive curing is the best technique among the three, giving high-strength concrete. Reddy [47] evaluated the effects of different curing methods on the fc of concrete and argued that the pond curing method shows an accurate result compared to the other methods. Usman and Isa [48] also checked the effects of different curing methods on the fc of concrete using four methods: immersion, sprinkling, polythene sheeting, and sharp sand coating. The authors reported that water immersion and sprinkling are more effective curing methods. Thus, different curing methods, supplemented with additional steps on a case-to-case basis, can be used when curing concrete under different conditions.

1.2. Models to Predict Properties of Concrete

Usage of numerical and analytical models has resulted in saving time and resources in defining the characteristics of concrete based on their quick, predictive analytics. Similar to its industrial counterparts, various computing models have been successfully introduced in civil engineering. These include ANN, convolutional neural network (CNN), recurrent neural network, and others [49,50]. For example, CNN has been used to detect cracks in concrete structures from images [51]. These have also been used to estimate concrete’s fc based on analyses of images captured with a digital microscope [52]. ANN models have been used to investigate the effects of recycled aggregates on concrete properties [53]. It is one of the most effective and popular techniques that has proven to be useful over time for concrete studies [14,54].
Based on specific curing methods and mixed design parameters, the fc of concrete can be predicted using ANN. Yeh [55] and Kim et al. [56] developed ANN models for forecasting the fc of concrete. Lai and Serra [16] used ANN for forecasting the fc of high-performance concrete when aggregates with varying characteristics were used. Nehdi et al. [57] used it to forecast concrete slump, filling capacity, and segregation. Sancak [58] used it to forecast the bond strength of lightweight aggregates. Demir [59] forecasted elastic moduli for concrete with normal and high strength using the ANN model. Similarly, Atici [60] used it to study the effects of different quantities of fly ash and slag on concrete’s strength. A key advantage of ANN is that it does not require any information when adapting to a new problem. This property is pivotal to its usage in the current study, where concreting in a hot climate is investigated.
The rest of the paper is organized as follows. In Section 2, the reasons for selection of the study area are discussed. In Section 3, the development of ANN and regression models is discussed. The material and sample preparation are also discussed in this section. In Section 4, results are discussed, and key findings are stated. Finally, Section 5 concludes the study and presents its futuristic expansion areas and limitations.

2. Study Area

Rawalpindi, a city in the Punjab province of Pakistan, is located near the federal capital Islamabad. The climatic conditions in Rawalpindi are extreme due to the excessive urbanization in the city [61]. The city experiences five different seasons: summer, winter, autumn, spring, and monsoon. In summer, the hottest month is June, with the highest recorded temperature of 48.3 °C recorded on 13 June 1953 [62]. On the other hand, January is the coldest month with the lowest recorded temperature of −3.9 °C recorded on 17 January 1967 [63].
Rawalpindi is one of the rapidly developing cities of Pakistan [61]. Many mega construction projects such as river courtyard, river loft, river hills 4, and grand millennium are under construction in the city. Many more projects are planned for the near future. The extreme summer temperature in Rawalpindi negatively affects the properties of concrete. The associated hot weather accelerates the cement hydration. Hot weather also increases the difficulty of mixing, transporting, placing, consolidating, and finishing concrete works [64]. This decreases the strength and increases the crack formation in concrete. Likewise, warm climate conditions speed up surface vanishing, and plastic shrinkage in concrete leads to crusting and other issues. As a result, a lot of money is spent annually to maintain the concrete structures in Rawalpindi city. Therefore, there is a need for a study of concrete properties to eliminate the negative effects of hot weather on concrete structures in Rawalpindi in line with the modern smart cities and societies initiatives [65,66,67,68,69].
Owing to this, various researchers have investigated the civil infrastructure of Rawalpindi city and proposed mitigation measures to deal with relevant issues. Some of the relevant studies include designing energy-efficient intelligent buildings [70], solid waste management [64], the impact of urbanization on ground water [71], seismic mapping [72], construction management [73,74], transportation issues [61], and crises in megaprojects [75]. In terms of concrete-related research, some relevant studies are focused on seismic demand for low-rise reinforced concrete buildings [76], the effects of adding coconut fiber to concrete [77], and enhancing the hardened properties of recycled concrete through synergistic incorporation of fiber reinforcement and silica fume [78]. However, a study focused on the prediction of properties of concrete in the region has not been conducted to date. which is the humble contribution of the current study. With many new projects such as the Ring Road and the Naya Pakistan Housing Scheme (involving the construction of more than 1000 houses and associated infrastructure) announced for the Rawalpindi region, such studies must be conducted.

3. Materials and Methods

Figure 1 shows the overview of the method adopted in this study. First, the literature related to the properties of concrete was studied. Then, four characteristics of concrete were selected that greatly influence its properties. These include the fc, WP, PV, and ft. This research develops an ANN model for the accurate prediction of concrete characteristics in a hot climate. Two models were developed for this purpose: regression and ANN. The sampling procedure of the study is focused on variable curing methods, as these greatly influence the properties of concrete. To select the best curing method, samples were prepared, and tests were conducted to predict the fc, WP, PV, and ft of concrete. Based on the results, the best curing method was selected. Afterward, prediction models were developed using ANN and regression for predicting the properties of the concrete samples. These models were trained and tested subsequently. The results of the models were evaluated based on the values of R2, mean absolute error (MAE), and Root-mean-square error (RMSE). Scatter plots were developed to compare the results. Based on this, the model with the most accurate predictions is recommended in the study to be adopted for predicting the properties of concrete in hot regions.
Overall, the study is conducted in three steps: material and concrete sample preparation, sample assessments, and prediction model development. These are explained subsequently.

3.1. Materials and Sample Preparation

The experiments of this study were carried out in Rawalpindi, Pakistan, from May 2021 to August 2021. The reason for using these months is that these mark the peak of summers in Rawalpindi, Pakistan. First, using ordinary Portland cement with coarse aggregate (ASTM C 33 size # 67), cubic and cylindrical specimens were prepared. Crushed limestone, with a specific gravity of 2.6% and water absorption of 1.1%, was used in the process. Similarly, sand dunes with fine aggregate having a specific gravity of 2.56% and water absorption of 0.6% were used in the study. A total of twelve different concrete mixtures were prepared for this experiment with the following design parameters:
  • The density of aggregate was 2600 kg/m3;
  • The concrete used in the experiment had a mix ratio of 1:2:4;
  • Portland cement prepared by the Maple Leaf company was used in the experiment;
  • The initial and final setting times of concrete were 30 and 60 min, respectively;
  • The aggregate fineness was 2250 cm2/g, which was tested using the Blaine air permeability method;
  • Soundness was consistent with 10 mm fineness using the Le-Chatelier method;
  • Super Plasticizer was added equivalent to 0.1% of the cement weight;
  • Casting was done at an identical time from 10 am to 12 pm throughout the summertime with an atmospheric temperature of 34–38 °C;
  • The slump value was between 75 to 125 mm, obtained using the proper number of superplasticizers;
  • The quantity of cement used was 350 kg/m3;
  • The coarse to fine aggregate ratio was 1.8 (by weight).
For the concrete mix design, the following conditions or criteria were ensured:
  • Three different variants of w/c were used: 0.298, 0.398, and 0.448;
  • The concrete temperature was set at 23, 30, 36, and 43 °C. This was accomplished by warming and chilling the aggregate in sunlight and the lab environment;
  • Curing techniques included immersion (set in the lab at 22 ± 3 °C), wet burlap, and water sprinkling twice a day (in the field), and sprinkling curing compound on the sample after demolding;
  • A variable interval of curing was used.
The monthly variations in the relative humidity, rainfall, temperature, length of sunlight, and wind velocity in Rawalpindi were considered, for which the data are available at http://www.pakistan.climatemps.com/ (accessed on 17 August 2021). The altitude considered in this study was 508m. Further, the specimens cured using burlap or the moist curing technique were introduced to the laboratory under field conditions. A total of 36 samples were collected and tested after 14 days of initial curing.

3.2. Assessment of Concrete Performance

In the current study, the performance of the concrete was determined through assessments of its mechanical properties and durability characteristics. Three specimens were tested each time after 3, 7, 28, 90, and 180 days of curing. The water depth penetration test was performed on the 28th day of curing. The following conditions were maintained during the experiment:
  • Compressive strength (fc): according to BS 1881−116, the fc of concrete was determined using a 100 mm cube sample;
  • Split tensile strength (ft): by following the procedure stated by ASTM C 496, the ft was determined using cylindrical concrete specimens with a 75 mm diameter and a height of 150 mm;
  • Ultrasonic pulse velocity (PV): similar to fc, the ultrasonic pulse velocity of concrete was determined using 100 mm cube specimens following ASTM C 597;
  • Depth of water penetration (WP): following the procedure reported in DIN 1048, a water pressure (5 bar) was applied to the sample for 72 h to determine WP depth.

3.3. Models Development

The models used to find concrete properties were the quadratic regression and the ANN models. These are subsequently discussed.

3.3.1. Quadratic Regression

Quadratic regression models are used to assess the relation between reliant and independent variables [79]. The general form of a quadratic equation is presented in Equation (1).
Y = ax2+ bx + c
In Equation (1), x is independent, and Y is the dependent variable. Further, “a” is the model intercept, whereas “b” and “c” are the vectors for model coefficients. For estimating the model coefficients, the least square method is used [29]. The significance of the coefficients is tested using student’s t distribution at an assurance level of 5%. The final or most reliable model is the one for which the coefficients of associated parameters are higher than the t-estimation with a probability of 5% [80].

3.3.2. Artificial Neural Network

ANN gives an approximate output by estimating the weights and constant values for every hidden neuron and reducing the error in the target values. For each input x, a corresponding weight w signifies how strongly it influences the output. The neuron output (Y) is calculated using Equation (2):
Y = f (b + W X)
where Y is the output, X is the input given to the model by the previous layer, b is the proportional constant, and W is the weight given to each variable X. The value of Y is calculated using an activation function [81]. Commonly used activation functions are Sigmoid, ReLU, and Tan h.
In the ANN model, learning algorithms are used to approximate weights and constants. Backpropagation is the most used learning algorithm. First, it appraises the weights and constants. Then, it calculates the inaccuracies for out of sight values in the output layer. Finally, the weights and constants are updated [82]. The ANN models utilized in this research were developed using the conjugate gradient backpropagation (CGB) method. The CGB technique maximizes the weights and constants besides the conjugate gradient path [83]. Then, the constants and weights participating in forecasting every characteristic of concrete are inputted into the model. Figure 2 provides an overview of the generic ANN model.
In the input layer, each X represents the individual features of samples in the data set that are inputted into the model. Every input is linked to each unit in the hidden layer. Each link between the layers moves the output from the preceding layer to the next layer as an input. Weights are assigned to all connections. The input received from previous layers is multiplied by the assigned weight at the particular connection. In the training of the ANN model, the data set is used to adjust the weights assigned through iteration. During this process, the assigned weights are optimized using the backpropagation method. RMSE and MAE are used to measure the performance of the model. The weighted sum is computed along each connection to the neuron. The sum is passed on to the activation function in the output layer, which transforms the result into a number between 0 and 1.

3.3.3. Statistical Calculations

Statistical application SPSS® was used to analyze the predicted concrete properties (WP, ft, fc, and PV). W/c, age of concrete, and in situ temperature were used as independent variables to predict the properties of concrete. Age of concrete was not used as an input in the model because WP was measured after 28 days. The models’ accuracy is checked and compared using RMSE, R2, and MAE shown in equations 3 to 5. R2 highlights the closeness of the cluster of data to the trend line. The associated values, ranging from 0 to 1, show the closeness of every data point to the trend line.
R 2 = 1 Σ y i y i 2 Σ y i y 2
RMSE = Σ y i y i 2 n
MAE = Σ | y i y i n
where y is the expected value of the dependent variable and n is the number of samples.
ANN and regression were used to develop the prediction models to determine the properties of concrete. Further, a combined ANN model of ft, fc, and PV was also developed to check the combined effect of these variables on concrete properties. Each model requires two-thirds of the data points to be selected randomly. The rest of the data points are used to test and train the model.

4. Results and Discussion

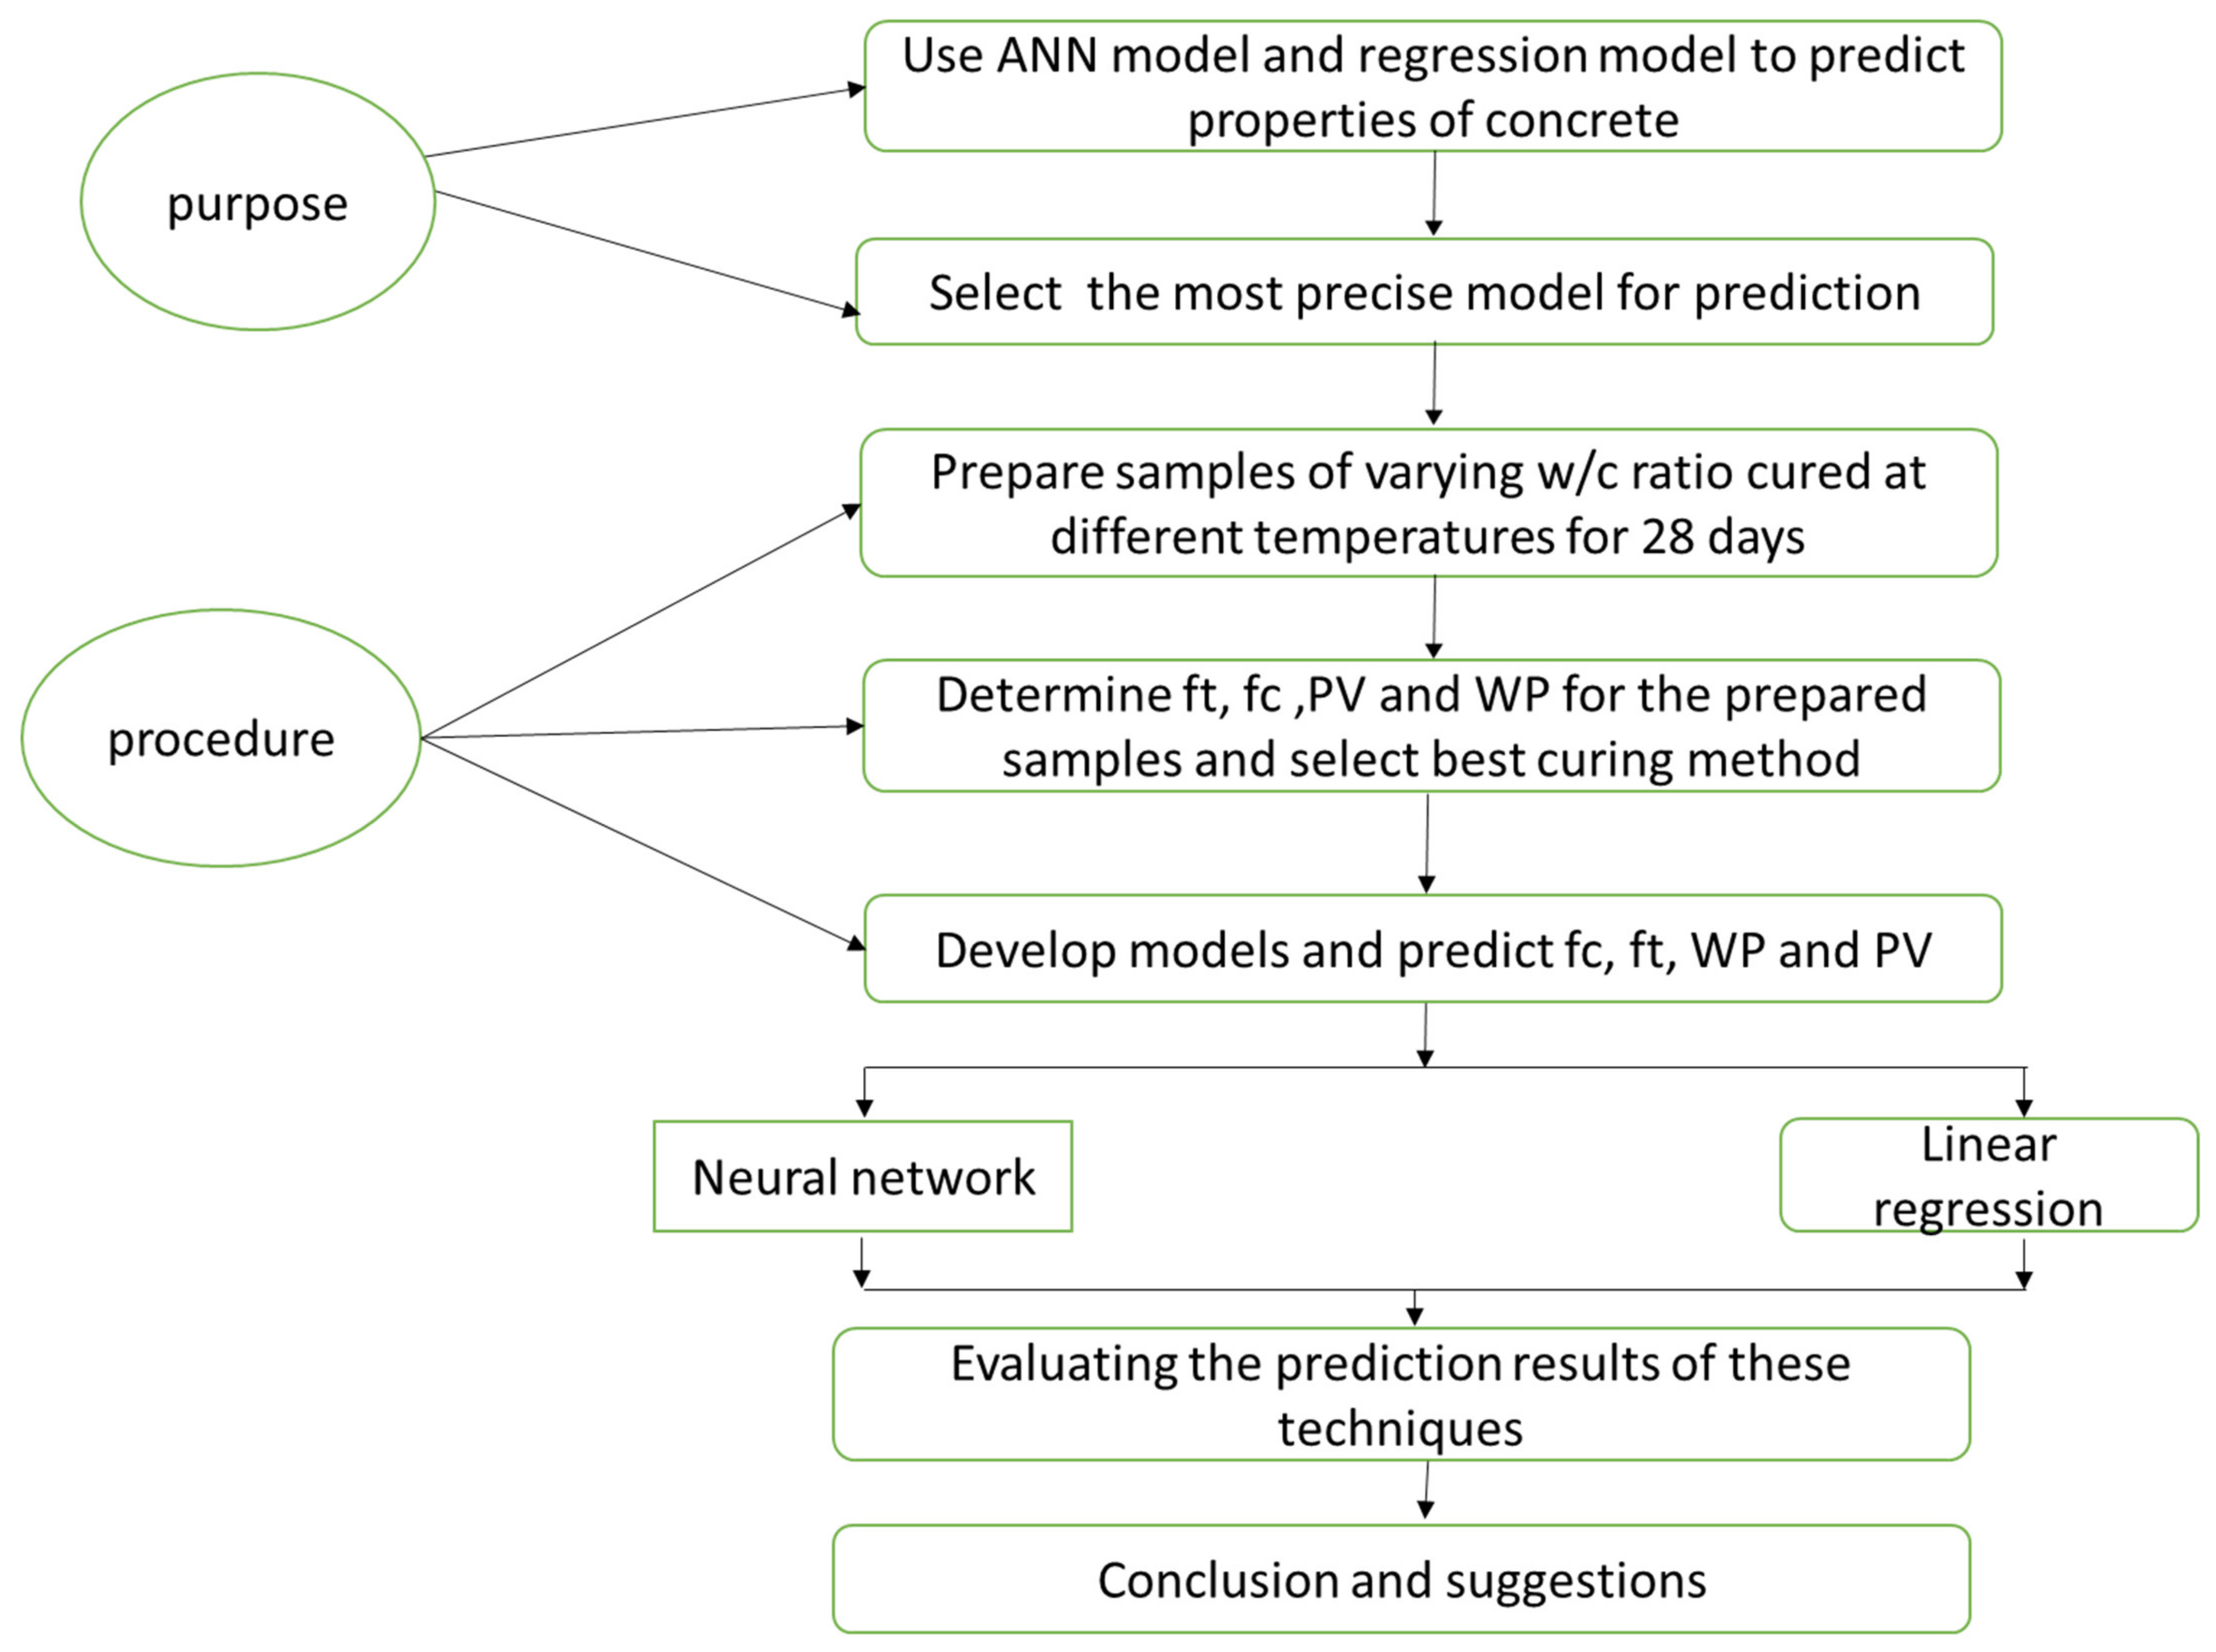
Based on the method adopted in the study, first, the properties of the concrete samples were tested in the laboratory. The test results are discussed subsequently.

4.1. Properties of the Concrete Sample

Table 1 shows the mechanical characteristics and WP of concrete samples cured for 28 days. It shows different curing methods used at varying temperatures in the current study and their effects on the concrete properties. This was done to choose the best curing method when concreting in a hot climate. Overall, three curing methods are used in this study.
When the w/c is increased, it causes a decrease in ft, fc, and WP, whereas, by increasing the temperature, ft, fc, and PV values are increased. In the first curing method, the concrete is cured by submerging it in water. The results show that, for a w/c of 0.298, the values of fc, ft, and PV are 30.75, 2.94, and 4282, respectively. Similarly, for a w/c of 0.398, the values of fc, ft, and PV are 24.45, 2.57, and 4182. Whereas for a w/c of 0.448, the values of fc, ft, and PV are 20.55, 2.29, and 4142. From these values, a decreasing trend in fc, ft, and PV can be observed with the increase in w/c. Similarly, the increase in the values of concrete properties can be observed when the temperature is increased. In the first method, concrete samples were cured by immersing the samples in water at varying temperatures of 23 °C, 30 °C, 43 °C, and 36 °C. After 28 days, tests were carried out, and fc, ft, PV, and WP were determined. The samples with a w/c of 0.298 gave the highest fc compared to other w/c values. At 43 °C, the fc is observed to be 35.85 Mpa, which is the highest among all alternatives. Further, the value of PV is also the highest (4352 m/s at 43 °C) at a w/c of 0.298, showing superior concrete quality. The maximum tensile strength of 3.23 Mpa is observed at 43 °C at the same w/c. WP value of 16mm is obtained at 30 °C. In comparison, the w/c of 0.398 and 0.448 have lower fc, ft, WP, and PV values. This shows that the sample prepared with a w/c of 0.298 at 43 °C gives superior quality concrete in hot climates such as Rawalpindi.
In the second method, curing is done by covering the concrete with wet burlap. In this method, water is sprayed on the concrete, and burlap blankets are placed over it. The burlap side of the blanket faces down towards the concrete. Burlap is made of natural moisture-absorbing fibers that retain moisture. It also shields the surface of the water from direct exposure to sunlight. Identical samples with the same w/c are prepared that are cured using wet burlap to determine the fc, ft, PV, and WP. In this case, the highest fc (46.75 Mpa) and PV (4372 m/s) were observed at a w/c of 0.298 at 30 °C. The maximum ft (3.95 Mpa) is observed at a w/c of 0.298 at 23 °C. Further, the lowest WP (27 mm) is observed at 0.298 w/c at 30 °C. Based on these results, it can be concluded that superior quality concrete cured using wet burlaps can be obtained at a w/c of 0.298 at 30 °C.
In the third method, curing compounds are used to cure the concrete. Concrete treatment agent SPEC Chen SC 500 is used for curing concrete in this method. SPEC Chen SC 500 is sprinkled over the surface of the concrete. The compound minimizes the evaporation of concrete water, which helps in preventing shrinkage cracking. Afterward, the properties of concrete are determined using similar steps as mentioned in the first two methods. For this technique, the sample prepared with w/c of 0.298 at 30 °C gives the maximum fc (43.95 Mpa), ft (3.63 Mpa), and PV (4352 m/s) compared to other w/c values. This ratio also gives the lowest WP value (35 mm). By comparing the results from all methods in Table 1, it can be concluded that using a w/c of 0.298 at an in situ temperature of 30 °C and covering the aggregate with wet burlap, concrete with improved characteristics can be obtained that is best suited for use in hot climates.

4.2. Results and Discussion of Quadratic Regression Models

Based on the developed quadratic regression models, the results and discussions are presented below. Scatter plots are presented and discussed subsequently, where the observed and predicted values are presented on the x-axis and y-axis, respectively. For fc, ft, and PV, the data were collected up to 180 days, while, for WP, the data were collected up to 36 days. Table 2, Table 3, Table 4, Table 5 and Table 6 present the values of regression models for WP, fc, ft, and PV, respectively. The variables significantly impacting the model are included in the final regression model. The t-values and their corresponding p-values show the chances of prediction deviation from the mean. Thus, the larger the absolute t-value and the smaller the p-value, the greater the evidence shown against the null hypothesis. The predictions are considered more accurate when the corresponding p-values are less than 5%. Figure 3, Figure 4 and Figure 5 show the observed and predicted values for each regression model.

4.2.1. WP Results Using Quadratic Regression Models

Table 2 presents the results of the quadratic regression model for WP. Accordingly, wet burlap and moist curing have a p-value of less than 5%, highlighting their greater impacts on WP. When a curing substance is utilized, the value of mentioned variables will be 0 due to their direct relation. Therefore, variables of all curing compounds are not statistically significant in the model. The variables having a p-value greater than 5% means that their chances of occurring are rare. If their t-value is 0, it validates the null hypothesis and shows flaws in the predictions. The null hypothesis, in this case, states that there is no connection between the two groups of data sets.
Table 2. Regression model results for water penetration.
ParameterEstimated Valuet-Valuep-Value
Intercept123.77.480
Moist curing−19.53−13.970
Wet burlap−8.17−5.160
w/c67.847.120
T−5.85−5.60
T20.26.80
R20.87
RMSW-Training3.23
RMSE-Test4.32
MAE-Training3.14
MAE-test4.03
w/c and T are significant variables; T has a second-degree impact on the model. WP is negatively affected by wet burlap and moist curing, as is evident from the negative estimated t-value of these variables. WP is directly proportional to the rise and fall of w/c. Since WP depends on permeability and there are no notable changes throughout curing, it is not much affected by the curing period. WP has a higher R2 value of 0.87. The associated data of this model on a scatter plot are spaced closely around the trend line, as shown in Figure 3. Such a close alliance of the scatter points around the trend line shows the accuracy of the developed model.
The values of RMSE and MAE are 4.32 and 4.03, as shown in Table 2. The value of R2, when closer to 1, shows that the actual values and predicted values are closely aligned. On the other hand, if the R2 value is closer to 0, it shows greater variation between actual and predicted values. The zero value of p shows the accuracy of the estimated values. The t-value is used to check the accuracy of the estimated value; thus, with the values of t moving farther from 0, the accuracy of prediction is increased. The negativity or positivity of the numbers does not matter, as absolute values are considered for t-values. The estimated value of the intercept is 123.7, having a t-value of 7.48 and a p-value of 0. The p-value for moist curing, w/c, wet burlap, T, and T 2 is zero, representing the correctness of the prediction. Similarly, the t-values of moist curing, w/c, T, T 2 , and wet burlap shows the difference in the mean of samples. These correspond to the standard deviation of data from the group mean. The lower deviations from the mean show that the standard error is in an acceptable range.
Figure 3 presents the graph of the R2 value for WP of the concrete sample. A limitation of R2 is that it cannot predict the data bias. Accordingly, the value can be low for a very good model and vice versa. Because of these shortcomings of R2 values, graphical representations are used to get clear results. The graph is plotted between observed and predicted values. The centerline represents the data pattern known as the trend line or the regression line. The model predicts the change in Y when X increases by one unit. If the data points are clustered around the trend line, it shows coherence between the model predicted values and observed values, highlighting the fitness of the model for accurate forecasting. In Figure 3, data points are clustered around the trend line, signifying the accuracy of results and the fitness of the developed prediction model. The training data points range from (21, 23) to (80, 80), whereas the testing data set ranges from (20, 20) to (80, 80) on the scatter plot. Thus, the testing data set shows a positive correlation between observed and predicted WP values.

4.2.2. Compressive and Split Tensile Strength Results Using Quadratic Regression Models

The values of fc and ft estimated using the regression model are presented in Table 3 and Table 4. The associated values highlight that curing methods (except moist curing) do not cause a noteworthy change in the fc. Further, T and t have a second-degree relationship with the fc. Moist curing is directly proportional to fc and results in an increase in the fc. Similarly, T and the age of concrete increases the fc. The values of R2 are 0.835 and 0.89 for ft and fc of the predicted model, which are closer to one, signifying the accuracy of the results. Predicted and observed values are uniformly dispersed around the trend line in the associated scatter plots, as shown in Figure 4 and Figure 5. In comparison to other studies, the regression model developed by Othman et al. [84] shows a value of R2 as 0.93 when determining fc. Similarly, the regression model developed by Pichumani et al. [85] gave a value of R2 as 0.99 when predicting ft. Though their studies show superior results, the contexts were different in their studies that affect prediction accuracy; hence, these may not be comparable to the current study in terms of contexts. Nevertheless, the values of R2 are in an acceptable range in the current study.
The values of RMSE and MAE represent the reliability of predictions of the regression model. In this study, the values of RMSE for training and testing data sets are 7.87 and 8.84 for fc. The MAE has values of 6.97 and 7.634 for fc, as shown in Table 3. For ft, the values of RMSE for training and testing are 0.318 and 0.362, as shown in Table 4. Similarly, for MAE, the values are 0.267 and 0.316 for training and testing, respectively, to estimate ft. Thus, the values of errors for the training and testing data sets are very similar, implying that the models developed for fc and ft are fit for predictions.
Table 3. Regression model results for estimating compressive strength.
ParameterEstimated Valuet-Valuep-Value
Intercept−34.818−1.8340
Moist curing7.3385.580
T6.1655.7540
t0.6414.440
T2−0.08−3.510
t20.008−7.5320
R20.89
RMSE-Training7.87
RMSE-Test8.839
MAE-Training6.97
MAE-Test7.634
Table 4. Regression model for estimating split tensile strength.
ParameterEstimated Valuet-Valuep-Value
Intercept0.7811.1160.321
Moist curing0.2423.6820
T0.132.3430.018
t0.05410.8770
T20.004−2.1020.042
t20.004−6.5020
R20.835
RMSE-Training0.318
RMSE-Test0.362
MAE-Training0.267
MAE-Test0.316
The p-value from Table 4 (0.321) implies that the probability of rejecting the null hypothesis is lower. Since the p-value is greater than 0.05, the probability of our predictions being correct is reduced. However, since the t-value, which represents the deviation from the group mean of two samples, is 1.116, the standard error in the data is very low. This increases the confidence in the prediction results. For moist curing, the p-value is 0, implying higher reliability of predicted values. The associated t-value (3.682) provides proof to reject the null hypothesis. For T, the value of p is 0.018, which is less than 0.05 and represents a greater probability of the correctness of predictions. This is supported by a higher value of t. Again, the predictions are accurate for t, t2, and T2, as evidenced from the lower p-value and higher t-values. Figure 4 shows the scatter plot of fc developed using the regression model with the observed values on the x-axis and predicted values on the y-axis. The data are evenly clustered around the trend line, which shows that the model is suitable for prediction. This is further supported by the high R2 value.
In comparison to other studies, Saravanakumar [86] developed a regression model to predict the fc of concrete. The R2 value of their model is 0.8. In comparison, the current study shows superior values and more reliable predictions. The training data set ranges from (20, 24) to (80, 80), whereas the testing data set ranges from (20, 20) to (80, 80) on the scatter plot, as is evident from Figure 4. These values show a positive correlation.
Figure 5 shows the scatter plot of ft developed using the regression model. The cluster of data concentrated around the trend line shows that the model for ft is highly accurate. This is supported by the high R2 value, showing a high correlation between the predicting and testing data sets. Furthermore, for ft, low values of RMSE and MAE are obtained, which further validates the reliability of the model. The training data set ranges from (2, 2) to (6.5, 6.5), and the testing data set ranges from (1.9, 1.5) to (6.5, 6.5) on the scatter plot, showing a positive correlation. In comparison to published studies, Hassan and Arman [87] developed a regression model for predicting the ft. The value of R2 predicted by their model is 0.674 with MAE and RMSE values of 0.288 and 0.364, respectively. The current study shows superior values and prediction performance.

4.2.3. Pulse Velocity Results Using the Regression Models

According to Table 5, all the variables (except T and t) have significant effects on PV. These factors have a positive impact on the model’s predictions. Whereas T and t have a second-degree impact on the prediction. The data on the scatter plot are closely aligned with the trend line, as shown in Figure 6. The value of R2 for the PV regression model is 0.66, showing acceptable model accuracy. However, since the value is not close to 1, the prediction accuracy is lower. PV has the lowest R2 value compared to the other regression models (fc, ft, and WP). The main reason for this variation is the higher uncertainty around input and output variables. This is because multiple variables that affect the PV are unknown. Compared to other published studies, Chandak and Pawade [88] developed a regression model to predict the PV where a value of 0.947 was obtained for the coefficient of the correlation. Similarly, Godinho et al. [89] developed a regression model to predict PV where an R2 value of 0.89 is obtained. These models show superior performance to the current study.
Table 5. Regression model for pulse velocity.
ParameterEstimated Valuet-Valuep-Value
Intercept3622.85419.4290
Moist curing92.3513.940
Wet burlap40.231.2740.019
T27.2391.3810.027
t3.7684.6390
T2−0.25−1.8850.021
t2−0.016−4.8320
R20.66
RMSE-Training63.834
RMSE-Test71.819
MAE-Training53.495
MAE-Test59.754
As shown in Table 5, the p-values of intercept, moist curing, t, and t 2 are zero, implying a higher probability of accurate predictions. The p-value of wet burlap, T, and T 2 are 0.019, 0.027, and 0.021, again signifying the accuracy of predictions. These are complemented by a higher t-value of the intercept, representing a lesser deviation between the actual and predicted values. The values of training data sets range from (41, 41) to (44.8, 44.8), and the testing data sets range from (41, 41) to (44.8, 44.8) on the scatter plot, as shown in Figure 6. These values show a positive correlation. In Figure 6, the cluster of data is closer to the trend line and is evenly distributed, highlighting the reliability and accuracy of the model.

4.3. Results and Discussion of the ANN Models

Table 6 lists the predicted properties of concrete prepared under a hot climate using ANNs models. ANNs models were developed to reduce the square error difference between experimental and forecasted values. This was achieved by iterating the hidden neuron weights using the learning algorithm. The scatter plots for all data points of the developed ANN models are presented in Figure 7, Figure 8, Figure 9 and Figure 10. Accordingly, both the experimental and forecasted data on the scatter plot are observed to be equally spread and closely aligned with the trend line, signifying the accuracy of results in the figures. A combined ANN model was also developed to check the combined effect of fc, ft, and PV. WP was not included in the combined ANN model because the tests needed to be carried out after 28 days of curing. For normalization of the values, the variables were preprocessed using the min–max function, as shown in equation 6. In equation 6, X’ is the normalized value and X is the observed value, whereas min and max represent the minimum and maximum values of variables [90].
X’ = XMin/MaxMin
Table 6. Results of ANN models for predicting the properties of concrete.
ParameterANN Models
WPfcftPV
TypeMLPMLPMLPMLP
Variable normalizationMin–maxMin–maxMin–maxMin–max
Hidden layer activation functionHyperbolicHyperbolicHyperbolicHyperbolic
Input/output layer activation functionLinearLinearLinearLinear
Number of hidden layers1111
Number of hidden neurons6845
Learning algorithmCGBCGBCGBCGB
Error functionSum-squaredSum-squaredSum-squaredSum-squared
R20.920.940.880.94
RMSE-Training3.0482.480.90117.216
RMSE-Test2.8343.170.91321.847
MAE-Training2.6032.130.86913.778
MAE-Test2.3882.750.88418.224
As shown in Table 6, R2 values of WP, fc, ft, and PV are close to 1, showing the prediction accuracy of the model. RMSE and MAE of training and testing models, mentioned in Table 6, represent the errors in the analyses. For WP, fc, and ft, the values of RMSE and MAE are very small, showing that the model’s predictions are very accurate. However, the values for PV, MAE, and RMSE are higher, indicating more errors in the results. These errors may be associated with human error in recording the data, the model’s inability to properly analyze the data, or incorrect selection of the number of hidden layers. The activation function provides the output at all nodes. It is a hyperbolic function in ANN models and provides values ranging from −1 to 1.
The layer between input and output layers is known as the hidden layer. In the current ANN model, one hidden layer is used for WP, fc, ft, and PV. It is very important to determine the number of hidden layers because, if too many hidden layers are used, the neurons will remember the data well but will not generalize it properly. On the other hand, if the number of neurons is too low, the neurons will generalize the data well, but the patterns will not be remembered well. Therefore, in this ANN model, six neurons are used for predicting WP, eight for fc, four for ft, and five for PV.
Compared to other published studies, Mai et al. [87] developed an ANN model to predict the fc of concrete. Their model showed an R2 value of 0.9285, and RMSE and MAE as 4.4266 and 3.2971, respectively. In the model developed by Yousif et al. [91], ANN was used to predict the PV of concrete that displayed an R2 value of 0.94. Vineela et al. [92] developed an ANN model to predict the ft of concrete where a value of 0.98 was obtained for R2. For WP prediction using ANN, Mustafa et al. [93] developed a model that displayed an R2 value of 0.98. The current study results are comparable to these relevant studies and show identical results for the ANN model used to predict properties of concrete in hot climates.
The values for both training and testing data sets range from (20, 20) to (80, 80) on the scatter plot in Figure 7. Each data point represents observed and predicted WP on the x-axis and y-axis, respectively. Compared to the values obtained from the regression model for WP in the current study, the R2 of the ANN model (0.92) is superior to that of the regression model (0.87). This shows that the correlation between the testing and training data sets of the ANN model is higher than that of the regression model developed in the current study.
Figure 7. Scatter plot of water penetration developed using ANN model.
Sustainability 13 10164 g007
Further, the values of RMSE and MAE for the training regression model are 3.23 and 3.14, which are greater than the ANN model (3.048 and 2.603). The same observations are made for the RMSE and MAE values of the testing data sets of the regression model (4.32, 4.03), which are also higher than the ANN model (2.834, 2.388). This highlights that the ANN model gives more accurate predictions with the least errors. Hence, the ANN model’s prediction capabilities are more accurate compared to the regression model. Similar observations were made by Sarkar and Pandey [94], who used an ANN model to predict the WP of concrete and obtained an R2 value of 0.92.
Different ANN models were tried by varying the number of hidden layers, activation function, and neurons in the current study. The accuracies for all models were estimated and recorded. It was observed that the maximum accuracy is given by the activation function with one hidden layer. Some minor errors were observed in the model values. At least two hidden layers are required in combined ANN models due to the higher complexity within the problem. A maximum of seven neurons has been used in the developed models, while the minimum number is three. For example, seven neurons are used to predict fc, while three neurons are used for predicting ft. The neurons connect the input and output variables. Thus, the variables with greater correlation will necessitate more neurons. The number of neurons does not significantly affect the processing time, nor does it require some special computational package.
ANN models displayed superior results than the quadratic regression models. In all cases, the value of R2 for the ANN model is greater than the values obtained by the regression model. Scatter plots of ANN models for determining fc, ft, and PV are shown in Figure 8, Figure 9 and Figure 10. The ANN models have fewer variations compared to the regression models. There is a large difference between the accuracy of ANN and the regression models for fc, ft, and PV, where ANN models show superior predictions. Further, the scatter plots for these parameters in the regression models are impractical as they display more predicted values to be out of range.
The combined ANN model of fc, ft, and PV shows a higher prediction accuracy for determining all the parameters, as shown in Table 7. Furthermore, R2, RMSE, and MAE values for the combined model are improved in comparison to the previous ANN models. For fc, the data on the scatter plot are spread widely but equally around the trend line, as shown in Figure 11, highlighting data accuracy. The corresponding R2 value is 0.96, which is close to one, indicating more reliability. The ft data on the scatter plot follow a similar trend as shown in Figure 12, with an R2 value of 0.95. Similarly, for PV data the R2 value is 0.9. The closer concentration around the trendline for the values of fc, ft, and PV represents higher accuracy of the combined ANN model for determining the characteristics of concrete prepared in a hot climate.
The values for fc of the concrete in the training and testing data sets range from (20, 20) to (80, 80) on the scatter plot and display a positive correlation, as shown in Figure 8. In comparison to the regression model, the R2 value has improved from 0.93 in the regression model to 0.94 in the ANN model. Thus, the ANN model gives a superior performance in both training and testing phases. In comparison to other studies, Abuodeh et al. [95] used a back-propagation neural network model to predict the fc of concrete where the R2 value of 80.1 is obtained. In comparison, the current study shows superior results.
Figure 8. Scatter plot of compressive strength established using ANN model.
Sustainability 13 10164 g008
Figure 9 shows the ft predictions using the ANN model. The training and testing data sets range from (2, 1.5) to (6.8, 6.8) on the scatter plot in Figure 9, displaying a positive correlation. In comparison to the R2 value of the regression model (0.835), there is an improvement in the value of R2 of the ANN model (0.88). Further, the correlation between training and testing data sets of the ANN model is improved in comparison to the regression model. However, the RMSE values for the training and testing data sets of the regression model were 0.318 and 0.362, compared to 0.901 and 0.913 for ANN. Thus, compared to the regression model, the ANN model has more RMSE error value for ft prediction, but high R2. In comparison to published studies, Gülbandılar and Koçak [96] predicted the ft of concrete using the ANN model and obtained an R2 value of 0.90, which is very close to the findings of the current study.
Figure 9. Scatter plot of split tensile strength using ANN model.
Sustainability 13 10164 g009
Figure 10 shows the values for PV using the ANN model. The scatter plot in Figure 10 shows that the training and testing data sets range from (41, 41) to (45, 45), showing a positive correlation. In comparison, the R2 value of the regression model is very low (0.66) compared to the ANN model (0.94). Thus, there is a weak correlation between testing and training data sets in regression model when compared to the ANN model. The values of RMSE and MAE further support this. These are 71.819 and 59.754 for the regression model and 21.847 and 18.224 for the ANN model. Thus, the ANN model has less error and a high correlation between testing and training data sets compared to the regression model. Therefore, the ANN model is more accurate in predicting PV. In comparison to published studies, Trtnik et al. [14] developed an ANN model to predict the PV of concrete where the R2 value of 0.84 was obtained. The current ANN model shows superior results. As discussed in Section 4.3, a combined ANN model was also developed in the current study. This model combines all the previously developed ANN models to improve the predictions. The combined ANN model uses a CGB learning algorithm with one hidden layer and nine neurons. Table 7 shows the results of the combined ANN model for predicting the properties of concrete. The R2 values of fc, ft, and PV obtained through this model are above 0.9, reflecting higher prediction accuracy.
Figure 10. Scatter plot of pulse velocity for concrete using ANN model.
Sustainability 13 10164 g010
In comparison to other studies, Yue et al. [97] developed an ANN model to predict fc, ft, elastic modulus, and concrete slump. The resulting R 2 values obtained for these properties were above 0.94. The current study shows similar results for fc and ft. In the current study, the R2 values of the combined ANN model are higher than the individual ANN models of fc, ft, and PV. Thus, the combined ANN model has improved prediction accuracy in comparison to individual ANN models. Therefore, the combined ANN model should be used for forecasting characteristics of concrete with more accuracy.
As shown in Figure 11, the values for both training and testing data sets range from (20, 20) to (80, 80) on the scatter plot, showing a positive correlation. Figure 11 shows the predicted fc values using the combined ANN model. R2 of fc for the combined ANN model is 0.96, which is improved in comparison to the initial ANN model (0.94). This shows that the combined ANN model has a better correlation between testing and training data set models than the individual models. The value of RMSE and MAE for the combined ANN model for the testing data sets are 3.287 and 2.771, which are improved in comparison to the individual ANN (3.17 and 2.75). The errors in both combined and individual models remain the same. Hence, the combined ANN model is better at predicting the fc of concrete with the same errors. In comparison to other studies, Uchechukwu and Austin [98] obtained an R2 value of 0.97 for fc. The current study has nearly similar results.
Figure 11. Scatter plot of compressive strength developed using combined ANN model.
Sustainability 13 10164 g011
Figure 12 shows the ft values obtained from the combined ANN model. As shown in Figure 12, the training data set ranges from (1.6, 1.6) to (6.6, 6.7) on the scatter plot for predicting the ft of concrete using the combined ANN model. The testing data set ranges from (1.6, 1.5) to (6.5, 6.5) on the scatter plot, showing a positive correlation.
Figure 12. Scatter plot of split tensile strength developed using combined ANN model.
Sustainability 13 10164 g012
The R2 value for ft using the combined ANN model is 0.95, compared to 0.88 for the individual ANN model, showing superior performance. The values of RMSE and MAE for the testing data sets of the combined ANN model are 0.805 and 0.784, compared to 0.913 and 0.884 for the individual ANN model. This shows that the individual ANN models have more errors than the combined ANN model. The combined ANN model has a high R2 value, better correlation between training and testing data sets, and fewer errors. Therefore, the combined model is more suitable for predicting the ft of concrete.
In this study, regression models, ANN models, and a combined ANN model for predicting the properties of concrete were developed. The models were used to predict concrete properties (fc, ft, PV, and WP) when prepared in hot climates. In the studies by Nikoo et al. [99], an R2 value of 0.899 was obtained when predicting the fc of concrete. In comparison, the current model gives a value of 0.96, showing better performance and increased reliability for both testing and training models. In another study by Nikoo et al. [100], R2 values of 0.880, 0.993, and 0.946 were for training, validation, and testing phases when determining concrete strength. In comparison, the values obtained in this study are higher. Similarly, Ray et al. [101] determined the value of R2 for ft to be 0.958, which is the same as the current study, thus validating the results. Further, Yousif et al. [91] determined the R2 for PV to be 0.93, whereas the current combined ANN model gave a value of 0.97, showing superior performance. Therefore, based on the above comparisons, the combined ANN model developed in the current study is better at predicting the properties of concrete and is recommended to be used for such purposes.

4.4. Comparison of the Results with Previous Studies

Table 8 compares the ANN models developed in this study with previous studies. It must be noted that the models developed by previous researchers are not for concrete prepared in hot climatic conditions. Therefore, variations in values are expected. However, since both are based on ANN models, the studies are presented here to compare the model performance.
In the ANN model by Naderpour et al. [102], an R2 value of 0.9 was obtained to forecast fc of concrete that is lower than the value in the current study, as shown in Table 8. Keshavarz and Torkian [54] developed an ANN model to predict the fc of concrete, where they obtained an R2 value of 0.942. Similarly, Yeh [55] developed an ANN model to predict the fc of high-performance concrete where an R2 value of 0.914 was obtained. Yeh and Lien [103] obtained an R2 value of 0.9338. Chou et al. [104] obtained a value of 0.9091. These values are less than the R2 value of 0.96 displayed by the model developed in the current study. Thus, the current model shows superior performance.
For ft, Karthiyaini et al. [105] developed an ANN model to predict ft of concrete and obtained an R2 value of 0.94. Behnood et al. [106] obtained an R2 value of 0.89. Again, these values are lower than the R2 value of the model for ft developed in the current study (0.95).
Similarly, for PV, Nasir et al. [29] developed an ANN model that shows an R2 value of 0.88 which is lower than the 0.97 forecasted in this research. Based on these, the current model humbly improves the predictions of concrete parameters using ANN models.
Overall, in this paper, a combined ANN model has been developed to check the combined effect of fc, ft, and PV, as shown in Table 8, that has not been considered in previous studies. A key contribution of this study is the consideration of concreting under hot climates that the previous ANN models have not considered. The ANN model established in this research can help forecast concrete characteristics under hot climatic conditions with greater accuracy. In addition to the widely used R2 value, the current study also used RMSE and MAE to measure the accuracy of the developed models. This is because the R2 value does not depend on the output, and, hence, measuring accuracy solely based on the R2 value may not be the best approach when developing or testing ANN models.

5. Conclusions

The properties of concrete are highly affected by environmental conditions whose adverse effects are more pronounced in hot climates. Rawalpindi, Pakistan was used as a case study area in the current study to determine the characteristics of concrete in a hot climate. Different samples were prepared by varying the curing techniques, in situ temperatures, and w/c to study the mechanical properties of concrete prepared in a hot climate. It was found that the desirable characteristics of concrete can be achieved using a w/c of 0.298, in situ temperature of 30 °C, and covering it with wet burlap for curing. ANN and quadratic regression models are used in this study to develop prediction models for analyzing concrete properties.
The quadratic regression model had higher accuracy in predicting the fc, ft, PV, and WP. However, for PV, its accuracy was low. From the results of the regression models, it can be inferred that T had a secondary impact on the regression model, w/c had a direct relationship with the WP, and moist curing had a great linear impact on all studied properties of concrete. Further, WP is not much affected by the age of concrete after 28 days, while the age of concrete had a secondary impact on other characteristics of concrete. Furthermore, moist curing, t, and T positively influenced fc, ft, and PV, while WP was adversely affected by T and moist curing.
The ANN models were more accurate than the quadratic regression model. A combined ANN model was also developed, giving more precise predications than independent ANN models of fc, ft, and PV. The combined ANN model is more accurate and reliable for designing and predicting properties of concrete in hot climates. A higher number of neurons were needed for a smaller number of samples. Overall, the combined ANN model displayed R2 values of 0.96, 0.95, and 0.97 for fc, ft, and PV that are superior to other published studies. Thus, the combined ANN model in this paper humbly improves the predictions of concrete properties while applying it to a hot climate zone.
A limiting factor of the current model is its accuracy in predicting PV. The MAE and RMSE values for PV are 71.819 and 59.754, showing lesser accuracy of the model for predicting PV. Thus, in the future, the PV-related considerations of the current model could be improved. Further, this study used a limited number of samples that should be increased to improve the accuracy of the experimental results in the future. Furthermore, this research only deals with predicting four properties of concrete: fc, WP, PV, and ft. It does not deal with the thermal properties of concrete that can also affect the properties of concrete under hot climates. Thus, the thermal properties that influence concrete, such as specific heat, mass loss, conductivity, and diffusivity, should be added to the model in the future. Finally, the developed ANN model uses the CGB method only. In the future, other algorithms such as the fletcher reeves conjugate gradient algorithm, powellbeale conjugate algorithm, Shanno (BFGS), scaled conjugate gradient backpropagation, quasi newton algorithm, and one step secant backpropagation could be used to enhance the efficiency of the developed models.

Author Contributions

Conceptualization, A.M., B.A., M.E.G., F.U. and A.N.; methodology, A.M., B.A. and M.E.G.; software, B.A. and M.E.G.; validation, A.M., B.A., M.E.G., F.U. and A.N.; formal analysis, A.M., B.A. and M.E.G.; investigation, A.M., B.A. and M.E.G.; resources, F.U., A.Z.K. and M.A.P.M.; data curation, A.M., B.A., M.E.G., F.U., A.N., A.Z.K. and M.A.P.M.; writing—original draft preparation, A.M., B.A. and M.E.G.; writing—review and editing, F.U.; visualization, A.M., B.A., M.E.G., F.U. and A.N.; supervision, A.M., B.A. and F.U.; project administration, A.M., B.A. and F.U.; funding acquisition, A.Z.K. and M.A.P.M. All authors have read and agreed to the published version of the manuscript.

Funding

This research received no external funding.

Institutional Review Board Statement

Not applicable.

Informed Consent Statement

Not applicable.

Data Availability Statement

The data is available with the first author and can be shared upon reasonable request.

Conflicts of Interest

The authors declare no conflict of interest.

References

  1. Naik, T.R. Sustainability of concrete construction. Pract. Period. Struct. Des. Constr. 2008, 13, 98–103. [Google Scholar] [CrossRef] [Green Version]
  2. Naus, D.J.; Graves, H.L. A review of the effects of elevated temperature on concrete materials and structures. In Proceedings of the International Conference on Nuclear Engineering, Miami, FL, USA, 17–20 July 2006. [Google Scholar]
  3. Nasir, M. Effect of Casting Temperature and Curing Regime on Mechanical Properties and Durability of Concrete; King Fahd University of Petroleum and Minerals (Saudi Arabia): Dhahran, Saudi Arabia, 2013. [Google Scholar]
  4. Walker, M. Guide to the Construction of Reinforced Concrete in the Arabian Peninsula; Walker, M., Ed.; CIRIA/The Concrete Society: London, UK, 2002. [Google Scholar]
  5. Rizzuto, J.P.; Kamal, M.; Elsayad, H.; Bashandy, A.; Etman, Z.; Roos, M.N.A.; Shaaban, I.G. Effect of self-curing admixture on concrete properties in hot climate Conditions. Constr. Build. Mater. 2020, 261, 119933. [Google Scholar] [CrossRef]
  6. Al-Amoudi, O.; Maslehuddin, M.; Shameem, M.; Ibrahim, M. Shrinkage of plain and silica fume cement concrete under hot weather. Cem. Concr. Compos. 2007, 29, 690–699. [Google Scholar] [CrossRef]
  7. Madi, M.; Refaat, N.; Negm El Din, A.; Ziada, F.; Mazen, M.; Ahmed, S.; Hamza, A.S.; El Nahas, E.; Fathy, A.; Fahmy, E.H.; et al. The impact of mixing water temperature on portland cement concrete quality. In Proceedings of the CSCE Annual Conference, Vancouver, WA, Canada, 31 May–3 June 2017. [Google Scholar]
  8. Matalkah, F.; Jaradat, Y.; Soroushian, P. Plastic shrinkage cracking and bleeding of concrete prepared with alkali activated cement. Heliyon 2019, 5, e01514. [Google Scholar] [CrossRef] [PubMed] [Green Version]
  9. Hasan, A.; Al-Sallal, K.A.; Alnoman, H.; Rashid, Y.; Abdelbaqi, S. Effect of phase change materials (PCMs) integrated into a concrete block on heat gain prevention in a hot climate. Sustainability 2016, 8, 1009. [Google Scholar] [CrossRef] [Green Version]
  10. Yahiaoui, W.; Kenai, S.; Menadi, B.; Kadri, E.-H. Durability of self compacted concrete containing slag in hot climate. Adv. Concr. Constr. 2017, 5, 271. [Google Scholar]
  11. Kriker, A.; Debicki, G.; Bali, A.; Khenfer, M.; Chabannet, M. Mechanical properties of date palm fibres and concrete reinforced with date palm fibres in hot-dry climate. Cem. Concr. Compos. 2005, 27, 554–564. [Google Scholar] [CrossRef]
  12. Hassan, E.-C.; Ibrahim, A. The performance of high-strength flowable concrete made with binary, ternary, or quaternary binder in hot climate. Constr. Build. Mater. 2013, 47, 245–253. [Google Scholar]
  13. Lee, S.-C. Prediction of concrete strength using artificial neural networks. Eng. Struct. 2003, 25, 849–857. [Google Scholar] [CrossRef]
  14. Trtnik, G.; Kavčič, F.; Turk, G. Prediction of concrete strength using ultrasonic pulse velocity and artificial neural networks. Ultrasonics 2009, 49, 53–60. [Google Scholar] [CrossRef] [Green Version]
  15. Ni, H.-G.; Wang, J.-Z. Prediction of compressive strength of concrete by neural networks. Cem. Concr. Res. 2000, 30, 1245–1250. [Google Scholar] [CrossRef]
  16. Lai, S.; Serra, M. Concrete strength prediction by means of neural network. Constr. Build. Mater. 1997, 11, 93–98. [Google Scholar] [CrossRef]
  17. Cheng, C.; Chau, K.; Sun, Y.; Lin, J. Long-term prediction of discharges in Manwan Reservoir using artificial neural network models. In International Symposium on Neural Networks; Springer: Berlin/Heidelberg, Germany, 2005. [Google Scholar]
  18. Xiao, G.; Ni, M.-J.; Chi, Y.; Jin, B.-S.; Xiao, R.; Zhong, Z.-P.; Huang, Y.-J. Gasification characteristics of MSW and an ANN prediction model. Waste Manag. 2009, 29, 240–244. [Google Scholar] [CrossRef] [PubMed]
  19. Abhishek, K.; Kumar, A.; Ranjan, R.; Kumar, S. A rainfall prediction model using artificial neural network. In Proceedings of the 2012 IEEE Control and System Graduate Research Colloquium, Shah Alam, Malaysia, 16–17 July 2012; IEEE: Shah Alam, Malaysia, 2012. [Google Scholar]
  20. Afan, H.A.; El-Shafie, A.; Yaseen, Z.M.; Hameed, M.M.; Mohtar, W.H.M.W.; Hussain, A. ANN based sediment prediction model utilizing different input scenarios. Water Resour. Manag. 2015, 29, 1231–1245. [Google Scholar] [CrossRef]
  21. Khandelwal, M.; Armaghani, D.J. Prediction of drillability of rocks with strength properties using a hybrid GA-ANN technique. Geotech. Geol. Eng. 2016, 34, 605–620. [Google Scholar] [CrossRef]
  22. Al-Swaidani, A.M.; Khwies, W.T. Applicability of artificial neural networks to predict mechanical and permeability properties of volcanic scoria-based concrete. Adv. Civ. Eng. 2018, 2018, 1–16. [Google Scholar] [CrossRef]
  23. Wu, N.-J. Predicting the Compressive Strength of Concrete Using an RBF-ANN Model. Appl. Sci. 2021, 11, 6382. [Google Scholar] [CrossRef]
  24. Kiambigi, M.; Gwaya, A.; Koteng, D. Concrete Strength Prediction using Multi-Linear Regression Model: A case study of Nairobi Metropolitan. Int. J. Soft Comput. Eng. 2019, 8, 11–20. [Google Scholar]
  25. Olonade, K.A.; Fitriani, H.; Kola, O.T. Regression models for compressive strength of concrete under different curing conditions. In Proceedings of the MATEC Web of Conferences; EDP Sciences: Les Ulis, France, 2017. [Google Scholar]
  26. Farzampour, A. Compressive behavior of concrete under environmental effects. In Compressive Strength of Concrete; IntechOpen: New York, NY, USA, 2019. [Google Scholar]
  27. Ismail, M.; Egba, E.I. Effects of climate and corrosion on concrete behaviour. In AIP Conference Proceedings; AIP Publishing LLC: Melville, NY, USA, 2017. [Google Scholar]
  28. James, T.A.; Malachi, E.; Gadzama, A. Anametemok; Effect of curing methods on the compressive strength of concrete. Niger. J. Technol. 2011, 30, 14–20. [Google Scholar]
  29. Nasir, M.; Gazder, U.; Maslehuddin, M.; Al-Amoudi, O.S.B.; Syed, I.A. Prediction of properties of concrete cured under hot weather using multivariate regression and ANN Models. Arab. J. Sci. Eng. 2020, 45, 4111–4123. [Google Scholar] [CrossRef]
  30. Raza, A.; Memon, B.A.; Oad, M. Effect of Curing Types on Compressive Strength of Recycled Aggregates Concrete. Quaid-E-Awam Univ. Res. J. Eng. Sci. Technol. Nawabshah. 2019, 17, 7–12. [Google Scholar]
  31. Mouret, M.; Bascoul, A.; Escadeillas, G. Drops in concrete strength in summer related to the aggregate temperature. Cem. Concr. Res. 1997, 27, 345–357. [Google Scholar] [CrossRef]
  32. Hasanain, G.; Khallaf, T.; Mahmood, K. Water evaporation from freshly placed concrete surfaces in hot weather. Cem. Concr. Res. 1989, 19, 465–475. [Google Scholar] [CrossRef]
  33. Ortiz, J.; Aguado, A.; Agullo, L.; Garcia, T. Influence of environmental temperatures on the concrete compressive strength: Simulation of hot and cold weather conditions. Cem. Concr. Res. 2005, 35, 1970–1979. [Google Scholar] [CrossRef] [Green Version]
  34. Kayyali, O. Effect of certain mixing and placing practices in hot weather on the strength of concrete. Build. Environ. 1984, 19, 59–63. [Google Scholar] [CrossRef]
  35. Alshamsi, A.; Imran, H.; Bushlaibi, A. Drying Shrinkage of Conrete Samples Exposed to Extreme Hot Weather. In Cement Combinations for Durable Concrete, Proceedings of the International Conference held at the University of Dundee, Scotland, UK, 5–7 July 2005; Thomas Telford Publishing: London, UK, 2005. [Google Scholar]
  36. Al-Negheimish, A.I.; Alhozaimy, A.M. Impact of extremely hot weather and mixing method on changes in properties of ready mixed concrete during delivery. ACI Mater. J. 2008, 105, 438. [Google Scholar]
  37. Almusallam, A.A. Effect of environmental conditions on the properties of fresh and hardened concrete. Cem. Concr. Compos. 2001, 23, 353–361. [Google Scholar] [CrossRef]
  38. Kim, J.-K.; Han, S.H.; Song, Y.C. Effect of temperature and aging on the mechanical properties of concreteart I. Experimental results. Cem. Concr. Res. 2002, 32, 1087–1094. [Google Scholar] [CrossRef]
  39. Klieger, P. Effect of mixing and curing temperature on concrete strength. J. Proc. 1958, 54, 1063–1081. [Google Scholar]
  40. Nasir, M.; Al-Amoudi, O.S.B.; Maslehuddin, M. Effect of placement temperature and curing method on plastic shrinkage of plain and pozzolanic cement concretes under hot weather. Constr. Build. Mater. 2017, 152, 943–953. [Google Scholar] [CrossRef]
  41. Chu, S. Effect of paste volume on fresh and hardened properties of concrete. Constr. Build. Mater. 2019, 218, 284–294. [Google Scholar] [CrossRef]
  42. Al-Amoudi, O.M.M. Rasheeduzzafar “Permeability of Concrete: Influential Factors”. In Proceedings of the Deterioration and Repair of Reinforced Concrete in the Arabian Gulf, Manama, Bahrain, 10–13 October 1993. [Google Scholar]
  43. Ait-Aider, H.; Hannachi, N.; Mouret, M. Importance of W/C ratio on compressive strength of concrete in hot climate conditions. Build. Environ. 2007, 42, 2461–2465. [Google Scholar] [CrossRef]
  44. Hameed, A.H. The effect of curing condition on compressive strength in high strength concrete. Diyala J. Eng. Sci. 2009, 2, 35–48. [Google Scholar]
  45. Neville, A.M. Properties of Concrete; Longman: London, UK, 1995. [Google Scholar]
  46. Sldozian, R.J.A.; Hamad, A.J. Influence of Different Curing Ways on the Properties of Concrete. Glob. Res. Dev. J. Eng. 2019, 4, 2455–5703. [Google Scholar]
  47. Reddy, K.K. A Comparative Study on Methods of Curing Concrete–Influence of Humidity. Int. J. Eng. Res. Appl. (IJERA) 2013, 3, 1161–1165. [Google Scholar]
  48. Usman, N.; Isa, M.N. Curing methods and their effects on the strength of concrete. J. Eng. Res. Appl. 2015, 5, 107–110. [Google Scholar]
  49. Munawar, H.S.; Ullah, F.; Khan, S.I.; Qadir, Z.; Qayyum, S. UAV Assisted Spatiotemporal Analysis and Management of Bushfires: A Case Study of the 2020 Victorian Bushfires. Fire 2021, 4, 40. [Google Scholar] [CrossRef]
  50. Aslam, B.; Maqsoom, A.; Khalid, N.; Ullah, F.; Sepasgozar, S. Urban Overheating Assessment through Prediction of Surface Temperatures: A Case Study of Karachi, Pakistan. ISPRS Int. J. Geo-Inf. 2021, 10, 539. [Google Scholar] [CrossRef]
  51. Li, S.; Zhao, X. Image-based concrete crack detection using convolutional neural network and exhaustive search technique. Adv. Civil. Eng. 2019. [Google Scholar] [CrossRef] [Green Version]
  52. Jang, Y.; Ahn, Y.; Kim, H.Y. Estimating compressive strength of concrete using deep convolutional neural networks with digital microscope images. J. Comput. Civ. Eng. 2019, 33, 04019018. [Google Scholar] [CrossRef]
  53. BKA, M.A.R.; Ngamkhanong, C.; Wu, Y.; Kaewunruen, S. Recycled aggregates concrete compressive strength prediction using artificial neural networks (ANNs). Infrastructures 2021, 6, 17. [Google Scholar]
  54. Keshavarz, Z.; Torkian, H. Application of ANN and ANFIS models in determining compressive strength of concrete. J. Soft Comput. Civ. Eng. 2018, 2, 62–70. [Google Scholar]
  55. Yeh, I.-C. Modeling of strength of high-performance concrete using artificial neural networks. Cem. Concr. Res. 1998, 28, 1797–1808. [Google Scholar] [CrossRef]
  56. Kim, J.-C. Application of Neural Networks for Estimation of Concrete Strength. J. Mater. Civ. Eng. 2005, 17, 738–739. [Google Scholar] [CrossRef]
  57. Nehdi, M.; Djebbar, Y.; Khan, A. Neural network model for preformed-foam cellular concrete. Mater. J. 2001, 98, 402–409. [Google Scholar]
  58. Sancak, E. Prediction of bond strength of lightweight concretes by using artificial neural networks. Sci. Res. Essays 2009, 4, 256–266. [Google Scholar]
  59. Demir, F. Prediction of elastic modulus of normal and high strength concrete by artificial neural networks. Constr. Build. Mater. 2008, 22, 1428–1435. [Google Scholar] [CrossRef]
  60. Atici, U. Prediction of the strength of mineral admixture concrete using multivariable regression analysis and an artificial neural network. Expert Syst. Appl. 2011, 38, 9609–9618. [Google Scholar] [CrossRef]
  61. Mehmood, Y.; Zahoor, H.; Ullah, F. Economic-Efficiency Analysis of Rawalpindi Bypass Project: A Case Study. In INNOVATIVE PRODUCTION AND CONSTRUCTION: Transforming Construction through Emerging Technologies; World Scientific: Singapore, 2019; pp. 531–555. [Google Scholar]
  62. Asghar, A.; Ali, S.M.; Yasmin, A. Effect of climate change on apple (Malus domestica var. ambri) production: A case study in Kotli Satian, Rawalpindi, Pakistan. Pak. J. Bot. 2012, 44, 1913–1918. [Google Scholar]
  63. Khan, A.A.; Ashraf, M.I.; Malik, S.U.; Gulzar, S.; Amin, M. Spatial trends in surface runoff and influence of climatic and physiographic factors: A case study of watershed areas of Rawalpindi district. Soil Environ. 2019, 38, 181–191. [Google Scholar] [CrossRef]
  64. Akmal, T.; Jamil, F. Assessing Health Damages from Improper Disposal of Solid Waste in Metropolitan Islamabad–Rawalpindi, Pakistan. Sustainability 2021, 13, 2717. [Google Scholar] [CrossRef]
  65. Qayyum, S.; Ullah, F.; Al-Turjman, F.; Mojtahedi, M. Managing smart cities through six sigma DMADICV method: A review-based conceptual framework. Sustain. Cities Soc. 2021, 72, 103022. [Google Scholar] [CrossRef]
  66. Ullah, F.; Qayyum, S.; Thaheem, M.J.; Al-Turjman, F.; Sepasgozar, S.M. Risk management in sustainable smart cities governance: A TOE framework. Technol. Forecast. Soc. Chang. 2021, 167, 120743. [Google Scholar] [CrossRef]
  67. Ullah, F.; Sepasgozar, S.M.; Shirowzhan, S.; Davis, S. Modelling users’ perception of the online real estate platforms in a digitally disruptive environment: An integrated KANO-SISQual approach. Telemat. Inform. 2021, 63, 101660. [Google Scholar] [CrossRef]
  68. Ullah, F.; Sepasgozar, S.M.; Thaheem, M.J.; Al-Turjman, F. Barriers to the digitalisation and innovation of Australian Smart Real Estate: A managerial perspective on the technology non-adoption. Environ. Technol. Innov. 2021, 22, 101527. [Google Scholar] [CrossRef]
  69. Ullah, F.; Sepasgozar, S.M.; Thaheem, M.J.; Wang, C.C.; Imran, M. It’s all about perceptions: A DEMATEL approach to exploring user perceptions of real estate online platforms. Ain Shams Eng. J. 2021, in press. [Google Scholar] [CrossRef]
  70. Ali, Q.; Thaheem, M.J.; Ullah, F.; Sepasgozar, S.M. The Performance Gap in Energy-Efficient Office Buildings: How the Occupants Can Help? Energies 2020, 13, 1480. [Google Scholar] [CrossRef] [Green Version]
  71. Ul Haq, F.; Naeem, U.A.; Gabriel, H.F.; Khan, N.M.; Ahmad, I.; Rehman, H.U.; Zafar, M.A. Impact of Urbanization on Groundwater Levels in Rawalpindi City, Pakistan. Pure Appl. Geophys. 2021, 178, 491–500. [Google Scholar] [CrossRef]
  72. Khan, S.; Waseem, M.; Khan, M.A. A Seismic Hazard Map Based on Geology and Shear-wave Velocity in Rawalpindi–Islamabad, Pakistan. Acta Geol. Sin. Engl. Ed. 2021, 95, 659–673. [Google Scholar] [CrossRef]
  73. Ullah, F.; Thaheem, M.J.; Siddiqui, S.Q.; Khurshid, M.B. Influence of Six Sigma on project success in construction industry of Pakistan. TQM J. 2017, 29, 1754–2731. [Google Scholar] [CrossRef]
  74. Sheikh, N.A.; Ullah, F.; Ayub, B.; Thaheem, M.J. Labor productivity assessment using activity analysis on semi high-rise building projects in Pakistan. Eng. J. 2017, 21, 273–286. [Google Scholar] [CrossRef]
  75. Iftikhar, R.; Müller, R.; Ahola, T. Crises and Coping Strategies in Megaprojects: The Case of the Islamabad–Rawalpindi Metro Bus Project in Pakistan. Proj. Manag. J. 2021, 52. [Google Scholar] [CrossRef]
  76. Ahmad, S.; Pilakoutas, K.; Khan, Q.U.Z.; Mehboob, S. Seismic Demand for Low-Rise Reinforced Concrete Buildings of Islamabad–Rawalpindi Region (Pakistan). Arab. J. Sci. Eng. 2018, 43, 5101–5117. [Google Scholar] [CrossRef]
  77. Ahmad, W.; Farooq, S.H.; Usman, M.; Khan, M.; Ahmad, A.; Aslam, F.; Yousef, R.A.; Abduljabbar, H.A.; Sufian, M. Effect of coconut fiber length and content on properties of high strength concrete. Materials 2020, 13, 1075. [Google Scholar] [CrossRef] [Green Version]
  78. Ali, B.; Ahmed, H.; Qureshi, L.A.; Kurda, R.; Hafez, H.; Mohammed, H.; Raza, A. Enhancing the hardened properties of recycled concrete (RC) through synergistic incorporation of fiber reinforcement and silica fume. Materials 2020, 13, 4112. [Google Scholar] [CrossRef] [PubMed]
  79. Binder, J.J. On the use of the multivariate regression model in event studies. J. Account. Res. 1985. [Google Scholar] [CrossRef]
  80. Ives, A.R. For testing the significance of regression coefficients, go ahead and log-transform count data. Methods Ecol. Evol. 2015, 6, 828–835. [Google Scholar] [CrossRef]
  81. Huang, G.-B.; Zhu, Q.-Y.; Siew, C.-K. Extreme learning machine: A new learning scheme of feedforward neural networks. In Proceedings of the 2004 IEEE International Joint Conference on Neural Networks (IEEE Cat. No. 04CH37541), Shah Alam, Malaysia, 25–29 July 2004; IEEE: Shah Alam, Malaysia, 2004. [Google Scholar]
  82. Wang, L.; Zeng, Y.; Chen, T. Back propagation neural network with adaptive differential evolution algorithm for time series forecasting. Expert Syst. Appl. 2015, 42, 855–863. [Google Scholar] [CrossRef]
  83. Ebrahimzadeh, A.; Ahmadi, M.; Safarnejad, M. Classification of ECG signals using Hermite functions and MLP neural networks. J. AI Data Min. 2016, 4, 55–65. [Google Scholar]
  84. Othman, R.; Jaya, R.P.; Muthusamy, K.; Sulaiman, M.; Duraisamy, Y.; Abdullah, M.M.A.B.; Przybył, A.; Sochacki, W.; Skrzypczak, T.; Vizureanu, P. Relation between Density and Compressive Strength of Foamed Concrete. Materials 2021, 14, 2967. [Google Scholar] [CrossRef]
  85. Pichumani, S.; Raghuraman, S.; Venkaraman, R. Developing Regression Model to Predict the Tensile Strength, Bending Load and Micro Hardness and to Optimize the wt% of Sic in Al-Sic Composite. Available online: http://www.arpnjournals.org/jeas/research_papers/rp_2015/jeas_1015_2686.pdf (accessed on 12 August 2021).
  86. Saravanakumar, P. Evaluation of Compressive Strength of Mineral Admixed Recycled Aggregate Concrete Using Multiple Linear Regression Model. Int. J. Pure Appl. Math. 2018, 119, 1019–1029. [Google Scholar]
  87. Hassan, M.Y.; Arman, H. Comparison of Six Machine-Learning Methods for Predicting the Tensile Strength (Brazilian) of Evaporitic Rocks. Appl. Sci. 2021, 11, 5207. [Google Scholar] [CrossRef]
  88. Chandak, M.A.; Pawade, P. Compressive Strength and Ultrasonic Pulse Velocity of Concrete with Metakaolin. Civ. Eng. Archit. 2020, 8, 1277–1282. [Google Scholar] [CrossRef]
  89. Godinho, J.P.; Junior, T.F.D.S.; Medeiros, M.H.F.D.; Silva, M.S.D.A. Factors influencing ultrasonic pulse velocity in concrete. Rev. IBRACON Estrut. Mater. 2020, 13, 222–247. [Google Scholar] [CrossRef]
  90. Saranya, C.; Manikandan, G. A study on normalization techniques for privacy preserving data mining. Int. J. Eng. Technol. IJET 2013, 5, 2701–2704. [Google Scholar]
  91. Yousif, S.T.; Abdul-Kareem, O.M.; Ibrahim, K.A. Artificial neural network model for predicting the compressive strength of concrete using ultrasonic pulse velocity. Muthanna J. Eng. Technol. 2017, 5, 72–79. [Google Scholar]
  92. Vineela, M.G.; Dave, A.; Chaganti, P.K. Artificial neural network based prediction of tensile strength of hybrid composites. Mater. Today Proc. 2018, 5, 19908–19915. [Google Scholar]
  93. Mustafa, M.; Rezaur, R.; Rahardjo, H.; Isa, M.; Arif, A. Artificial neural network modeling for spatial and temporal variations of pore-water pressure responses to rainfall. Adv. Meteorol. 2015. [Google Scholar] [CrossRef] [Green Version]
  94. Sarkar, A.; Pandey, P. River water quality modelling using artificial neural network technique. Aquat. Procedia 2015, 4, 1070–1077. [Google Scholar] [CrossRef]
  95. Abuodeh, O.R.; Abdalla, J.A.; Hawileh, R.A. Assessment of compressive strength of ultra-high performance concrete using deep machine learning techniques. Appl. Soft Comput. 2020, 95, 106552. [Google Scholar] [CrossRef]
  96. Gülbandılar, E.; Koçak, Y. Prediction of Splitting Tensile Strength of Concrete Containing Zeolite and Diatomite by ANN. Int. J. Econ. Environ. Geol. 2019, 8, 32–40. [Google Scholar]
  97. Yue, L.; Hongwen, L.; Yinuo, L.; Caiyun, J. Optimum design of high-strength concrete mix proportion for crack resistance using add artificial neural networks and genetic algorithm. Front. Mater. 2020, 7, 340. [Google Scholar]
  98. Uchechukwu, E.; Austin, O. Artificial neural network application to the compressive strength of palm kernel shell concrete. MOJ Civil. Eng. 2020, 6, 1–10. [Google Scholar] [CrossRef]
  99. Nikoo, M.; Moghadam, F.T.; Sadowski, Ł. Prediction of concrete compressive strength by evolutionary artificial neural networks. Adv. Mater. Sci. Eng. 2015. [Google Scholar] [CrossRef]
  100. Nikoo, M.; Zarfam, P.; Sayahpour, H. Determination of compressive strength of concrete using Self Organization Feature Map (SOFM). Eng. Comput. 2015, 31, 113–121. [Google Scholar] [CrossRef]
  101. Ray, S.; Haque, M.; Ahmed, T.; Nahin, T.T. Comparison of artificial neural network (ANN) and response surface methodology (RSM) in predicting the compressive and splitting tensile strength of concrete prepared with glass waste and tin (Sn) can fiber. J. King Saud Univ. Eng. Sci. 2021, in press. [Google Scholar]
  102. Naderpour, H.; Rafiean, A.; Fakharian, P. Compressive strength prediction of environmentally friendly concrete using artificial neural networks. J. Build. Eng. 2018, 16, 213–219. [Google Scholar] [CrossRef]
  103. Yeh, I.-C.; Lien, L.-C. Knowledge discovery of concrete material using genetic operation trees. Expert Syst. Appl. 2009, 36, 5807–5812. [Google Scholar] [CrossRef]
  104. Chou, J.-S.; Chiu, C.-K.; Farfoura, M.; Al-Taharwa, I. Optimizing the prediction accuracy of concrete compressive strength based on a comparison of data-mining techniques. J. Comput. Civ. Eng. 2011, 25, 242–253. [Google Scholar] [CrossRef]
  105. Karthiyaini, S.; Senthamaraikannan, K.; Priyadarshini, J.; Gupta, K.; Shanmugasundaram, M. Prediction of mechanical strength of fiber admixed concrete using multiple regression analysis and artificial neural network. Adv. Mater. Sci. Eng. 2019. [Google Scholar] [CrossRef] [Green Version]
  106. Behnood, A.; Verian, K.P.; Gharehveran, M.M. Evaluation of the splitting tensile strength in plain and steel fiber-reinforced concrete based on the compressive strength. Constr. Build. Mater. 2015, 98, 519–529. [Google Scholar] [CrossRef]
Figure 1. Overview of research methodology of the current study.
Sustainability 13 10164 g001
Figure 2. ANN model architecture.
Sustainability 13 10164 g002
Figure 3. Scatter plot for water penetration using R2 values of the regression model.
Sustainability 13 10164 g003
Figure 4. Scatter plot for compressive strength using the regression model.
Sustainability 13 10164 g004
Figure 5. Scatter plot of split tensile strength using the regression model.
Sustainability 13 10164 g005
Figure 6. Scatter chart of pulse velocity developed using the regression model.
Sustainability 13 10164 g006
Table 1. Mechanical characteristics and water penetration for concrete cured for 28 days.
Mix Numberw/cIn Situ Concrete Temperature (°C)fc (Mpa)ft (Mpa)PV (m/s)WP (mm)
Cured by submerging in water
10.2982330.752.94428228
23031.953.06429216
33633.853.09431220
44335.853.23435228
50.3982324.452.57418234
63025.352.62420220
73627.452.8423228
84330.553.06424233
90.4482320.552.29414242
103020.952.37414225
113622.652.63415235
124325.352.7419242
Cured by covering with wet burlap
10.2982340.853.32433238
23046.753.69437227
33644.453.42437235
44339.653.35432239
50.3982333.653.95422244
63039.453.22421233
73636.053.19427240
84332.553.05423246
90.4482330.152.7419254
103035.752.99421241
113633.452.92420247
124328.952.88418257
Cured by applying curing compound
10.2982337.553.25430251
23043.953.63435235
33641.653.33432244
44336.953.27431248
50.3982331.452.92420255
63037.953.13424242
73634.953.16424249
84329.752.83420257
90.4482327.052.62412257
103034.152.87416250
113632.052.84415255
124326.652.7414263
Table 7. Combined ANN model results for predicting properties of concrete.
ParameterDescription/Value
TypeMLP
Variable normalizationMin-max
Hidden layer activation functionHyperbolic
Input/output layer activation functionLinear
Number of hidden layers1
Number of hidden neurons9
Learning algorithmCGB
Error functionSum-squared
Values for fc
R20.96
RMSE-Training3.047
RMSE-Test3.287
MAE-Training2.555
MAE-Test2.771
Values for ft
R20.95
RMSE-Training0.762
RMSE-Test0.805
MAE-Training0.744
MAE-Test0.784
Values of PV
R20.97
RMSE-Training17.253
RMSE-Test22.482
MAE-Training13.487
MAE-Test18.3
Table 8. Comparison of the results with other studies.
VariableTechniqueValue in the Current StudyValue in Referred StudyReferences
fcANN/R20.960.9[102]
0.942[54]
0.9338[103]
0.9091[104]
Ft0.950.94[105]
0.89[106]
PV0.970.88[29]
Publisher’s Note: MDPI stays neutral with regard to jurisdictional claims in published maps and institutional affiliations.

