Article

Environmental and Economic Life Cycle Assessment of Recycled Aggregates Concrete in the United Arab Emirates

Department of Civil and Environmental Engineering, United Arab Emirates University, Al Ain P.O. Box 15551, United Arab Emirates
*
Author to whom correspondence should be addressed.
Sustainability 2021, 13(18), 10348; https://doi.org/10.3390/su131810348
Submission received: 1 September 2021 / Revised: 13 September 2021 / Accepted: 13 September 2021 / Published: 16 September 2021

Abstract

:
This paper studies the potential environmental and economic impact of replacing natural aggregates (NA) with recycled aggregates (RA) in the production of different sustainable concrete mixes in the United Arab Emirates (UAE). A life cycle assessment (LCA) was carried out according to the methodology proposed by the international standards of the series ISO 14040. The performance of concrete mixes having a similar design compressive strength was evaluated. Results showed that the inclusion of steel fibers (SF) led to an increase in the global warming potential (GWP), whereas mixes with cement replacement by fly ash, slag, or microsilica recorded a reduction in GWP. Furthermore, SF-reinforced mixes created with 100% RA were at least three times more expensive than the NA-based control mix, while the cost of those with cement replacement by mineral additives was generally similar to that of the control. Material transportation was found to be a main contributor to the environmental and economic impacts, only second to cement, and its contribution increased with longer distances and steel fiber incorporation and decreased with RA replacement. To integrate these individual measures and select optimum mixes for various applications, multifunctional performance indices were developed. Research findings highlight the possibility to fully replace NA with RA (100%) while maintaining the performance and improving the economic and environmental impacts of concrete produced in the UAE.

1. Introduction

In the past few decades, construction activities have escalated worldwide due to the increase in urban populations and the quick and extensive urbanization process [1]. Despite its tremendous benefits, the construction industry is considered one of the main contributors to environmental degradation, with an ever-increasing demand for both natural resources and energy. Annually, almost 3 billion tons of raw materials are used for the manufacturing of construction materials worldwide [2,3,4]. In addition, construction activities generate massive amounts of demolition waste. The construction and demolition waste (CDW) accounts for 35% of the total solid wastes produced around the world [1,3]. In 2016, CDW accounted for 36% of the total solid waste generation in Europe [5], while, in 2017, 569 million tons of CDW were generated in the United States, more than twice the amount of generated municipal solid waste [6]. Furthermore, the annual CDW generation in China has been estimated to be 2360 million tons between 2003 and 2013 [7]. In the Emirate of Abu Dhabi in the United Arab Emirates (UAE), CDW accounted for 30% of the total waste generated in 2018 [8]. These wastes are a significant challenge for modern society due to their high generation rates and heterogeneous composition [3]. The different materials used during the construction activities cause the heterogeneity of CDW, including concrete, wood, metal, cardboard, gypsum, or materials used in infrastructure such as asphalt and soil [9]. While there are several ways to handle CDW, the most popular way of managing it is by disposing of it in landfills.
Landfilling of CDW is not a sustainable waste management option, owing to landfill shortage and negative environmental and economic impacts. Indeed, CDW may include materials that may cause a risk to public health, damage soil, and groundwater and contaminate them, spread odors, and reduce the land monetary value in the area [2,10]. As such, numerous methods have been developed to reutilize CDW. In one process, CDW was converted into recycled aggregates (RA) as a means of recycling this waste to relieve the burden off of landfills, minimize the adverse impact of landfills, alleviate the occupation of land, and provide an alternative source for aggregates in concrete [2,11]. Actually, the demand for construction aggregates has been increasing globally and is expected to increase by almost 45% by the year 2025 [12]. As such, there is a pressing need to replace natural aggregates (NA) with more sustainable alternatives, including artificial aggregates (AA) and recycled aggregates (RA). The former are typically manufactured through sintering, geopolymerization, cement-bonding, or cold-forming processes [13,14,15]. Aside from their environmental benefits, past research has highlighted their lightweight and high absorption capacity, leading to a loss in performance in the AA-based concrete compared to NA-based counterparts [13,16,17,18]. While RA have a similar impact on the properties of concrete, their various environmental benefits have led to significant advances and the development of recycling facilities to produce the highest possible quality of RA [19,20].
Past studies have confirmed that RA can be used as construction materials for different applications. In fact, RA can be used in the production of concrete [21,22,23], as a secondary raw material in concrete curbs and floor blocks [24,25], in precast concrete products [26], and in the construction of roads as an engineering fill (sub-base materials) [2]. Clearly, RA has a great potential for adoption by the construction industry, but is only utilized in low-grade applications. To achieve its full potential, certain challenges must be overcome. These challenges are related to inadequate information on the recycled products, low stakeholders’ confidence, variability in the material, and the conflicting information on their availability, durability, quality, and functionality [27,28]. In addition, the quality of RA has been reported to be usually inferior relative to that of a natural aggregate (NA), which is an important factor, for example, in structural concrete applications [11,29]. As such, the resultant RA concrete has been found to have an inferior mechanical performance compared to NA-based counterparts [2,30]. Nevertheless, steel fiber addition, the replacement of cement by additives, such as fly ash, slag, or microsilica, or the addition of more cement in the mix could enhance the properties of RA concrete [30,31,32,33,34,35,36,37,38]. In fact, while the latter two methods compensated for the loss in concrete properties due to RA incorporation, steel fiber-reinforced RA concrete mixes had superior flexural and tensile properties to NA-based counterparts [30,31,32,33,34,35,36,37,38].
While the properties of concrete-incorporated RA were reported to be inferior to those created with NA, past literature noted that the former had a lower environmental and economic impact than the latter. In fact, various studies have been conducted to compare the environmental and economic performance of RA- and NA-based concrete employing a life cycle assessment (LCA). Studies, including [39] in France, Turk et al. [37] in Slovenia, Shan et al. [40] in Singapore, Mah et al. [41] in Malaysia, and Knoeri et al. [42] in Switzerland, concluded that concrete mixes utilizing RA had superior environmental performance to NA-based concrete mixes. In their research, the authors emphasized the inclusion of the impact of material transportation when conducting an LCA [37,39,40,41,42]. As LCA is region-specific, there is a need to perform such an investigation for the UAE.
A comprehensive LCA of RA concrete, considering production, transportation, and utilization, is yet to be performed in the UAE. Additionally, the combined effect of RA and different mineral additives on the environmental, economic, and engineering performance of concrete in the UAE have not been studied. Accordingly, this research aims to carry out an environmental and economic LCA of using RA in concrete production in comparison to NA in the UAE. Recycled aggregates concrete mixes with different proportions of steel fibers, cement, ground granulated blast furnace slag (or simply slag), fly ash, and microsilica, and a target design cylinder concrete strength of 30 MPa were prepared and tested. The NA and RA served as coarse aggregates, while fine aggregates were in the form of locally abundant desert dune sand. Fresh and hardened properties of these mixes, in addition to two similar mixes with steel fibers published in the literature [34], were used as input data in the LCA.
The novelty of this work is based on the combined effect of producing the raw materials and concrete and their transportation to various locations on the environmental and economic impacts of RA concrete in the UAE. Additionally, since these impacts were measured separately, the datasets produced herein could be valuable to design scenarios for future LCA studies. An ecological profitability distance was also established where the utilization of RA in concrete was more environmentally and economically advantageous than that of NA. A multifunctional performance indexing process was furnished to combine the individual measures into various performance indices to select optimum concrete mixes for different applications. The results of this process will aid local public or private decision-makers in selecting the design that satisfies their design requirements.

2. Methodology

LCA is a multi-stage approach for analyzing the environmental impact of a product or service throughout the stages of its life cycle. Typically, the environmental footprint of industrial products, such as concrete, is associated with the materials used and energy consumed in its production. To enhance the sustainability of concrete, this environmental footprint should first be addressed and then optimized. In this aspect, LCA methodology was utilized to compare different concrete products from environmental and economic standpoints and served as a basis for decision-making. According to the international standards of the series ISO 14040 (2006), LCA consists of four distinct analytical steps: (1) goal and scope definition, (2) life cycle inventory (LCI) analysis, (3) life cycle impact assessment, and (4) interpretation of LCA results [43]. Life cycle assessment is a well-known methodology, and it has been utilized in previous studies to evaluate the environmental and economic impact of construction waste [2,10,11,19,24,37,39,41,44,45,46,47].

2.1. Goal, Scope, and Functional Unit

The aim of this study is to conduct an environmental and economic LCA for structural concrete production in the Emirate of Abu Dhabi, UAE. The life cycle impact of various concrete mixes, with a focus on the effect of varying the proportions of RA with NA up to 100%, was compared to a conventional concrete mix created with a 100% NA to evaluate their environmental and economic feasibility. Such mixes incorporated different additives, including fly ash, ground granulated blast furnace slag (or simply slag), microsilica, steel fibers, and superplasticizer to achieve a 30 MPa cylinder compressive strength (f’c) at the age of 28 days. Additionally, it should be pointed out that the functional unit used in this study is the production of 1 m3 of concrete.

2.2. System Boundaries

The cradle-to-gate production process methodology was adopted in the production of concrete raw materials while accounting for the concrete waste, which is usually disposed of in landfills or dumpsites. The life cycle stages considered herein comprised extraction and production of the concrete raw materials and their transportation to the concrete plants. Further, to facilitate a comparative environmental impact assessment, certain limitations to this work are highlighted:
  • The construction, service, and demolition phases of a concrete structure were excluded from the analysis, assuming exposure to a non-aggressive environment throughout its life cycle. According to Knoeri et al. [42], Marinković et al. [11], and Visintin et al. [47], the impacts of these phases for concrete created with NA or RA and exposed to non-aggressive conditions were expected to be similar. As such, their environmental and economic impact were omitted.
  • The recycling plant under consideration in this work has a recovery percentage of the recycled aggregate of 90%. Impurities, including steel, wood, and plastic, among others, are typically forwarded to other recycling facilities for processing. This means that 1 m3 of CDW is completely recycled with no waste being produced.
  • Government agencies in the Emirate of Abu Dhabi oblige demolition contractors to send construction and demolition waste (CDW) to the landfill, which is in close proximity (<5 km) to the recycling plant. Thus, the delivery of the CDW from the demolition site to the recycling plant was not considered in the environmental assessment and cost analysis, as it was excluded from the process of manufacturing of RA from CDW and was preliminarily found to have an insignificant impact.

2.3. Life Cycle Inventory Data Analysis

The data for each unit process, i.e., inputs and outputs of material and energy flows, were collected. Facts and figures on the emissions to the land, air, and water were also amassed. As the production of NA- and RA-based concrete was specific to the UAE, data collection related to aggregates was conducted through site surveys and interviews with industry professionals. Input data for machinery and trucks, including energy consumption, fuel consumption, and waste input, were obtained directly from the local manufacturers. Owing to the absence of some country-specific LCI data necessary to carry out the LCA, extensive research of the existing literature and databases was conducted for this part of the study. As a result, data from multiple sources were utilized, including the Intergovernmental Panel on Climate Change (IPCC) emissions factor database [48], the European Federation of Concrete Admixtures Associations (EFCA) [49], the GHG Protocol’s cross-sector tool [50], and published work by Cembureau [51], Carbon Solutions [52], Kennedy et al. [53], Instytut Techniki Budowlanej (ITB) [54], Zhang et al. [55], the Milieu Relevant Product Information (MRPI) [56], and NORCHEM [57]. These values were adopted as they were relevant to the current conditions and situation of the UAE and were produced using similar parameters. Actually, the use of LCI data from different sources, such as LCI databases or even industry interviews, was advised when LCI data did not exist for a specific country. For example, Braga et al. [10] collected LCI data from interviews with companies, published literature, and the materials’ environmental product declarations [3,10,44,48,58,59]. The methodology proposed by IPCC 2006 [48] was utilized for the calculation of environmental load per unit process of the studied sustainable mixes.

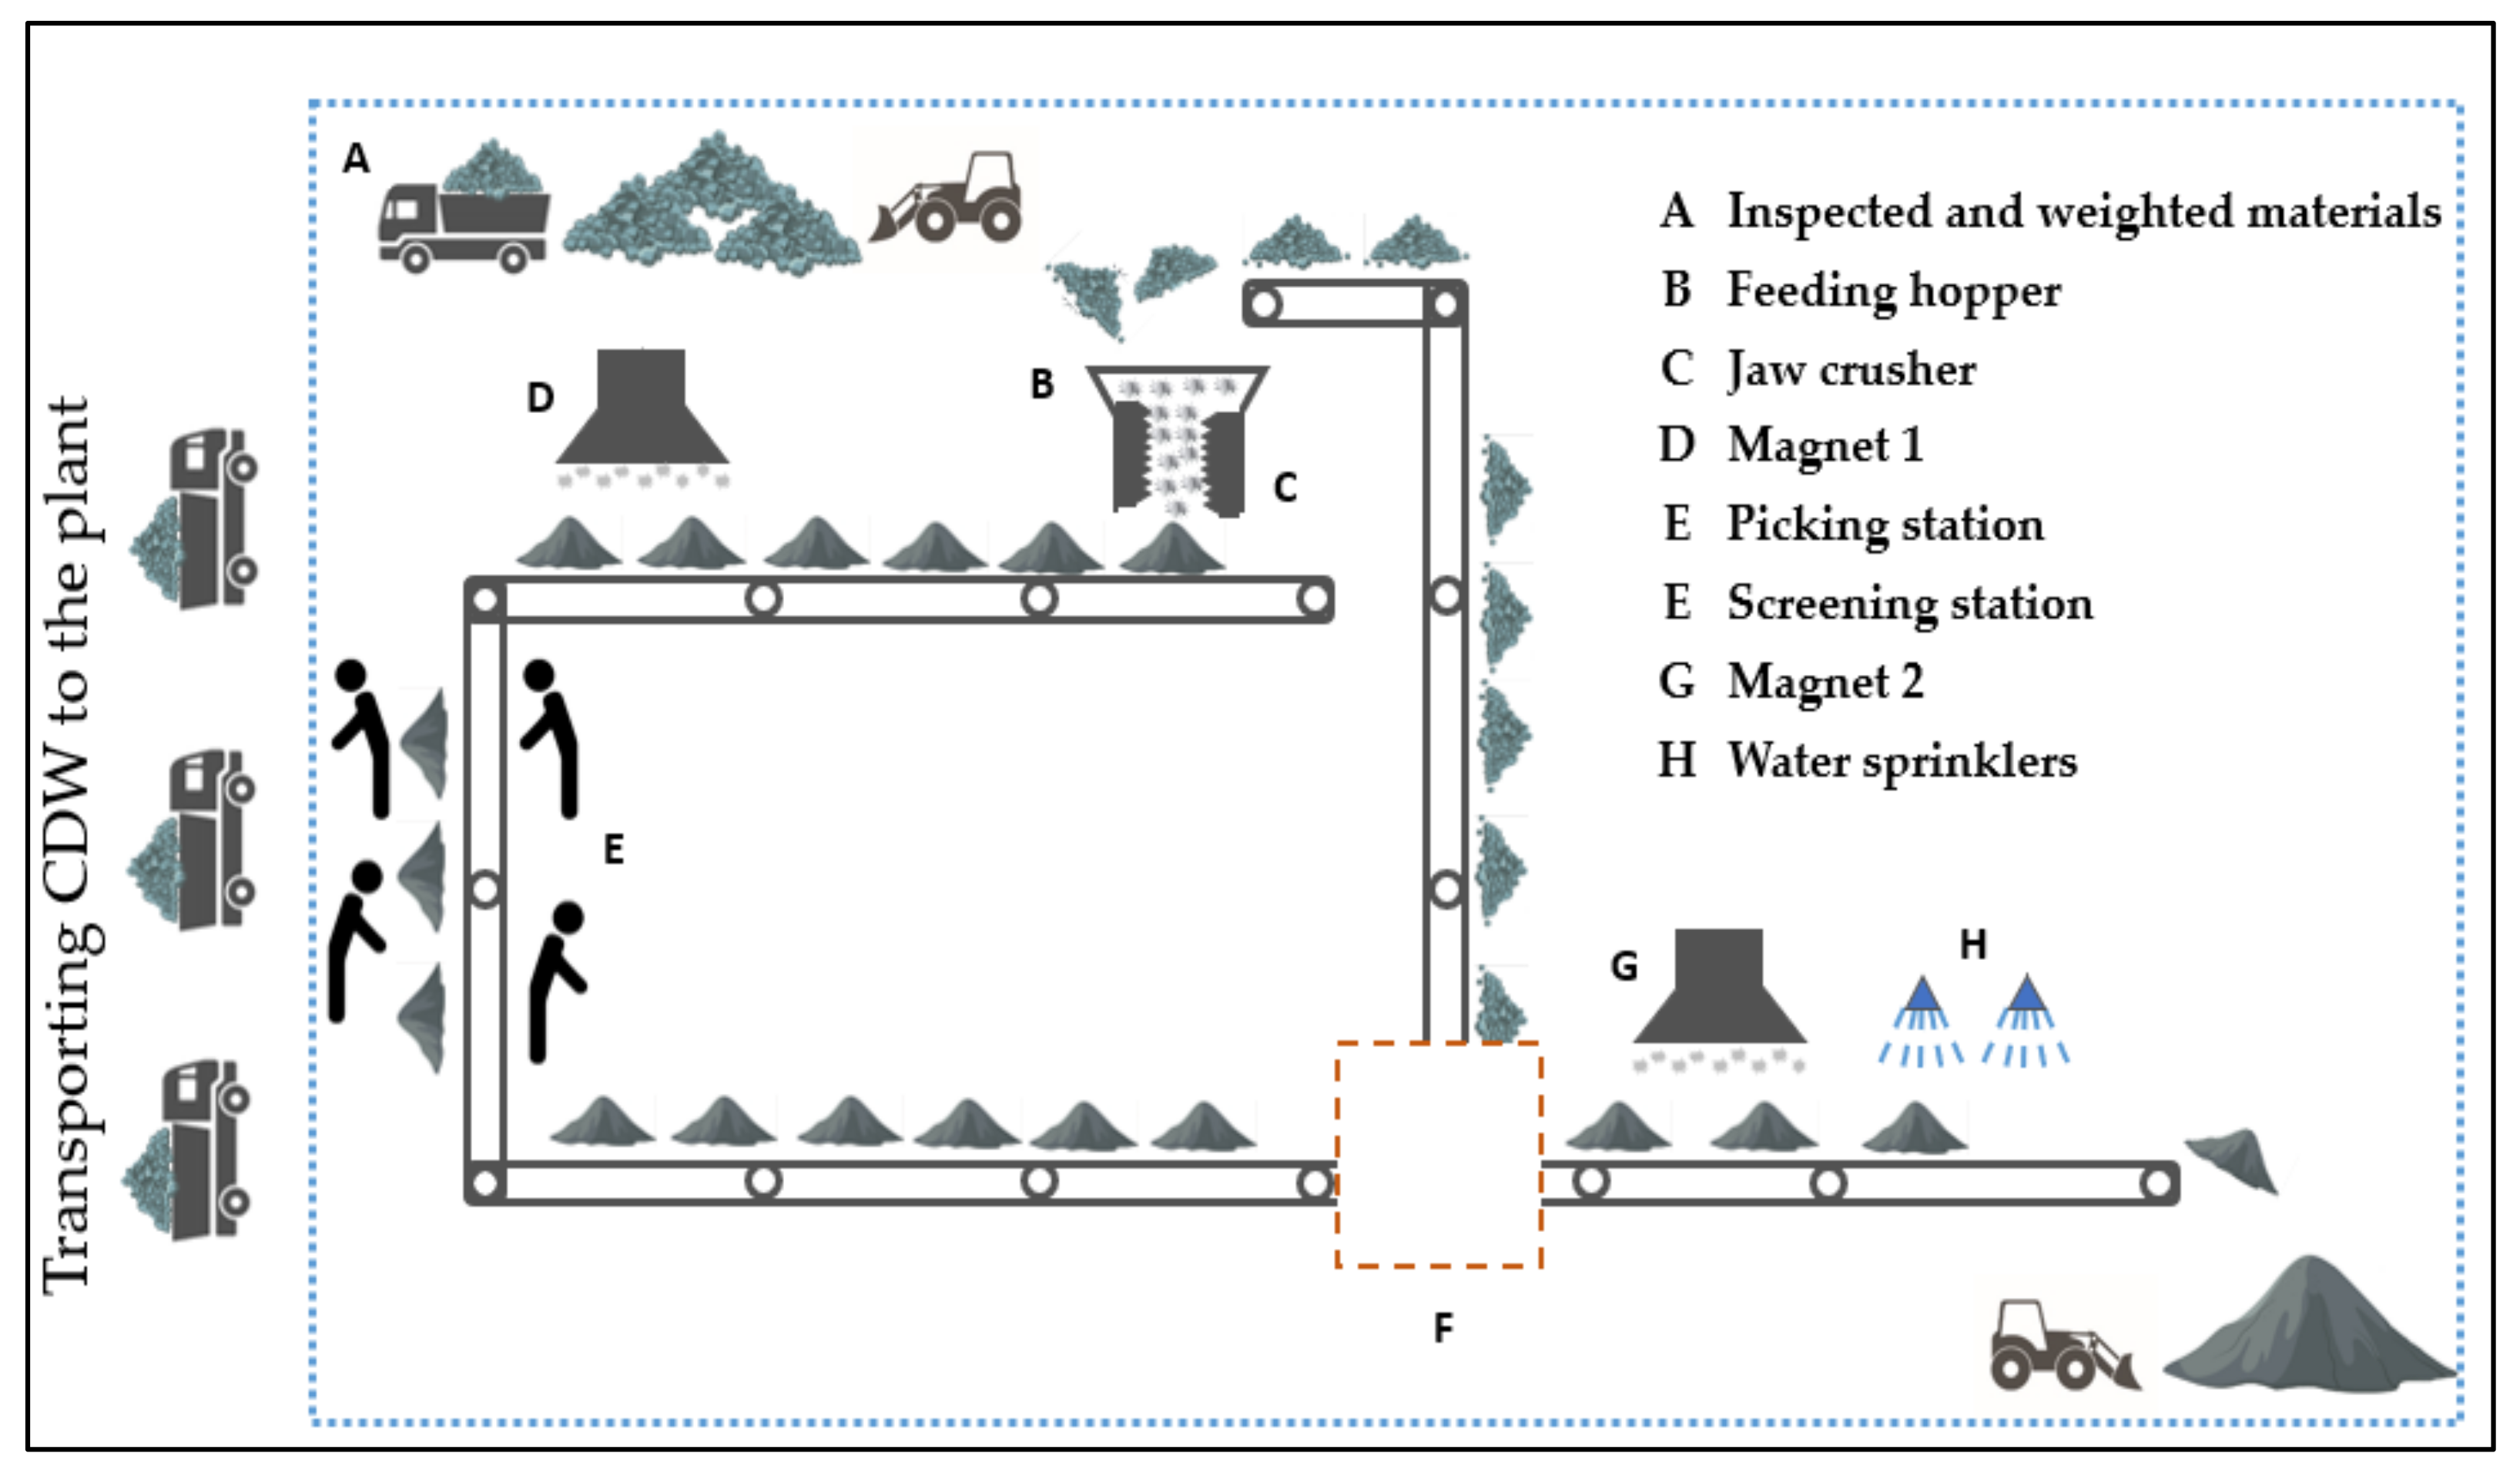
2.3.1. Recycled Aggregates Production

The process of recycling construction and demolition waste (CDW) was carried out in a recycling plant in the Emirate of Abu Dhabi. The recycling plant can process up to 7000 tons of CDW per 12 h work shift. The whole process consumes up to 700 kW of electricity per day, which is generated on-site by means of solar panels that are located within the premises of the plant, as shown in Figure 1. Such panels are considered renewable energy sources and have little to no environmental footprint during construction and operation phases, respectively [60].
Within the recycling plant, several processes were carried out to convert CDW into RA, as presented in Figure 2. Heavy diesel-run machinery and equipment are the sole contributors to the environmental impact of the recycled aggregates within the boundaries of the study, which is denoted by the dashed line. The environmental burden of this equipment was calculated using Equation (1) and based on the methodology proposed by IPCC in its 2006 guidelines for national greenhouse gas inventories. The total environmental burden of the equipment was determined as 4730.5 kg CO2eq. per shift. Since the plant produces 7000 tons of recycled aggregates per 12 h shift, the environmental impact of producing 1 ton of recycled aggregates was reported to be 0.676 kg CO2eq.
Emissions   kg   CO 2 eq = Fuel   Consumption   Rate   ×   Quantity   ×   Duration ×   Emission   Factor

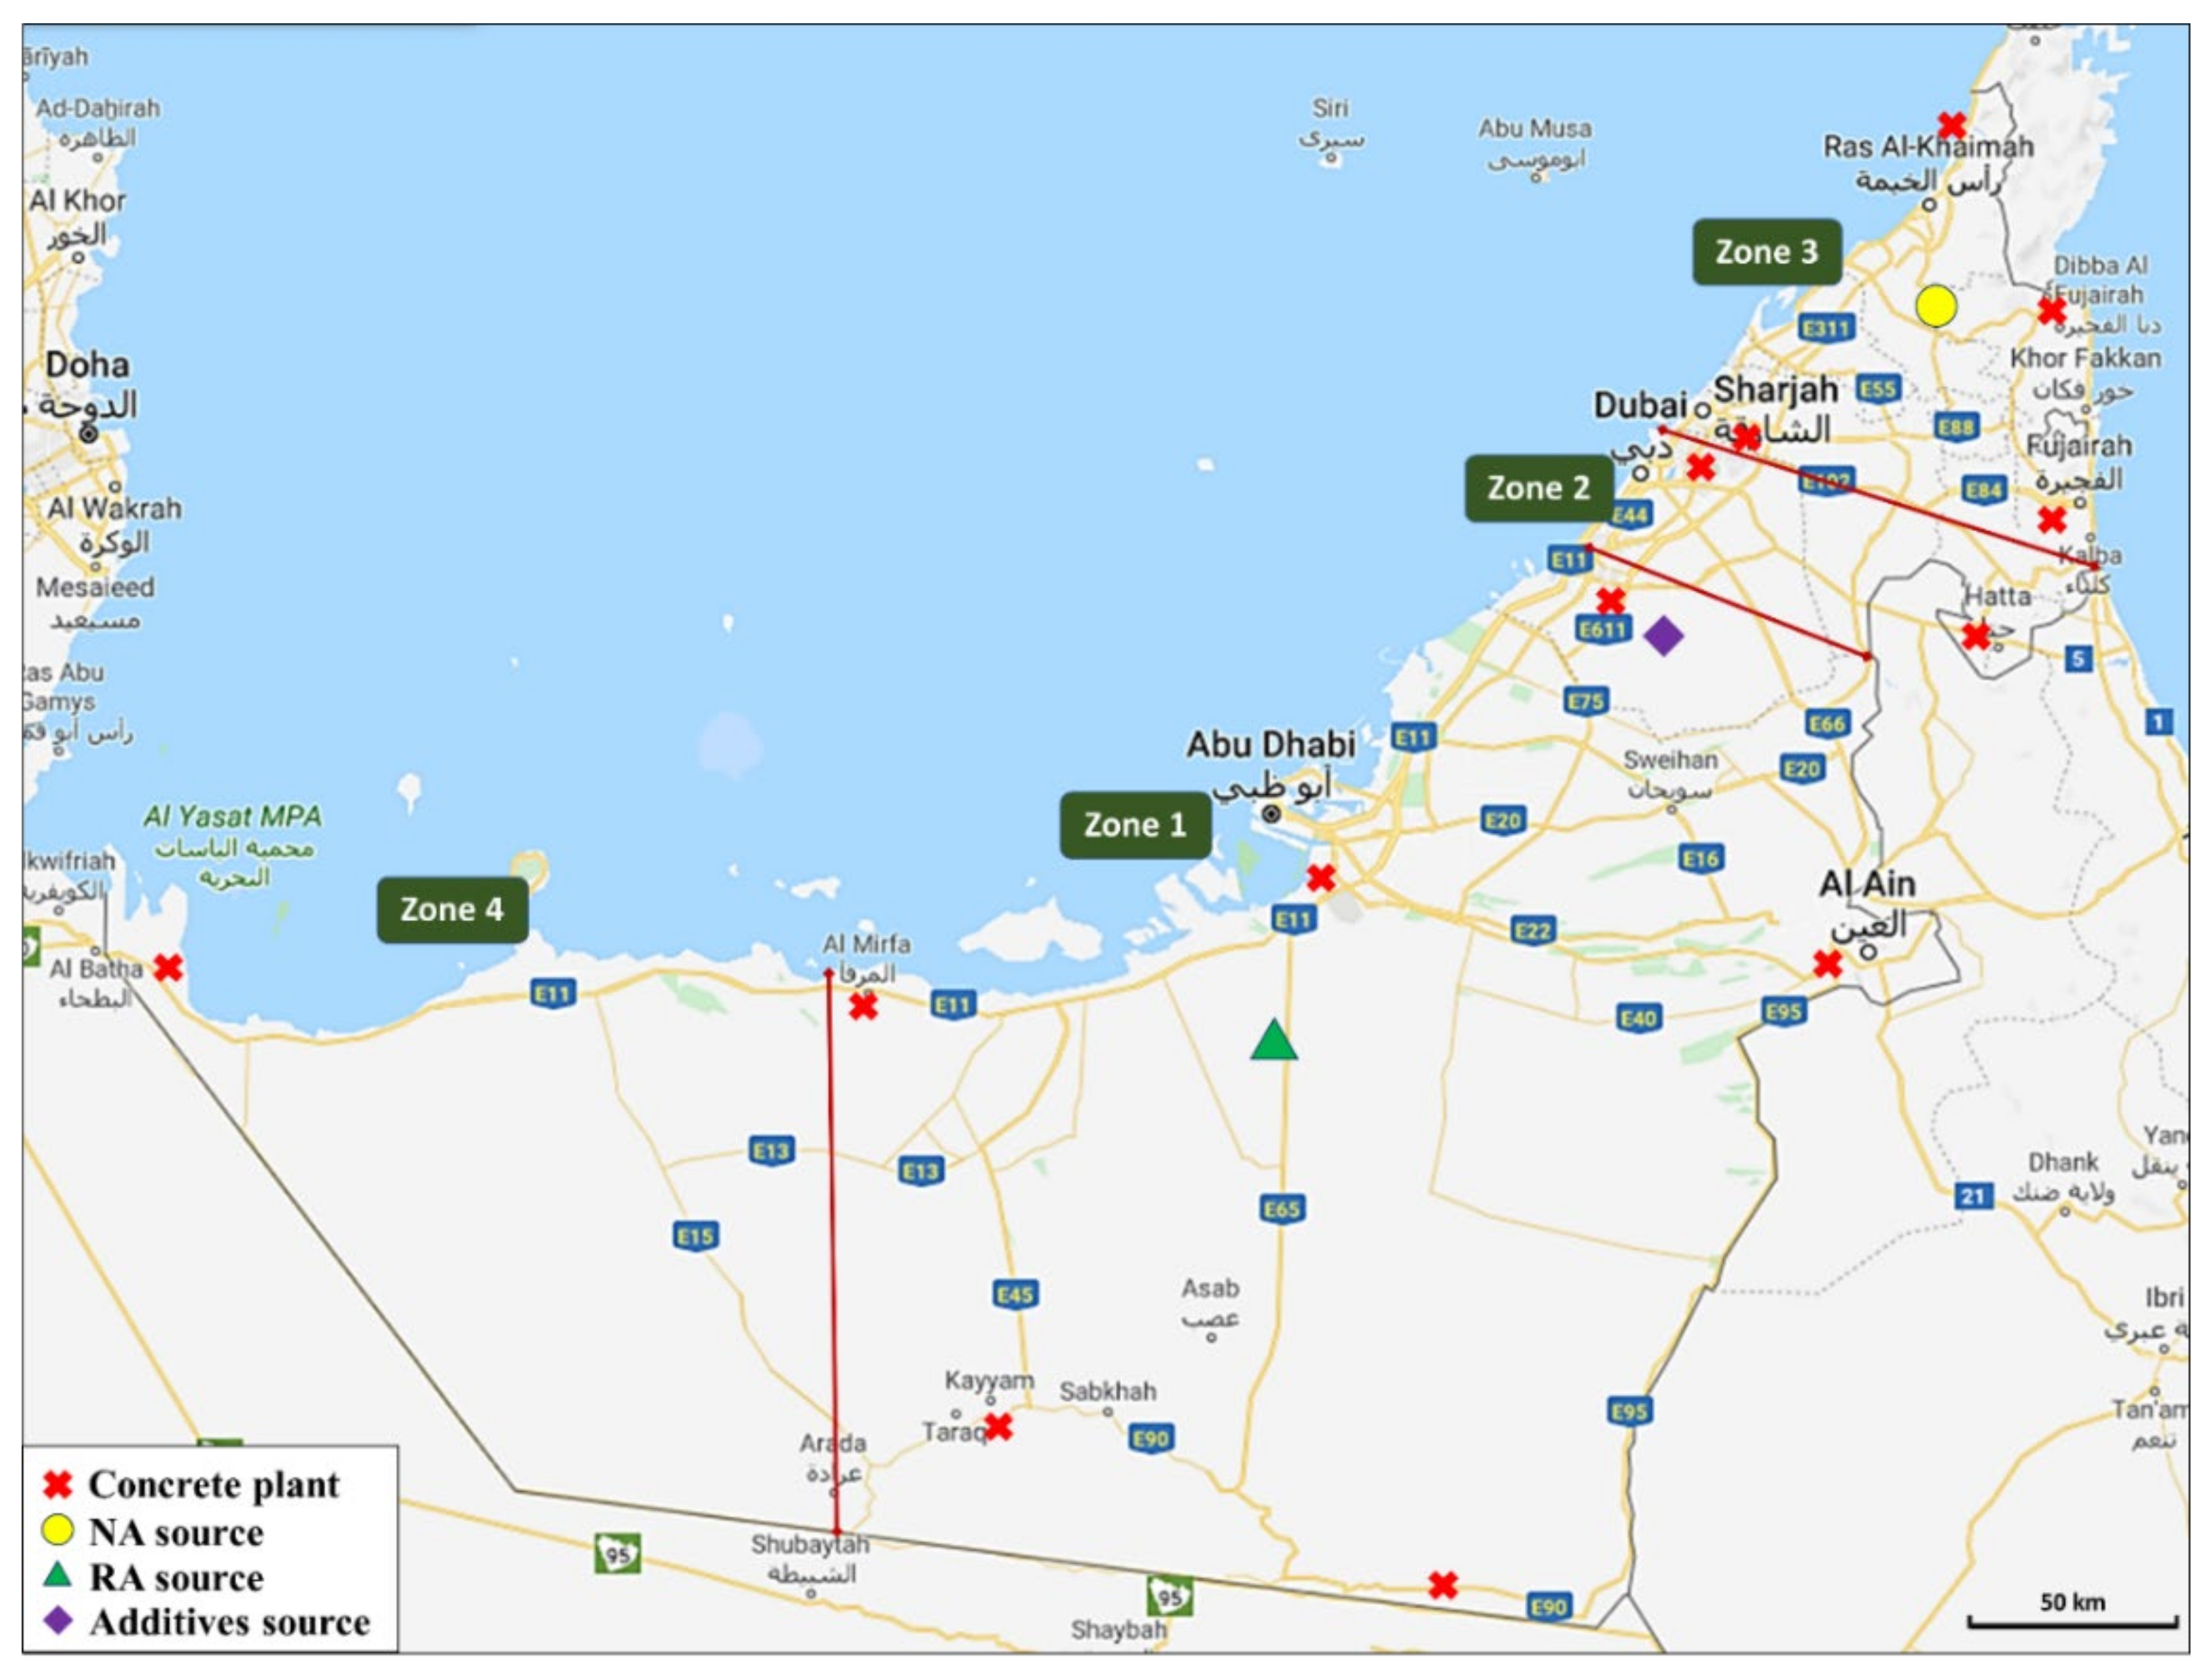
2.3.2. Aggregate Transportation

The environmental footprint of transporting the produced recycled aggregates from the plant to the designated concrete plants was examined. Based on the information supplied by the recycling plant, a road vehicle (HGV) with a carrying capacity of more than 17 tons is considered the typical transportation vehicle. To calculate the associated environmental impact, a value of 2.0027 × 10⁻⁴ kg CO2eq/km.kg of material carried was adopted from the GHG Protocol’s cross-sectoral tool [50]. Further, a value of USD2.72 per km was adopted based on local transporting prices to calculate the cost associated with transporting the aggregates.
To study the impact of material transportation, a sensitivity analysis with four different scenarios was carried out. These scenarios were based on the distance between RA (Abu Dhabi) and NA (Ras Al Khaimah) plants and the additives (steel fibers, fly ash, slag, microsilica, and superplasticizer) suppliers (Dubai) to the four zones within UAE, as shown in Figure 3. It should be noted that the RA plant lies in Zone 1, whereas NA was obtained from the quarries located in Zone 3. In turn, Zone 4 mainly represents the western region of the Emirate of Abu Dhabi up to the borders of the Kingdom of Saudi Arabia, while Zone 2 denotes the Emirate of Dubai. The roundtrip distances considered for each scenario were determined by finding the average distance a truck travels from a concrete plant (marked with an x in Figure 3) to various construction site locations within the zone. These distances are summarized in Table 1.
Furthermore, the transportation contributions of NA, RA, and additives were considered in the environmental and cost analysis. In turn, the remaining concrete components, i.e., cement, dune sand, and water, were not considered, as they were available within the premises of concrete plants. Accordingly, their transportation contribution was not accounted for.

2.4. Life Cycle Impact Assessment

Potential environmental impacts were evaluated in the form of a life cycle impact assessment (LCIA). According to ISO14040 [43], LCIA consists of classification, characterization, normalization, and weighting. While classification and characterization are mandatory elements in LCIA selection of impact categories, normalization and weighting are considered optional [11,43]; thus, the latter were not considered in this study. The discussion on LCIA in this study was limited to those well-defined impact categories with established characterization or equivalency factors. In the LCA field, impact categories considered in the classification section included global warming (GWP), ozone depletion (ODP), acidification (AP), eutrophication (EP), photochemical oxidant formation (POCP), abiotic resource depletion (ADP), human toxicity, eco-toxicity, and solid waste. Of these, and according to the methodology used (ISO14040), the latter three categories did not have reliable characterization factors; thus, they were not discussed in this study [43]. The LCI values for the raw materials that are commonly used in concrete production are an important data source and evaluation tool. In fact, they can be used in more comprehensive future studies concerning the environmental impact of cement-based materials. Table 2 lists the values of LCI parameters and cost for each raw material used in producing the concrete mixtures employed in this study. These values were used to perform the environmental and economic life cycle assessments. Dune sand had no environmental impact values since it is a natural product that requires no processing and is typically used in its as-received form. Its only environmental impact is associated with its transportation to the concrete mixing plants. This part of the impact was not considered in this study due to its abundance, as mentioned earlier.

3. Concrete Mixes

The properties of the materials that were utilized in the production of the different mixes under investigation in this study are described in this section. The mixture proportions, sample preparation, and performance evaluation are also presented.

3.1. Materials

3.1.1. Binding Materials

The materials employed in this study included binder, aggregates, water, superplasticizer, and steel fibers. For the binder, ASTM Type I ordinary Portland cement (OPC) was mainly used. It was supplemented by class F fly ash (ASTM C618), ground granulated blast furnace slag (or simply slag), or microsilica. The chemical composition of these materials is shown in Table 3. Their microstructure and morphology can be found elsewhere [32,62].

3.1.2. Aggregates

The coarse aggregates were in the form of recycled aggregates (RA) and natural aggregates (NA). The former was locally sourced from Al Dhafra recycling facilities, Abu Dhabi, UAE, with a nominal maximum size (NMS) of 25 mm. In turn, the latter was crushed dolomitic limestone from a local supplier in Ras Al-Khaimah, UAE, with an NMS of 19 mm. Additionally, fine aggregates were in the form of locally abundant desert dune sand with a size ranging between 0.3 and 0.6 mm. Its chemical composition and microstructure are shown elsewhere [34]. Figure 4 displays the particle size distribution of the different blends of NA and RA created to satisfy the requirements. All blends fell within limits set by ASTM C33 [63]. The physical properties of NA, RA, and dune sand are shown in Table 4. While the NA had a higher dry-rodded density and specific gravity than RA, its water absorption, Los Angeles abrasion, soundness, and fineness modulus were lower. It is noteworthy that the existing mortar attached to the RA created a rough, porous surface, which increased the air content [34,64].

3.1.3. Superplasticizer

A polycarboxylic ether polymer-based superplasticizer (SP) was utilized to improve the workability of specific mixes without compromising the mechanical performance.

3.1.4. Steel Fibers

Hooked-end steel fibers were used in this study to improve the mechanical properties. Their tensile strength, Young’s modulus, mean diameter, mean length, and aspect ratio were 1345 MPa, 210 GPa, 0.55 mm, 35 mm, and 64, respectively.

3.2. Concrete Mixture Proportioning

The concrete control mix adopted in this work was proportioned as per ACI 211.1 [65] to achieve a 30 MPa concrete cylinder compressive strength (f’c) at 28 days. Table 5 shows the mixture proportions of the different concrete mixes. They are designated as XRA-Y, where X denotes the percent of NA replacement by RA, and Y represents the type of mineral additive incorporated into the mix. Among these, 0SF, 1SF, and 3SF signify 0, 1, and 3% steel fiber incorporation, by volume, correspondingly. Conversely, the terms Cem, MS, and FA indicate the respective addition of cement, microsilica, and fly ash to the mix. The RA-based concrete mixes used in this study were designed to obtain an equivalent cylinder compressive strength to the NA-based control mix, i.e., 30 MPa, and a slump between 100 and 150 mm. It was necessary that the different concrete mixes fulfilled similar functional requirements to properly evaluate their potential environmental impacts. As shown in the last column of Table 5, the addition of steel fibers, cement, slag, microsilica, or fly ash and the variations in the specific gravities of NA and RA caused negligible changes in the volume of the mix. Other work reported such negligible changes in the volume [34,66,67,68,69,70].

3.3. Sample Preparation

Concrete casting was carried out under ambient conditions, i.e., temperature of 24 ± 2 °C and relative humidity of 50 ± 5%. Dry components, including cement, coarse and fine aggregates, and additives, when available, were mixed in a pan mixer for 3 min. The superplasticizer was incorporated into the water to ensure proper dispersion. The wet components were then added gradually into the dry components and mixed for another 3 min to ensure uniformity and homogeneity. Freshly prepared concrete was placed into cylindrical and prismatic molds in two layers and vibrated on a vibrating table for 10 s for proper compaction. Subsequently, specimens were covered with a plastic sheet for 24 h and then placed in a water curing tank until 28-day testing.

3.4. Performance Evaluation

The performance of concrete mixtures was evaluated at fresh and hardened states. The slump of fresh concrete was measured following the procedure of ASTM C143 [71]. The hardened concrete density was determined according to ASTM C642 [72]. The compressive strength was assessed using 100 mm × 200 mm (diameter × height) cylinders. The test was carried out by applying a load at a rate of 7 kN/s using a compression machine with a 2000-kN load capacity, in accordance with ASTM C39 [73]. Additionally, the flexural strength or modulus of rupture of the different concrete mixes was determined following the 3-point bending test of ASTM C78 [74]. All hardened concrete tests were conducted at the age of 28 days. For each test, three replicate specimens were tested per mix to obtain an average.

4. Results and Discussion

The performance of the concrete mixes is evaluated in this section, including the fresh and concrete properties. The environmental and economic impact are also assessed. The results of this section serve as the individual performance criteria for the multifunctional performance indices.

4.1. Slump

The workability of the concrete mixes created with different proportions of RA, SF volume fractions, and additives was characterized by the slump. Table 6 presents the slump test values of fresh concrete. Values fell within the range of 100–150 mm. Results showed that the slump values decreased as the replacement percentage of NA with RA increased, owing to the rough surface texture and irregular geometric shape of RA [34,75,76]. In comparison, mixes replacing cement with different additives recorded less reduction in the slump values. Among these mixes, the one incorporating microsilica (100RA-MS) recorded the highest reduction in slump compared to mixes with other additives. Due to its fine particles, microsilica caused the mix to be viscous and cohesive, leading to eventual slump losses [77,78]. Additionally, the slump losses might be attributed to the fact that water existing in the matrix was being utilized by microsilica due to its high fineness with a more specific surface area [77]. Conversely, adding more cement to the mix seemed to somewhat mitigate the reduction in slump. Further, the addition of steel fibers to mixes created with 100% recycled aggregates contributed to a further reduction in slump. The highest reduction of 33% was reported for mixes 70RA-1SF and 100RA-3SF. While more steel fibers were incorporated into the latter mix, a superplasticizer was added to improve the workability.

4.2. Hardened Concrete Density

The 28-day hardened concrete densities are presented in Table 6. The values ranged from 2375 to 2617 kg/m3. Results showed that the concrete density decreased as the RA replacement percentage increased, owing to the lower dry-rodded density of RA compared to that of NA [79]. Yet, the addition of steel fibers tended to counter this loss with as low as a 0.6% reduction in density. In comparison, a higher reduction in density was noted in mixes incorporating mineral additives, with the percent loss reaching up to 9.2%. This was primarily due to the replacement of NA by the lighter RA, as per the physical properties of Table 4.

4.3. Compressive Strength

The compressive strength values of concrete mixes at the ages of 3, 7, and 28 days are presented in Figure 5. Results of the mixes 30RA-0SF and 70RA-1SF, reported in Kachouh et al. [34], were included in the figure. The results showed that some mixes recorded a lower initial 3-day strength compared to the control mix, whereas others had slightly higher results. The replacement of NA with RA led to decreasing the initial strength gain. This might have been because of the weak bond between the old mortar, attached to the surface of RA, and the new mortar [47,64,80,81]. Different additives, including SF, MS, FA, slag, and more cement, seemed to improve the initial early compressive strength gain. All the mixes showed almost a similar compressive strength gain pattern over time. Although the initial 3-day strength values of the mixes with RA were lower than that of the NA-based control mix, their strength gain over time was generally faster. It is worth mentioning that the size of the RA also played a part in its compressive strength. Bigger aggregate size leads to a larger interfacial transition zone, which is the weak binder zone around the aggregate that is vulnerable to cracks [75].
From the results shown in Figure 5, it can be seen that all the mixes that contained SF had a lower early strength than the control mix except for mix 100RA-3SF with a slightly higher early strength. This mix showed a similar strength gain pattern to the control mix. Even though the initial strength gain for mixes with SF was lower, all the mixes recorded 28-day compressive strength values almost similar to the control mix. Indeed, f’c values were between 6% less and 5% more than the control mix.

4.4. Flexural Strength

Figure 5 shows the flexural strength results of concrete mixes. Results of the mixes 30RA-0SF and 70RA-1SF, reported in Kachouh et al. [34], are included in the figure. Values ranged between 4.2 and 8.0 MPa. Generally, the flexural strength results for mixes with no added SF did not differ significantly from that of the control mix. The different replacement percentages of NA with RA did not have an apparent effect on the flexural strength. Similarly, the additives did not affect the flexural strength. In fact, these additives mostly aimed to improve the compressive strength of the concrete mixes after NA replacement by RA.
Mixes incorporating SF behaved differently. Despite having 70% RA replacement, the addition of 1% SF, by volume, resulted in a flexural strength similar to that of the control mix. Similar findings were reported for the mix created with 100% RA and 1% SF volume fraction. On the other hand, the inclusion of 3% SF, by volume, in mix 100RA-3SF recorded the highest flexural strength compared to the control mix with a 60% increase. This was primarily due to the bridging effect of steel fibers and their ability to mitigate crack formation and propagation [82,83].

4.5. Life Cycle Impact Assessment

4.5.1. Environmental Impact Assessment

The environmental impact assessment was characterized by the environmental categories associated with the production of 1 m3 of concrete, as summarized in Table 7. Among the various categories, GWP had the highest contribution. As such, GWP will be representative of the environmental impact assessment discussion. It was calculated by adding the products of multiplying the GWP value of each mix component in Table 2 by the mixture proportions in Table 5. For instance, the GWP of mix 100RA-1SF (503.2 kg CO2eq) was determined by summing the products of 480 by 0.898, 1090 by 0.000667, 180 by 0.01258, 4.8 by 1.88, and 78 by 0.771. Furthermore, a comparison between mix 30RA-0SF and the control mix showed that the replacement of NA by 30% RA had a minimal effect on the GWP. Furthermore, of the nine mixes, the mix created with 100% RA and 3% steel fibers, by volume (100RA-3SF), displayed the highest GWP of 624 kg CO2eq. Compared to the control mix created with only natural aggregates, it was 45% higher. This was due to the addition of steel fibers, whereby its manufacturing process was associated with high GWP, i.e., a high emission factor. In fact, the contribution of steel fibers towards the total GWP of this mix reached up to 31.8%, according to Table 8. To reduce this adverse effect, it was possible to add 1% steel fibers, by volume, with 10 kg/m3 of cement instead, as in mix 100RA-1SF, whereby the GWP increased by 17% only.
Mixes created with 100% RA and additives, including microsilica, fly ash, and slag, displayed reductions in GWP of 30, 15, and 9%, respectively, compared to the control mix, with the mixture incorporating microsilica showing the lowest GWP. This was owed to using a lesser amount of cement in such mixes and replacing it with a more environmentally friendly mineral admixture. Additionally, Table 8 depicts that cement had the predominant impact on GWP. Its contribution ranged from 67 to 98% of the total GWP associated with the concrete mix production. It was only in mixes that had steel fibers that the contribution of cement dropped below 96%. As such, it is clear that reducing the cement content is the primary means of alleviating the environmental impact of concrete. In contrast, the replacement of NA by RA did not seem to have a significant influence.
In dealing with construction demolition waste, landfilling is still the dominant method of management in the UAE, despite governmental efforts to promote more sustainable and environmentally friendly alternatives. In fact, landfills are one of the main methods of waste disposal, regardless of their relatively high potential to pollute the environment [84]. It is understandable that some types of waste are unsalvageable, but CDW can actually be repurposed in different ways, which will lead to reducing the burden on landfills and, eventually, reduce the need for the land to meet the landfilling demand [85]. If RA were to be used as a replacement for the NA in the mixes under investigation, the amount of waste disposed of in the landfill could be reduced. Indeed, the recycling plant referred to in this work recycles 100% of CDW. This can be considered an added benefit to the use of RA in concrete production and is included in the multifunctional performance index calculations later by considering any RA used as waste beneficially recycled rather than being wastefully disposed of. For instance, mix 100RA-3SF included 1130 kg/m3 of RA. As such, this value was considered to be waste used and not disposed of. In comparison, the control mix entailed the wasteful disposal of 1130 kg of CDW for every 1 m3 of concrete produced.

4.5.2. Economic Impact Assessment

Table 9 presents the results of the economic impact assessment. Since the recycled aggregates had a price range of USD0.005–USD0.0081 per kg, as acquired from the recycling plant, the total price had two values, i.e., lower and higher. Such pricing was primarily dependent on the distance, among other factors. Calculations were carried out based on the cost of the raw materials used in the production of the concrete mixes. For instance, the lower total cost of mix 100RA-1SF (181.6 USD/m3) was determined by summing the products of 480 by 0.0756, 650 by 0.0052, 1090 by 0.0054, 180 by 0.00212, 4.8 by 1.9278, and 78 by 1.62. Furthermore, the cost of the control mix was USD46.61 per cubic meter of concrete (USD/m3). The replacement by 30% RA did not alter the total cost, while the introduction of steel fibers with 70 and 100% RA had a significant impact. In fact, mixes incorporating steel fibers were at least three times more expensive than the control mix. Their high cost was attributed to the high cost of the steel fibers (USD1.62 per kg). Additionally, the addition of cement in mix 100RA-Cem increased the cost by approximately 34%. Conversely, adding slag or fly ash only increased the cost by up to 7 and 14%, respectively, while the incorporation of microsilica could at least provide concrete with an equal cost to the control. In addition to offering concrete with a similar cost to the control, the use of slag, fly ash, and microsilica contributed to the reduction in the amount of cement required.

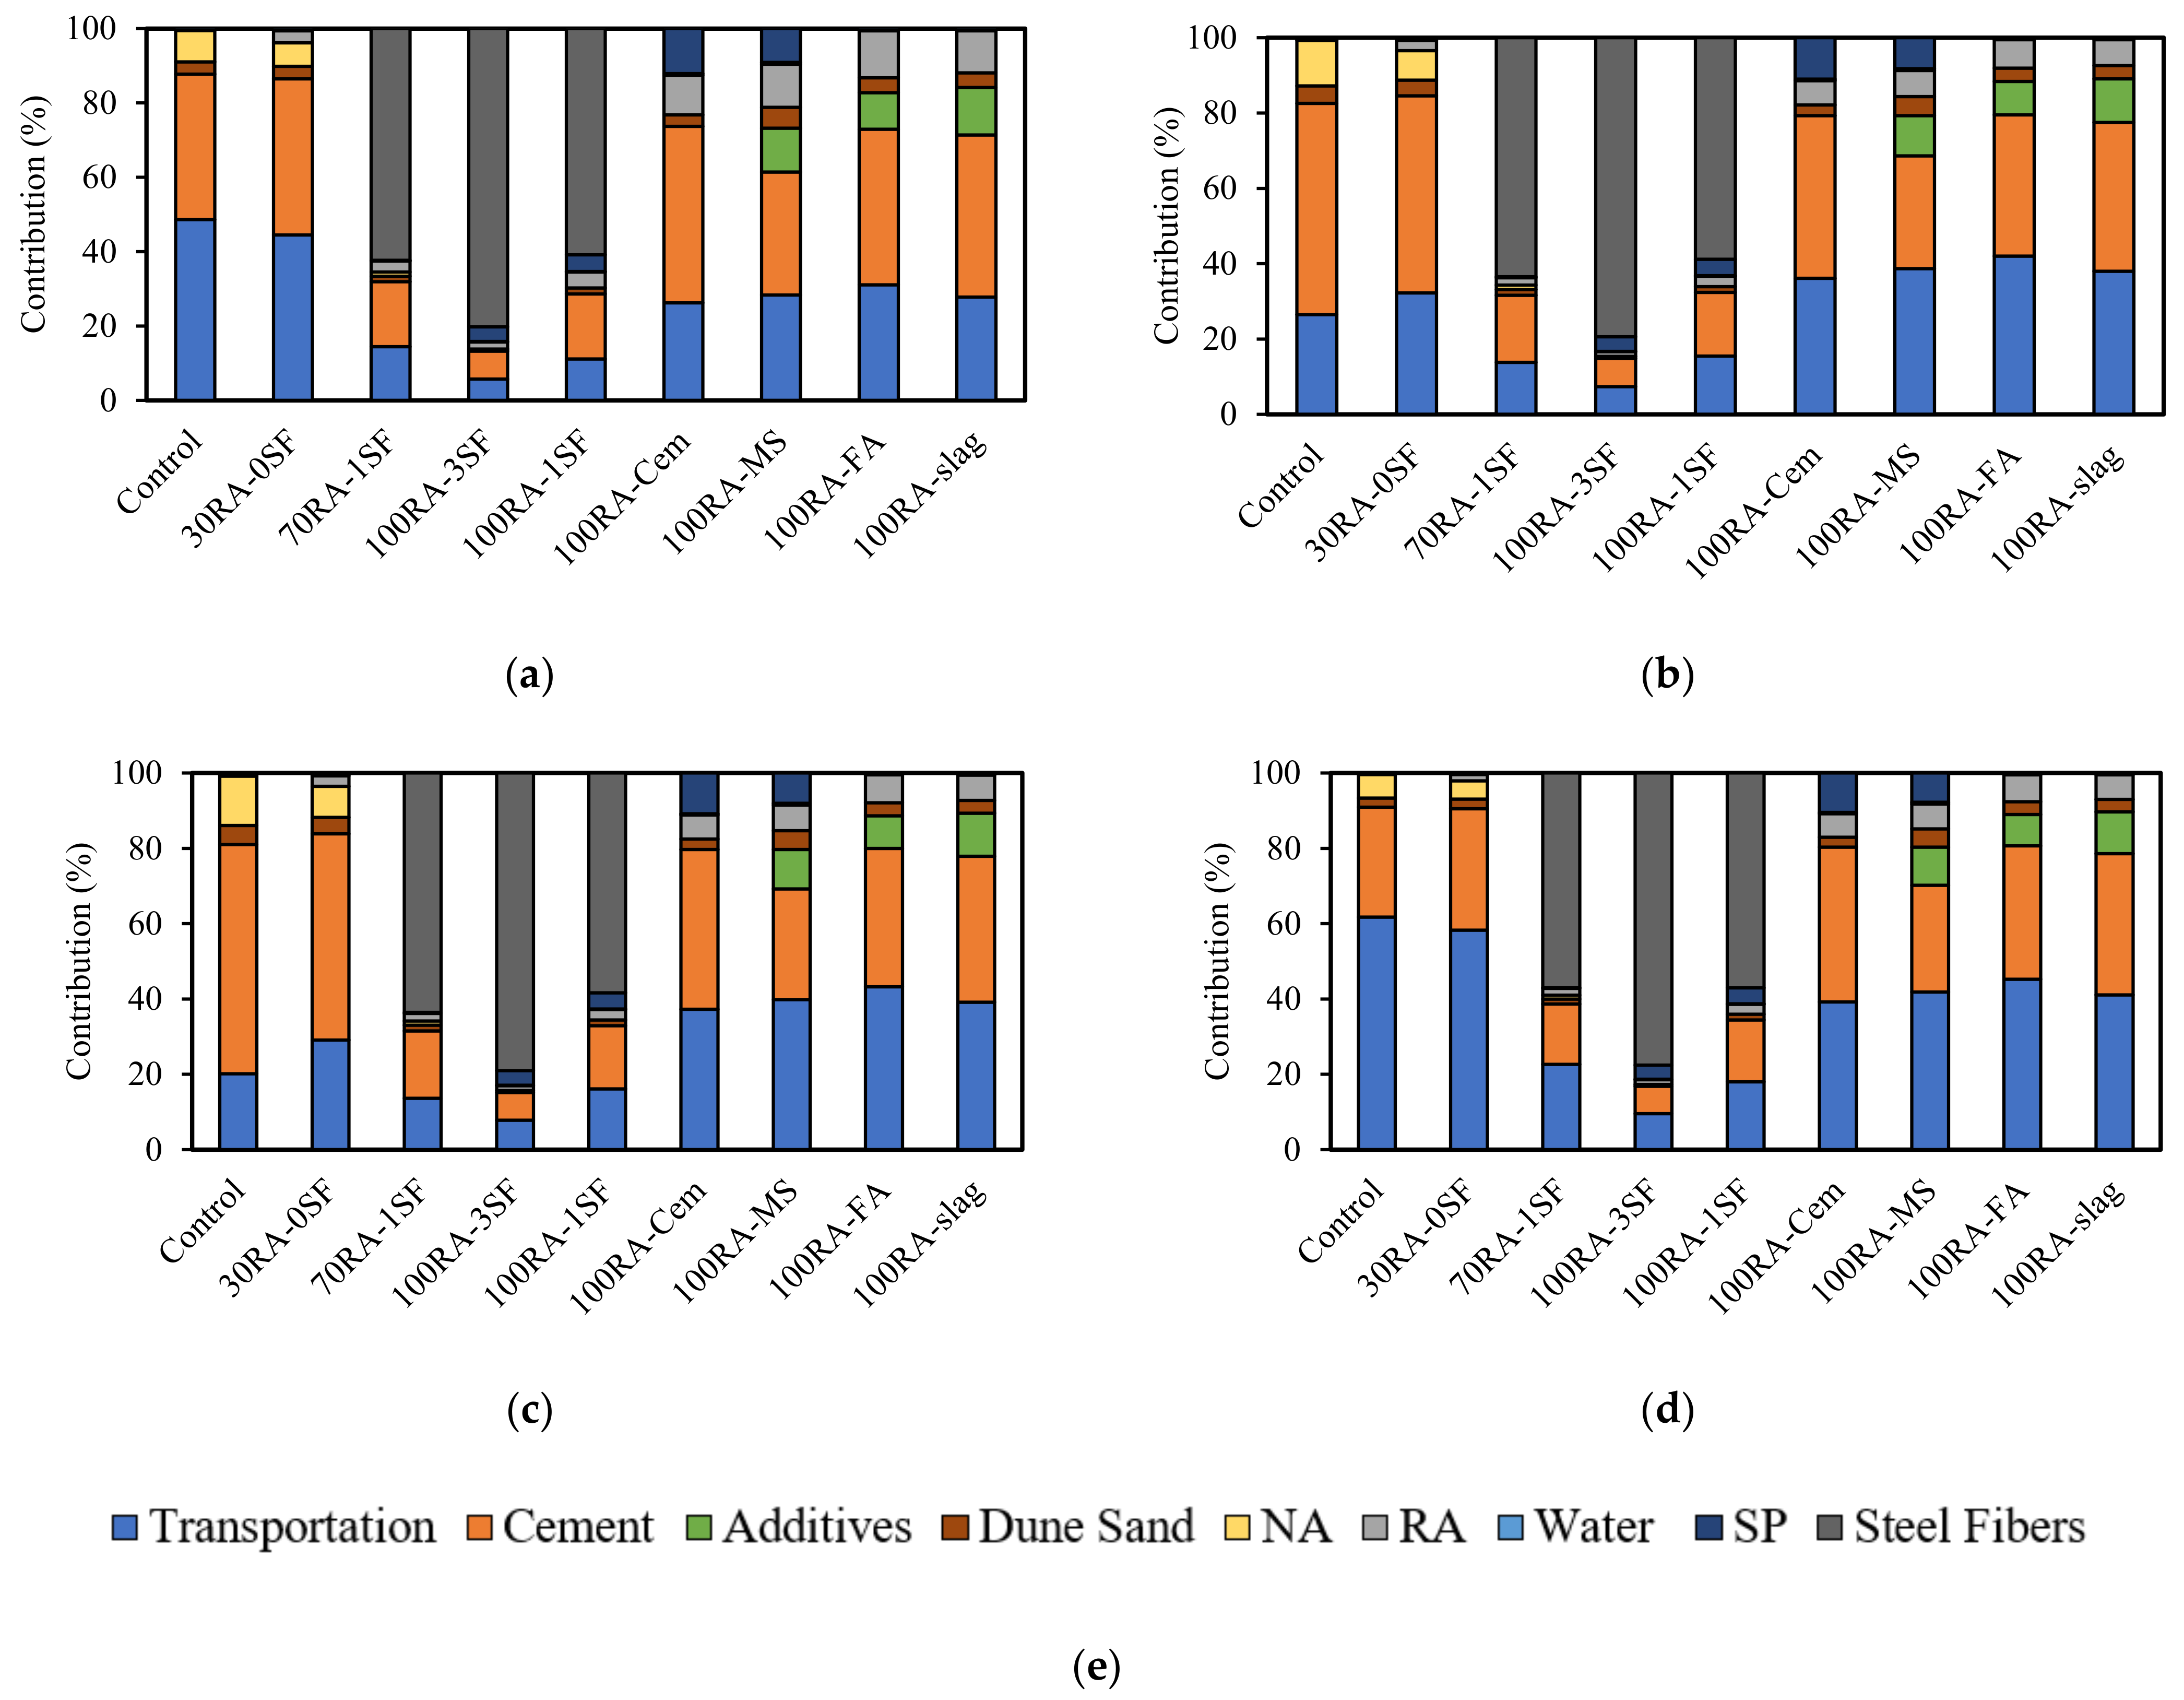
4.5.3. Transportation Impact

The contribution of transportation to the environmental and economic impacts was studied based on the recommendations of past work [2,39,41,46]. It is worth noting that the distances mentioned in Table 1 were based on round trips. Additionally, the contributions of transporting NA, RA, steel fibers, fly ash, slag, microsilica, and superplasticizer to the environmental and cost analysis were considered, as the remaining concrete components, cement, water, and dune sand, were readily available at concrete plants.
Table 10 shows the environmental impact of concrete production and transportation. The calculation for the environmental impact of transportation was determined by adding the products of multiplying the emission factor of the typical transportation vehicle (2.0027 × 10⁻⁴ kg CO2eq/km.kg) by the proportions of RA, NA, SF, and mineral additives in Table 5 and the roundtrip distance for each zone in Table 1. For example, the environmental impact of transportation for mix 100RA-1SF in Zone 1 (86.1 kg CO2eq) was calculated by adding the products of 1090 by 0.00020027 and 368, and 78 by 0.00020027 and 368. Furthermore, for mixes created with NA, among the four zones, the contribution of NA transportation was the lowest for Zone 3, where the NA is locally sourced. Conversely, the highest transportation contribution was recorded for Zone 4, the furthest zone from the NA source. Indeed, transporting mixes Control, 30RA-0SF, and 70RA-1SF to Zone 3 was 84, 71, and 46% less than transporting it to Zone 4. These results also showed that NA transportation contribution tends to increase with distance and decrease with a higher RA replacement percentage.
Similar trends were also observed for both RA and SF. RA transportation contribution increased with an increased distance and the increased replacement percentage. The highest GWP for transportation was recorded for transporting RA to Zone 4. Yet, it was 46% less than that of transporting NA to the same zone, i.e., Zone 4. In fact, except for mix 100RA-3SF, which had a 12% higher total environmental impact, all RA mixes had a lower transportation contribution than the NA-based control mix. As such, it was generally more environmentally friendly to use RA in Zone 4 rather than NA. Furthermore, steel fiber transportation did not record a high contribution to the overall GWP of the mixes (production + transportation). Its highest contribution was almost 4% for mix 100RA-3SF mixed in Zone 4 followed by Zone 3. This was owed to the low volume fractions of steel fibers used in the concrete mixes.
For mixes incorporating additives, such as microsilica, fly ash, or slag, the mix created with slag had the lowest environmental impact across these mixes, as they required the least amount of RA according to the mixture proportions of Table 5. However, when accounting for the GWP for the concrete mix production, the mix created with 100% RA and microsilica had the lowest environmental impact among these mixes and all mixes in general.
Table 10 shows the cost results of adding the impact of transportation of concrete components to the overall cost of concrete production. The calculation for the total environmental impact was carried out by adding the GWP of production in Table 7 and the environmental impact of transportation. For instance, the total environmental impact of mix 100RA-1SF in Zone 1 (589.3 kg CO2eq) was calculated by adding the GWP of production (503.2 kg CO2eq) and the environmental impact of transportation (86.1 kg CO2eq). Furthermore, the cost ranged from USD65 per m3 to USD489 per m3. For Zones 1 and 4, mixes created with 100% RA and incorporating more cement or additives had lower transportation costs than the control mix. This was due to the higher cost of transporting NA in these two zones. In contrast, the control mix was less expensive in the remaining two zones (Zones 2 and 3). The cost of RA transporting was the highest for Zone 4; yet, it was still much lesser than that of NA. The effect of the inclusion of additives on the cost was also addressed. Without including the production cost, the mix created with 100% RA and slag had the lowest cost irrespective of the zone. Contrarily, that incorporating microsilica was cheapest if the production cost was considered.

4.5.4. Ecological Profitability Distance

The ecological profitability distance (EPD) was determined as the minimum roundtrip transport distance below which NA-based concrete would have a lower environmental or economic impact than RA concrete irrespective of RA transport distance. Such an approach was adopted in past studies in France and Serbia [11,39]. It entails drawing a horizontal line from the point with zero abscissa for a certain mix to the curve of the control mix. The abscissa of this intersection point is the EPD where the RA mixes are equally environmentally and economically profitable to the NA-based control mix.
The relationship between GWP of different NA- and RA-based concrete mixes and aggregate transport distance is shown in Figure 6a. The EPD for mixes 100RA-3SF, 100RA-1SF, and 100RA-Cem are 893, 333, and 378 km, respectively. This showed that, beyond these roundtrip distances, the RA mixes were more environmentally advantageous than the NA-based control mix. As such, the former mix was only environmentally profitable in Zone 4, while the latter two were suitable for Zones 1 and 4. As Zones 2 and 3 were lesser than any of these EPDs, the SF-reinforced concrete mix or that created with more cement were not environmentally feasible in these two zones. Furthermore, mixes created with microsilica, slag, or fly ash as a partial replacement to cement have negative EPDs, signifying that such 100% RA mixes are always more environmentally profitable than the NA-based control mix, regardless of the delivery zone. Yet, among the three, the mix having microsilica was most advantageous.
From an economic standpoint, the cost of each mix was plotted against the aggregate transport distance, as shown in Figure 6b. Steel fiber-reinforced RA mixes (100RA-3SF and 100RA-1SF) were not economically feasible in any zone in the UAE with respective EPDs of 6514 and 2221 km. In contrast, the mix created with additional cement (100RA-Cem) had an EPD of 259 km, rendering it the more economical solution than the NA-based control mix in Zones 1, 2, and 4. Additionally, mixes replacing cement with microsilica, fly ash, and slag were more suitable than the control mix in all zones. Based on these results, it can be concluded that 100% RA concrete mixes incorporating microsilica, fly ash, or slag in partial replacement for cement were more economically and environmentally advantageous than NA-based mixes for all distances. The addition of cement may also be profitable at distances exceeding 378 km. In turn, SF-reinforced RA concrete could not satisfy both conditions due to its expensive cost. Perhaps, the use of less expensive alternative fibers may lower the associated economic impact. Still, it is worth noting that the results presented herein were based on LCI data that represented the UAE and on aggregate transportation in the UAE.

4.5.5. Discussion and Interpretation

The contribution of the different materials and the transportation of NA, RA, and SF to the overall GWP for producing 1 m3 of concrete in Zones 1–4 is demonstrated in Figure 7. Results showed that the cement proportion always presented the highest contribution to the GWP of the mixes. This was because of the extensive emissions of carbon dioxide associated with the cement calcination process and fossil fuel consumption [44]. Additionally, the cement contribution of GWP tended to increase with increasing the RA replacement percentage. It should be noted that this increase was not attributed to increasing the amount of cement as the RA content increased, but rather the high contribution of cement despite the decrease in the total GWP of the mix. These results fell in line with the findings of other studies [2,10,37,39,44,86].
Furthermore, Figure 7 highlights that the transport phase was the second-highest contributor to the GWP of the studied mixes except for mix 100RA-3SF. Higher transportation contributions are associated with longer traveling distances. Values ranged from 14 to 39% of the total environmental impact. For example, the contribution of transportation to produce the control mix in Zones 1 and 4, which were the furthest from the NA local source, were 39 and 27%, respectively. In turn, 100% RA mixes were less sensitive to distance, with transportation contribution ranging between 14 and 29%. Among such mixes, those created with microsilica had the highest value regardless of the zone, owing to the lower cement contribution. As for the additives, mixes incorporating SF had the highest additive contribution with values in the range of 9–27%. This was because SF production has a high environmental footprint.
Results, shown in Figure 8, summarize the contribution of the different materials and transportation of NA, RA, and SF to the cost of preparing 1 m3 of concrete. For the NA-based control mix, the transportation and cement had the highest contributions with the former being dominant in Zones 1 and 4, while the latter in Zones 2 and 3. The contribution was more equally divided between these two parameters in mixes incorporating more cement, microsilica, fly ash, or slag. Conversely, SF-reinforced mixes had the SF contribution ranging between 63 and 85% across the four zones. The contribution of cement cost was almost higher than transportation except in the mixes that were produced in Zone 4. This high share of transport can be justified by the fact that Zone 4 was the furthest from the sources of the materials that were accounted for in transportation (NA, RA, and SF).

5. Multifunctional Performance Indices

The individual criterion investigated in this work included the environmental impact, cost, waste production, slump, compressive strength, and flexural strength. However, each of these is an individual measure. To better comprehend the combined effect of these variables and adequately select the optimum concrete mix, multifunctional performance indices (PI) were determined.
This method is a management tool that incorporates multiple datasets from individual measures into a single evaluation measure [87]. In this process, the individual measures, i.e., the environmental impact, cost, waste production, slump, compressive strength, and flexural strength, were first given a weighted ranking (Wi). In turn, the mix with the best test value for each criterion was given a value of 1.00. For instance, a mix with the lowest environmental cost or one with the highest f’c was assigned a value of 1.00. The remaining mixes were proportioned with respect to this best value to obtain Wi using Equation (2). This measure was then multiplied by a factor of five to attain a numeric index (Ni) and was, in turn, multiplied by the other numeric indices corresponding to the other measures to obtain a score Sn, as per Equation (3). The mix with the highest score was designated with a score Sn,max. The performance index (PI) was then calculated as the ratio of Sn by Sn,max (Equation (4)). The mix with the highest PI value was considered the optimum for a set of combined measures.
W i = Measured   performance   value Best   performance   value
Sn = Ni1 × Ni2 × Ni3 × … × Nin
PI = S n S n , max   ×   100
Table 11 shows the criterion weighted ranking (Wi). A value of 1.00 is in bold to highlight the mix with the optimum individual performance. In terms of environmental impact and cost, the mix created with 100% RA and microsilica was optimum in Zones 1 and 4, while the control mix was reported as optimum, in terms of cost, for Zones 2 and 3. Considering waste generation, all mixes created with 100% RA were deemed most suitable across all zones. Furthermore, as the control mix had the highest slump, it was regarded as the best mix for workability purposes. As for the compressive strength, mix 30RA-0SF was optimum. Although it was considered superior to the other mixes, the Wi values were within 10%, as the mixes were designed to attain f’c of 30 MPa. As for the flexural strength, the addition of 3% steel fiber volume fraction rendered mix 100RA-3SF most suitable for applications that require superior flexural performance.
The combined effect of multiple measures was evaluated using multifunctional performance indices, as shown in Table 12. These indices combined different criteria—PI-1: environmental impact, cost, and waste; PI-2: environmental impact, cost, waste, and slump; PI-3: environmental impact, cost, waste, slump, and compressive strength; PI-4: slump, compressive strength, and flexural strength; PI-5: compressive and flexural strengths; PI-6: all individual criteria. Based on these categories, the mix created with 100% RA and microsilica was optimum if the main concerns were environmental impact, cost, waste reduction, slump, and compressive strength (PI-1, PI-2, PI-3). Under these conditions, mixes incorporating steel fibers were least favorable. Furthermore, in other applications that demand workability and superior mechanical properties (PI-4, PI-5), the mix created with 100% RA and 3% SF, by volume, was favored. However, it is worth noting that mixes with lesser RA replacement were not favorable with PI values of 56 and 63%. A similar note can be made about adding more cement with a PI value of 60%. In the event that all individual criteria were required (PI-6), the mix incorporating 100% RA and fly ash was most suitable, followed closely by that created with 100% RA and microsilica. Conversely, the control mix and those with SF inclusion were least suitable. These findings were independent of the zone where the concrete would be employed.

6. Conclusions

This paper investigated the environmental and economic feasibility of using recycled aggregates (RA) in producing several sustainable concrete mixes in the Emirate of Abu Dhabi, United Arab Emirates (UAE), by applying ISO 14040’s life cycle assessment methodology. The slump and mechanical properties of these mixes were evaluated and compared to those of a natural aggregate (NA)-based concrete counterpart. Results of the mixes of the current study, in addition to those of similar mixes with steel fibers (SF) published in the literature, were used as input data in the life cycle assessment (LCA). The contribution of transportation to the environmental and economic impacts was also determined. The findings of this paper are summarized as follows:
  • The replacement of NA by 100% RA decreased the slump and density of concrete mixes. Slump values further decreased upon the addition of steel fibers and microsilica, but less reduction was noted when slag and fly ash replaced the cement. The density only increased with steel fiber inclusion.
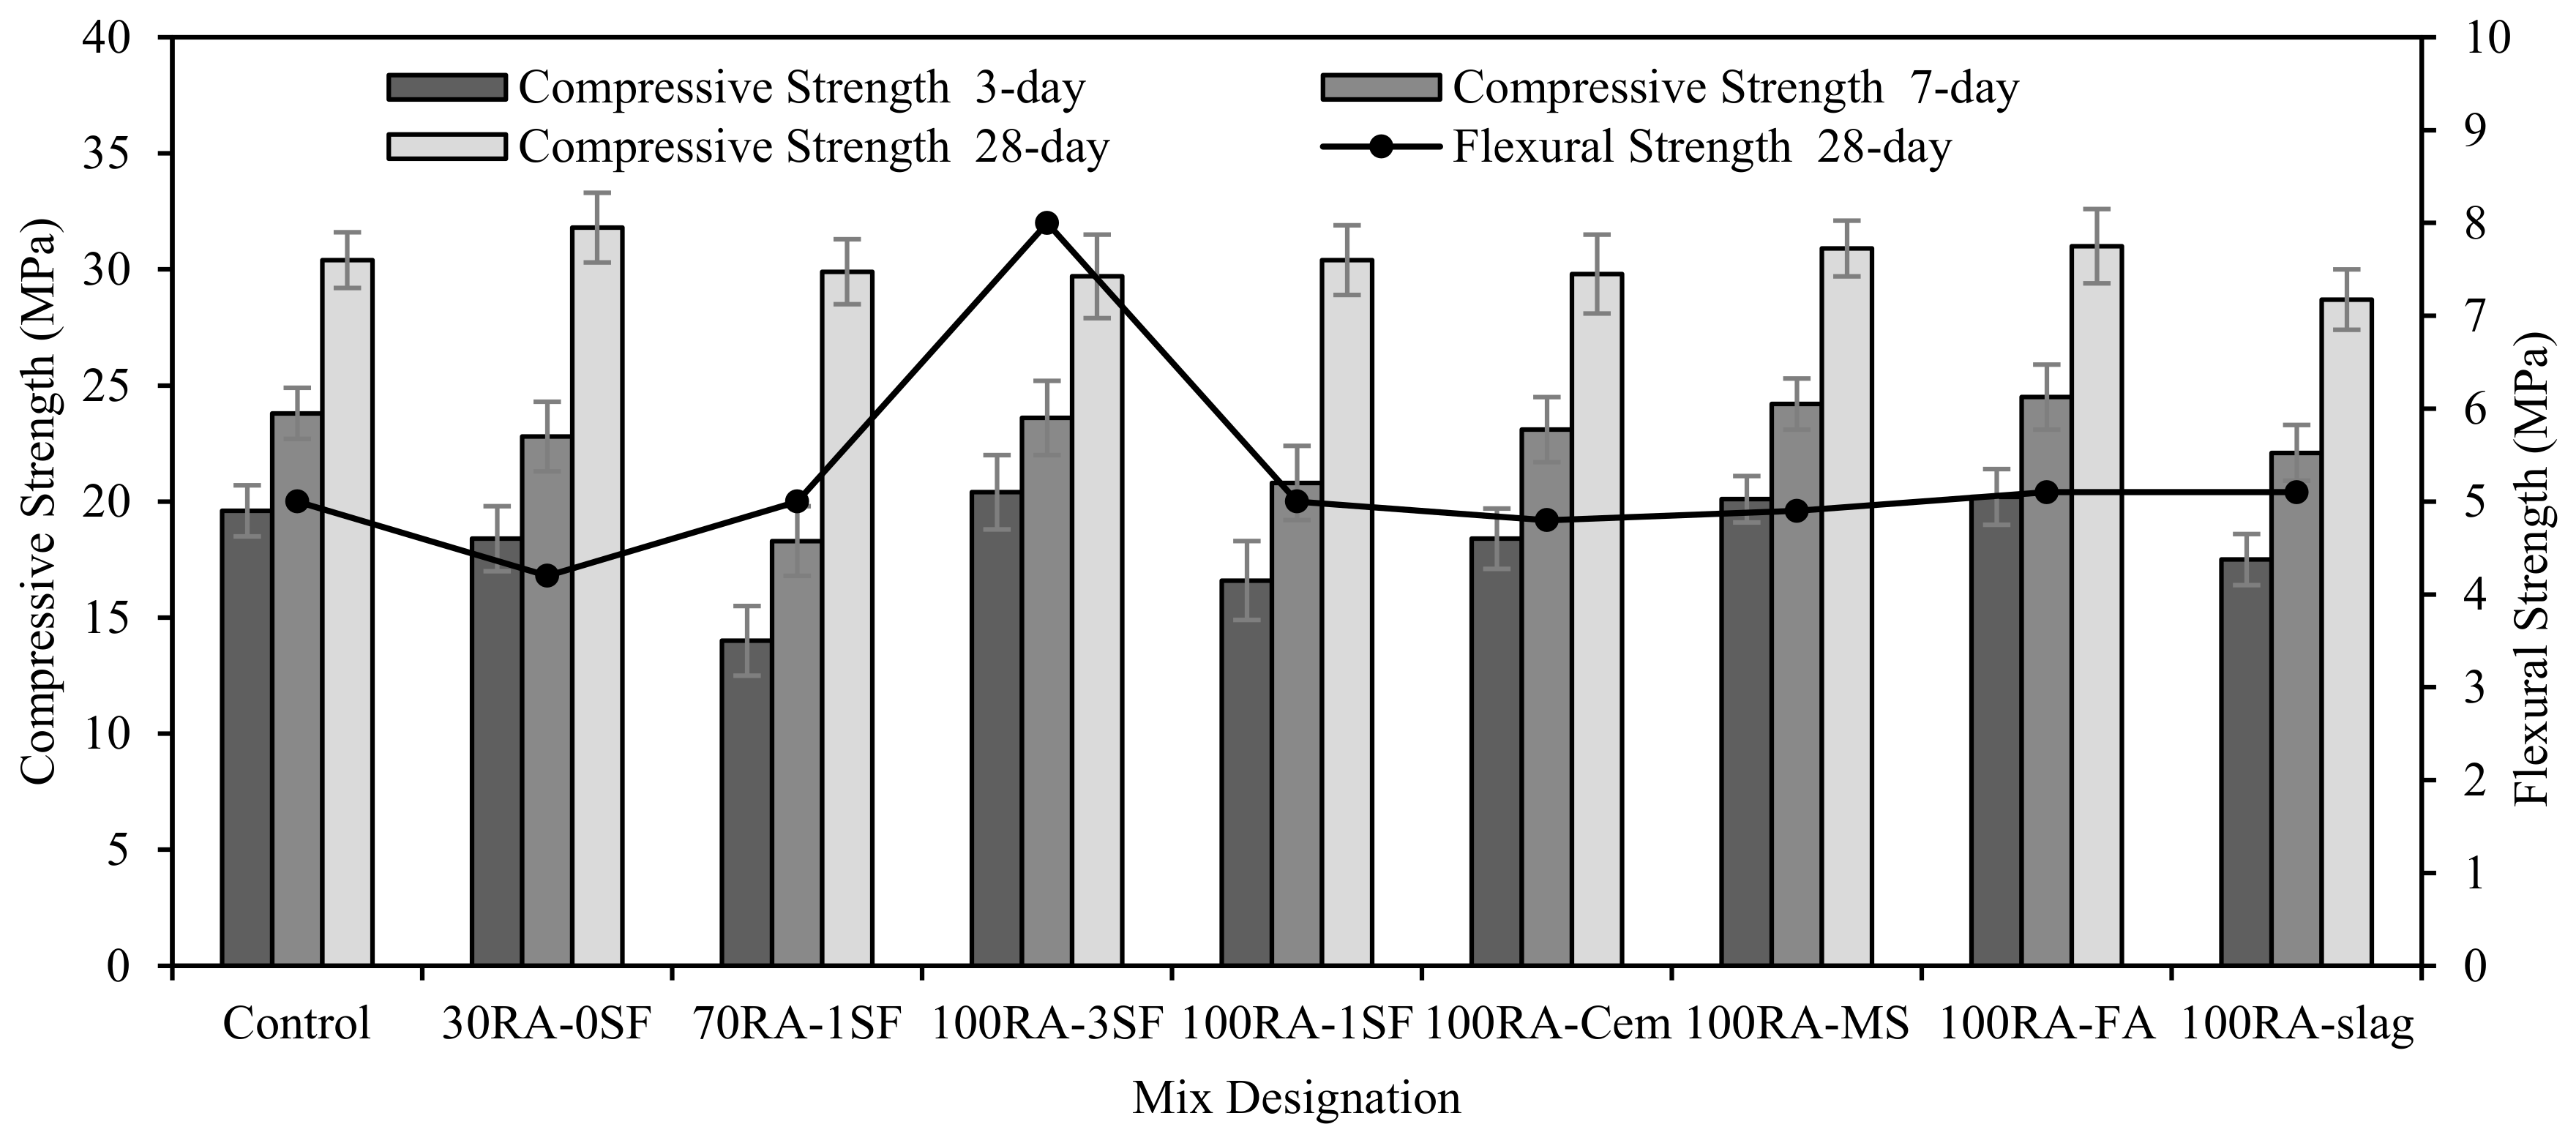
  • Compressive strength results showed a variation in the initial strength and different strength development profiles over time. RA replacement caused a decrease in compressive strength but could be countered by the addition of steel fibers or cement or the replacement of cement by slag, fly ash, or microsilica. This showed that RA can deliver the same concrete compressive strength as that created with NA subject to using certain doses of additives. Flexural strength results showed a similar pattern to the compressive strength. All the mixes recorded similar flexural strength to the control except mix 100RA-3SF, which recorded a 60% increase. This increase was attributed to the bridging effect of the fibers.
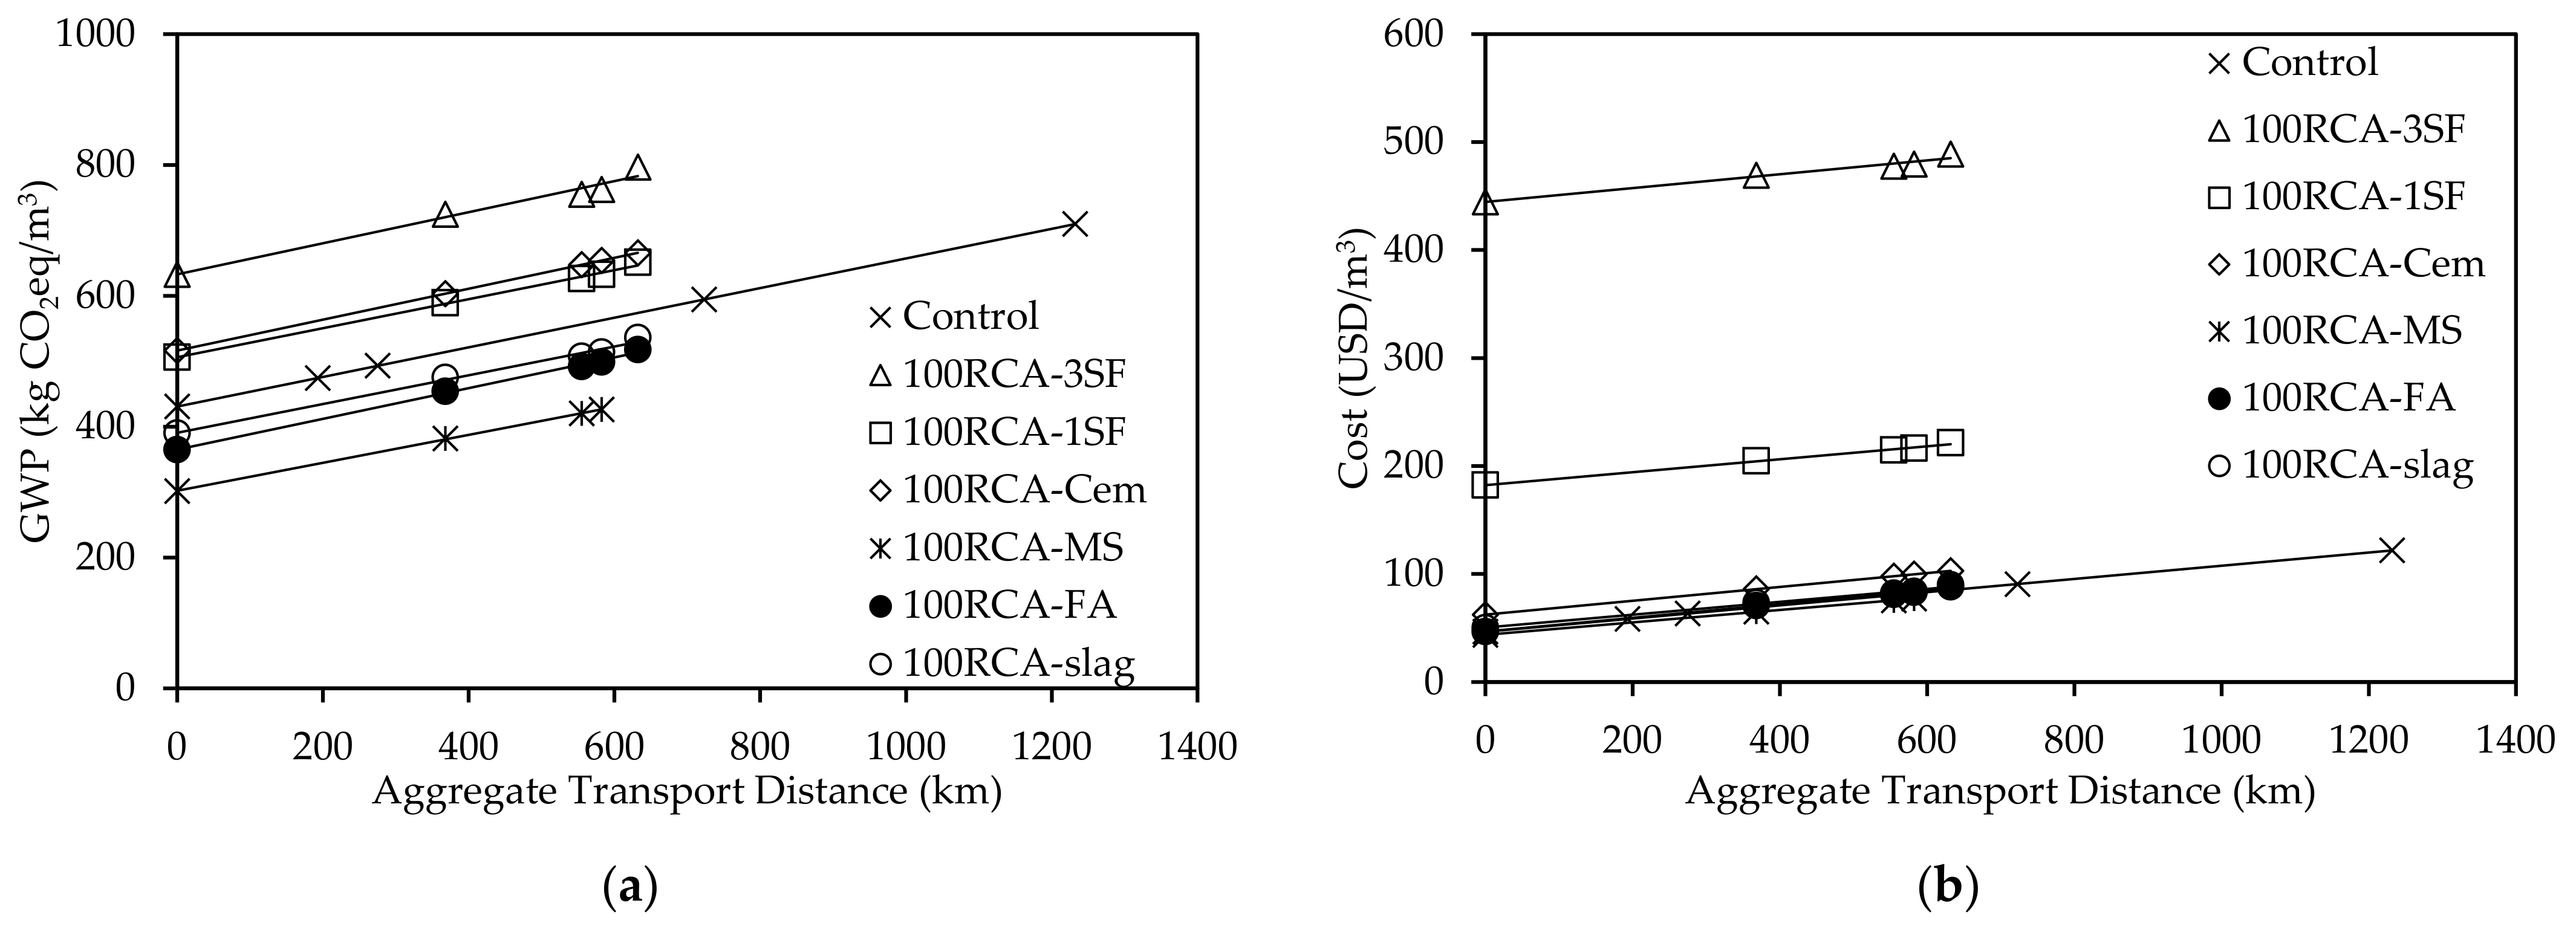
  • Environmental impact assessment results showed that replacing NA with RA led to lower global warming potential (GWP). Mixes with cement replacement by microsilica, fly ash, and slag had up to 32% lower GWP due to lesser cement being used in the mix compared to the NA-based control mix. Conversely, SF-reinforced mixes recorded an increase in the GWP ranging between 13 and 45%. The contribution of cement to GWP was the highest in all concrete mixes but decreased from over 90% to as low as 67% when SF was incorporated into the mixes.
  • Economic impact assessment results showed that the replacement of NA by RA slightly decreased the cost of the mix. The replacement of cement by fly ash, slag, or microsilica had a limited effect on the cost, while the addition of cement was more impactful. In turn, the inclusion of steel fibers increased the cost by at least three times, owing to the expensive cost of the fibers.
  • The transportation impact study showed that material transportation was a significant contributor to the environmental and economic burdens of concrete mixes. Transportation contribution came second only to cement. It increased with a larger travel distance and steel fiber inclusion and decreased with RA replacement.
  • The ecological profitability distance from an environmental and economic impact standpoint was 378 km from the NA source for mixes created with more cement. In turn, steel fiber-reinforced RA concrete mixes were environmentally favorable over NA-based mixes in one to two zones, but were not economically feasible in any zone. Conversely, mixes created with microsilica, fly ash, and slag were more environmentally and economically advantageous than NA-based concrete mixes across all zones in the UAE.
  • Multifunctional performance indexing showed that the mix created with 100% RA and microsilica was optimum for applications concerning slump, compressive strength, environmental and economic impact, and waste reduction. Contrarily, in applications demanding a superior mechanical performance, the mix created with 100% RA and 3% steel fiber volume fraction was most favorable. For applications that required optimizing all individual measures, the mix created with 100% RA and fly ash was deemed most suitable followed by that incorporating 100% RA and microsilica.
This research provides evidence to the economic and environmental feasibility of producing structural grade concrete (f’c of 30 MPa) created with 100% recycled aggregates subject that certain types and quantities of additives be incorporated into the mix design. Nevertheless, the widespread adoption of RA requires the availability of more construction and demolition waste (CDW) recycling facilities across the UAE, thereby reducing the ecological profitability distance, decreasing the environmental and economic impacts, and promoting the replacement of NA by RA.

Author Contributions

Conceptualization, M.H.A. and H.E.-H.; methodology, M.H.A. and H.E.-H.; validation, M.H.A., H.E.-H. and T.E.-M.; formal analysis, M.H.A. and H.E.-H.; investigation, M.H.A., H.E.-H. and T.E.-M.; data curation, M.H.A. and H.E.-H.; writing—original draft preparation, M.H.A. and H.E.-H.; writing—review and editing, M.H.A., H.E.-H. and T.E.-M.; visualization, M.H.A. and H.E.-H.; supervision, H.E.-H. and T.E.-M.; project administration, H.E.-H.; funding acquisition, H.E.-H. and T.E.-M. All authors have read and agreed to the published version of the manuscript.

Funding

This project was supported by the United Arab Emirates University (UAEU) (grant number 31N398).

Institutional Review Board Statement

Not applicable.

Informed Consent Statement

Not applicable.

Data Availability Statement

Data is available upon request.

Acknowledgments

The authors are thankful to Al Dhafra Recycling Facilities for providing the recycled concrete aggregates.

Conflicts of Interest

The funders had no role in the design of the study; in the collection, analyses, or interpretation of data; in the writing of the manuscript, or in the decision to publish the results.

References

  1. Chen, J.; Hua, C.; Liu, C. Considerations for better construction and demolition waste management: Identifying the decision behaviors of contractors and government departments through a game theory decision-making model. J. Clean. Prod. 2019, 212, 190–199. [Google Scholar] [CrossRef]
  2. Hossain, M.U.; Poon, C.S.; Lo, I.M.C.; Cheng, J.C.P. Comparative environmental evaluation of aggregate production from recycled waste materials and virgin sources by LCA. Resour. Conserv. Recycl. 2016, 109, 67–77. [Google Scholar] [CrossRef]
  3. Rosado, L.P.; Vitale, P.; Penteado, C.S.G.; Arena, U. Life cycle assessment of natural and mixed recycled aggregate production in Brazil. J. Clean. Prod. 2017, 151, 634–642. [Google Scholar] [CrossRef]
  4. Saghafi, M.; Teshnizi, Z. Recycling value of building materials in building assessment systems. Energy Build. 2011, 43, 3181–3188. [Google Scholar] [CrossRef]
  5. Eurostat Waste Statistics. Available online: https://ec.europa.eu/eurostat/statistics-explained/index.php/Waste_statistics (accessed on 2 December 2020).
  6. EPA. Sustainable Management of Construction and Demolition Materials. Available online: https://www.epa.gov/smm/sustainable-management-construction-and-demolition-materials (accessed on 2 December 2020).
  7. Zheng, L.; Wu, H.; Zhang, H.; Duan, H.; Wang, J.; Jiang, W.; Dong, B.; Liu, G.; Zuo, J.; Song, Q. Characterizing the generation and flows of construction and demolition waste in China. Constr. Build. Mater. 2017, 136, 405–413. [Google Scholar] [CrossRef] [Green Version]
  8. SCAD Agriculture & Environment. Available online: https://www.scad.ae (accessed on 5 January 2021).
  9. Blaisi, N.I. Construction and demolition waste management in Saudi Arabia: Current practice and roadmap for sustainable management. J. Clean. Prod. 2019, 221, 167–175. [Google Scholar] [CrossRef]
  10. Braga, A.M.; Silvestre, J.D.; de Brito, J. Compared environmental and economic impact from cradle to gate of concrete with natural and recycled coarse aggregates. J. Clean. Prod. 2017, 162, 529–543. [Google Scholar] [CrossRef]
  11. Marinković, S.; Radonjanin, V.; Malešev, M.; Ignjatović, I. Comparative environmental assessment of natural and recycled aggregate concrete. Waste Manag. 2010, 30, 2255–2264. [Google Scholar] [CrossRef] [PubMed]
  12. Zion Market Research. Construction Aggregates Market by Product Type and by End-User: Global Industry Perspective, Comprehensive Analysis, and Forecast. Available online: https://www.zionmarketresearch.com/report/construction-aggregates-market (accessed on 5 January 2021).
  13. Xu, L.-Y.; Qian, L.-P.; Huang, B.-T.; Dai, J.-G. Development of artificial one-part geopolymer lightweight aggregates by crushing technique. J. Clean. Prod. 2021, 315, 128200. [Google Scholar] [CrossRef]
  14. Qian, L.-P.; Wang, Y.-S.; Alrefaei, Y.; Dai, J.-G. Experimental study on full-volume fly ash geopolymer mortars: Sintered fly ash versus sand as fine aggregates. J. Clean. Prod. 2020, 263, 121445. [Google Scholar] [CrossRef]
  15. Tajra, F.; Elrahman, M.A.; Stephan, D. The production and properties of cold-bonded aggregate and its applications in concrete: A review. Constr. Build. Mater. 2019, 225, 29–43. [Google Scholar] [CrossRef]
  16. Xu, L.-Y.; Huang, B.-T.; Dai, J.-G. Development of engineered cementitious composites (ECC) using artificial fine aggregates. Constr. Build. Mater. 2021, 305, 124742. [Google Scholar] [CrossRef]
  17. El-Hassan, H.; Ismail, N.; Al Hinaii, S.; Alshehhi, A.; Al Ashkar, N. Effect of GGBS and curing temperature on microstructure characteristics of lightweight geopolymer concrete. In MATEC Web of Conferences; EDP Sciences: Ulis, France, 2017; Volume 120, p. 03004. [Google Scholar]
  18. Ismail, N.; El-Hassan, H. Development and Characterization of Fly Ash/Slag-Blended Geopolymer Mortar and Lightweight Concrete. J. Mater. Civ. Eng. 2018, 30, 04018029. [Google Scholar] [CrossRef]
  19. Hu, D.; You, F.; Zhao, Y.; Yuan, Y.; Liu, T.; Cao, A.; Wang, Z.; Zhang, J. Input, stocks and output flows of urban residential building system in Beijing city, China from 1949 to 2008. Resour. Conserv. Recycl. 2010, 54, 1177–1188. [Google Scholar] [CrossRef]
  20. Silva, R.V.; de Brito, J.; Dhir, R.K. Use of recycled aggregates arising from construction and demolition waste in new construction applications. J. Clean. Prod. 2019, 236, 117629. [Google Scholar] [CrossRef]
  21. Rodríguez-Robles, D.; García-González, J.; Juan-Valdés, A.; Morán-del Pozo, J.M.; Guerra-Romero, M.I. Quality Assessment of Mixed and Ceramic Recycled Aggregates from Construction and Demolition Wastes in the Concrete Manufacture According to the Spanish Standard. Materials 2014, 7, 5843–5857. [Google Scholar] [CrossRef] [Green Version]
  22. Silva, R.V.; de Brito, J.; Dhir, R.K. Properties and composition of recycled aggregates from construction and demolition waste suitable for concrete production. Constr. Build. Mater. 2014, 65, 201–217. [Google Scholar] [CrossRef]
  23. Yang, J.; Du, Q.; Bao, Y. Concrete with recycled concrete aggregate and crushed clay bricks. Constr. Build. Mater. 2011, 25, 1935–1945. [Google Scholar] [CrossRef]
  24. Klang, A.; Vikman, P.-Å.; Brattebø, H. Sustainable management of demolition waste—An integrated model for the evaluation of environmental, economic and social aspects. Resour. Conserv. Recycl. 2003, 38, 317–334. [Google Scholar] [CrossRef]
  25. Gayarre, F.L.; López-Colina, C.; Serrano, M.A.; López-Martínez, A. Manufacture of concrete kerbs and floor blocks with recycled aggregate from C&DW. Constr. Build. Mater. 2013, 40, 1193–1199. [Google Scholar] [CrossRef]
  26. Soutsos, M.N.; Tang, K.; Millard, S.G. Use of recycled demolition aggregate in precast products, phase II: Concrete paving blocks. Constr. Build. Mater. 2011, 25, 3131–3143. [Google Scholar] [CrossRef]
  27. De Brito, J.; Rui, S. Current status on the use of recycled aggregates in concrete: Where do we go from here? RILEM Tech. Lett. 2016, 1, 1. [Google Scholar] [CrossRef]
  28. Sormunen, P.; Kärki, T. Recycled construction and demolition waste as a possible source of materials for composite manufacturing. J. Build. Eng. 2019, 24, 100742. [Google Scholar] [CrossRef]
  29. Devi, S.V.; Gausikan, R.; Chithambaranathan, S.; Jeffrey, J.W. Utilization of recycled aggregate of construction and demolition waste as a sustainable material. Mater. Today Proc. 2021, 45, 6649–6654. [Google Scholar] [CrossRef]
  30. Surendar, M.; Ananthi, G.B.G.; Sharaniya, M.; Deepak, M.S.; Soundarya, T.V. Mechanical properties of concrete with recycled aggregate and M−sand. Mater. Today Proc. 2021, 44, 1723–1730. [Google Scholar] [CrossRef]
  31. Bhat, A.A.; Kaur, E.P.; Talwar, E.K. A Comparative Study of Concrete Incorporating Recycled Concrete Aggregates and Microsilica (Silica Fume) to Develop a Sustainable Construction Material. Int. J. Eng. Res. Technol. 2018, 7, 193–205. [Google Scholar]
  32. El-Hassan, H.; Kianmehr, P.; Zouaoui, S. Properties of pervious concrete incorporating recycled concrete aggregates and slag. Constr. Build. Mater. 2019, 212, 164–175. [Google Scholar] [CrossRef]
  33. Kachouh, N.; El-Hassan, H.; El-Maaddawy, T. The Use of Steel Fibers to Enhance the Performance of Concrete Made with Recycled Aggregate. In Proceedings of the Fifth International Conference on Sustainable Construction Materials and Technologies (SCMT5), London, UK, 15–17 July 2019. [Google Scholar]
  34. Kachouh, N.; El-Hassan, H.; El-Maaddawy, T. Effect of steel fibers on the performance of concrete made with recycled concrete aggregates and dune sand. Constr. Build. Mater. 2019, 213, 348–359. [Google Scholar] [CrossRef]
  35. Kachouh, N.; El-Hassan, H.; El-Maaddawy, T. Influence of steel fibers on the flexural performance of concrete incorporating recycled concrete aggregates and dune sand. J. Sustain. Cem. Mater. 2020, 10, 165–192. [Google Scholar] [CrossRef]
  36. Kou, S.C.; Poon, C.S.; Chan, D. Influence of fly ash as a cement addition on the hardened properties of recycled aggregate concrete. Mater. Struct. 2008, 41, 1191–1201. [Google Scholar] [CrossRef]
  37. Turk, J.; Cotič, Z.; Mladenovič, A.; Šajna, A. Environmental evaluation of green concretes versus conventional concrete by means of LCA. Waste Manag. 2015, 45, 194–205. [Google Scholar] [CrossRef] [PubMed]
  38. Zhang, P.; Yang, Y.; Wang, J.; Hu, S.; Jiao, M.; Ling, Y. Mechanical Properties and Durability of Polypropylene and Steel Fiber-Reinforced Recycled Aggregates Concrete (FRRAC): A Review. Sustainability 2020, 12, 9509. [Google Scholar] [CrossRef]
  39. Fraj, A.B.; Idir, R. Concrete based on recycled aggregates—Recycling and environmental analysis: A case study of paris’ region. Constr. Build. Mater. 2017, 157, 952–964. [Google Scholar] [CrossRef]
  40. Shan, X.; Zhou, J.; Chang, V.W.C.; Yang, E.-H. Life cycle assessment of adoption of local recycled aggregates and green concrete in Singapore perspective. J. Clean. Prod. 2017, 164, 918–926. [Google Scholar] [CrossRef]
  41. Mah, C.M.; Fujiwara, T.; Ho, C. Life cycle assessment and life cycle costing toward eco-efficiency concrete waste management in Malaysia. J. Clean. Prod. 2018, 172, 3415–3427. [Google Scholar] [CrossRef]
  42. Knoeri, C.; Sanyé-Mengual, E.; Althaus, H.-J. Comparative LCA of recycled and conventional concrete for structural applications. Int. J. Life Cycle Assess. 2013, 18, 909–918. [Google Scholar] [CrossRef] [Green Version]
  43. ISO 14040. Environmental Management—Life Cycle Assessment—Principles and Framework. Available online: https://www.iso.org/standard/37456.html (accessed on 5 January 2021).
  44. Ding, T.; Xiao, J.; Tam, V.W.Y. A closed-loop life cycle assessment of recycled aggregate concrete utilization in China. Waste Manag. 2016, 56, 367–375. [Google Scholar] [CrossRef]
  45. Park, W.-J.; Kim, T.; Roh, S.; Kim, R. Analysis of Life Cycle Environmental Impact of Recycled Aggregate. Appl. Sci. 2019, 9, 1021. [Google Scholar] [CrossRef] [Green Version]
  46. Rosado, L.P.; Vitale, P.; Penteado, C.S.G.; Arena, U. Life cycle assessment of construction and demolition waste management in a large area of São Paulo State, Brazil. Waste Manag. 2019, 85, 477–489. [Google Scholar] [CrossRef] [PubMed]
  47. Visintin, P.; Xie, T.; Bennett, B. A large-scale life-cycle assessment of recycled aggregate concrete: The influence of functional unit, emissions allocation and carbon dioxide uptake. J. Clean. Prod. 2020, 248, 119243. [Google Scholar] [CrossRef]
  48. IPCC. IPCC Guidelines for National Greenhouse Gas Inventories (2006). Available online: https://www.ipcc-nggip.iges.or.jp/public/2006gl/ (accessed on 5 January 2021).
  49. EFCA. Plasticisers and Superplasticisers Environmental Product Declarations (EPD). Available online: http://www.efca.info/download/plasticisers-and-superplasticisers-epd-2015/ (accessed on 5 January 2021).
  50. Greenhouse Gas Protocol. GHG Protocol Emission Factors from Cross-Sector Tools. Available online: https://ghgprotocol.org/calculation-tools#cross_sector_tools_id (accessed on 5 January 2021).
  51. Cembureau. Cembureau Environmental Product Declaration (EPD)—Portland Cement (CEM I). Available online: https://cembureau.eu/ (accessed on 5 January 2021).
  52. Carbon Solutions. Inventory of Carbon & Energy (ICE) Summary. Available online: https://www.carbonsolution.com/ (accessed on 5 January 2021).
  53. Kennedy, S.; Lin, P.-Y.; Khalid, A.; Sgouridis, S. CO2 Allocation for Power and Water Production in Abu Dhabi—Masdar Institute Working Paper; Masdar Institute: Abu Dhabi, United Arab Emirates, 2012. [Google Scholar]
  54. Instytut Techniki Budowlanej. ITB Steel Fibres for Concrete Reinforcement. Available online: https://www.itb.pl/ (accessed on 5 January 2021).
  55. Zhang, Y.; Liu, M.-h.; Xie, H.-B.; Wang, Y. Assessment of CO2 Emissions and Cost in Fly Ash Concrete; Taylor and Francis: London, UK, 2015; pp. 327–331. [Google Scholar]
  56. Irish Green Building Council. MRPI Environmental Product Declaration FOR ECOCEM GGBS CEMENT. Available online: https://www.igbc.ie/ (accessed on 5 January 2021).
  57. Norchem Silica Fume Applications in Sustainability. Available online: https://www.norchem.com/applications-sustainability.html (accessed on 5 January 2021).
  58. Dong, Y.; Ng, S.T.; Kwan, A.; Wu, S.K. Substituting local data for overseas life cycle inventories—A case study of concrete products in Hong Kong. J. Clean. Prod. 2015, 87, 414–422. [Google Scholar] [CrossRef]
  59. Shahabian, A.; Fadai, A.; Peruzzi, T. Future of Life-Cycle Assessment in a Smart and/or Sustainable World; IGI Global: Hershey, PA, USA, 2020; pp. 177–207. [Google Scholar]
  60. Aman, M.M.; Solangi, K.H.; Hossain, M.S.; Badarudin, A.; Jasmon, G.B.; Mokhlis, H.; Bakar, A.H.A.; Kazi, S.N. A review of Safety, Health and Environmental (SHE) issues of solar energy system. Renew. Sustain. Energy Rev. 2015, 41, 1190–1204. [Google Scholar] [CrossRef]
  61. Al Dhafra Recycling Industries. Available online: http://www.aldhafrarecycling.ae/en/ (accessed on 4 December 2019).
  62. El-Hassan, H.; Elkholy, S. Performance Evaluation and Microstructure Characterization of Steel Fiber-Reinforced Alkali-Activated Slag Concrete Incorporating Fly Ash. J. Mater. Civ. Eng. 2019, 31, 04019223. [Google Scholar] [CrossRef]
  63. ASTM C33/C33M-18, Standard Specification for Concrete Aggregates; ASTM International: West Conshohocken, PA, USA, 2018.
  64. Seo, D.S.; Choi, H.B. Effects of the old cement mortar attached to the recycled aggregate surface on the bond characteristics between aggregate and cement mortar. Constr. Build. Mater. 2014, 59, 72–77. [Google Scholar] [CrossRef]
  65. ACI Committee 211.1. Standard Practice for Selecting Proportions for Normal, Heavyweight, and Mass Concrete; American Concrete Institute: Farmington Hills, MI, USA, 2009. [Google Scholar]
  66. El-Hassan, H.; Shehab, E.; Al-Sallamin, A. Effect of Curing Regime on the Performance and Microstructure Characteristics of Alkali-Activated Slag-Fly Ash Blended Concrete. J. Sustain. Cem. Mater. 2021, 10, 289–317. [Google Scholar] [CrossRef]
  67. El-Hassan, H.; Hussein, A.; Medljy, J.; El-Maaddawy, T. Performance of Steel Fiber-Reinforced Alkali-Activated Slag-Fly Ash Blended Concrete Incorporating Recycled Concrete Aggregates and Dune Sand. Buildings 2021, 11, 327. [Google Scholar] [CrossRef]
  68. Mesgari, S.; Akbarnezhad, A.; Xiao, J.Z. Recycled geopolymer aggregates as coarse aggregates for Portland cement concrete and geopolymer concrete: Effects on mechanical properties. Constr. Build. Mater. 2020, 236, 117571. [Google Scholar] [CrossRef]
  69. Wang, J.; Xie, J.; Wang, C.; Zhao, J.; Liu, F.; Fang, C. Study on the optimum initial curing condition for fly ash and GGBS based geopolymer recycled aggregate concrete. Constr. Build. Mater. 2020, 247, 118540. [Google Scholar] [CrossRef]
  70. El-Hassan, H.; Medljy, J.; El-Maaddawy, T. Properties of Steel Fiber-Reinforced Alkali-Activated Slag Concrete Made with Recycled Concrete Aggregates and Dune Sand. Sustainability 2021, 13, 8017. [Google Scholar] [CrossRef]
  71. ASTM C143/C143M-20, Standard Test Method for Slump of Hydraulic-Cement Concrete; ASTM International: West Conshohocken, PA, USA, 2020.
  72. ASTM C78/C78M-21, Standard Test Method for Flexural Strength of Concrete (Using Simple Beam with Third-Point Loading); ASTM International: West Conshohocken, PA, USA, 2021.
  73. ASTM C39/C39M-21, Standard Test Method for Compressive Strength of Cylindrical Concrete Specimens; ASTM International: West Conshohocken, PA, USA, 2021.
  74. ASTM C642-13, Standard Test Method for Density, Absorption, and Voids in Hardened Concrete; ASTM International: West Conshohocken, PA, USA, 2013.
  75. Shahidan, S.; Azmi, M.A.M.; Kupusamy, K.; Zuki, S.S.M.; Ali, N. Utilizing Construction and Demolition (C&D) Waste as Recycled Aggregates (RA) in Concrete. Procedia Eng. 2017, 174, 1028–1035. [Google Scholar] [CrossRef]
  76. Wagih, A.M.; El-Karmoty, H.Z.; Ebid, M.; Okba, S.H. Recycled construction and demolition concrete waste as aggregate for structural concrete. HBRC J. 2013, 9, 193–200. [Google Scholar] [CrossRef] [Green Version]
  77. Suda, V.B.R.; Rao, P. Experimental investigation on optimum usage of Micro silica and GGBS for the strength characteristics of concrete. Mater. Today Proc. 2020, 27, 805–811. [Google Scholar] [CrossRef]
  78. Chrest, A.P. Guide to Using Silica Fume in Precast/Prestressed Concrete Products—PCI Committee on Durability; Precast/Prestressed Concrete Institute: Chicago, IL, USA, 1994; p. 10. [Google Scholar]
  79. Silva, S.; Evangelista, L.; de Brito, J. Durability and shrinkage performance of concrete made with coarse multi-recycled concrete aggregates. Constr. Build. Mater. 2021, 272, 121645. [Google Scholar] [CrossRef]
  80. Hassan, R.Y.; Faroun, G.A.; Mohammed, S.K. Mechanical properties of concrete made with coarse and fine recycled aggregates. Mater. Today Proc. 2021. [Google Scholar] [CrossRef]
  81. Medljy, J.; El-Hassan, H.; El-Maaddawy, T. Effect of Recycled Aggregate and Steel Fibers on the Mechanical Properties of Alkali-Activated Slag/Fly Ash Blended Concrete. ACI Spec. Publ. 2021, 349, 210–223. [Google Scholar]
  82. Gao, D.; Wang, F. Effects of recycled fine aggregate and steel fiber on compressive and splitting tensile properties of concrete. J. Build. Eng. 2021, 44, 102631. [Google Scholar] [CrossRef]
  83. Zong, S.; Liu, Z.; Li, S.; Lu, Y.; Zheng, A. Stress-strain behaviour of steel-fibre-reinforced recycled aggregate concrete under axial tension. J. Clean. Prod. 2021, 278, 123248. [Google Scholar] [CrossRef]
  84. Vaverková, M.D. Landfill Impacts on the Environment—Review. Geosciences 2019, 9, 431. [Google Scholar] [CrossRef] [Green Version]
  85. MOCCAE News|Media Center|UAE Ministry of Climate Change and Environment Ministry of Climate Change and Environment Issues Resolution on Recycled Aggregates from Construction, Demolition Waste. Available online: https://www.moccae.gov.ae/en/media-center/news/6/2/2019/ministry-of-climate-change-and-environment-issues-resolution-on-recycled-aggregates-from-construction-demolition-waste.aspx?DisableResponsive=1#page=1 (accessed on 5 January 2021).
  86. Wijayasundara, M.; Mendis, P.; Crawford, R.H. Integrated assessment of the use of recycled concrete aggregate replacing natural aggregate in structural concrete. J. Clean. Prod. 2018, 174, 591–604. [Google Scholar] [CrossRef]
  87. Jordan, G.; Prevette, S.; Woodward, S. The Performance-Based Management Handbook. Analyzing, Reviewing, and Reporting Performance Data; Oak Ridge Institute for Science and Education: Oak Ridge, TN, USA, 2001; Volume 5. [Google Scholar]
Figure 1. The main stations of Al Dhafra Recycling plant [61].
Sustainability 13 10348 g001
Figure 2. Different processes involved in the recycled aggregates production line at the Al Dhafra recycling plant.
Sustainability 13 10348 g002
Figure 3. Zoning for the environmental impact of material transportation within the UAE.
Sustainability 13 10348 g003
Figure 4. Particle size distribution of different mixes of NA and RA; adapted from [34].
Sustainability 13 10348 g004
Figure 5. Development of concrete compressive and flexural strength over time.
Sustainability 13 10348 g005
Figure 6. Relationship between aggregate transport distance and (a) GWP and (b) cost.
Sustainability 13 10348 g006
Figure 7. Contribution of mixture components and transportation to the environmental impact. (a) Zone 1, (b) Zone 2, (c) Zone 3, (d) Zone 4, (e) legend.
Sustainability 13 10348 g007
Figure 8. Contribution of mixture components and transportation to the economic impact. (a) Zone 1, (b) Zone 2, (c) Zone 3, (d) Zone 4, (e) legend.
Sustainability 13 10348 g008
Table 1. Roundtrip distances (km) considered for each scenario.
Scenario S1S2S3S4
Transported to Zone 1Zone 2Zone 3Zone 4
MaterialRA368555583632
NA7232751931232
Additives424220304822
Table 2. LCI values of the raw materials used.
MaterialCost * in
USD/kg
Environmental Impact Category per kg of Material
GWPODPAPEPPOCPADP
kg
CO2eq
kg
CFC−11eq
kg
SO2eq
kg
PO4−3
kg
C2H4eq
kg
sbeq
Cement0.07560.8981.21 × 10−101.48 × 10−32.211 × 10−41.42 × 10−41.1 × 10−6
Dune sand0.0052------
Natural aggregate0.006750.0052-----
Recycled aggregate0.0054–0.00816.67 × 10−4-----
Water (per L)0.002120.01258-----
Superplasticizer1.92781.882.30 × 10−102.92 × 10−31.03 × 10−33.12 × 10−41.1 × 10−6
Steel fibers1.620.7711 × 10−41.05 × 10−63.35 × 10−43.24 × 10−41.11 × 10−4
Fly ash0.08910.027-----
Slag0.07560.04165.08 × 10−94.6 × 10−44.4 × 10−52.89 × 10−53.1 × 10−4
Microsilica0.33750.014-----
* These are the costs of the materials at the time this study was conducted. These values may differ. These values were converted from AED (local currency) to USD by multiplying them with a conversion factor of 0.27 USD/AED.
Table 3. Chemical composition of as-received materials.
Oxide CompoundFly Ash (%)Slag (%)Microsilica (%)
CaO3.342.00.2
SiO248.034.797.8
Al2O323.114.40.2
MgO1.56.90.5
Fe2O312.50.80.5
Na2O0.00.00.2
K2O0.00.00.2
Loss on ignition1.11.10.0
Others10.50.20.4
Table 4. The physical properties of natural and recycled aggregates and dune sand.
MaterialProperty
Dry-Rodded
Density (kg/m3)
Absorption
(%)
Los Angeles
Abrasion (%)
Surface Area
(cm2/g)
Soundness
(MgSO4) (%)
Specific
Gravity
Fineness
Modulus
ASTM StandardC29C127C131C136C88C127C136
NA16350.6216.02.491.202.826.82
RA15636.6332.62.502.782.637.44
Dune Sand1663--116.8-2.771.45
Table 5. Mixture proportions of concrete mixes.
Mix
Designation
Weight (kg/m3)Volume (m3)
BinderAggregatesWaterSPSteel Fibers
CementAdditive *Dune SandNARA
Control470060011500230001.01
30RA-0SF **4700545791339230001.01
70RA-1SF **47005753397312300781.01
100RA-3SF4700570011302309.62341.05
100RA-1SF4800650010901804.8781.02
100RA-Cem5600525011801705.601.01
100RA-MS32526800010601803.501.01
100RA-FA4008055001130200001.01
100RA-Slag42512555001030210001.00
* Mineral additive, as microsilica, fly ash, and slag. ** Mixes were adopted from [27].
Table 6. Slump and density values for NA- and RA-based concrete mixes.
Mix
Designation
Slump
(mm)
% ChangeDensity
(kg/m3)
% Change
Control150-2617-
30RA-0SF *135−10.02560−2.2
70RA-1SF *100−33.32527−3.4
100RA-3SF100−33.32600−0.6
100RA-1SF120−20.02450−6.4
100RA-Cem136−9.32378−9.1
100RA-MS100−33.32390−8.7
100RA-FA125−16.72375−9.2
100RA-Slag128−14.72395−8.5
* Results of these mixes were adopted from [27].
Table 7. Environmental impact assessment of different concrete mixes.
Mix
Designation
Environmental Category
GWP
(kg CO2eq)
ODP
(kg CFC−11eq)
AP
(kg SO2eq)
EP
(kg PO4−3)
POCP
(kg C2H4eq)
ADP
(kg sbeq)
Control430.85.7 × 10−80.70.100.070.00
30RA-0SF429.35.7 × 10−80.70.100.070.00
70RA-1SF487.37.8 × 10−30.70.130.090.01
100RA-3SF624.22.3 × 10−20.70.190.150.03
100RA-1SF503.27.8 × 10−30.70.140.090.01
100RA-Cem516.36.9 × 10−80.80.130.080.00
100RA-MS301.84.0 × 10−80.50.080.050.00
100RA-FA364.64.8 × 10−80.60.090.060.00
100RA-Slag390.26.9 × 10−70.70.100.060.04
Table 8. Contribution of the mixture component to GWP (%).
Mix DesignationComponent
CementAdditive *Dune SandNARAWaterSPSteel Fibers
Control97.960.000.001.360.000.670.000.00
30RA-0SF98.320.000.000.960.050.670.000.00
70RA-1SF86.600.000.000.360.100.590.0012.34
100RA-3SF67.620.000.000.000.120.462.8928.90
100RA-1SF85.660.000.000.000.140.451.7911.95
100RA-Cem97.390.000.000.000.150.412.040.00
100RA-MS98.870.120.000.000.240.770.000.00
100RA-FA98.510.590.000.000.210.690.000.00
100RA-Slag97.811.330.000.000.180.680.000.00
* Mineral additive, as microsilica, fly ash, and slag.
Table 9. Economic impact assessment of concrete mixes.
Mix
Designation
BinderAggregateWaterSPSFTotal Cost (USD/m3)
CementAdditive *Dune SandNARA (Lower)RA (Upper)LowerUpper
Control35.50.03.07.60.00.00.50.00.046.646.6
30RA-0SF35.50.02.85.31.82.80.50.00.046.046.9
70RA-1SF35.50.03.02.34.05.90.50.0126.4171.6173.6
100RA-3SF35.50.02.60.06.19.20.518.5379.1442.2445.3
100RA-1SF36.30.03.40.05.98.80.49.3126.4181.6184.5
100RA-Cem42.30.02.70.06.49.60.410.80.062.665.8
100RA-MS24.68.84.20.05.78.60.40.00.043.646.5
100RA-FA30.27.12.90.06.19.20.40.00.046.749.8
100RA-Slag32.19.52.90.05.68.30.40.00.050.453.2
* Mineral additive, as microsilica, fly ash, and slag.
Table 10. Environmental impact (in kg CO2eq) and cost (in USD) of transporting RA, NA, SF, and mineral additives (MS, FA, and slag).
Environmental Impact of TransportationCost of Transportation
MixRANASFAdditives *Trans. GWPTotal **RANASFAdditives * Trans. CostTotal ***
Zone 1
Control0.0163.60.00.0163.6594.40.044.10.00.044.190.7
30RA-0SF25.0114.50.00.0139.5568.86.730.90.00.037.683.6
70RA-1SF53.949.15.80.0108.8596.114.513.21.60.029.3200.9
100RA-3SF83.30.017.30.0100.6724.822.50.04.70.027.2469.5
100RA-1SF80.30.05.80.086.1589.321.70.01.60.023.3204.8
100RA-Cem87.00.00.00.093.6603.323.50.00.00.025.386.1
100RA-MS78.10.00.01.980.0381.821.10.00.00.521.665.2
100RA-FA83.30.00.05.989.2453.822.50.00.01.624.170.8
100RA-Slag75.90.00.09.285.1475.320.50.00.02.523.073.4
Zone 2
Control0.062.20.00.062.2493.00.016.80.00.016.863.4
30RA-0SF37.743.60.00.081.3510.610.211.80.00.022.068.0
70RA-1SF81.318.71.70.0101.7589.021.95.00.50.027.4199.0
100RA-3SF125.60.05.20.0130.8755.033.90.01.40.035.3477.6
100RA-1SF121.20.01.70.0122.9626.132.70.00.50.033.2214.7
100RA-Cem131.20.00.00.0133.2647.535.40.00.00.035.998.0
100RA-MS117.80.00.00.6118.4420.131.80.00.00.232.075.6
100RA-FA125.60.00.01.8127.4492.033.90.00.00.534.481.1
100RA-Slag114.50.00.02.8117.3507.530.90.00.00.831.782.1
Zone 3
Control0.043.60.00.043.6474.40.011.80.00.011.858.4
30RA-0SF39.630.50.00.070.1499.410.78.20.00.018.964.9
70RA-1SF85.313.12.20.0100.6587.923.03.50.60.027.1198.7
100RA-3SF131.80.06.70.0138.5762.735.60.01.80.037.4479.7
100RA-1SF127.20.02.20.0129.4632.634.30.00.60.034.9216.4
100RA-Cem137.70.00.00.0140.3654.037.20.00.00.037.999.8
100RA-MS123.70.00.00.74124.4426.233.40.00.00.233.677.2
100RA-FA131.80.00.02.28134.1498.735.60.00.00.636.283.0
100RA-Slag120.20.00.03.55123.8513.932.40.00.01.033.483.8
Zone 4
Control0.0278.80.00.0278.8709.60.075.30.00.075.3121.9
30RA-0SF42.9195.20.00.0238.1667.411.652.70.00.064.3110.3
70RA-1SF92.583.69.90.0186.0673.325.022.62.70.050.3221.9
100RA-3SF143.00.029.60.0172.6796.838.60.08.00.046.6488.9
100RA-1SF138.00.09.90.0147.9651.137.30.02.70.040.0221.5
100RA-Cem149.40.00.00.0160.8665.740.30.00.00.043.4102.9
100RA-MS134.20.00.03.3137.5439.336.20.00.00.937.180.7
100RA-FA143.00.00.010.1153.1517.838.60.00.02.741.388.1
100RA-Slag130.40.00.015.8146.2536.435.20.00.04.339.589.9
* Mineral additive, as microsilica, fly ash, and slag. ** Total = GWP of mix production (Table 7) + GWP of component transportation (column 6). *** Total = cost of mix production (Table 9) + cost of component transportation (column 12).
Table 11. Individual performance indices for concrete mixes.
ZoneMixIndividual Performance Criterion (Wi)
Environ.CostWasteSlumpf’cfr
Zone 1Control0.630.710.101.000.960.63
30RA-0SF0.660.770.140.901.000.53
70RA-1SF0.630.320.330.670.940.63
100RA-3SF0.520.141.000.670.931.00
100RA-1SF0.630.321.000.800.960.63
100RA-Cem0.620.751.000.910.940.60
100RA-MS1.001.001.000.670.970.61
100RA-FA0.830.931.000.830.970.64
100RA-Slag0.800.911.000.850.900.64
Zone 2Control0.841.000.101.000.960.63
30RA-0SF0.810.920.140.901.000.53
70RA-1SF0.700.320.330.670.940.63
100RA-3SF0.550.131.000.670.931.00
100RA-1SF0.660.291.000.800.960.63
100RA-Cem0.640.631.000.910.940.60
100RA-MS1.000.811.000.670.970.61
100RA-FA0.840.761.000.830.970.64
100RA-Slag0.820.751.000.850.900.64
Zone 3Control0.881.000.101.000.960.63
30RA-0SF0.840.890.140.901.000.53
70RA-1SF0.710.290.330.670.940.63
100RA-3SF0.550.121.000.670.931.00
100RA-1SF0.660.271.000.800.960.63
100RA-Cem0.640.571.000.910.940.60
100RA-MS1.000.731.000.670.970.61
100RA-FA0.840.681.000.830.970.64
100RA-Slag0.820.681.000.850.900.64
Zone 4Control0.610.680.101.000.960.63
30RA-0SF0.640.740.140.901.000.53
70RA-1SF0.640.370.330.670.940.63
100RA-3SF0.540.171.000.670.931.00
100RA-1SF0.660.371.000.800.960.63
100RA-Cem0.640.781.000.910.940.60
100RA-MS1.001.001.000.670.970.61
100RA-FA0.850.941.000.830.970.64
100RA-Slag0.820.931.000.850.900.64
A value of 1.00 is in bold to highlight the mix with the optimum individual performance.
Table 12. Multifunctional performance indices for concrete mixes.
ZoneMixMultifunctional Performance Indices
PI-1PI-2PI-3PI-4PI-5PI-6
Zone 1Control4.56.76.696.064.06.6
30RA-0SF7.29.810.175.956.28.5
70RA-1SF6.76.76.562.962.96.5
100RA-3SF7.17.16.8100.0100.011.0
100RA-1SF20.024.023.676.864.023.7
100RA-Cem46.563.261.081.960.258.8
100RA-MS100.0100.0100.063.763.798.4
100RA-FA77.997.397.683.266.5100.0
100RA-Slag73.093.586.878.961.688.9
Zone 2Control10.315.515.396.064.015.1
30RA-0SF13.117.718.275.956.215.2
70RA-1SF9.19.18.862.962.98.7
100RA-3SF8.98.98.6100.0100.013.6
100RA-1SF23.728.528.076.864.027.8
100RA-Cem49.367.164.781.960.261.7
100RA-MS100.0100.0100.063.763.797.3
100RA-FA78.898.498.883.266.5100.0
100RA-Slag76.197.490.578.961.691.6
Zone 3Control12.118.117.896.064.017.7
30RA-0SF14.519.620.275.956.216.8
70RA-1SF9.49.49.162.962.99.1
100RA-3SF9.19.18.7100.0100.013.8
100RA-1SF24.128.928.476.864.028.2
100RA-Cem49.767.565.181.960.262.0
100RA-MS100.0100.0100.063.763.797.1
100RA-FA78.998.698.983.266.5100.0
100RA-Slag76.597.990.978.961.691.9
Zone 4Control4.16.26.196.064.06.0
30RA-0SF6.89.29.575.956.27.9
70RA-1SF7.87.87.662.962.97.5
100RA-3SF9.19.18.7100.0100.013.8
100RA-1SF24.329.128.776.864.028.4
100RA-Cem50.368.365.981.960.262.5
100RA-MS100.0100.0100.063.763.796.9
100RA-FA79.198.999.283.266.5100.0
100RA-Slag77.198.791.778.961.692.4
PI-1 = environment + cost + waste; PI-2 = environment + cost + waste + slump; PI-3 = environment + cost + waste + compression; PI-4 = slump + compression + flexure; PI-5 = compression + flexure; PI-6 = environment + cost + waste + slump + compression + flexure; a value of 1.00 is in bold to highlight the mix with the optimum individual performance.
Publisher’s Note: MDPI stays neutral with regard to jurisdictional claims in published maps and institutional affiliations.

