Abstract
Gamification in healthcare has shown to increase user motivation and treatment adherence. Personalisation strategies have the potential to create sustainable health change and user motivation. In striving for personalisation, surveys are often used as an easy tool to collect information about the user. But lengthy surveys are often tedious and demotivating, provoking bad respondent behaviour which results in a loss of data quality. Gamified surveys can enhance respondent behaviour but are labour-intensive to develop. This study explores the effect of a re-usable mobile survey application, using personalised gamification, on user experience. In an A/B study setting with 28 participants, The Hexad Player Type Framework is used to determine the player type of the user and personalise the survey accordingly. Results have shown that the overall user experience of the gamified application is higher than the traditional survey and 37.5% of gamified users perceived the duration of the survey as shorter than the actual time, compared to 20% of the respondents of the traditional survey. No significant difference in data quality has been detected, as loss in data quality remained limited in both versions. Future work should explore the influence of more elaborate game elements in a larger population.
1. Introduction
For a while now, the need for more personalised intervention in e-Health, such as mobile health behaviour change systems to create sustainable behaviour change, has become larger, paving the way for more research on different personalisation strategies and methods [1]. But before implementing any form of personalisation, you need to get to know your user. Often, this requires the user to fill in one or more surveys.
Standard surveys have enormous advantages as they are easy to deploy and analyse and capable of collecting data from a large pool of people [2]. But more often than not, lengthy surveys are considered tedious and seen as a waste of time. This increases the chances of people not completing a survey, speeding, random responding or not giving it their full attention, which results in a loss of quality [3,4,5]. According to the satisficing theory, respondents, who are less motivated to participate in the survey, will adopt a sub-optimal response strategy, leading to a decrease in data quality [6]. To increase the response rate of surveys, several strategies have already been used: more information on the survey and its purpose can be directly send to possible respondents prior to the survey, rewards can be given for completing the survey or surveys can be tailored to the respondents [5,6]. To improve the design of surveys, visual elements or game-elements can be incorporated into the design of the survey to increase the motivation of respondents. Such game-elements have shown promise to increase the participation rate and the data quality of surveys [2].
The objective of this study is to explore the effect of personalised gamification in surveys on the user experience, engagement and quality of the data. To achieve this, a mobile Android survey application is designed that offers personalised gamification according to the player types of the Hexad Player Types Framework, e.g., the achiever type can collect badges by completing the survey [7]. To evaluate this, a pilot study has been conducted with 28 participants comparing a survey using personalised gamification with a traditional survey.
The remainder of this paper is structured as follows: First, in Section 2, some background information is given on gamification and personalisation strategies using player types. Next, Section 3 discusses the design of the application and the use of game elements. Section 4 explains the evaluation set-up of the pilot study and the system tests, followed by their respective results in Section 5. Finally, these results and their implications are discussed in Section 6.
2. Related Work
The following paragraphs elaborate on the current problems with gamification and how personalisation can be applied as a possible solution. Different player type models for personalisation are evaluated and, finally, the chosen Hexad Player Type Framework is highlighted in more detail.
2.1. Gamification
Gamification is the use of game elements, such as badges or leader boards in a non-gaming context [8]. This addition of game elements can range from only a few elements to a more game-like experience. Well-known examples of applications that use gamification are Duolingo [9] and Strava [10]. Gamification is more and more used in domains such as healthcare, mostly motivated by lack of treatment adherence and treatment costs, and education, to keep students motivated to learn, and it has shown to have positive effects [11,12].
In education, gamification is used to motivate students and increase the learning outcome [13,14]. Gamification in education can be applied to progress from the traditional classroom setting towards a more engaging environment for students to learn in [15]. Examples are the application of gamification in a virtual lab setting, adaptive learning or flipped classroom settings [15,16,17]. Gamification in education has shown to have positive results, however, incorporating game-elements in varying educational contexts remains a labour-intensive and challenging process and long-term effectiveness remains unknown [13,14,15]. In order to successfully motivate students during a learning activity, an understanding of the target population and their needs is necessary to offer game elements tailored to the learning context [14].
In healthcare, gamification has been used to motivate patients to increase treatment adherence by creating a therapeutic or enjoyable environment that eases the burden of illness, physical or cognitive training or to motivate health behaviour change for all ages [18,19,20,21,22]. Moreover, these gamified applications can also be used to raise awareness on health conditions or explain treatment procedures to patients [18]. For mental health disorders, gamified application can be used as a tool to battle anxiety disorders or reduce stress, often with the objective to increase the engagement with the intervention and enhance the effects of the intervention [19]. Results have shown that gamification shows promise to reduce issues with treatment adherence in healthcare, however current research fails to indicate the long-term effect of gamification [18]. Cheng et al. [19] suggest that in the mental health domain, other game elements are applied, compared to the domain of physical activity or chronic illness. This indicates the need to take into account the health purposes and changes of the target group [18]. However, researchers argue the effects of gamification might not be sustainable as users lose interest in the game-elements as time passes [18]. Moreover, gamification is still treated as a “one-size-fits-all” approach, unable to re-engage users when motivation drops or consider the user’s characteristics, which significantly influence their attitude towards gamification, interfering with the positive effect in certain contexts or for certain people [8,20,21,23]. People are unique and contexts change. Some might perceive certain gamified elements as intrusive or redundant, whereas others might find them entertaining and motivating [11,20].
The use of gamification in the context of surveys can have positive effects as it can increase the involvement of participants, which can lead to improved data quality [2,24]. Nevertheless, the use of gamification in a survey remains rare and requires the necessary time and expertise [25]. Some concern exists on the influence of gamification on the validity of answers and the possibility to repel users [2,4].
Gamification with a user-centred, adaptive and personalised approach shows promise to increase treatment adherence and boost engagement with interventions [11]. However, limited research exists on how gamification can be personalised and what factors influence these decisions [21,26]. Most often, the player type of the user is used as a starting point for personalisation, however, these studies are often not empirically validated as they use small sample sizes [26].
2.2. Player Type Models
Several models exist to define different types of players, of which some use the different playing styles of users to model the user behaviour as to design more effective gamified systems [8]. Some of these different player type models will be discussed below.
Bartle’s Model for the game Multi-User Dungeons defines four player types: the achiever, the explorer, the socializer and the killer. However, as it was specifically designed for a game, it should not be generalised to other game genres or gamified systems [27].
The BrainHex Model is developed based on player characteristics and neurobiological research. It introduces seven player types and has shown to be a promising player model that complements existing research with a more diverse set of players [27]. The player types of this model are the achiever, conqueror, daredevil, mastermind, seeker, socialiser and survivor.
Barata’s Model has been established by studying data of the performance of students and their gaming preferences. The model assumes four types of students: achievers, regular students, half-hearted students and underachievers. This model focuses solely on the domain of gamified learning. Additionally, specific game elements, such as badges or points, that are often found in gameful systems, were not studied [6,8].
Finally, the Hexad Framework [27] has been developed specifically for the design of gameful systems tailored to their users. It defines six player types, namely, the achiever, free spirit, philanthropist, disruptor, player and socializer. Research indicates that the Hexad Model outperforms the BrainHex model in detecting user preferences towards game elements [7]. Although the BrainHex model is often used for personalised gamified systems, it was specifically designed for game design, limiting its usefulness for gameful design. In game design, the main objective is to entertain users, whereas in gameful design, the goal is to motivate users [26]. Next, where the Barata Model is lacking as it is designed for education and fails to research specific game elements, the Hexad Framework solves this absence by validating specific game elements per player type. Therefore, the Hexad Framework will be used as the starting point for offering personalised gamification in a survey context.
2.3. Hexad Player Type Framework
The Hexad Framework originates from research on human motivation, player types and practical design experience and allows to personalise gamification based on the preferences of the user [6,7]. The Hexad Framework proposes several empirically validated game design elements to support different user types [6,28]. These six user types are determined by the intrinsic, coming from within a person, and extrinsic, coming from external factors, motivation of the users, incorporating previous research on Self Determination Theory [6].
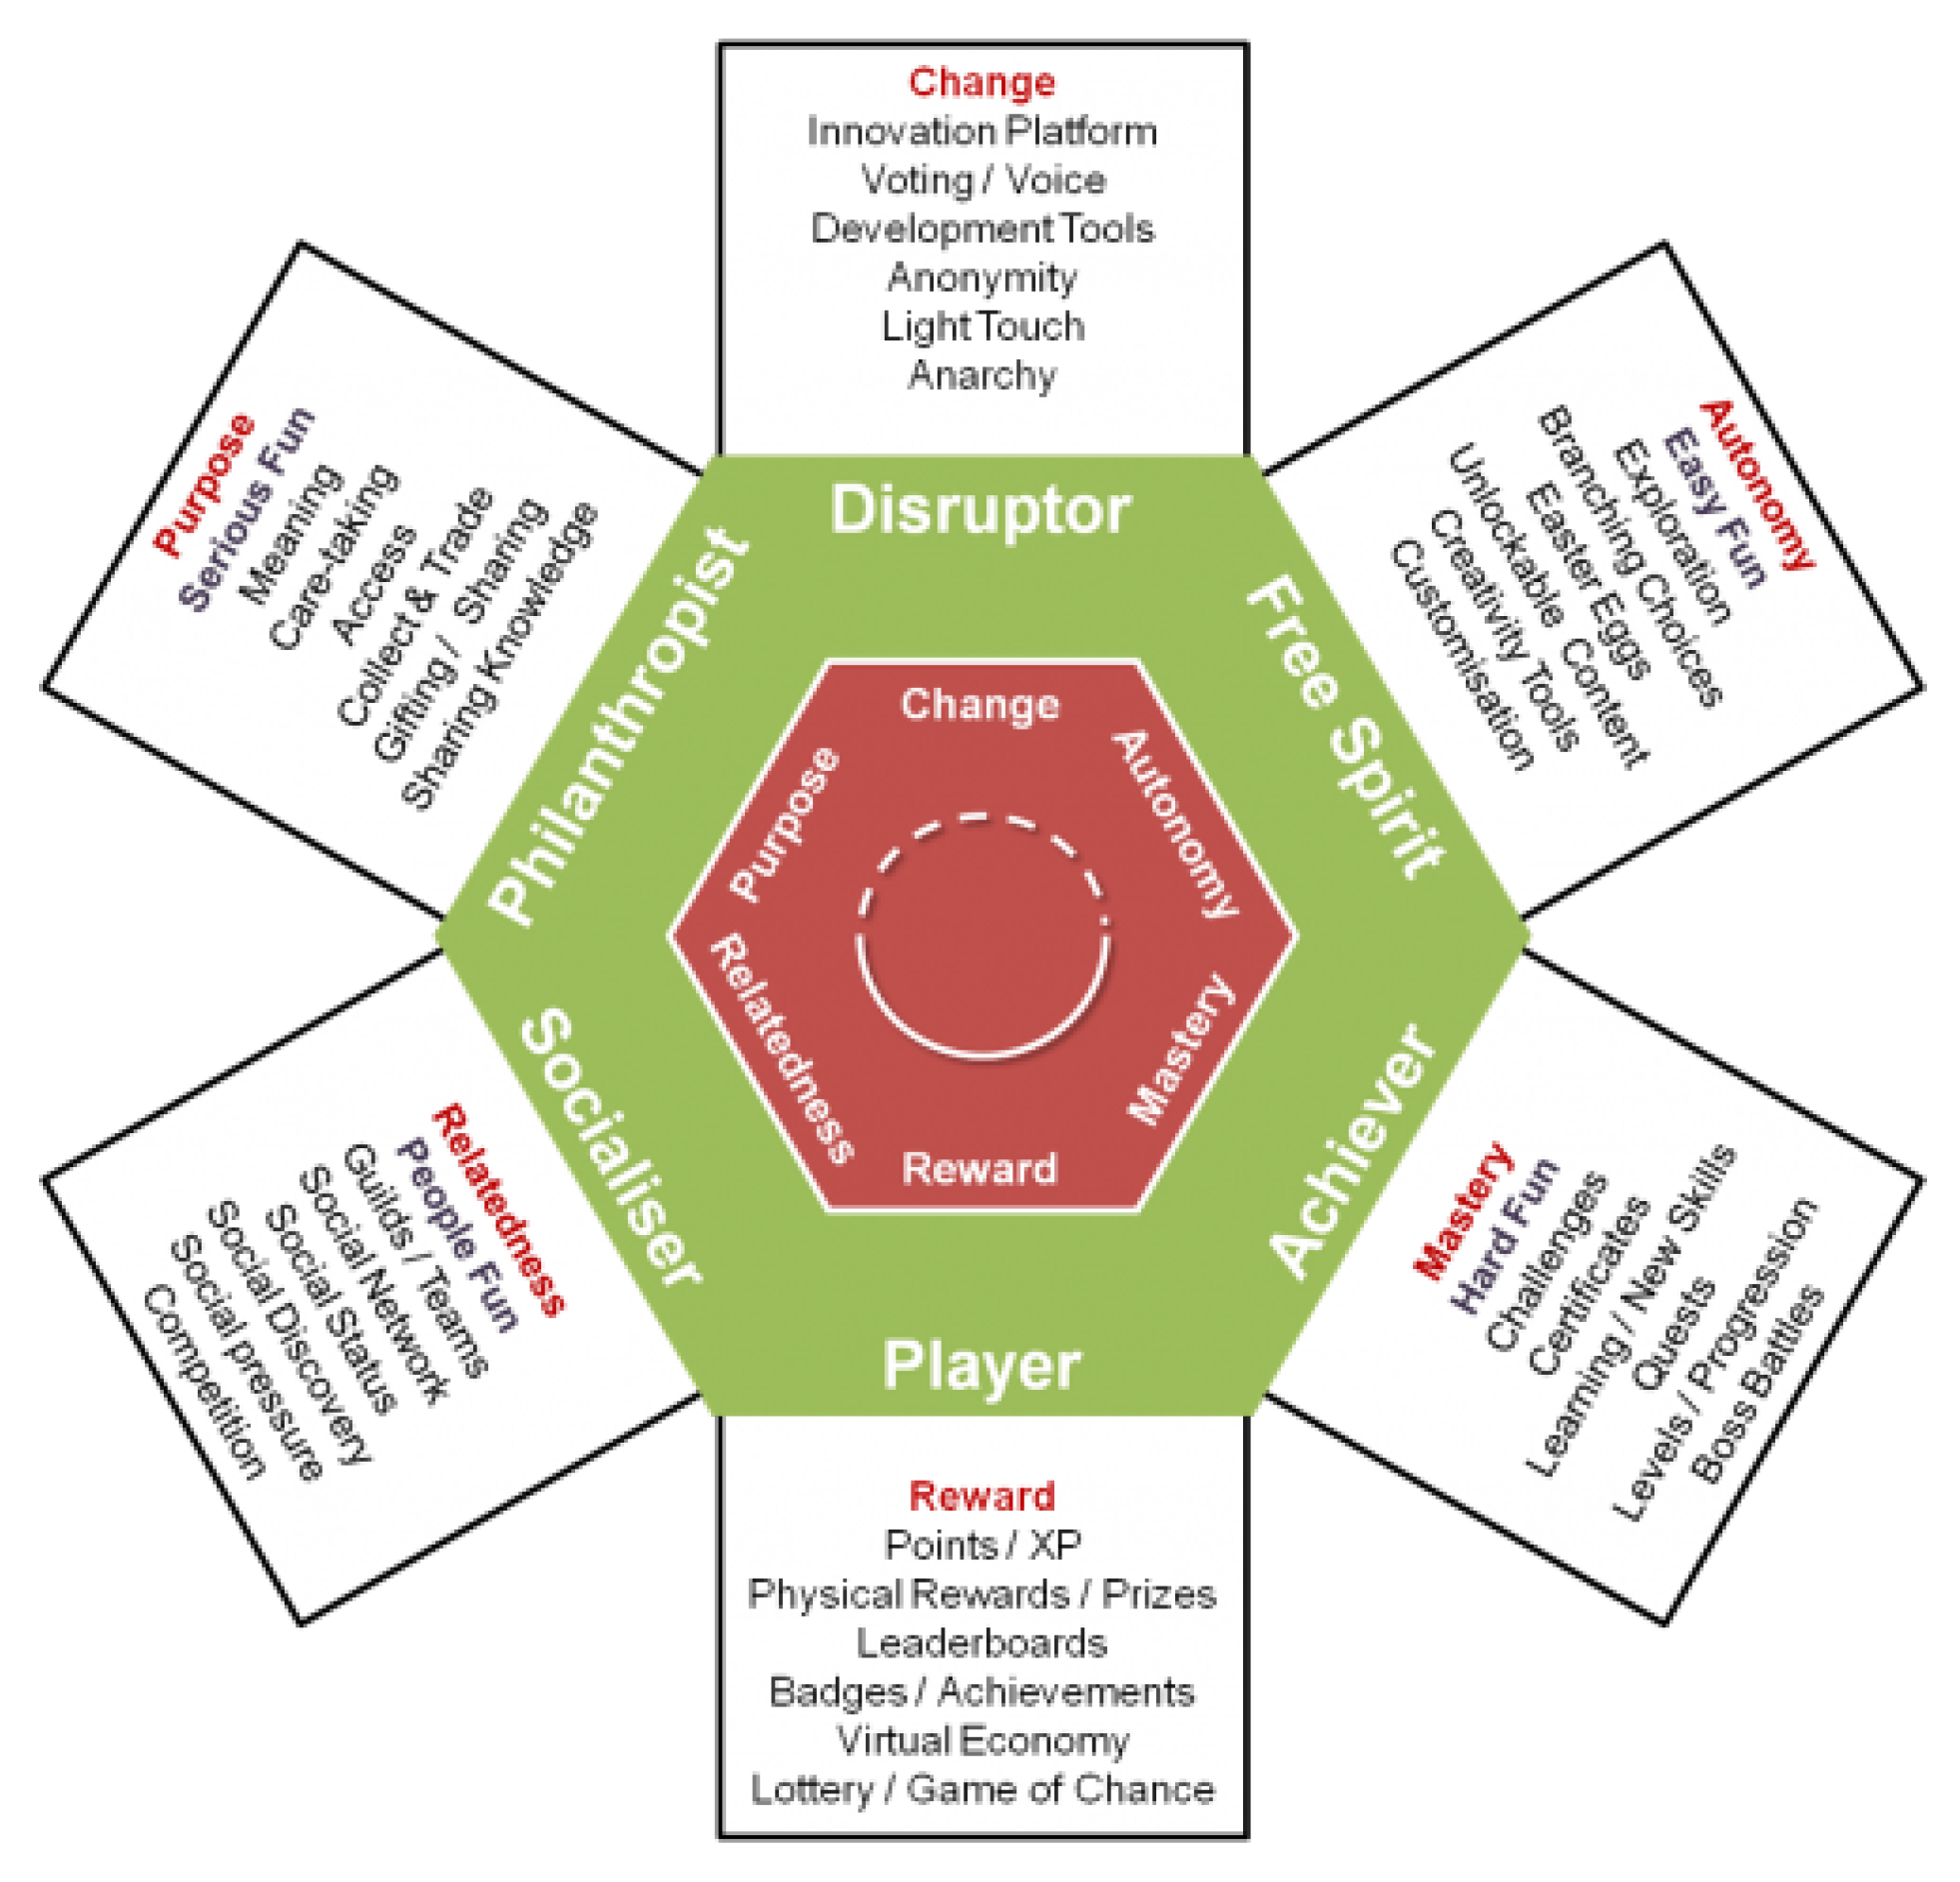
Figure 1 shows the 6 player types of the Hexad Framework and their respective game elements. First, the socializers, which are motivated by relatedness and wish to interact with others to create social connections. Free Spirits are intrinsically motivated by autonomy and self-expression to explore and to create. Philanthropists are intrinsically motivated by purpose and meaning and are considered altruistic. They prefer to give to others and enrich the life of others, without expecting any reward. Next, achievers are intrinsically motivated by mastery to gain knowledge, learn new skills and improve themselves is what they desire. Additionally, they like a good challenge to overcome. The players are extrinsically motivated by rewards and will do only what is necessary to collect rewards. Finally, the disruptors are motivated by change and want to disrupt the system, directly or though others, to enforce positive or negative changes [28].
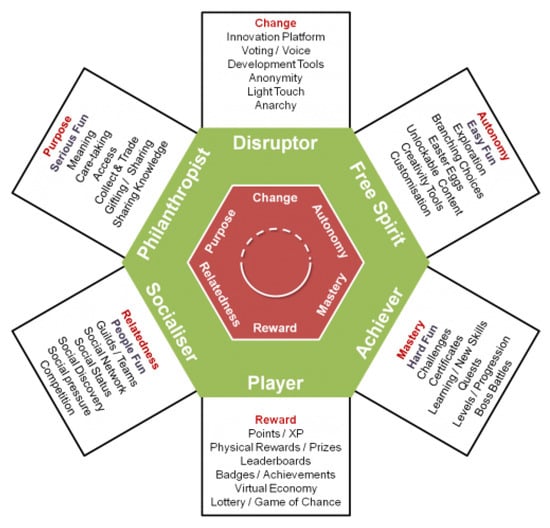
Figure 1.
The Hexad Player Type Framework discerns 6 player types based the results of 24 questions that gauge the intrinsic or extrinsic motivation of people. Each player type is linked with a set of game elements that match the profile of the player type [28].
2.4. Gamification in Surveys
Existing research defines two categories of gamification used in surveys: soft gamification, i.e., the addition of some game elements to a traditional survey, and hard gamification, which requires a complete redesign of the survey into a fully-fledged game [29]. This final category can even be labelled as a serious game. A serious game has a purpose other than pure entertainment, in this case completing a survey.
Research on gamified surveys is limited and early examples exist that underline the issue of the trade-off between user experience and usability of a gamified application that has to be made [25]. Designing a gamified survey requires significant time and resources, extensive knowledge on survey design and creativity to create a gameful experience, which counteracts the advantages of surveys of being easy to develop and analyse [2]. Next, some existing examples of gamified surveys are discussed.
Harteveld et al. [2] discusses a methodology to gamify surveys using hard gamification and the StudyCrafter [30] platform. StudyCrafter is a platform that allows to gamify surveys by manually creating scenarios with characters that users can interact with by replying questions. Harteveld identifies the measured concepts in specific surveys and translates them to the StudyCrafter platform. This approach is a labour-intensive process as it requires the manual identification and translation of the measured concepts of a survey to that platform. Moreover, as these measured concepts differ for each survey, this process has to be applied from start to finish for each new survey. Furthermore, the gamified surveys have not been validated as they have yet to be implemented and tested compared to traditional surveys.
Triantoro et al. [31] investigates the relationship between personality traits and the enjoyment and attention to gamified surveys. Using a recruitment and team-working scenario, where the player takes on the role of a new hire that has to complete several steps to contribute to the team. The objective of the game is to measure personality traits, such as agreeableness, openness, extraversion, conscientiousness and neuroticism. The questions in the gamified survey to test these constructs are based on the Big Five Survey [32]. Results show that all personalities enjoy the gamified surveys more compared to a traditional survey, however, players with certain personality traits seem to exhibit more enjoyment than others.
3. Mobile Survey Application
Existing limited research indicates that gamification can increase user satisfaction and data quality of surveys. However, the design of a gamified survey is often a labour-intensive process as it is tailored to specific surveys. Moreover, the enjoyment of game elements in surveys can differ based on the personality of the user. To address these needs, a mobile survey application is created that offers personalised gamification according to the player types of the Hexad Framework.
First, an overview of the objectives and structure of the application is given, followed by a discussion of the different incorporated game elements. Finally, the design and implementation of the application is presented.
3.1. Overview
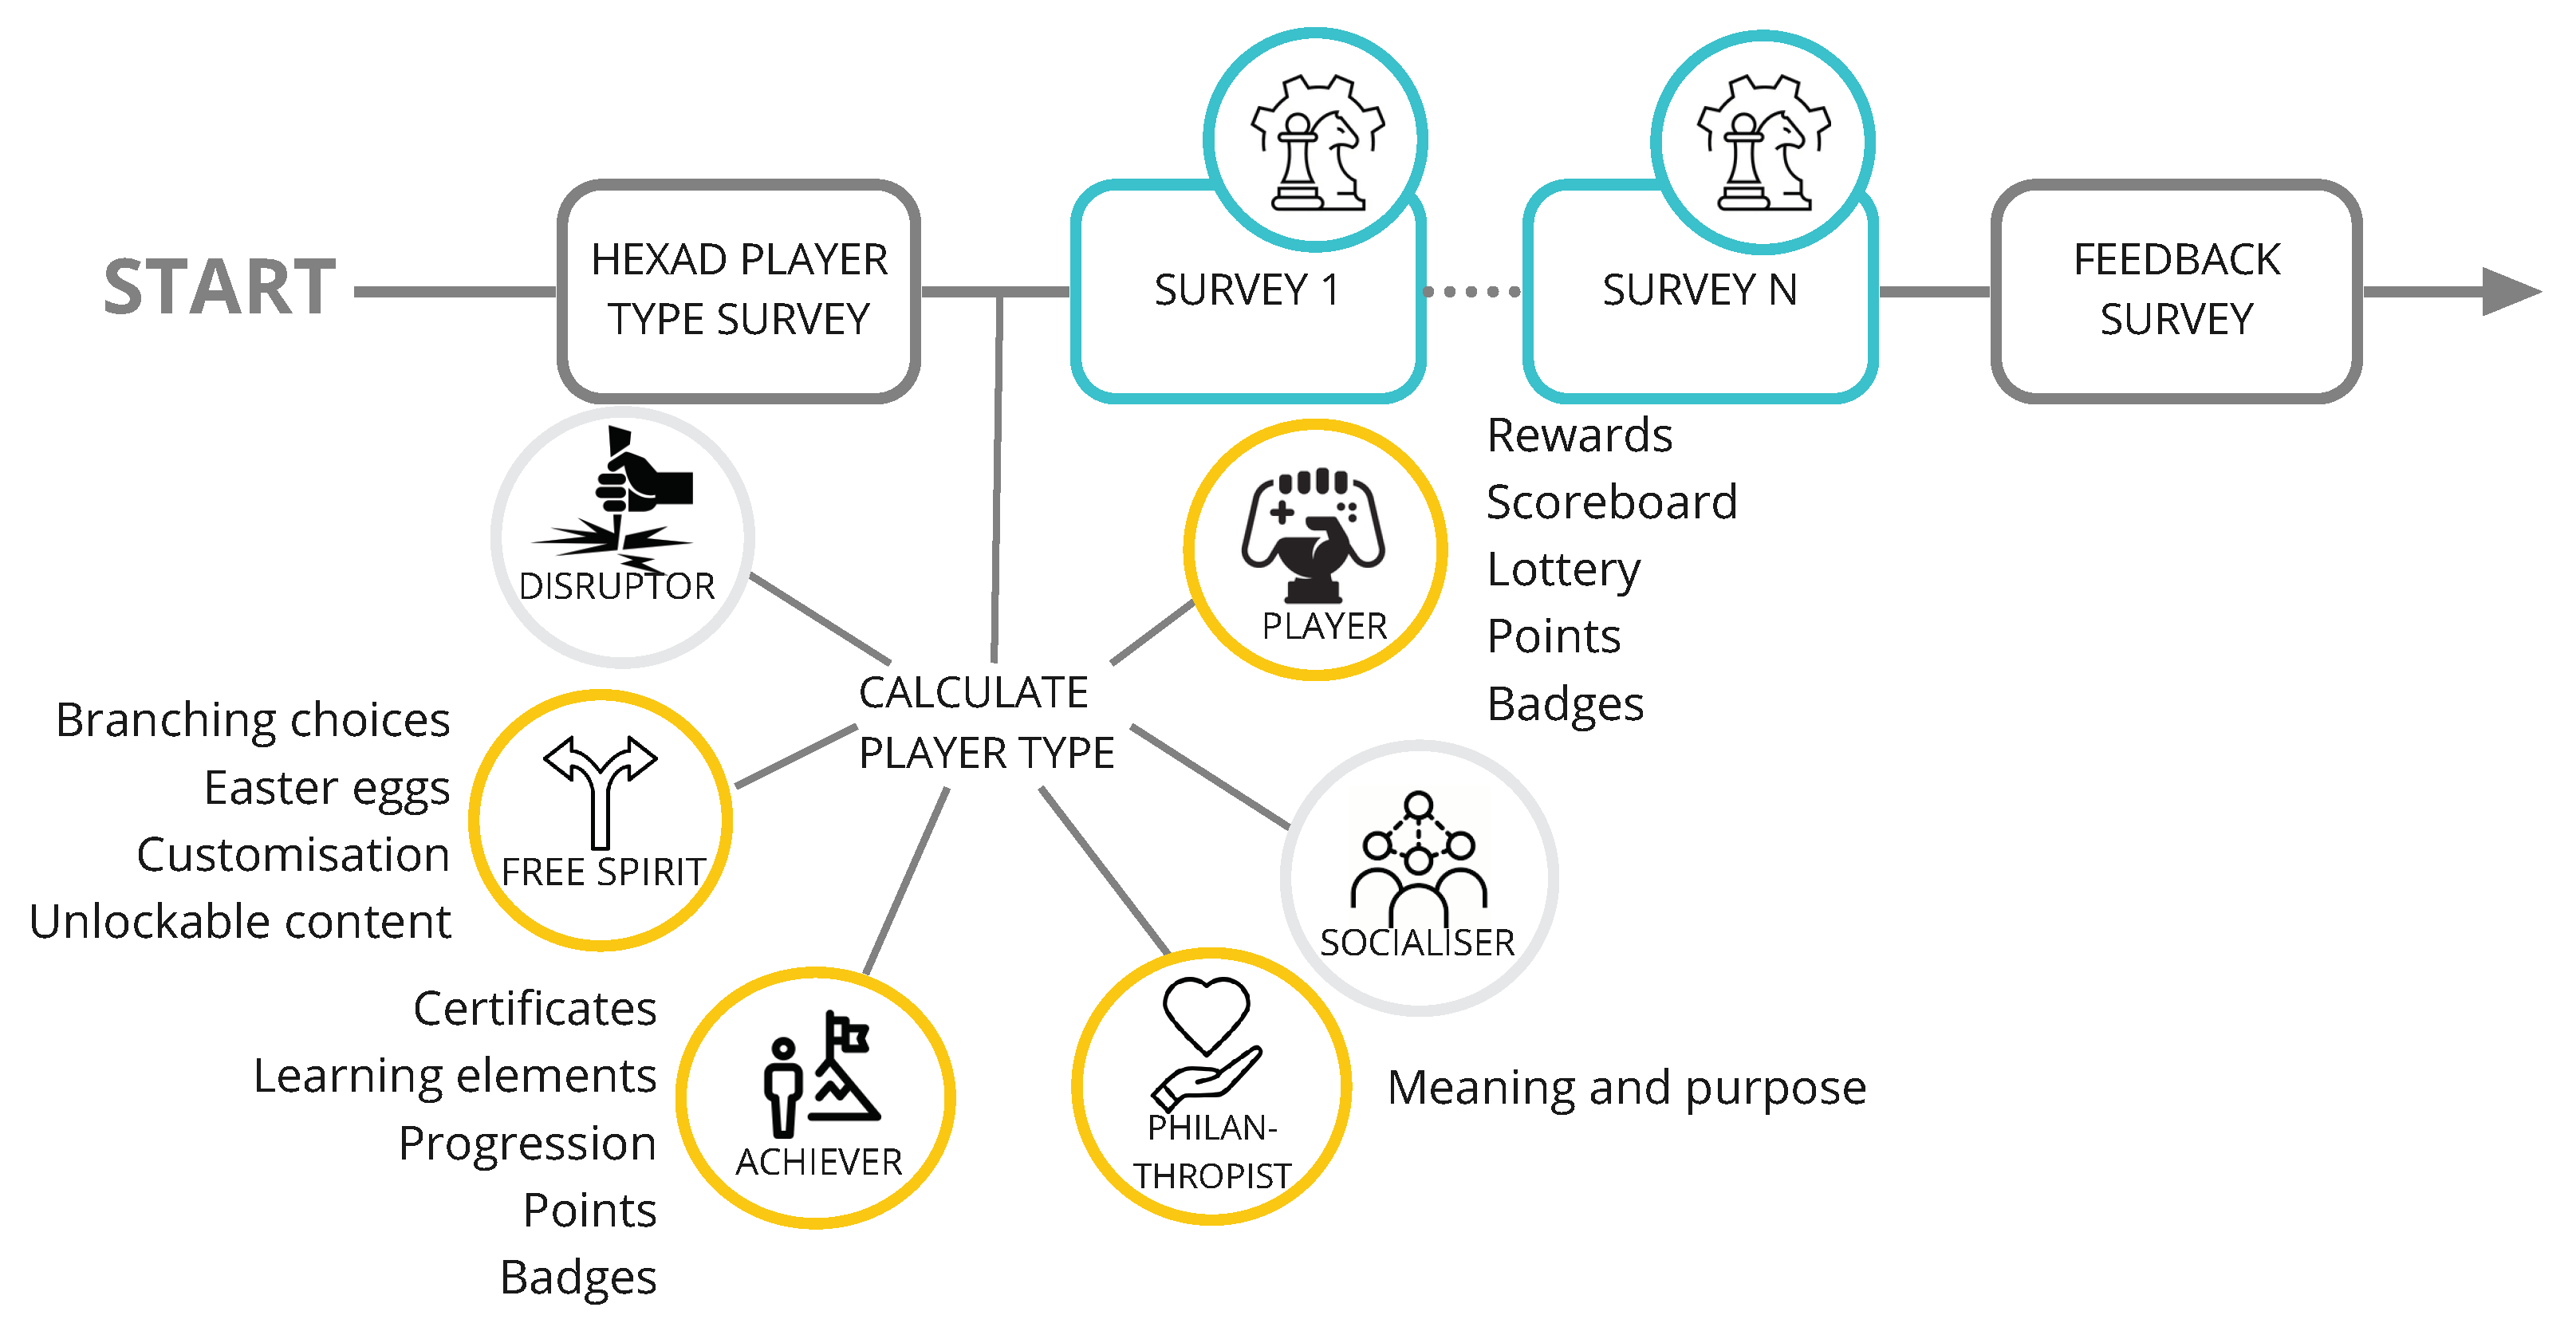
Figure 2 gives an overview of the structure of the mobile application. The application consists of multiple questionnaires that can be completed sequentially without interruptions. As the design and implementation of gamified surveys is a time-intensive task, the objective was to create a system that is reusable and extendable with different questionnaires. Nevertheless, the structure of the system will remain the same. First, to determine the player type of the user, the user has to fill in the Hexad Player Type survey, as shown in Figure 2. This survey consists of 24 questions using a 7-point Likert scale. The dominant player type is the type that receives the highest score. An ex-aequo for multiple types is possible, the user will then have multiple dominant player types.
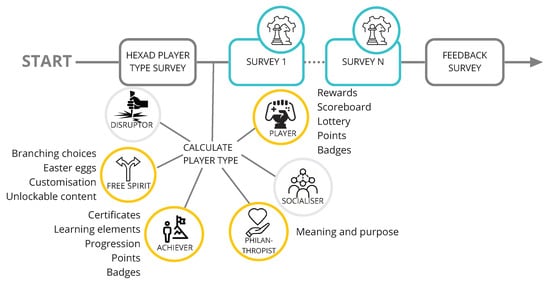
Figure 2.
The mobile applications consists of multiple surveys, of which the first and the last are always the same. First, to determine the player type (yellow), the Hexad survey has to be filled in. Next, the user can start to fill in the gamified surveys (blue), containing game elements based on their player type. Finally, a feedback survey needs to be filled in to evaluate the user experience.
Next, as the player type is known, the following 1 to N surveys will be gamified by adding the game elements corresponding to the dominant player type. The application is designed as such that these questionnaires can be replaced by any number of other questionnaires. Finally, to evaluate the prototype, the user has to fill in a feedback survey.
For the prototype, the user had to complete an aggregated survey with a duration of around 30 min.
3.2. Gamification
After the Hexad Player Type of the user is determined, the game elements specific to their type, according to the Hexad Framework, will be integrated in the next N surveys, as shown on Figure 2. For the disruptor and socialiser type, no game elements were included as these are less applicable to a survey context. For the remaining types, the game elements that best fit a survey context are implemented in the system. Game elements that contain a social element, such as collect and trade, or require an extensive gamified environment that tracks the progression of the user, such as boss battles or quests have been left out of the application. For a survey that has to be filled in in one setting, these game elements are too elaborate and can distract the user from properly filling in the survey. For repeated surveys, that the respondent has to complete on, e.g., a daily or weekly basis, these elements can be an added value as they can be used to motivate the user to commit themselves to completing the survey each time. The following paragraphs discuss how the specific game elements are implemented in the mobile application for each player type.
Free Spirits are motivated by autonomy and self-expression. They prefer to create and explore.
- Branching choices:To insert a branching choice, the free spirit user type receives an additional question, giving the user the choice to complete an extra quiz or not. This quiz and additional question to fill in the quiz is not shown to other user types.
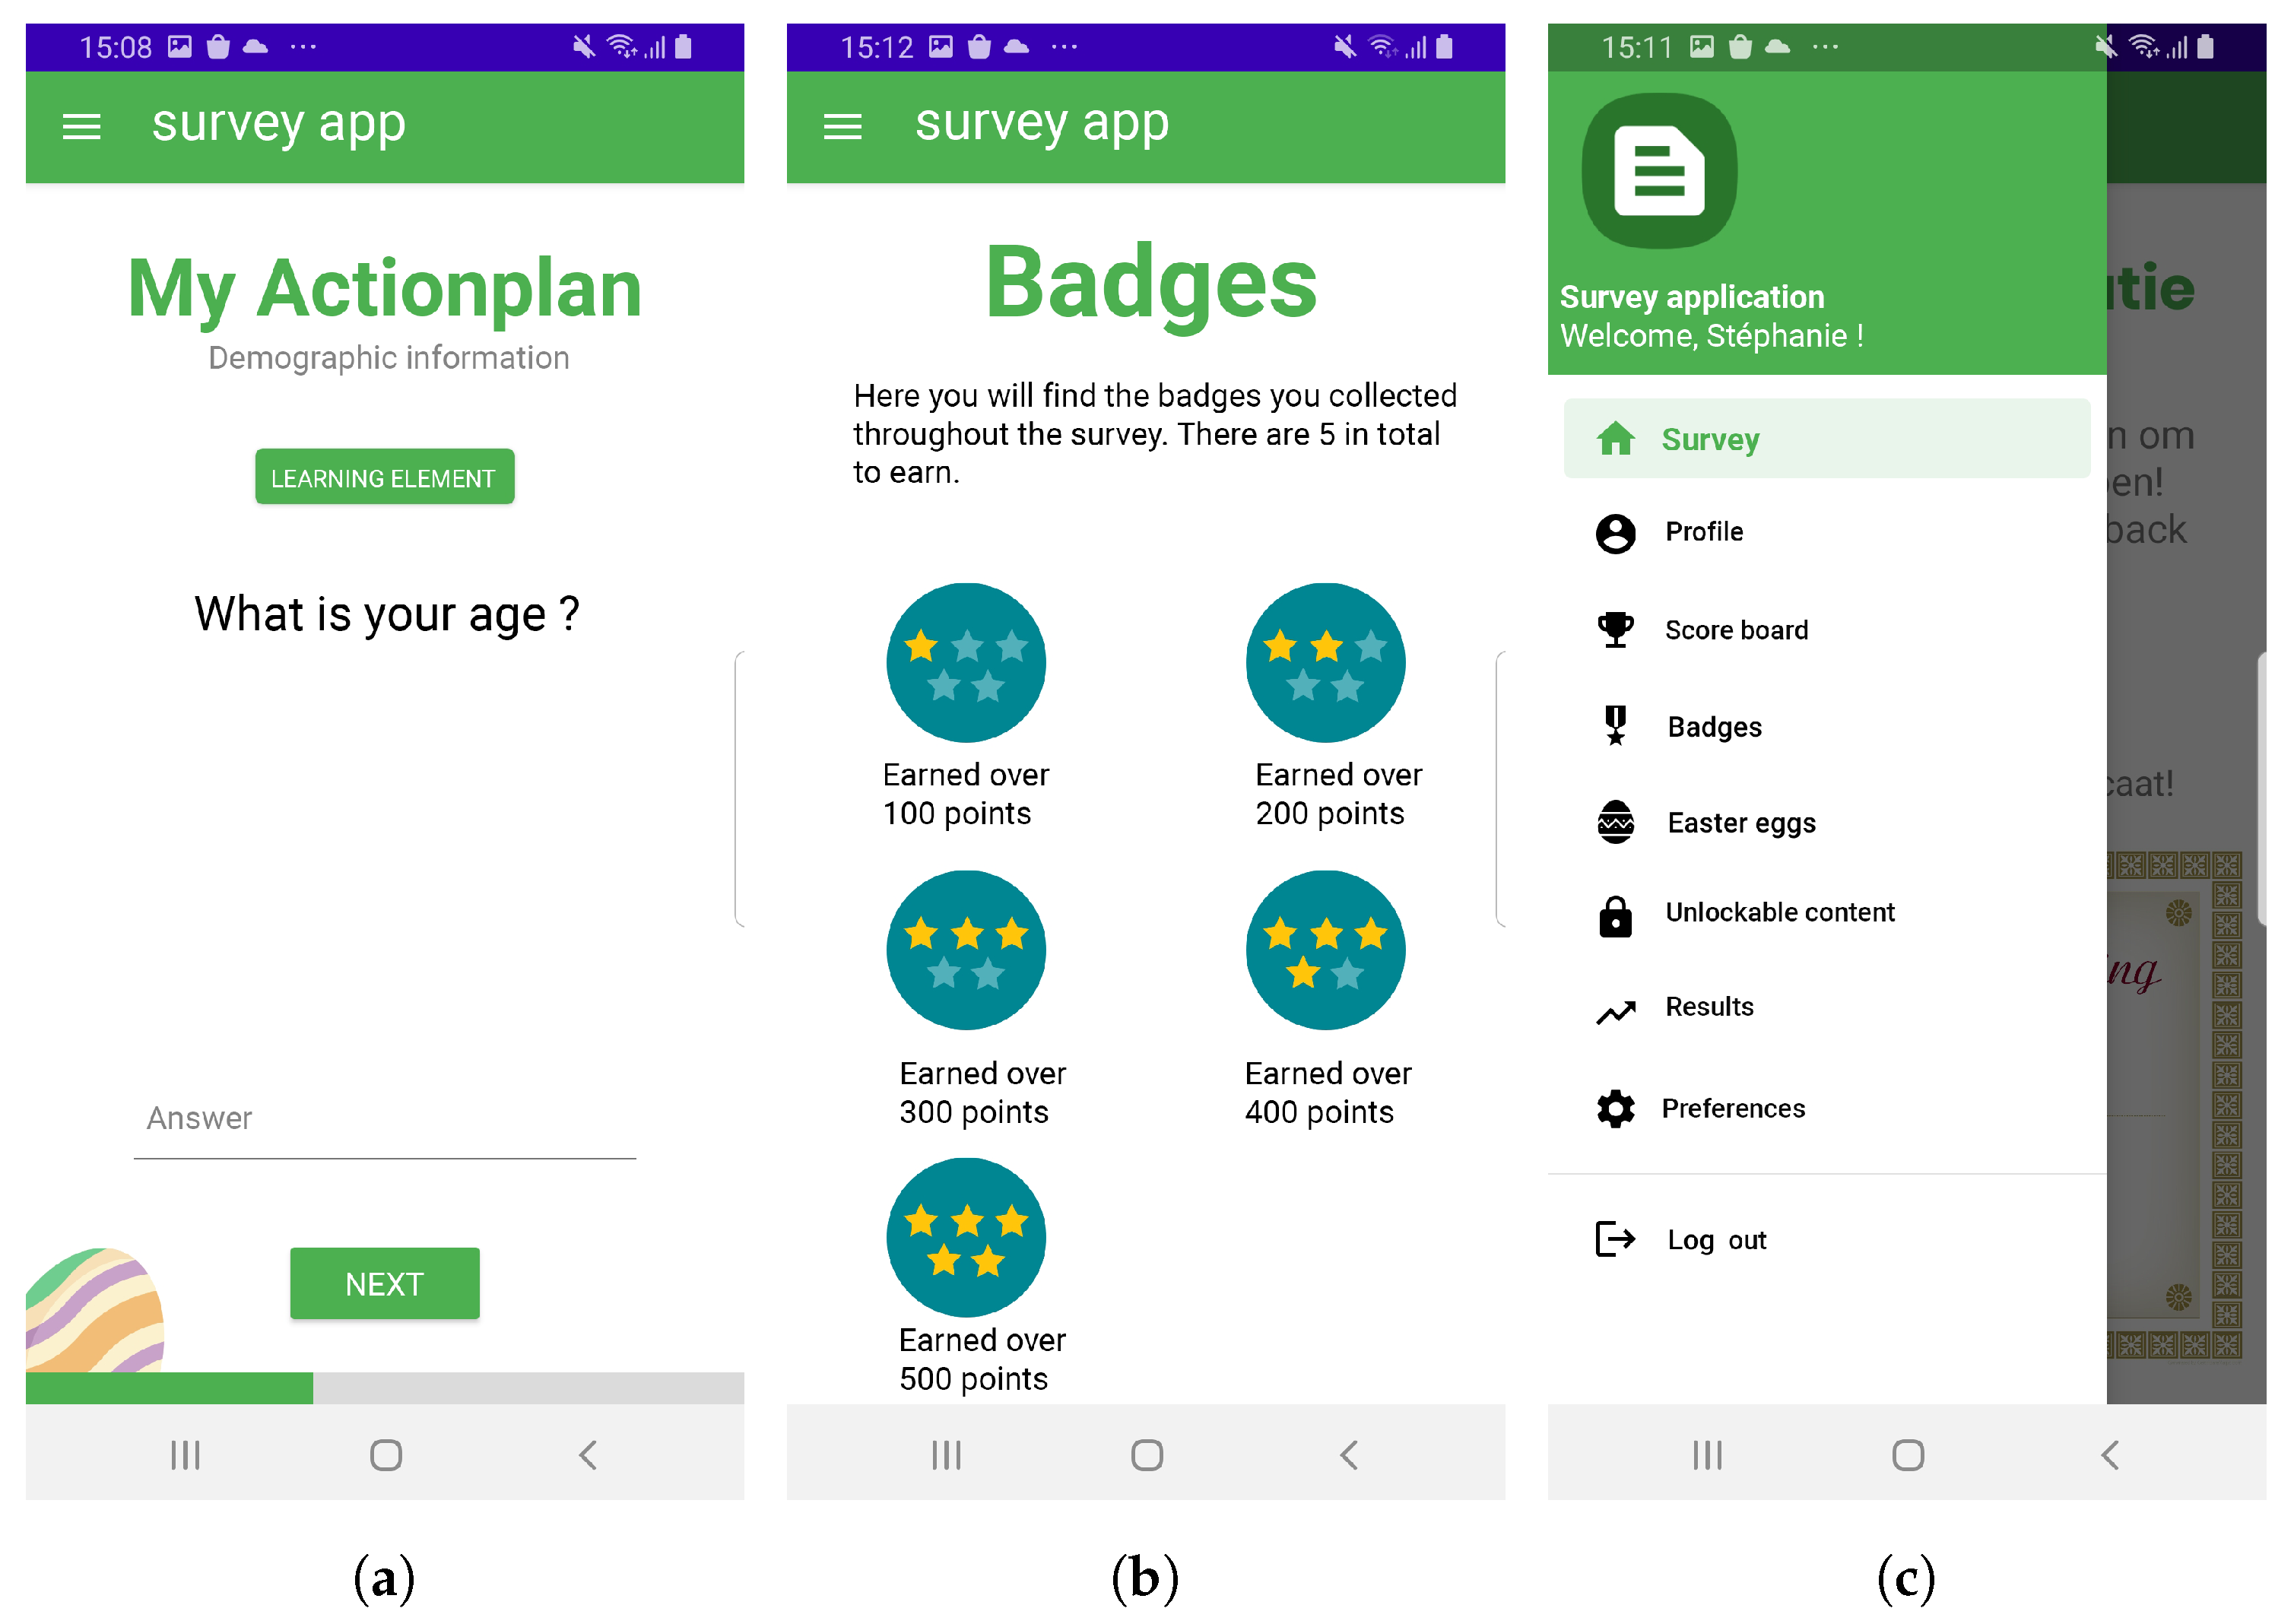
- Easter eggs: Three Easter eggs are hidden in the application in the form of clickable images of eggs. By clicking the egg, the user collects it and unlocks a hidden feature, e.g., the option to change the colour of the menu and toolbar. An example of such an Easter egg is shown in Figure 3a. The user is in advance notified of the existence of these collectables.
 Figure 3. Some examples of game elements in the application: (a) An example of an Easter egg, hidden in the application. (b) Some player types receive badges by earning points. A player can earn points by completing questions. (c) Via the menu, the user can explore several game elements, such as the Easter eggs they found or how they rank on the scoreboard.
 - Customisation: The customisation of the menu and the toolbar can be unlocked by collecting one of three Easter eggs.
- Unlockable content: By collecting the Easter eggs, the user unlocks several features, such as changing the application’s theme, changing the avatar of the user and changing the colour of the menu and toolbar.
Achievers are motivated by relatedness, they want to interact with others and create social connections.
- Certificates: After the Hexad questionnaire, this user type is notified that they can receive a certificate if they complete the survey.
- Learning elements: For each of the gamified questionnaires, a learning element has been integrated. By clicking this element, the user receives more information about the current questionnaire and its purpose.
- Progression: A progress bar allows the user to see how many questions are left to be answered.
- Points: A points mechanism has been integrated into the application. The user earns points by answering certain questions.
- Badges: The user can collect 5 badges by earning points. The first badge is earned after collecting 100 points, the second after 200 points and so forth until the user has collected 500 points to receive the final badge. The user is notified they are 5 badges to collect throughout the application, as shown on Figure 3b.
Philanthropists are motivated by purpose and meaning and are altruistic. They prefer to give to other people and enrich the lives of others without expecting a reward.
- Meaning and purpose: The user receives an explanation on the purpose of the thesis at the start of the gamified surveys. Furthermore, they are presented with more information on their player type.
Players are extrinsically motivated by rewards and will do only what is necessary to collect these rewards.
- Rewards: Rewards are provided in the form of badges, which have been explained for the Achiever type.
- Scoreboard: A scoreboard ranks the users and their respective points. Only users that earn points are displayed in this list. This allows players to compare their score to others.
- Lottery: This game element has been implemented as a mini game within the survey. The user has to spin the bottle to get a chance at winning 30 extra points.
- Badges: see Achiever.
- Points: see Achiever.
Figure 3c shows an example of the menu of the application in which a number of gamification elements have been incorporated.
Socializers are motivated by relatedness and want to communicate or interact with others to form social connections. The socializer type was left out of the application as the creation of a social network within a one-time survey is too complicated and distracting for the purpose of this survey. Including a social network into a survey that users have to regularly fill in, however, could motivate users to commit to periodically completing the surveys if they see their friends are doing this too, e.g., a competition element.
Disruptors are motivated by change and want to disturb the system to see these changes. Again, this type does not fit the context of a one-time survey as this is too short to see the effect of their changes. The disruptor type and its game elements were thus excluded from the application. However, in a periodic survey, they could, for example, be given control over when and which questions to fill in.
3.3. Design and Implementation
The design of the mobile survey application has to meet several non-functional requirements. First, the application must be reusable and easily extensible. Specifically, this means that the 1 to N surveys, as shown in Figure 2, are not fixed and can be easily replaced by any number of other surveys. Additionally, the different components of the application should be separately testable. Next, as the aim is to increase the user experience, loading times should be no higher than 5 s.
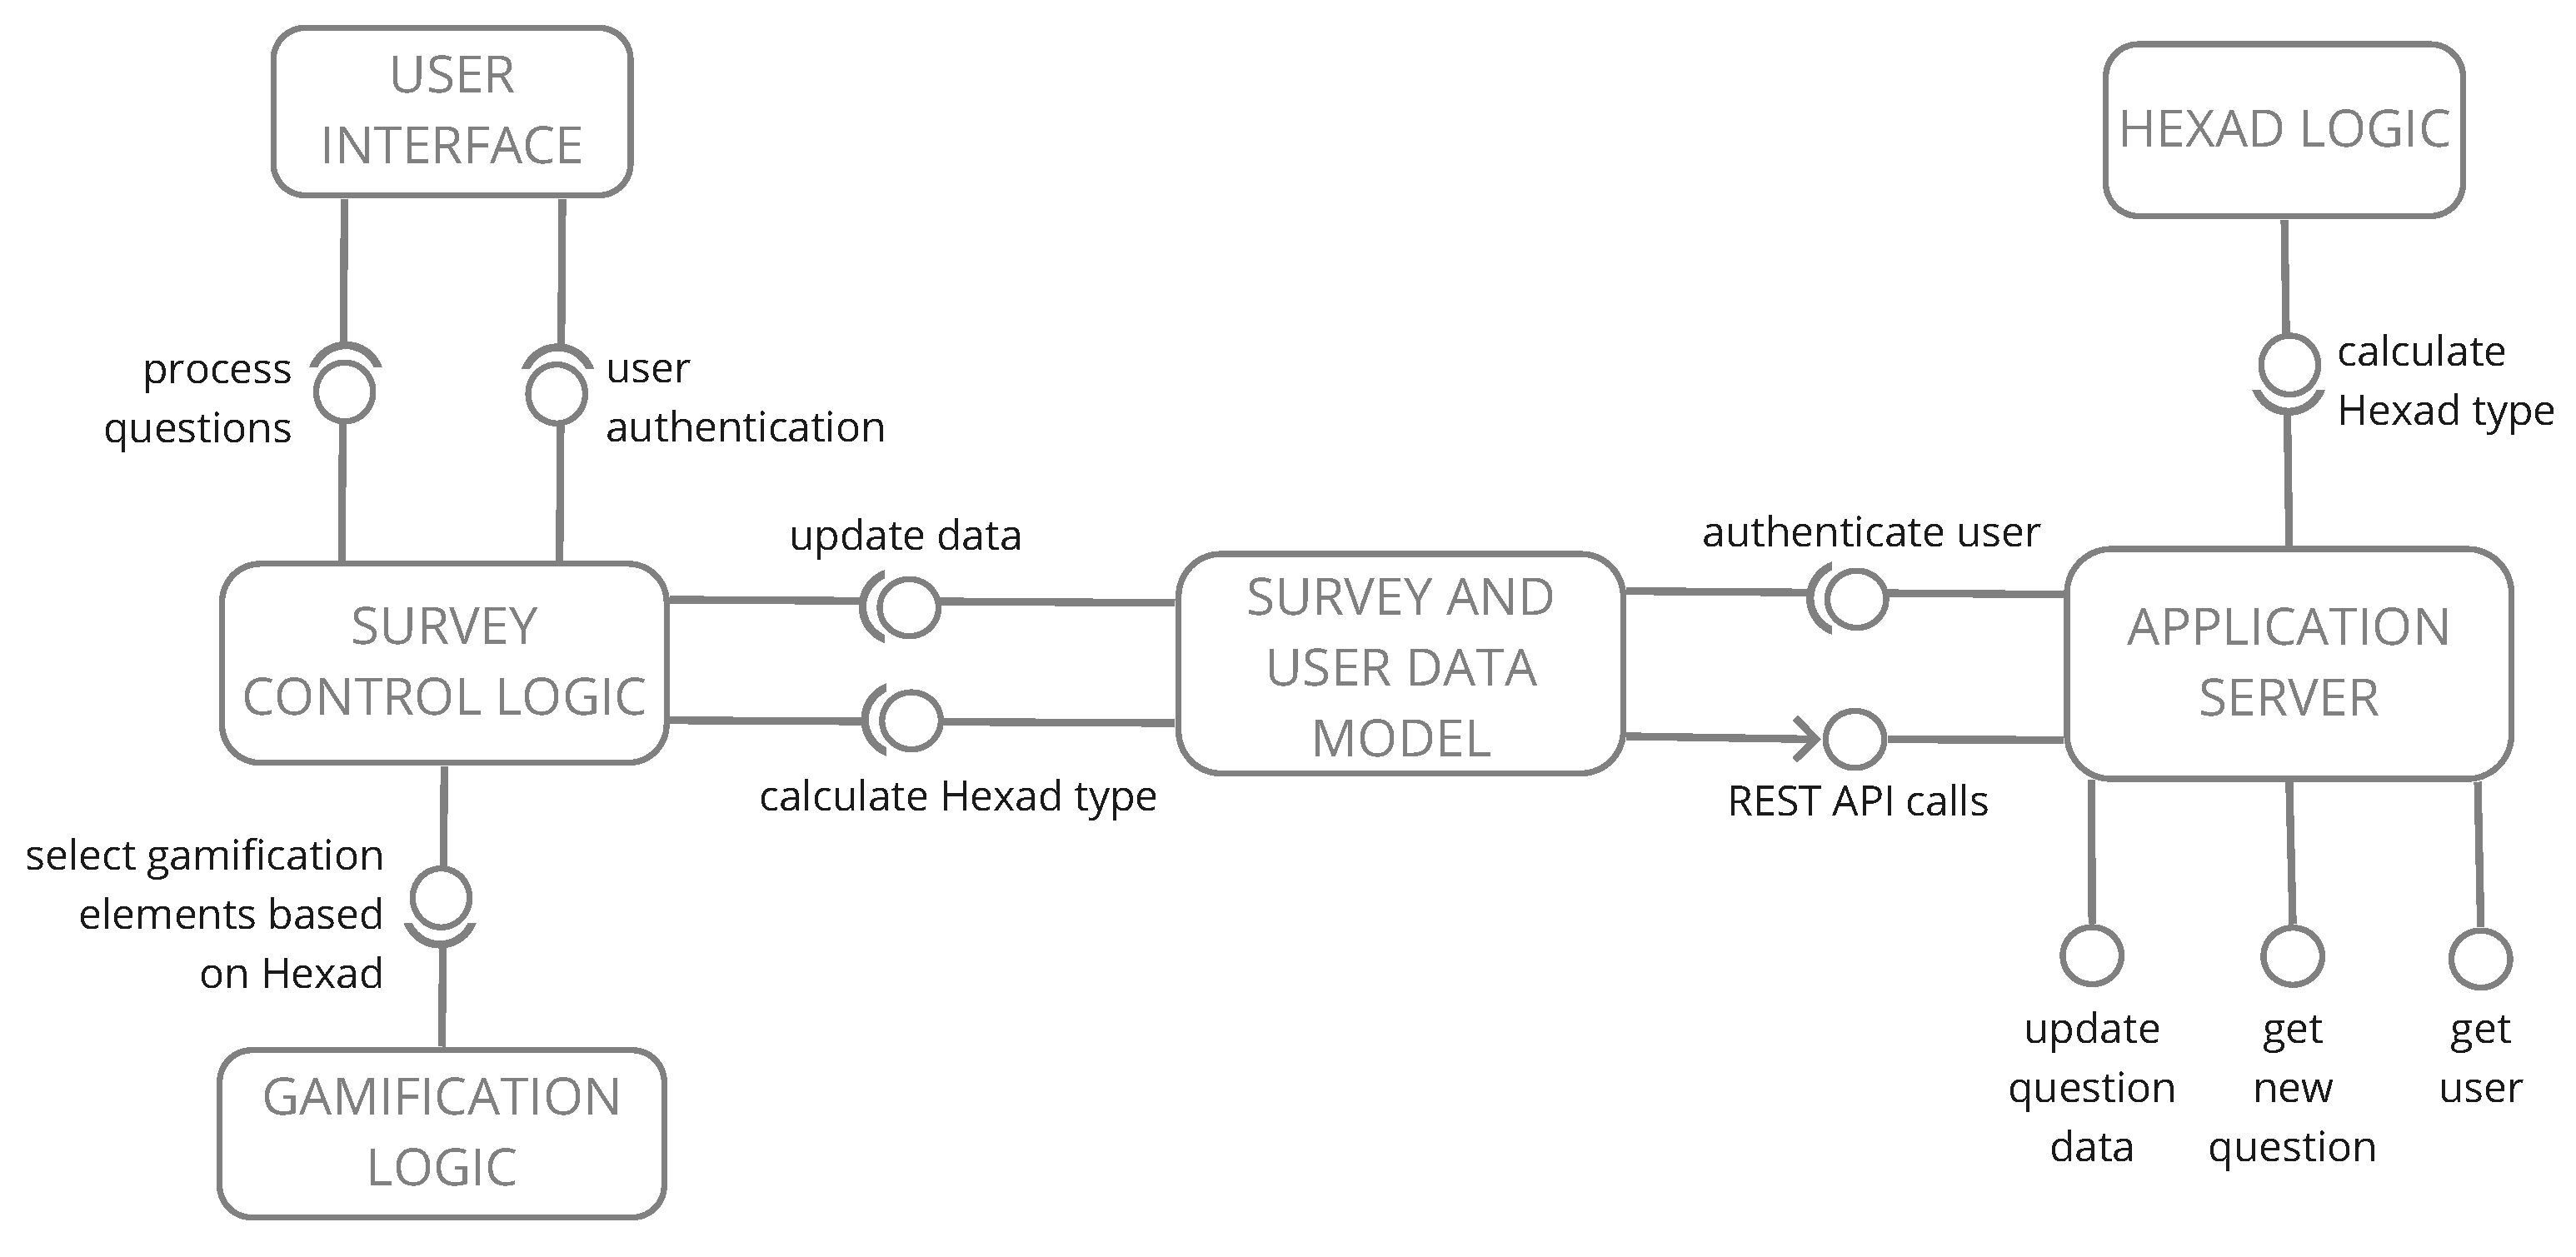
Figure 4 shows the high level overview of the different components of the system. The Hexad Logic component is responsible for the algorithm that calculates the Hexad Player Type, based on the results of the questionnaire. The Application Server component stores and updates the necessary data that is sent by the Survey and User Data Model component, which is in charge of making sure the data in the server remains up to date. The Survey Control Logic is responsible for processing the data of the survey and authenticating the user. Furthermore, it communicates with the Data Model to calculate the Hexad Player Type of the user, which is necessary for the Gamification Logic to provide the game elements tailored to the user. Separating the gamification logic from the rest of the system allows for easy additions of game elements in the future. Finally, the User Interface provides the interaction with the end-user.
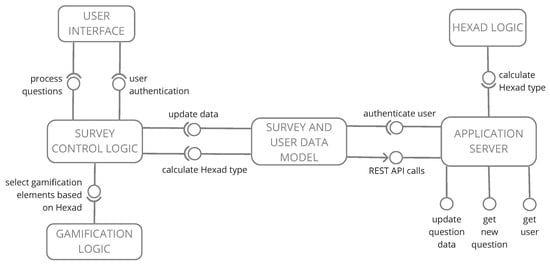
Figure 4.
The high-level architecture of the system indicates that the gamification logic has been isolated in a separate component to ensure new game elements can easily be added without the need to modify other components. Similarly, the survey logic and user interface are separated so the user interface can be easily extended to accommodate for other types of questions. This also ensures other surveys than those used in the proof of concept can be added to the application.
Technology-wise, the mobile Android application has been developed in Java using Android Studio [33] communicating via a REST API, using the Spring framework [34], with a PostgreSQL database [35] to store relevant information.
To ensure the application can indeed be extended or reused by including other surveys, the User Interface component is capable to process three different sets of questions using Android fragments, namely Likert scale questions, open questions and multiple choice questions. For each set of similar question types within a survey, one of these three types of fragments can be used. If a questionnaire would contain any other type of question, a new fragment has to be added.
4. Method
To evaluate the mobile survey application a pilot study using A/B testing has been conducted. Overall, participants were asked around 30 min of their time to use the application to complete the entire survey. The following paragraphs discuss the hypotheses and the study method.
4.1. Objective
The aim of the research is to investigate if adding personalised gamification to a survey can increase user engagement and lead to increased data quality. The following hypotheses were verified:
Hypothesis 1.
The user experience of a user filling in a survey with personalised gamification is higher than the user experience of a user completing a regular survey.
Hypothesis 2.
The use of personalised gamification in a survey leads to an increase in data quality compared to non-gamified surveys.
4.2. Evaluation Set-Up
To evaluate the technical feasibility of the application and verify the hypothesis both user tests and system tests were conducted.
For the user tests, participants were divided into two groups. Group 1 received a version of the application that did not include any gamification, whereas Group 2 received the version including personalised gamification. Both groups had to fill in the same questionnaires, including the Hexad Player Type survey. For the proof of concept, we chose surveys situated in the healthcare domain that question the general well-being and physical activity level of people. Of course, the application can be used with other surveys from different application domains. More specifically, we used the Big Five Inventory, BFI-44, personality survey [36], 44 questions determining personality according to the Big Five personality traits. Next, the My Actionplan [37] survey has to be completed, gaining insight into the behavioural change and its underlying mechanisms people experience when trying to increase their physical activity. This is followed by another survey on health and exercise, developed by the Department of Physical Activity and Health at Ghent University in collaboration with the Institute of Healthy Living [38]. These surveys consist of Likert scale questions, open-ended questions and true/false questions. Finally, to evaluate the prototype, the user has to fill in a feedback survey, containing 6 open questions and three 5-point Likert scale questions on user experience and how long they suspect it took them to complete the survey.
To participate in the study, access to an Android device containing Android 7.0 or higher and a working internet connection were required. Participants have been recruited via social media and participated in the study voluntarily. In total, 28 respondents participated in the study. The average age is 29.7 (stdev 10.2) and 40.7% of participants are female. The average age of the gamified group is 26 (stdev 5.7) and 34 (stdev 12.7) for the non-gamified group. The gamified group consists of 40% women and the non-gamified of 41.7% women.
During the user tests, information regarding the performance of the user was monitored, such as the number of closures of the application, number of completed questions, time to complete each question plus the response of each question. For some player types extra information regarding specific game elements has been saved as well: the number of points earned and the interaction with the learning elements. Furthermore, player type and the answers to the feedback questionnaire are stored.
To evaluate the technical feasibility of providing the user a smooth user experience while filling in a digital gamified survey, several system tests have been performed. These tests evaluate the loading times of the application and the required memory using the Android Profiler from the Android Studio IDE [33].
5. Results
The following paragraphs will discuss the results of pilot study and the system tests to validate the technical feasibility.
5.1. User Tests
In total, the data of 28 participants has been collected: 16 used the gamified application and 12 tested the non-gamified version. In total, three participants did not complete the surveys. Table 1 gives an overview of the different player types. None of the gamified participants were classified as disruptor or socializer, so no participants had to be excluded from the study. Furthermore, several users had multiple dominant player types; one participant of the gamified version was even assigned three dominant player types. To offer personalised gamification, all dominant player types of these users were included in the application.

Table 1.
Amongst the 16 gamified participants, no socializer or disruptor type was present, so no exclusions were made. Some participants had multiple dominant types, which were all included in the gamification.
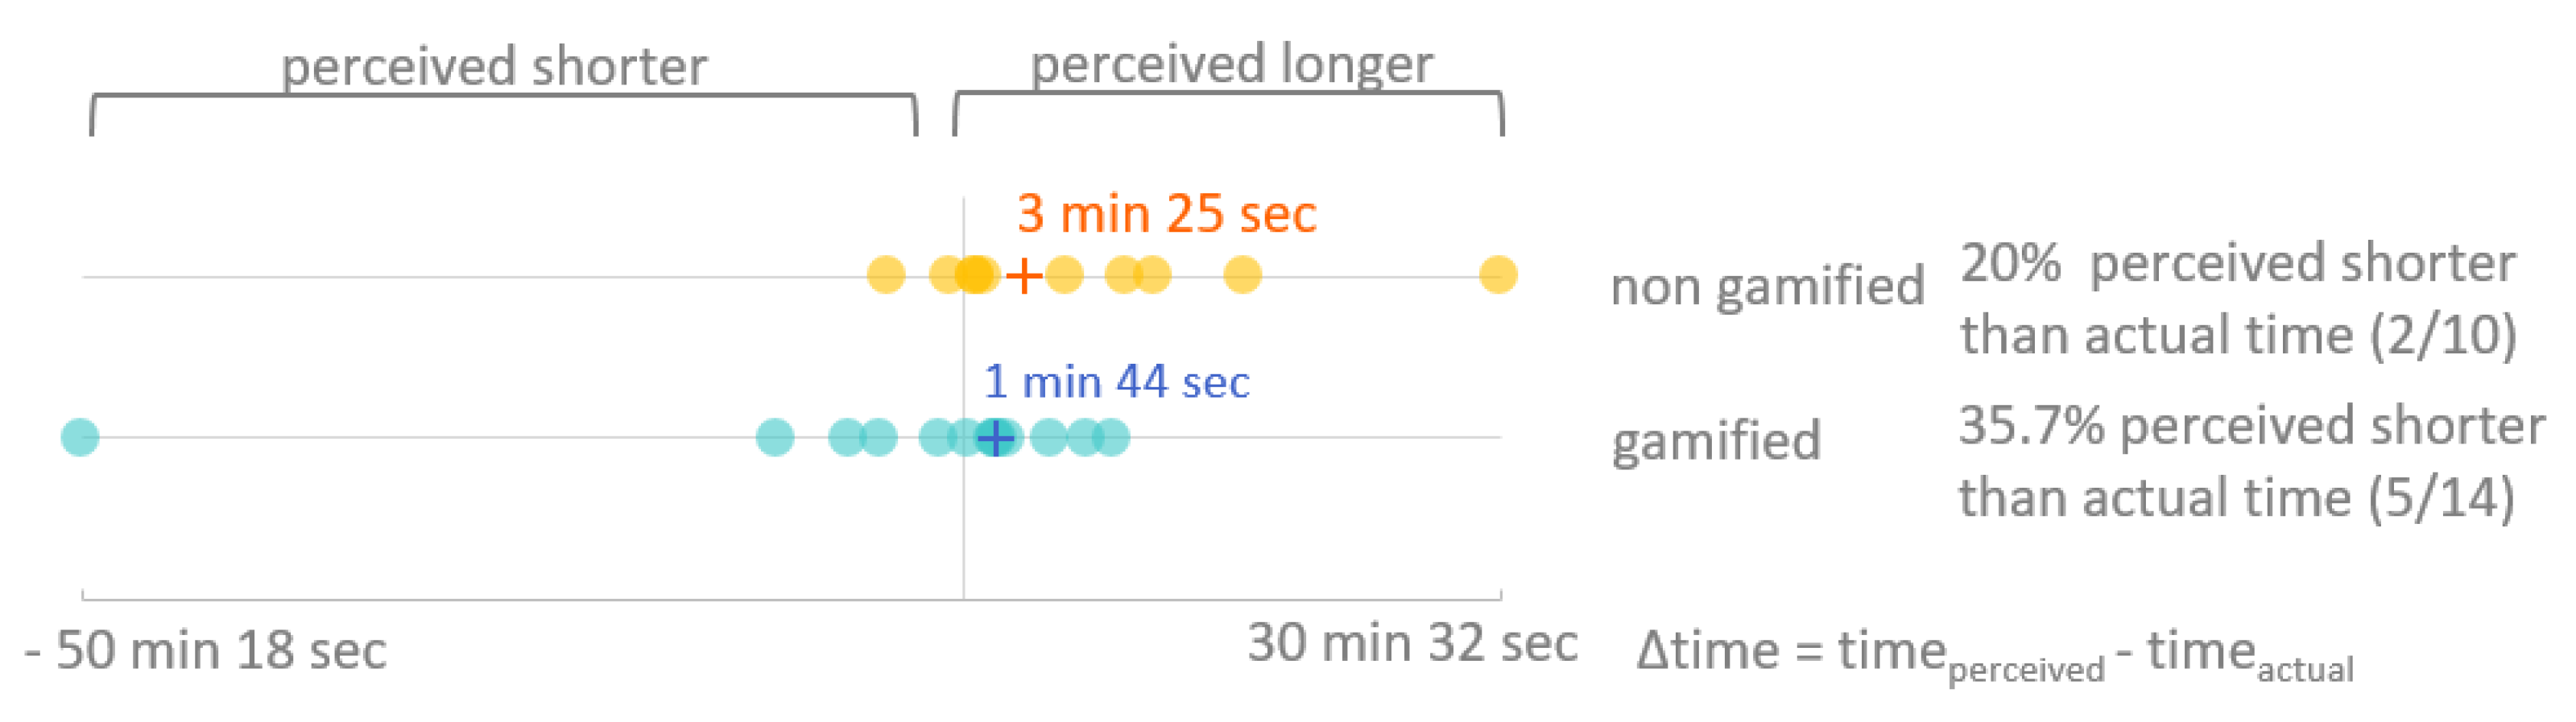
Figure 5 shows for the gamified and non-gamified application. is the difference between the perceived time, the time participants thought it took to complete the entire survey, and the actual time. If is smaller than zero, the participant experienced it as shorter than the actual time. This was the case for the non-gamified version for 20% of the participants, compared to 35.7% of the gamified users. Even though more users of the gamified application seem to rate their experience as shorter than reality, the median of the results of both groups differ less: 3 min 25 s for the non-gamified group and 1 min 44 s for the gamified group. Both groups contain data points that might be considered as outliers, but it is uncertain to know if in both situations something went wrong or not: one user of the gamified group estimated they needed 20 min to complete the survey, compared to an actual time of 70 min. A participant, of the non-gamified group estimated it took them 60 min to complete, while they needed only 30. To evaluate the statistical significance of the distribution of between the two test groups, the non-parametric Mann-Whitney U test has been performed, as shown in Table 2 (1). The test retained the null hypothesis, therefore, a larger participant pool is needed to explore the statistical significance of the results and to confirm that the gamified application reduces the perceived duration.

Figure 5.
More users of the gamified application (35.7% or 5 out of 14) estimated their completion time to be shorter than it actually was, compared to the users of the non-gamified application (20% or 2 out of 10). The difference between the median of the two groups is however small: 3 min 25 s for the non-gamified group and only 1 min 44 s for the gamified group, both indicating a longer perception time than the actual duration.
Table 2.
The Mann-Whitney U test has been performed for (1) and (2) Time per Question to evaluate the significance of the distribution. Both tests retained the null hypothesis.
Often, when surveys are tedious and long, it might happen that respondents start rushing through these type of Likert-scale questions by continuously indicating the same answer, i.e., straight-lining. To analyse the data quality and detect any loss of quality, several indicators exist, such as continuing the survey, item non-response, answer length to open questions, rounded answers to numeric questions, straight-lining, speeding, bogus item flags and consistency items [39,40,41,42]. As this research focuses on the use of existing surveys, no bogus item flags or consistency items are included in the survey. Furthermore, the application did not allow to leave questions unanswered and limited open or numeric answers had to be given, so item non-response, length of answers or rounded answers are irrelevant in the current context. As the majority of the survey contained Likert-scale questions, a speeding analysis and straight-lining analysis were performed.
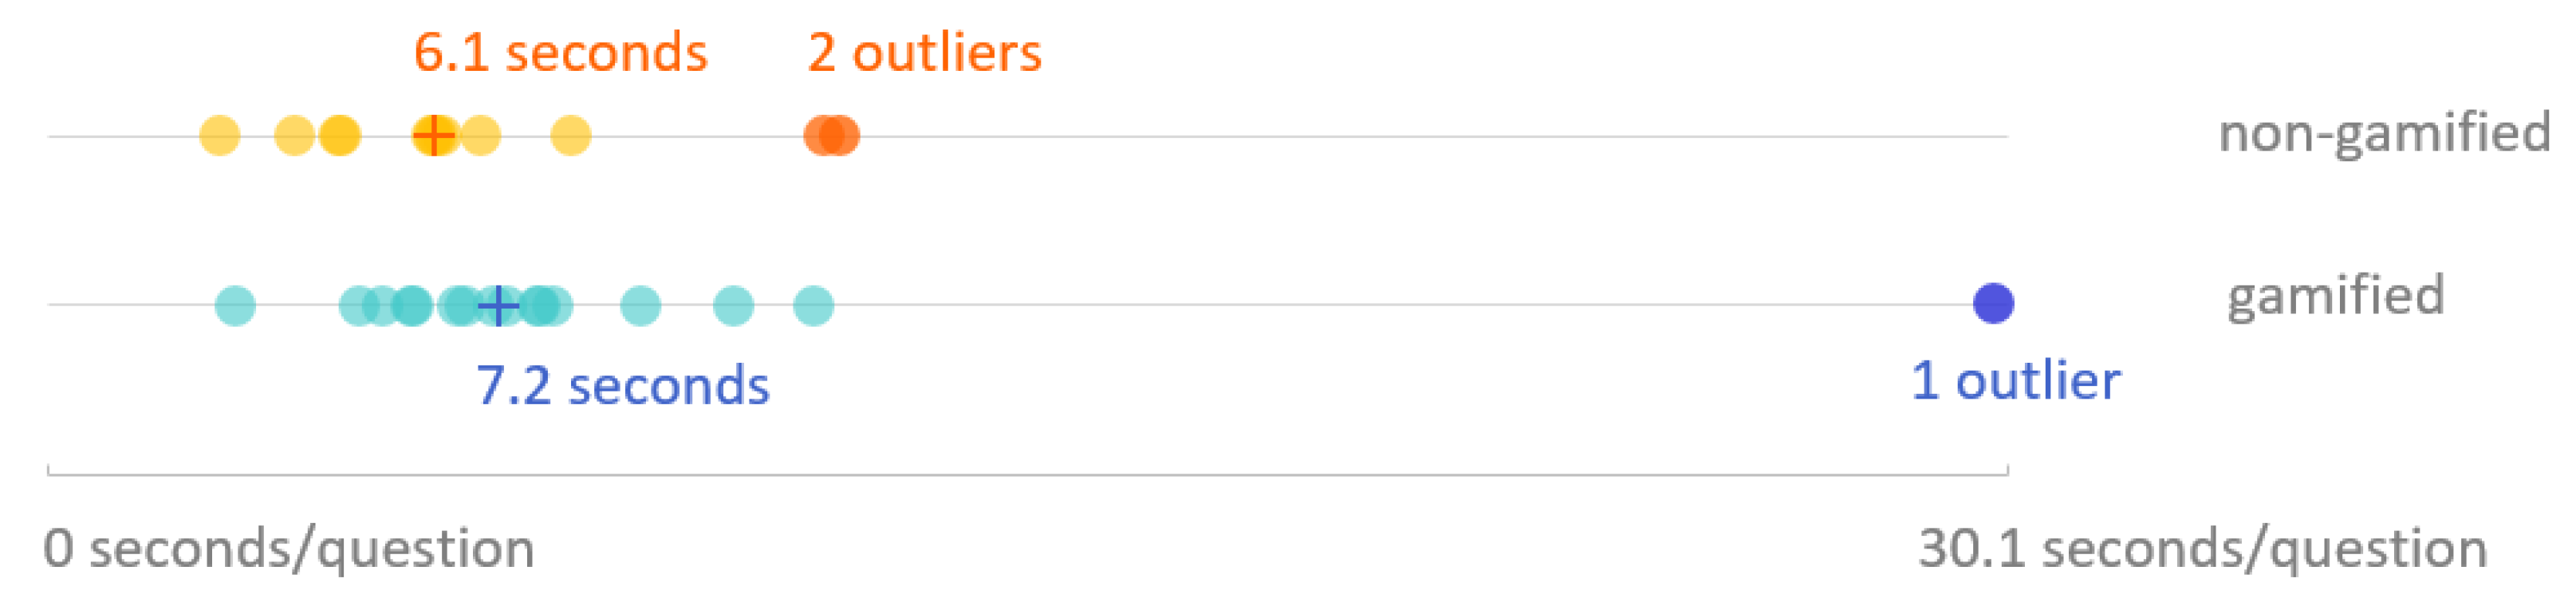
Out of 16 testers of the gamified survey, only 1 ended the survey prematurely, compared to 2 out of 12 participants of the traditional survey, as shown in Table 1. Figure 6 gives an overview of the average time per question needed for each of the 28 participants, including premature terminations. Outlier detection, using the interquartile range (IQR) method indicated no significant outliers at the lower limit that would suggest speeding. The median of the gamified survey is 1.1 s higher than the median of the traditional survey. This can be explained by the presence of game elements, that require some attention by the respondent. To evaluate the statistical significance of the distribution of the Time per question between the two test groups, the non-parametric Mann-Whitney U test has been performed, as shown in Table 2 (2). The test retained the null hypothesis so more testing is needed to validate these results.
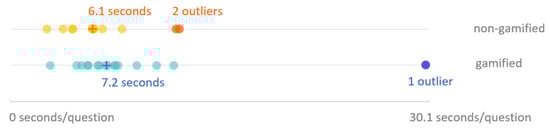
Figure 6.
Comparing the average time per question for the entire survey, no significant outliers can be detected at the lower limit that would suggest speeding. Overall, the median of time/question for the non-gamified questions is 1.1 s lower than for the gamified questions, as gamification elements can take up some time to process.
Both the BFI-44 survey and a subsection of the My Actionplan survey contain a list of 5-point Likert questions. To detect any suspicion of loss of data quality, a straight-lining analysis can be performed. When the variation of answers is low and the completion time is also remarkably low, there is a possibility that the respondent has been straight-lining. This analysis, however, remains an indication as it is unverifiable if a respondent has answered truthfully [43].
There are no standardised metrics to detect straight-lining, but one type of analysis uses the variation of answers to give an indication if users chose the same answers. A simple metric to calculate the variation is the Standard Deviation of Battery, which is calculated as the standard deviation of the entire set of answers of each survey. As this metric can be unreliable in specific cases, such as when the user switches between the two most extreme answering options, it is advised to use a second measure, e.g., the Scale Point Variation (SPV) [43]. The SPV is defined as 1 , with the proportion of values present at each scale point on the Likert scale and i indicates the number of scale points, in this case a 5-point Likert scale [43]. For example, if the participant has responded 1 × completely disagree, 11 × disagree, 12 × neutral, 18 × agree and 2 × completely agree on the 44 questions, the SPV is calculated as follows:
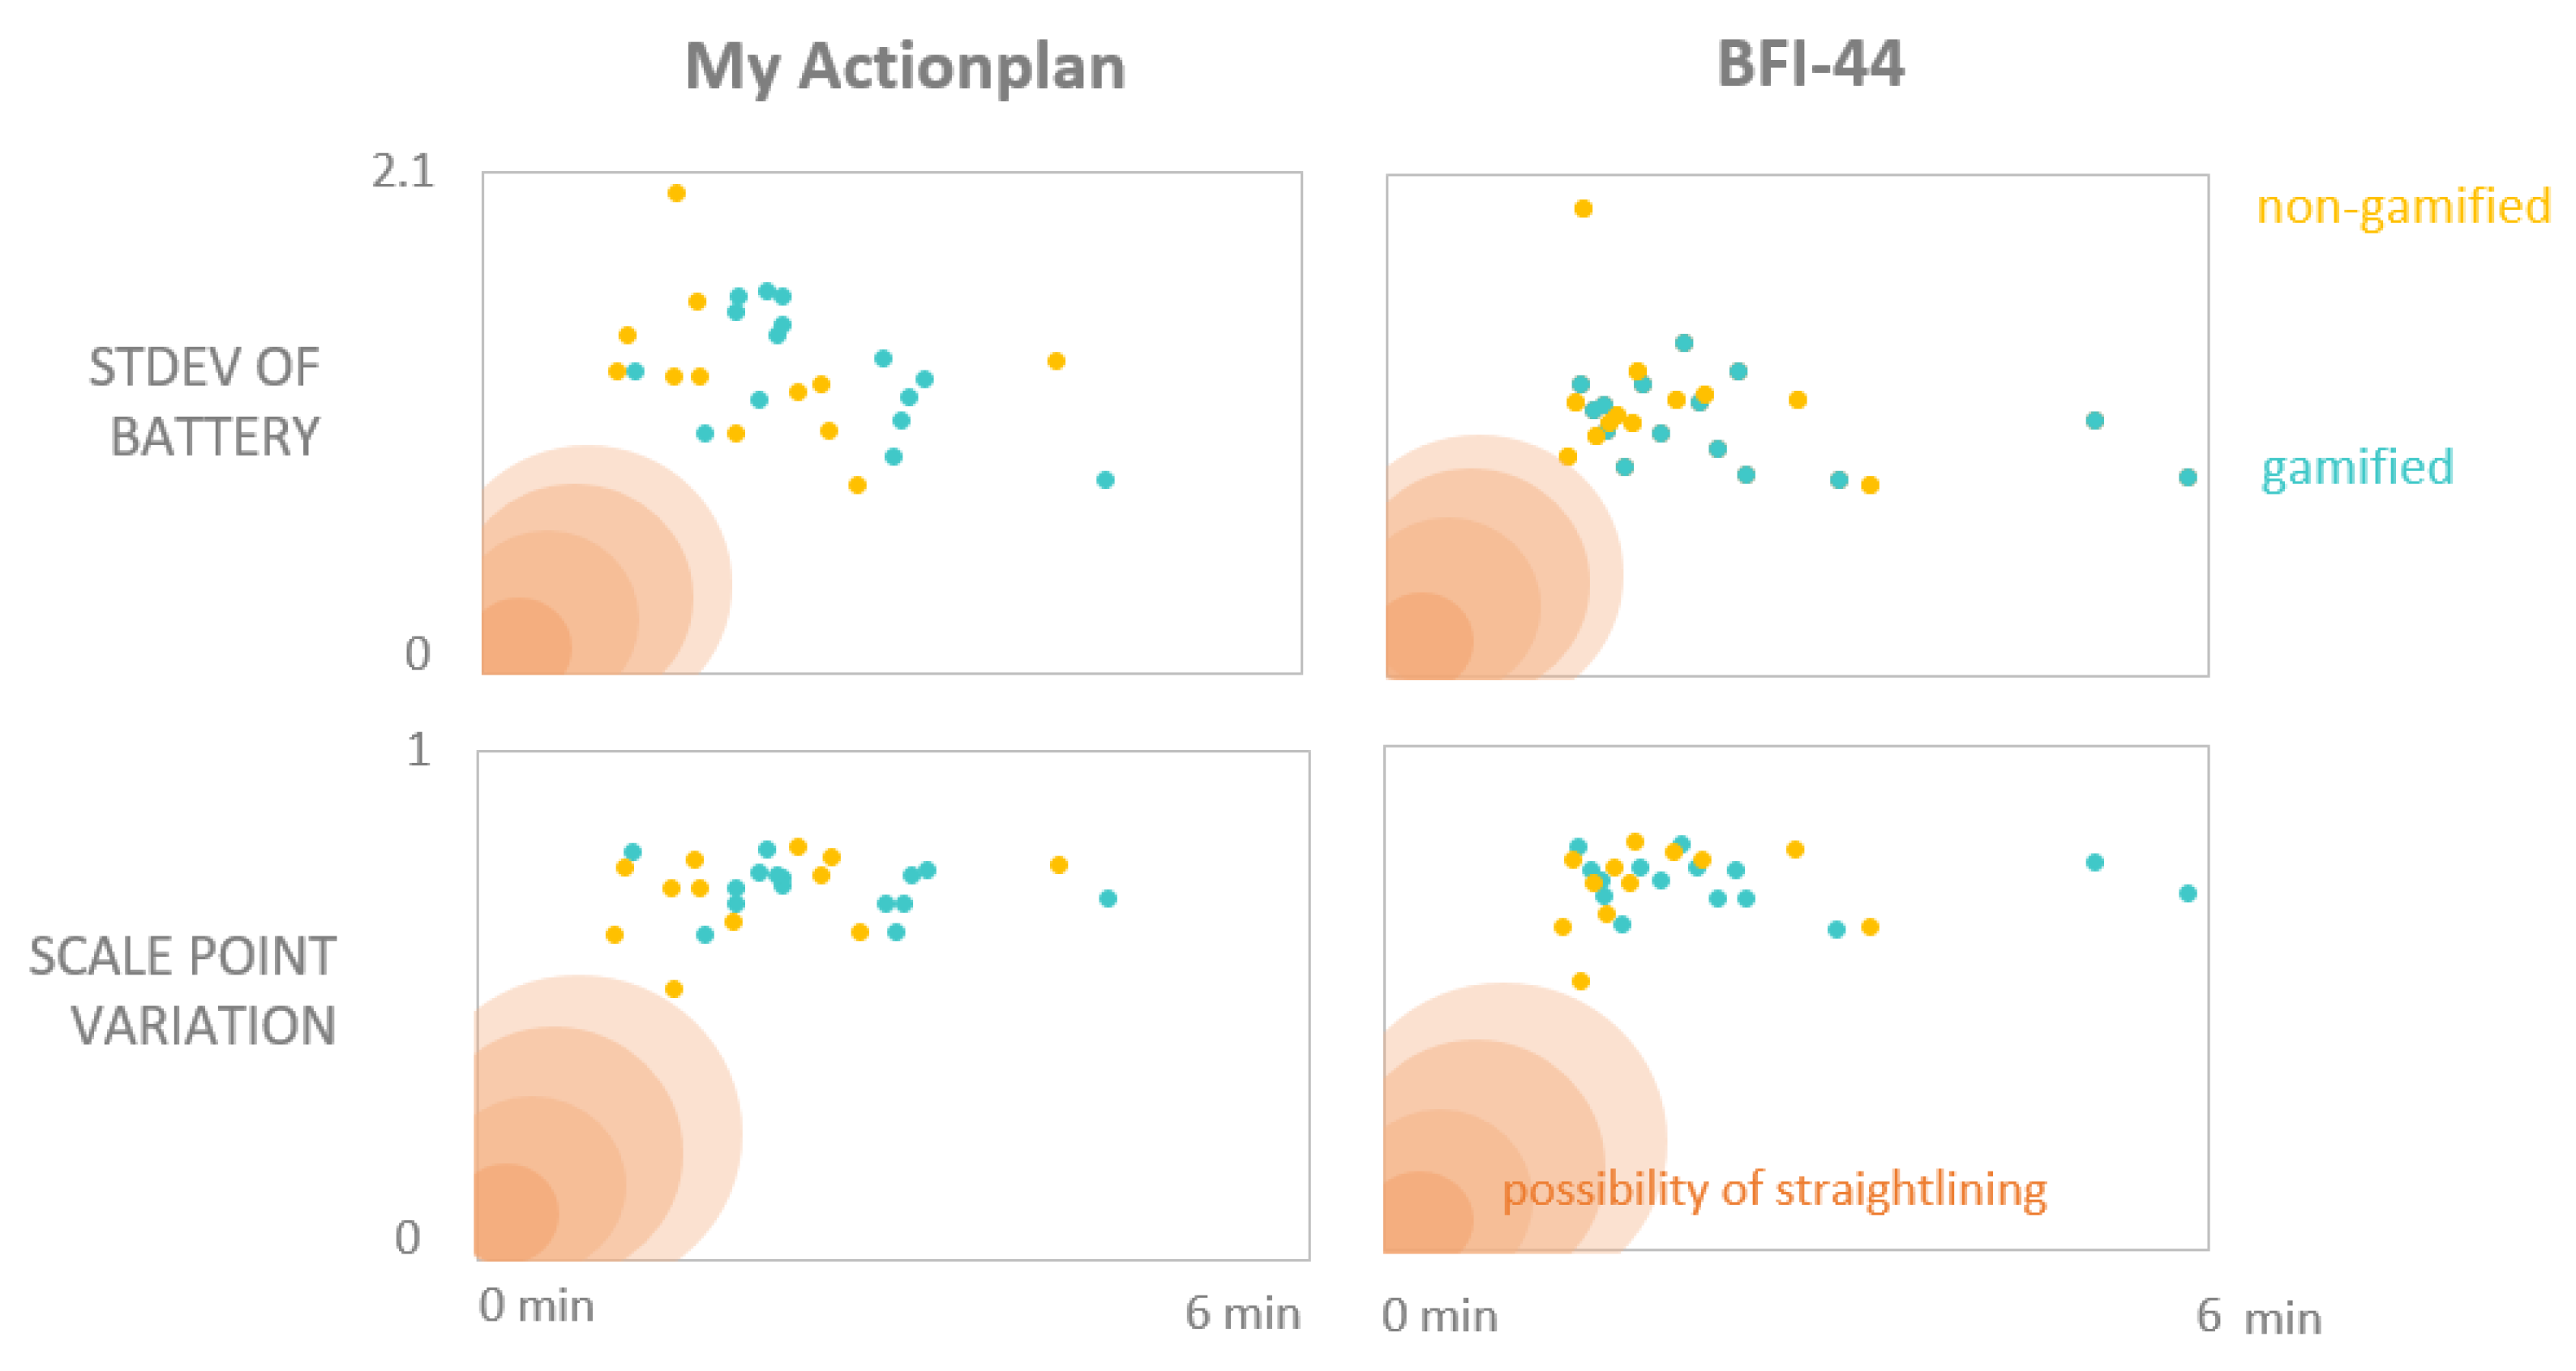
If the Standard Deviation of Battery and the Scale Point Variation are 0, no variation has been detected and the same answer has been chosen for the entire set of questions. The closer to zero and the lower the completion time, the higher the possibility of straight-lining. Figure 7 shows the results for the My Actionplan and BFI-44 surveys. There are no specific outliers visible that indicate straight-lining took place for both the gamified and non-gamified version.

Figure 7.
A suspiciously low completion time and a low variation in replies (Standard Deviation of Battery and Scale Point Variation close to zero) increase the possibility straight-lining occurred, which lowers data quality. For both versions of the application, no outliers are detected that could indicate participants have been straight-lining and the results of the two groups show no significant differences.
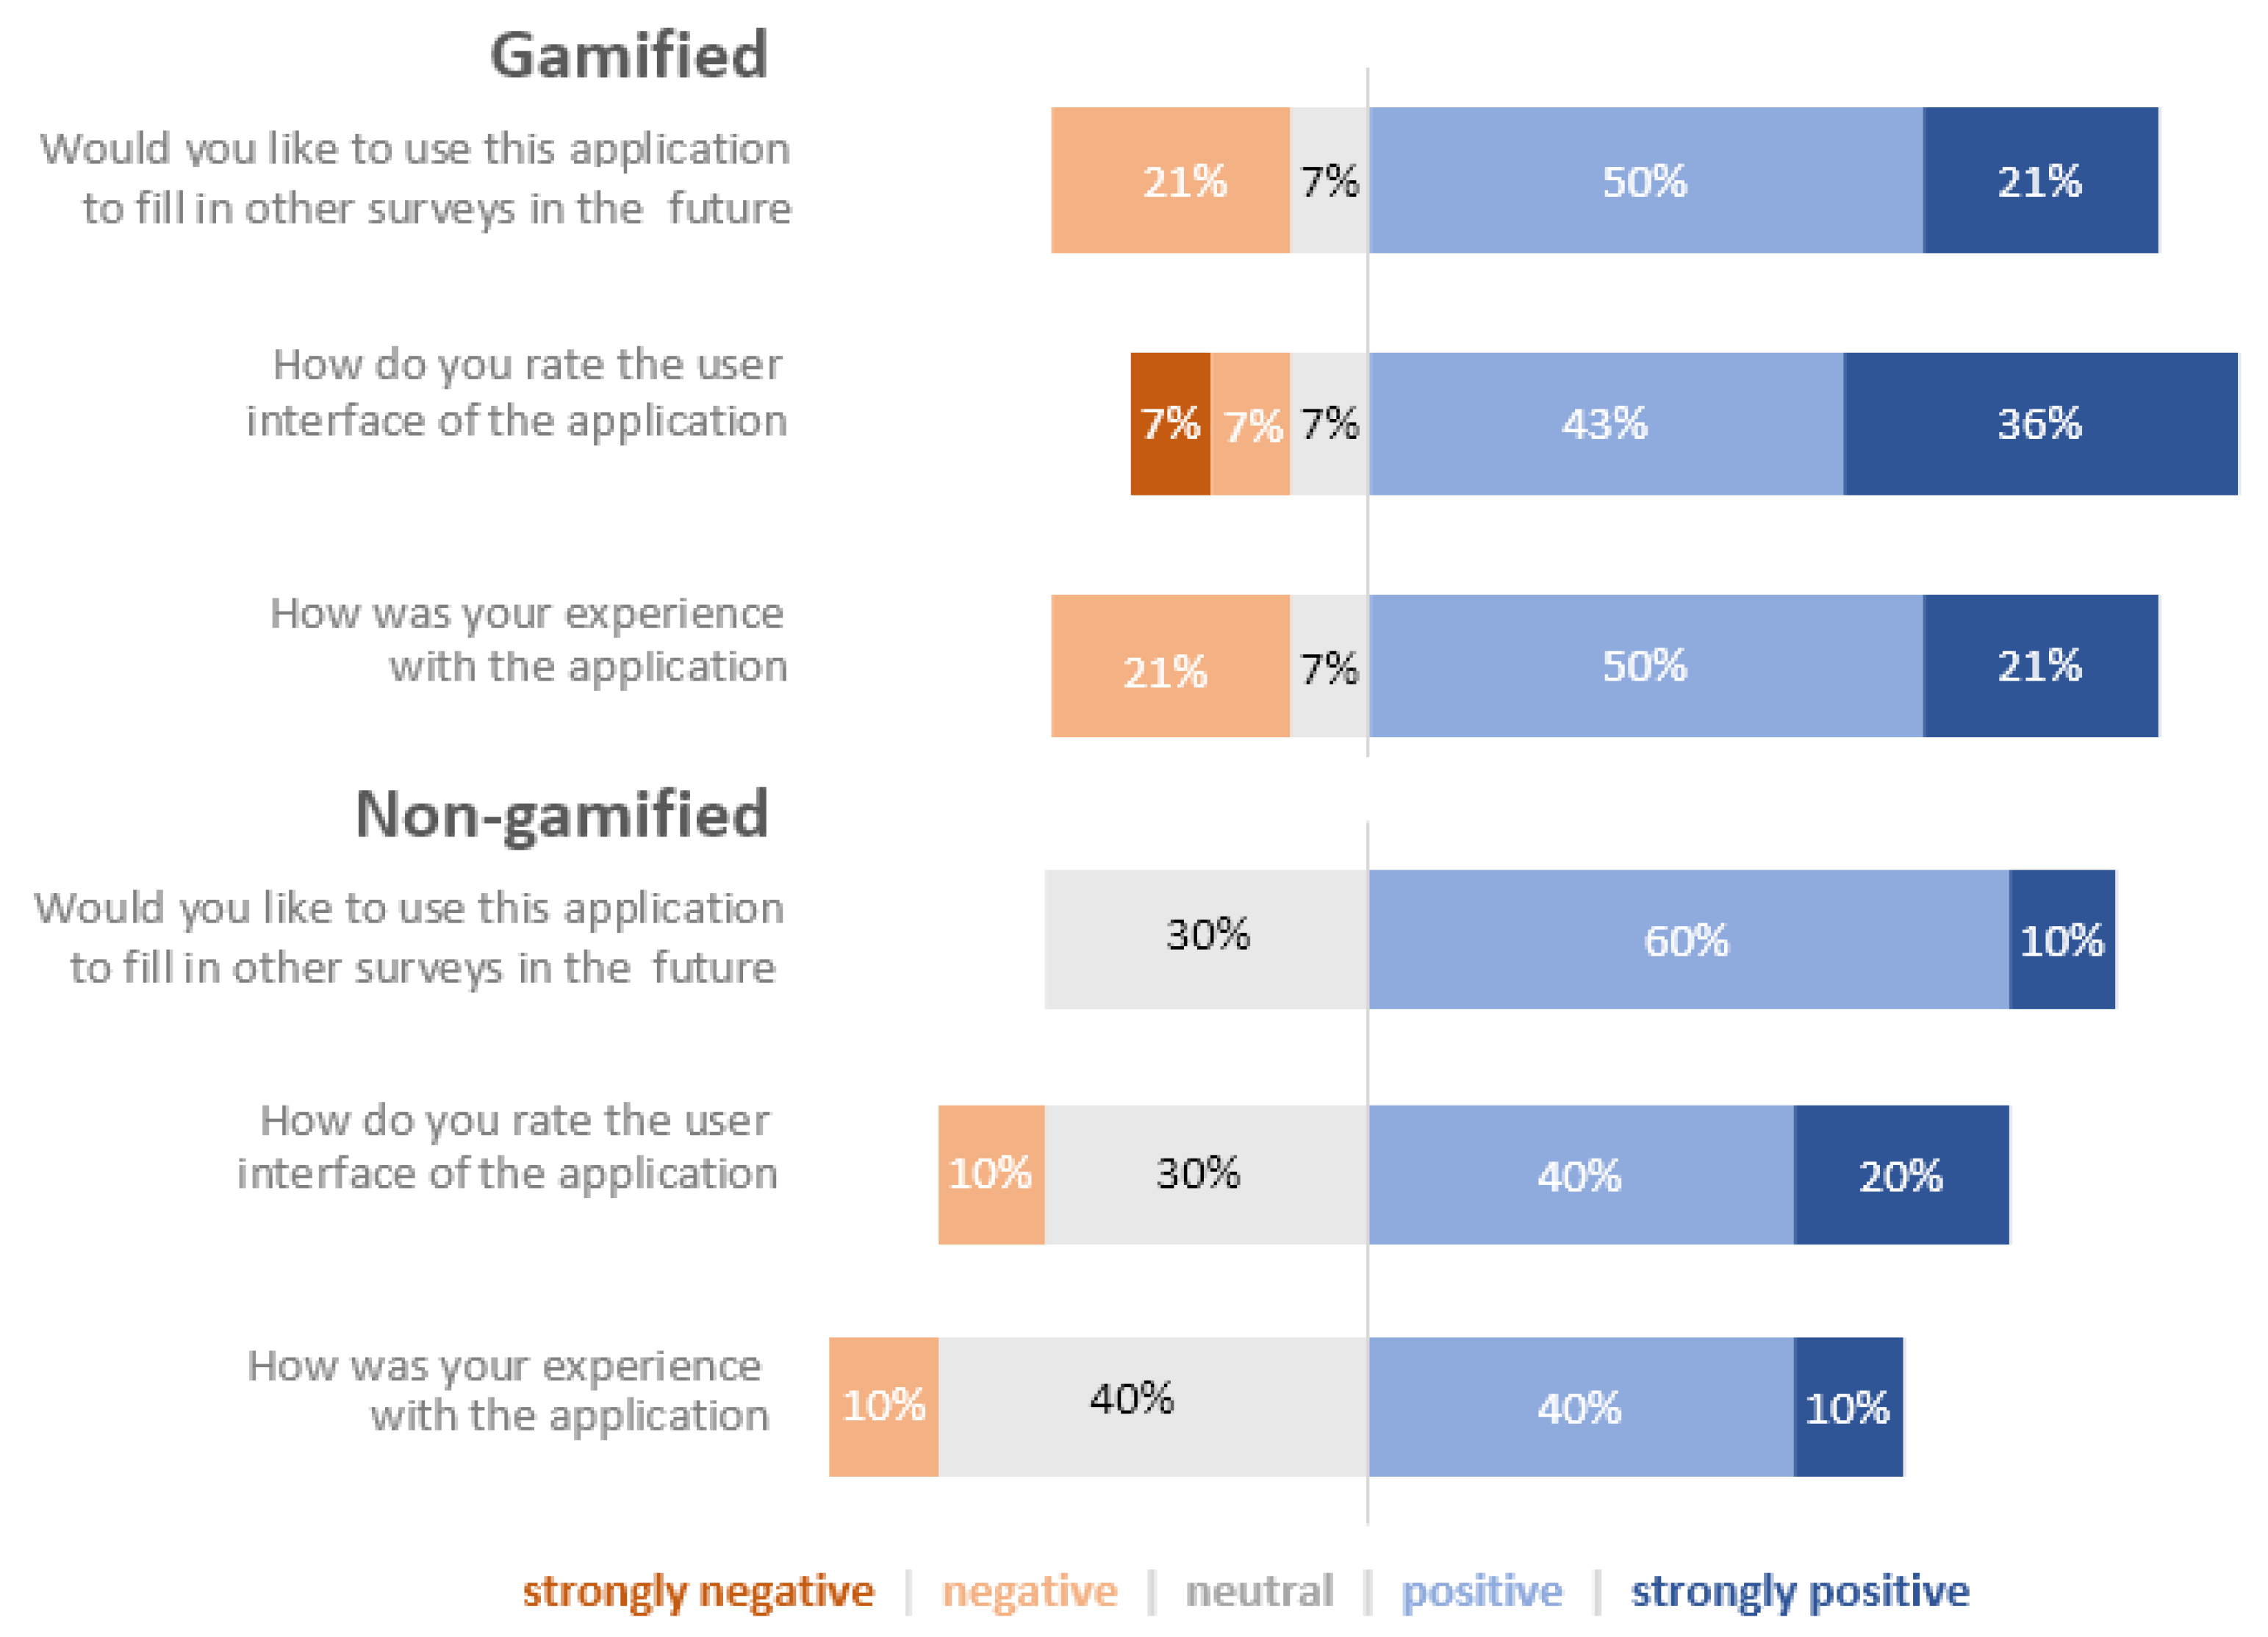
To conclude the survey, participants were asked to rate the application, using three questions on a 5-point Likert scale, as shown in Figure 8. These results indicate that, overall, a larger percentage of gamified users express to be more strongly positive than non-gamified users. However, they also seem more divided, as more negative replies are visible. These negative to strongly negative replies of the gamified users have been analysed per player type and these negative replies all stem from users with the philanthropist type. This can be explained by the lack of game elements for this player type. The only game element that is present for these users is the game element that gives them more information on the application and its purpose. More specifically, they are the only users to know their player type and see an explicit message that gamification is used, which understandably can lead to frustration as further in the app no gamification is used for them. To avoid this, philanthropists need to be offered a more all-round gamification experience, as is currently not the case.

Figure 8.
The results of the feedback Likert-scale questions indicate that, overall, a higher percentage of gamified users responded positively to the application, but are, nonetheless more divided as more negative ratings are present. The analysed results of the gamified group show that all the negative responses stem from users with the philanthropist player type, who voiced their frustration on the lack of gamification for their player type.
Lastly, 6 open feedback questions revealed the need to include elements such as a progress bar by default for all users to increase the user experience, instead of including it as a game element. Overall, the feedback of the non-gamified users was positive, indicating smoothness of use of the application, but, however, noting there were too many questions resulting in a tedious application. This again confirms the need to include other methods, such as gamification, in the design of surveys to increase the user experience. Additionally, most philanthropist participants of the gamified application shared this opinion. The other users of the gamified version indicated to appreciate game elements, such as the badges, Easter eggs or points, but that they require more fine tuning.
5.2. Technical Performance Evaluation Results
To evaluate the technical feasibility of using personalised gamification in a survey application, several system tests have been performed, which are listed below in this section.
The tests were performed using a Samsung Galaxy S8. This smartphone has a resolution of 2960 × 1440 pixels, 4GB RAM and a Samsung Exynos 8 Octa processor. The smartphone runs Android 9.0. The start-up time is the duration of the app to open for the first time after installation. The log-in time is measured when the user logs in and the loading time of the game-elements is the duration of the transition between the Hexad-questionnaire to the gamified survey.
The start-up time of the gamified application is on average 1.42 s and for the non-gamified on average 1.36 s, whereas an Android application is considered slow at 5 s [44]. In addition, log-in can be done in under 394 milliseconds and gamification elements are displayed in under 318 milliseconds. Furthermore, the application requires a maximum of 13.03 MB of memory to install, for both versions, far under the limit of 100 MB for apk files allowed by the Google Play Store [45]. In use, the app requires a maximum of 207.4 MB of RAM memory, again acceptable compared to the threshold of 512MB RAM since Android 7.0 [46].
In conclusion, the addition of gamification is no technical hindrance to the user experience.
6. Discussion
Two hypotheses were tested during a pilot study with 28 participants. The results of this study and the results of the system tests will be discussed in the following paragraph, followed by the limitations of this study.
6.1. Findings
For the first hypothesis, it was investigated if the user experience of participants of the gamified version would be higher than the experience of participants of the non-gamified application. First, the results of the system tests indicate that the addition of gamification is no hindrance to the technical feasibility of the application and does not influence the smoothness of the application. Next, 28 users participated in the pilot study, 16 users tested the gamified version and 12 the non-gamified version. Of these participants, 2 participants of the non-gamified version dropped out before completion, compared to 1 of the gamified version. Moreover, more participants of the gamified application estimated the survey’s duration to be shorter than it actually was. Furthermore, overall, a higher percentage of users of the gamified version rated the application positively, however, the philanthropist type was more negatively inclined as gamification was absent for them. Finally, only participants of the non-gamified application and participants of the philanthropist type reported the application to be too tedious. Overall, these results indicate that personalised gamification can be a method to increase the overall user experience when filling in a long survey. Nonetheless, the pool of participants did not represent the entire population as the socializer and disruptor were not present in the gamified group. More tests, with a larger audience, are needed to confirm these preliminary results can be generalised to a larger population.
For the second hypothesis, it was hypothesised that the inclusion of gamification would lead to increased data quality. As the application did not allow to skip questions, participants had to complete the survey or quit prematurely, as only 3 participants did (1 × gamified and 2 × non-gamified). Furthermore, the surveys consisted of a significant amount of Likert-scale questions, so a straight-lining analysis was performed as this can indicate the user started to rush through the questions without replying truthfully. For both versions, this analysis did not uncover any significant straight-lining behaviour or any difference between the two versions. Considering this study required participants to fill in a 30 min questionnaire only once, participants might have been on their best behaviour. To provoke such behaviour as straight-lining, a longer survey or periodically filling in the same survey, e.g., during a week, might be required. Nevertheless, more testing with a larger population and different set-up is necessary to research the influence of gamification on data quality. However, the preliminary results indicated that the gamified version leads to a higher user experience, which in turn positively influences data quality as users might be less likely to quit the survey before completion.
During this research it became clear that the translation of game elements to a survey context is no easy feat. The current system uses a basic set of game elements, including elements such as a progress bar, which can be considered necessary elements to increase the usability of the application opposed to game elements. Furthermore, 2 out of 6 player types were excluded as they require a far more established gamified system to be included. Future work will explore the possibilities of adding more explicit game elements, such as characters or background stories. This will increase the range of personalisation as more explicit gamification can become a hindrance for certain types of people, while it might motivate others to complete an otherwise lengthy and tedious survey.
Finally, in Section 2.4 it became clear that research on gamification in surveys is limited and focuses mostly on hard gamification that requires a complete redesign of the survey context, a labour-intensive process that needs to be repeated to fit the subject of the survey. We propose a reusable mobile survey application using soft gamification. Moreover, the system is capable of personalising the gamification to include only relevant game elements for the respondent, based on their result of the Hexad Player Type Framework survey.
6.2. Limitations
Although offering many contributions, this study has several limitations. First, the sample of the study is limited to 28 participants. Next, recruitment was restricted to Flemish participants from Belgium. Finally, the socializer and disruptor Player types were not represented in the gamified group. Future research should focus on validating these results in a larger and more comprehensive sample.
7. Conclusions
To evaluate if personalised gamification can increase the user experience and data quality of a survey, a mobile Android application using the Hexad Player Type Framework has been developed. During the pilot study, 28 participants used the gamified or non-gamified version of the application to complete a series of surveys.
The results of the study indicate that the overall user experience of the gamified application is slightly higher than that of the non-gamified version and more users of the gamified application perceived the duration of the survey as shorter than the actual duration, 35.7% versus 20% of respondents of the traditional survey. No significant difference in data quality has been detected, for both versions no straight-lining or speeding was detected. However, the traditional survey had two respondents drop out prematurely, compared to only one for the gamified survey. Nevertheless, the results indicate that a distinction has to be made between game elements and necessary elements for usability. The current translation of game elements remains minimal, reducing the gamified experience for certain player types. Future work should, therefore, focus on validating these results for a larger population and research the effects of a more explicit gamified experience in a survey context.
In conclusion, the study confirmed the need for motivational techniques to be included in the design of long surveys to increase user engagement. The obtained results indicate personalised gamification shows potential to solve this problem, but a larger set of game elements was shown to be necessary to accommodate for the broad spectrum of player types.
Author Contributions
Conceptualization, D.C., S.C. and F.D.B.; methodology, S.C.; software, D.C.; validation, S.C. and D.C.; formal analysis, S.C. and D.C.; investigation, D.C.; data curation, D.C.; writing—original draft preparation, S.C.; writing—review and editing, S.C., D.C., F.D.B. and F.D.T.; visualization, S.C.; supervision, F.D.T. All authors have read and agreed to the published version of the manuscript.
Funding
This research received no external funding.
Institutional Review Board Statement
Not applicable.
Informed Consent Statement
Not applicable.
Data Availability Statement
The data presented in this study are available on request from the corresponding author. The data are not publicly available due to privacy restrictions.
Conflicts of Interest
The authors declare no conflict of interest.
Abbreviations
The following abbreviations are used in this manuscript:
| BFI | Big Five Inventory |
| SPV | Scale Point Variation |
| IQR | interquartile range |
| stdev | standard deviation |
References
- Peiris, D.; Jaime Miranda, J.; Mohr, D.C. Going beyond killer apps: Building a better mHealth evidence base. BMJ Glob. Health 2018, 3, e000676. [Google Scholar] [CrossRef] [Green Version]
- Harteveld, C.; Snodgrass, S.; Mohaddesi, O.; Hart, J.; Corwin, T. The development of a methodology for gamifying surveys. In Proceedings of the 2018 Annual Symposium on Computer-Human Interaction in Play Companion Extended Abstracts, CHI PLAY 2018, Melbourne, Australia, 28–31 October 2018; pp. 461–467. [Google Scholar] [CrossRef]
- Guin, T.D.L.; Baker, R.; Mechling, J.; Ruyle, E. Myths and realities of respondent engagement in online surveys. Int. J. Mark. Res. 2012, 54, 613–633. [Google Scholar] [CrossRef] [Green Version]
- Ackehurst, M.; Polvere, R.A. Increasing Survey Engagement through Gamification and the Use of Mobile Devices; NCVER: Sydney, Australia, 2016; p. 14. [Google Scholar]
- Puleston, J. Game On!: A Look at How Gaming Techniques Can Transform Your Online Research. In Proceedings of the SIxth ASC International Conference: Shifting the Boundaries of Research, Bristol, UK, 22–23 September 2011. [Google Scholar]
- Kaminska, O.; McCutcheon, A.L.; Billiet, J. Satisficing among reluctant respondents in a cross-national context. Public Opin. Q. 2010, 74, 956–984. [Google Scholar] [CrossRef]
- Hallifax, S.; Serna, A.; Marty, J.; Lavoué, G.; Lavoué, E. Factors to consider for tailored gamification. In CHI PLAY 2019—Proceedings of the Annual Symposium on Computer-Human Interaction in Play; ACM: New York, NY, USA, 2019; pp. 559–572. [Google Scholar] [CrossRef] [Green Version]
- Tondello, G.F.; Mora, A.; Marczewski, A.; Nacke, L.E. Empirical validation of the Gamification User Types Hexad scale in English and Spanish. Int. J. Hum. Comput. Stud. 2019, 127, 95–111. [Google Scholar] [CrossRef]
- Duolingo. Duolingo: Leer Gratis Engels, Spaans en Meer Talen. Available online: https://www.duolingo.com/ (accessed on 18 September 2021).
- Strava. Strava|Hardloop- en Fietsactiviteiten Bijhouden op Het Sociale Netwerk Voor Sporters. Available online: https://www.strava.com/ (accessed on 18 September 2021).
- Alahäivälä, T.; Oinas-Kukkonen, H. Understanding persuasion contexts in health gamification: A systematic analysis of gamified health behavior change support systems literature. Int. J. Med. Inform. 2016, 96, 62–70. [Google Scholar] [CrossRef]
- Metwally, A.H.S.; Chang, M.; Wang, Y.; Yousef, A.M.F. Does gamifying homework influence performance and perceived gameful experience? Sustainability 2021, 13, 4829. [Google Scholar] [CrossRef]
- Kalogiannakis, M.; Papadakis, S.; Zourmpakis, A.I. Gamification in science education. A systematic review of the literature. Educ. Sci. 2021, 11, 22. [Google Scholar] [CrossRef]
- Dichev, C.; Dicheva, D. Gamifying education: What is known, what is believed and what remains uncertain: A critical review. Int. J. Educ. Technol. High. Educ. 2017, 14, 1–36. [Google Scholar] [CrossRef] [Green Version]
- Zainuddin, Z.; Chu, S.K.W.; Shujahat, M.; Perera, C.J. The impact of gamification on learning and instruction: A systematic review of empirical evidence. Educ. Res. Rev. 2020, 30, 100326. [Google Scholar] [CrossRef]
- Cheong, K.H.; Koh, J.M. Integrated virtual laboratory in engineering mathematics education: Fourier theory. IEEE Access 2018, 6, 58231–58243. [Google Scholar] [CrossRef]
- Cheong, K.H.; Koh, J.M.; Yeo, D.J.; Tan, Z.X.; Boo, B.O.E.; Lee, G.Y. Paradoxical Simulations to Enhance Education in Mathematics. IEEE Access 2019, 7, 17941–17950. [Google Scholar] [CrossRef]
- Sardi, L.; Idri, A.; Fernández-Alemán, J.L. A systematic review of gamification in e-Health. J. Biomed. Inform. 2017, 71, 31–48. [Google Scholar] [CrossRef]
- Cheng, V.W.S.; Davenport, T.; Johnson, D.; Vella, K.; Hickie, I.B. Gamification in apps and technologies for improving mental health and well-being: Systematic review. JMIR Mental Health 2019, 6, e13717. [Google Scholar] [CrossRef] [Green Version]
- Martinho, D.; Carneiro, J.; Corchado, J.M.; Marreiros, G. A systematic review of gamification techniques applied to elderly care. Artif. Intell. Rev. 2020, 53, 4863–4901. [Google Scholar] [CrossRef]
- Vermeir, J.F.; White, M.J.; Johnson, D.; Crombez, G.; van Ryckeghem, D.M. The effects of gamification on computerized cognitive training: Systematic review and meta-analysis. JMIR Serious Games 2020, 8, e18644. [Google Scholar] [CrossRef]
- Hervas, R.; Ruiz-Carrasco, D.; Bravo, J.; Mondejar, T. Gamification mechanics for behavioral change: A systematic review and proposed taxonomy. In ACM International Conference Proceeding Series; Association for Computing Machinery: New York, NY, USA, 2017; pp. 395–404. [Google Scholar] [CrossRef]
- Hamari, J.; Koivisto, J.; Sarsa, H. Does gamification work?—A literature review of empirical studies on gamification. In Proceedings of the Annual Hawaii International Conference on System Sciences, Waikoloa, HI, USA, 6–9 January 2014; pp. 3025–3034. [Google Scholar] [CrossRef]
- Harms, J.; Biegler, S.; Wimmer, C.; Kappel, K.; Grechenig, T. Gamification of online surveys: Design process, case study, and evaluation. In Lecture Notes in Computer Science (Including Subseries Lecture Notes in Artificial Intelligence and Lecture Notes in Bioinformatics); Springer: New York, NY, USA, 2015; Volume 9296, pp. 219–236. [Google Scholar] [CrossRef] [Green Version]
- Keusch, F.; Zhang, C. A Review of Issues in Gamified Surveys. Soc. Sci. Comput. Rev. 2017, 35, 147–166. [Google Scholar] [CrossRef]
- Mora, A.; Tondello, G.F.; Calvet, L.; González, C.; Arnedo-Moreno, J.; Nacke, L.E. The quest for a better tailoring of gameful design: An analysis of player type preferences. In ACM International Conference Proceeding Series; ACM: New York, NY, USA, 2019. [Google Scholar] [CrossRef]
- Tondello, G.F.; Wehbe, R.R.; Diamond, L.; Busch, M.; Marczewski, A.; Nacke, L.E. The gamification user types Hexad scale. In CHI PLAY 2016—Proceedings of the 2016 Annual Symposium on Computer-Human Interaction in Play; Association for Computing Machinery, Inc.: New York, NY, USA, 2016; pp. 229–243. [Google Scholar] [CrossRef] [Green Version]
- Marczewski, A. Even Ninja Monkeys Like to Play: Gamification, Game Thinking and Motivational Design; CreateSpace Independent Publishing Platform: Scotts Valley, CA, USA, 2015; pp. 65–80. [Google Scholar]
- Bailey, P.; Pritchard, G.; Kernohan, H. Gamification in market research: Increasing enjoyment, participant engagement and richness of data, but what of data validity? Int. J. Mark. Res. 2015, 57, 17–28. [Google Scholar] [CrossRef]
- StudyCrafter. StudyCrafter—A Sandbox for Curious Minds. Available online: https://studycrafter.com/ (accessed on 18 September 2021).
- Triantoro, T.; Gopal, R.; Benbunan-Fich, R.; Lang, G. Personality and games: Enhancing online surveys through gamification. Inf. Technol. Manag. 2020, 21, 169–178. [Google Scholar] [CrossRef]
- Cobb-Clark, D.A.; Schurer, S. The stability of big-five personality traits. Econ. Lett. 2012, 115, 11–15. [Google Scholar] [CrossRef] [Green Version]
- Developers, A. Meet Android Studio. 2020. Available online: https://developer.android.com/studio (accessed on 18 September 2021).
- Spring|Why Spring? Available online: https://spring.io/why-spring (accessed on 18 September 2021).
- PostgreSQL. The World’s Most Advanced Open Source Database; PostgreSQL: Tokyo, Japan, 2016; Available online: https://www.postgresql.org/ (accessed on 18 September 2021).
- Denissen, J.J.A.; Geenen, R.; van Aken, M.A.G.; Gosling, S.D.; Potter, J. Development and validation of a Dutch translation of the Big Five Inventory (BFI). J. Personal. Assess. 2008, 90, 152–157. [Google Scholar] [CrossRef] [PubMed]
- Schroé, H.; Van Der Mispel, C.; De Bourdeaudhuij, I.; Verloigne, M.; Poppe, L.; Crombez, G. A factorial randomised controlled trial to identify efficacious self-regulation techniques in an e- and m-health intervention to target an active lifestyle: Study protocol. Trials 2019, 20, 340. [Google Scholar] [CrossRef] [Green Version]
- Leven, G. Bewegingstest 18 Jaar of Ouder·Mijn Gezond Leven. Available online: https://mijn.gezondleven.be/bewegingstest (accessed on 18 September 2021).
- Mavletova, A. Web Surveys Among Children and Adolescents: Is There a Gamification Effect? Soc. Sci. Comput. Rev. 2015, 33, 372–398. [Google Scholar] [CrossRef] [Green Version]
- Schober, M.F.; Conrad, F.G.; Antoun, C.; Ehlen, P.; Fail, S.; Hupp, A.L.; Johnston, M.; Vickers, L.; Yan, H.Y.; Zhang, C. Precision and disclosure in text and voice interviews on smartphones. PLoS ONE 2015, 10, e0128337. [Google Scholar] [CrossRef] [PubMed] [Green Version]
- Zhang, C.; Conrad, F.G. Speeding in web surveys: The tendency to answer very fast and its association with straightlining. Surv. Res. Methods 2014, 8, 127–135. [Google Scholar] [CrossRef]
- Meade, A.W.; Craig, S.B. Identifying careless responses in survey data. Psychol. Methods 2012, 17, 437–455. [Google Scholar] [CrossRef] [Green Version]
- Kim, Y.; Dykema, J.; Stevenson, J.; Black, P.; Moberg, D.P. Straightlining: Overview of Measurement, Comparison of Indicators, and Effects in Mail-Web Mixed-Mode Surveys. Soc. Sci. Comput. Rev. 2019, 37, 214–233. [Google Scholar] [CrossRef]
- Android. App Startup Time|Android Developers. 2020. Available online: https://developer.android.com/topic/performance/vitals/launch-time (accessed on 18 September 2021).
- Android. APK Expansion Files—Android Developers. 2015. Available online: https://developer.android.com/google/play/expansion-files (accessed on 18 September 2021).
- Android Compatibility Definition Document. Available online: https://source.android.com/compatibility/cdd (accessed on 18 September 2021).
Publisher’s Note: MDPI stays neutral with regard to jurisdictional claims in published maps and institutional affiliations. |
© 2021 by the authors. Licensee MDPI, Basel, Switzerland. This article is an open access article distributed under the terms and conditions of the Creative Commons Attribution (CC BY) license (https://creativecommons.org/licenses/by/4.0/).