
Analysis of Water Quality Characteristics in Unit Watersheds in the Hangang Basin with Respect to TMDL Implementation

Abstract
:1. Introduction
2. Data and Methods
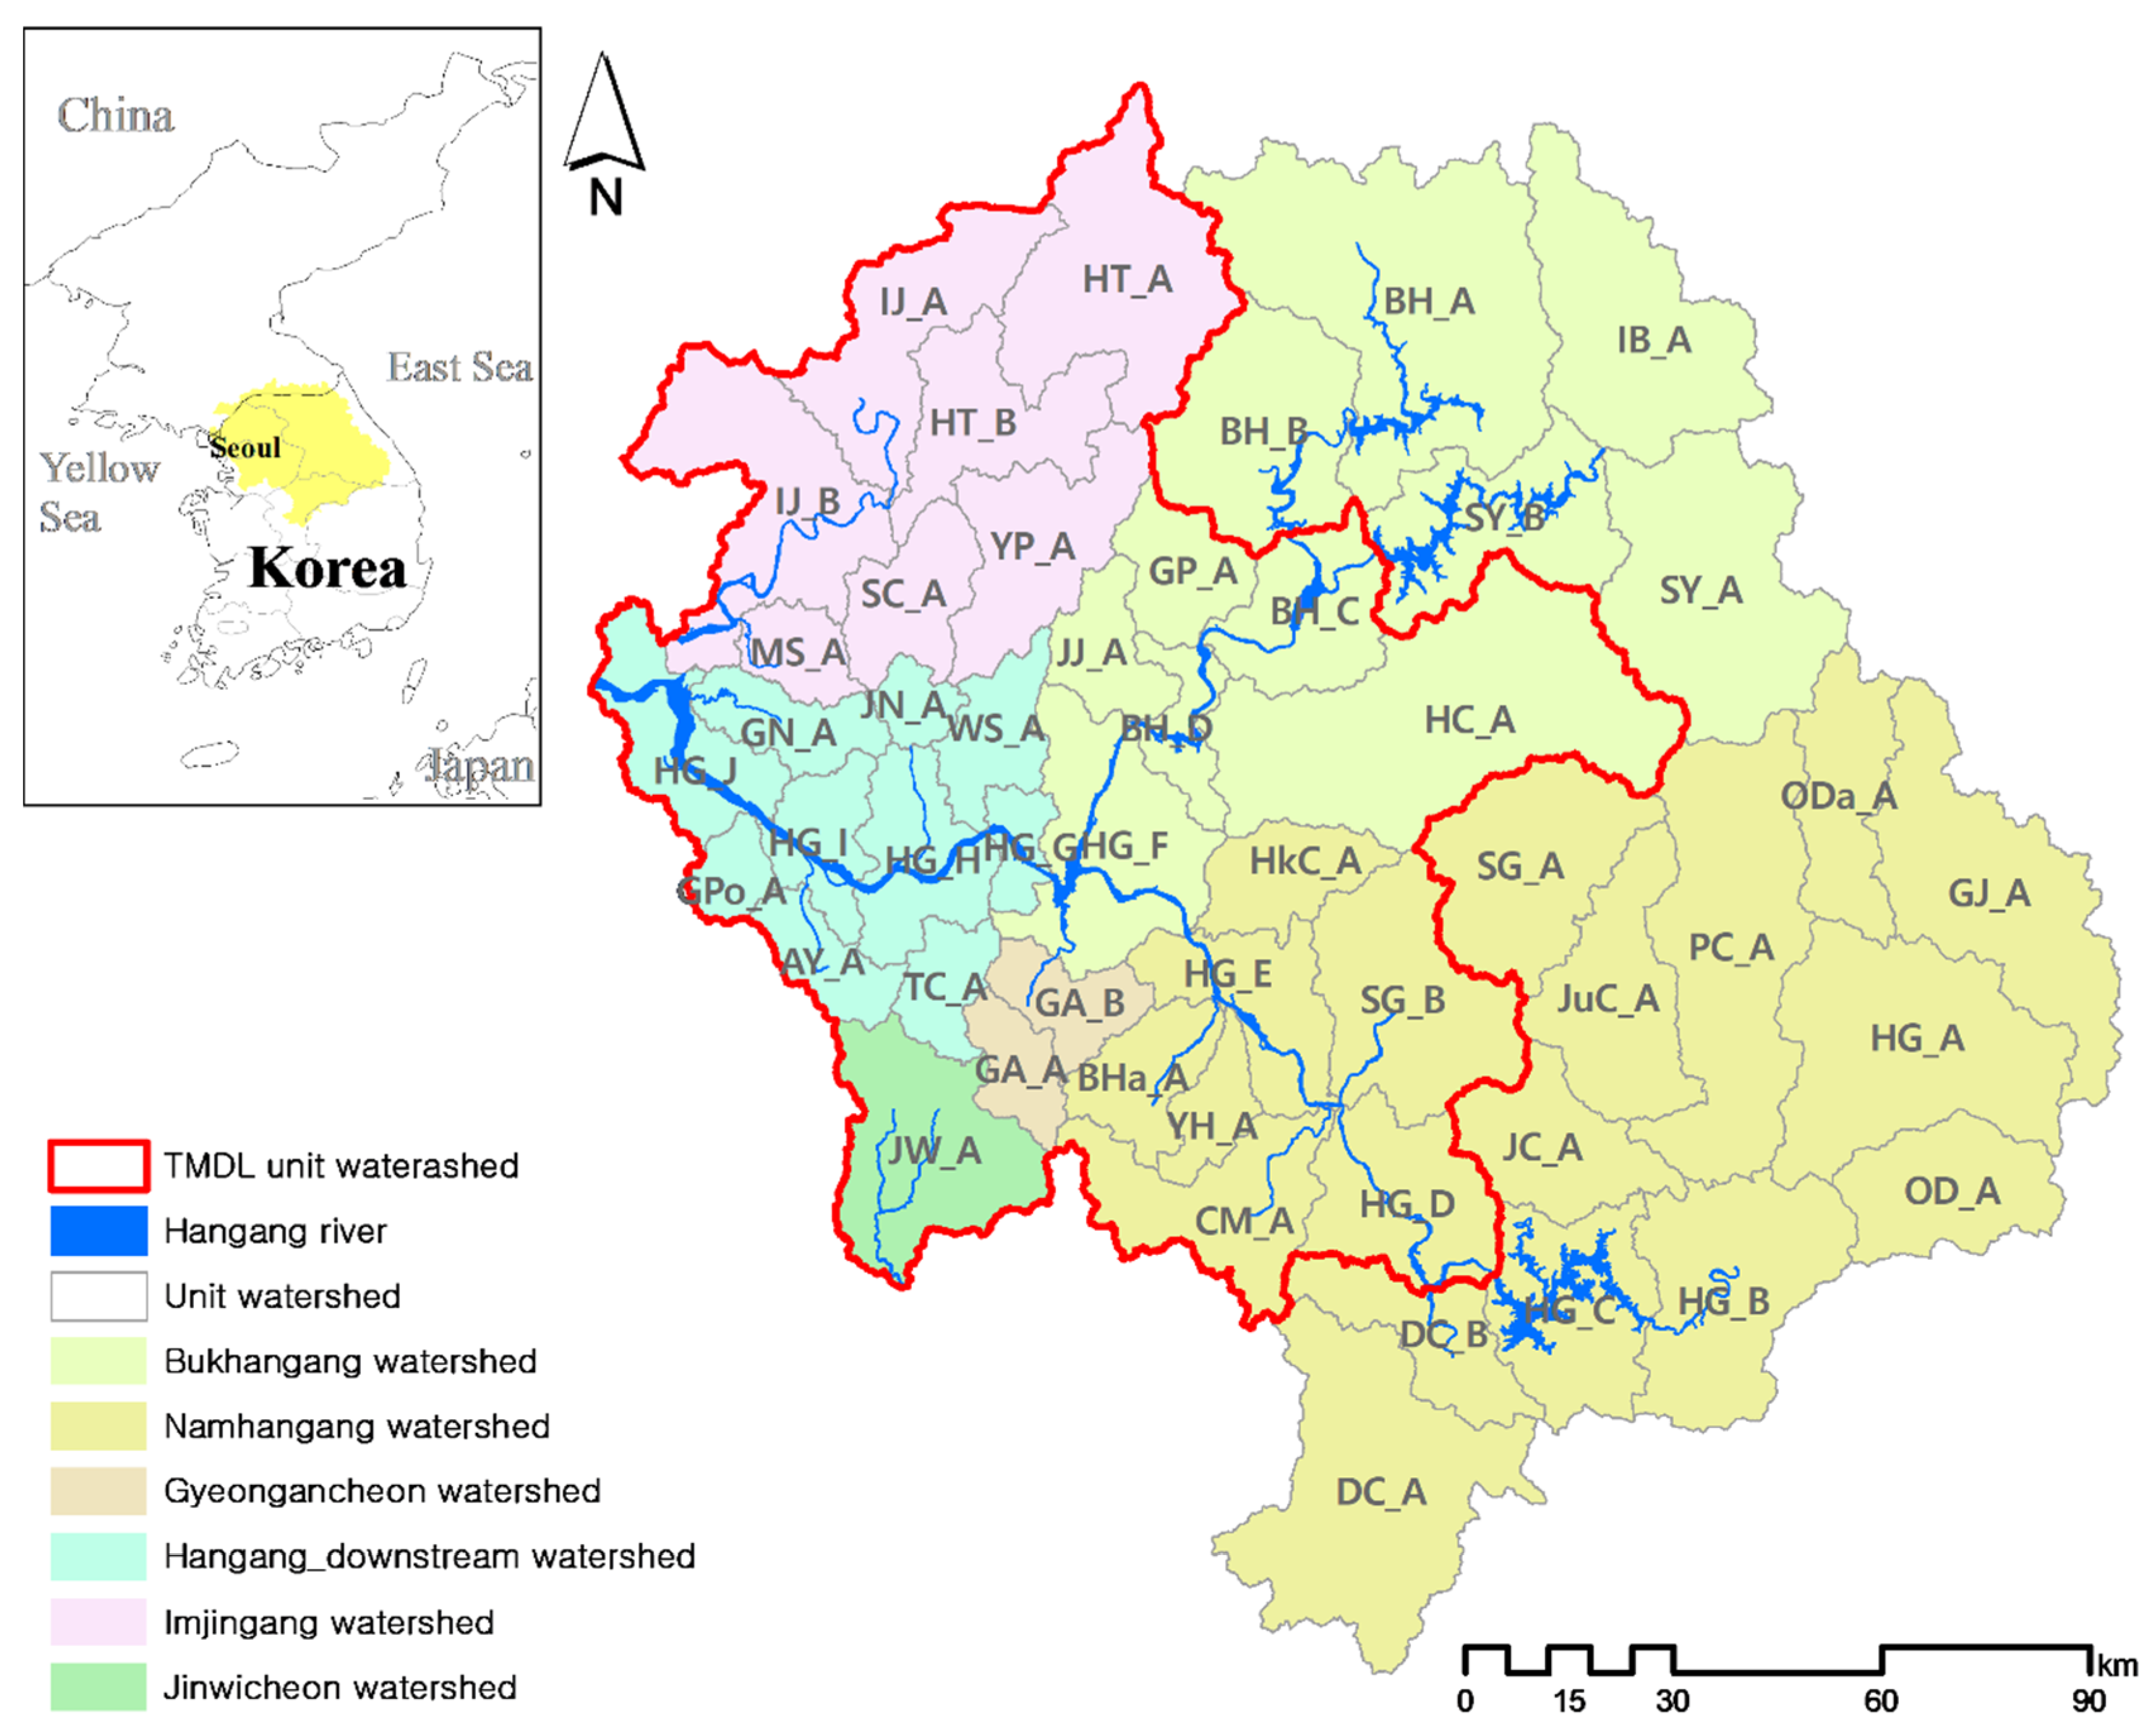
2.1. Study Area
2.2. Statistical Analysis
2.3. Water Quality Data
3. Results and Discussion
3.1. Water Quality in Each Unit Watershed
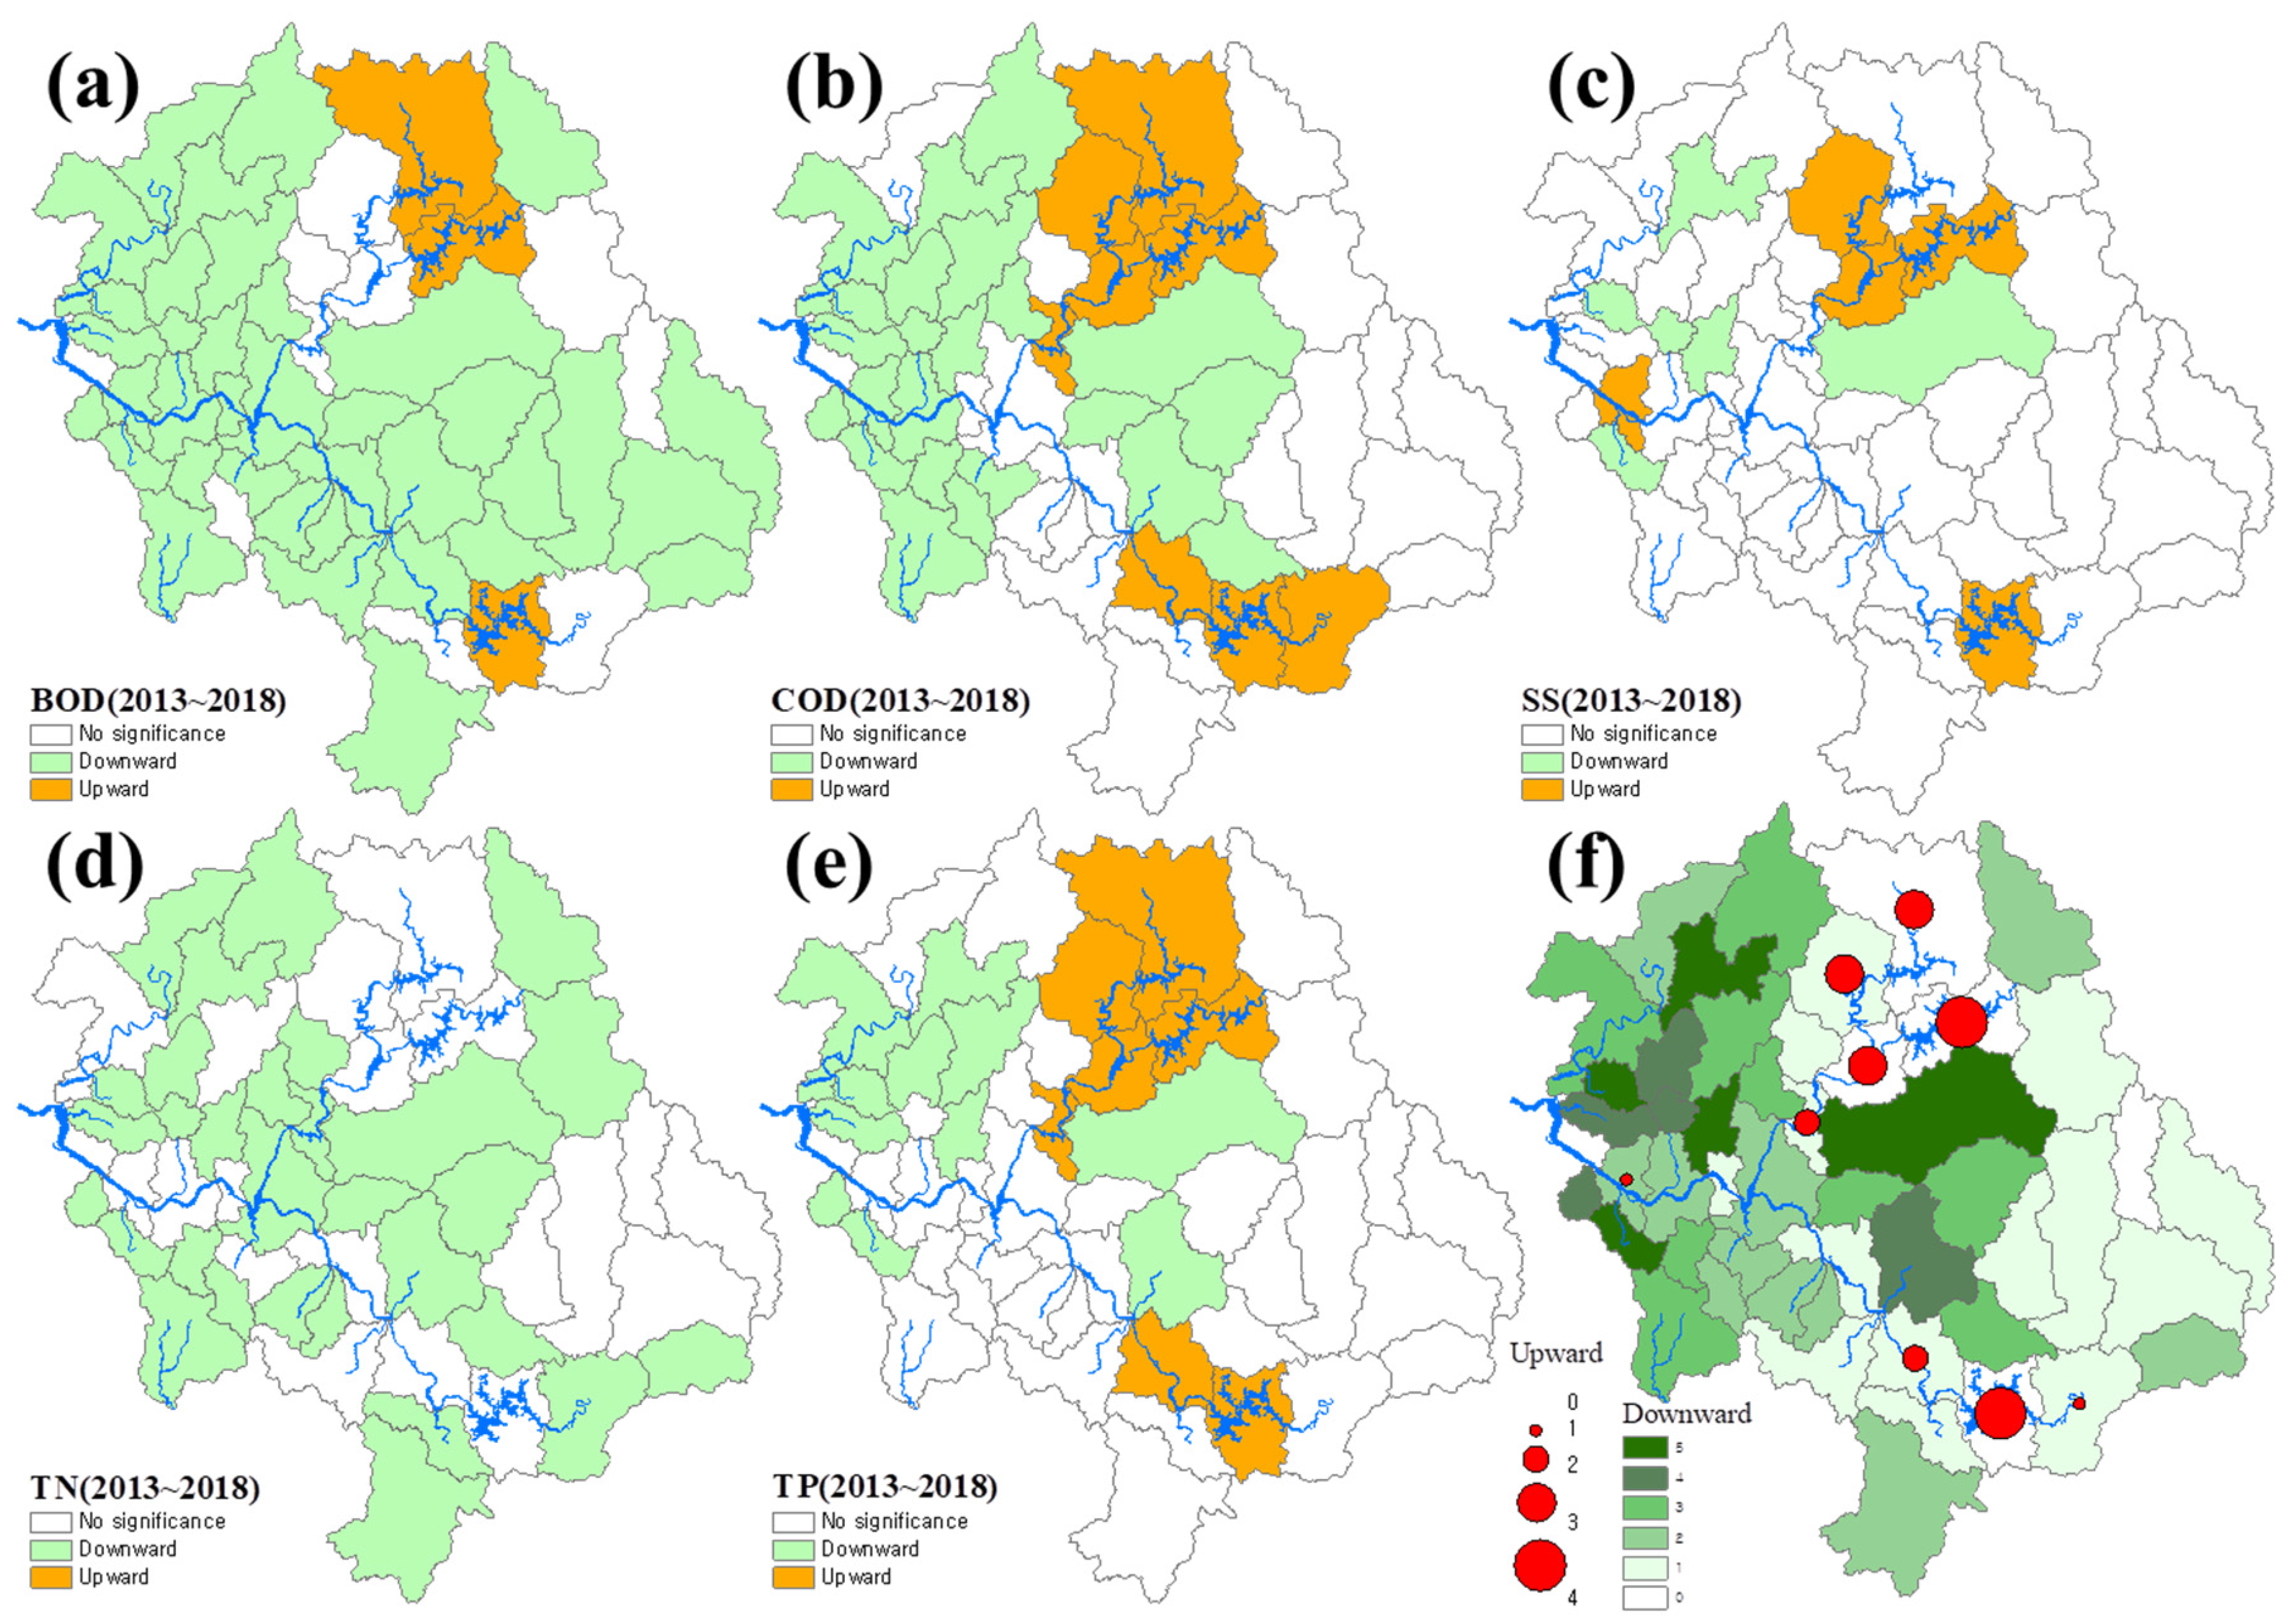
3.2. Tendency Analysis Results
3.3. Periodicity Analysis Results
4. Conclusions
Author Contributions
Funding
Institutional Review Board Statement
Informed Consent Statement
Data Availability Statement
Conflicts of Interest
Appendix A

| Name | 2008~2018 | 2013~2018 | ||||||||||
|---|---|---|---|---|---|---|---|---|---|---|---|---|
| n | BOD | COD | TN | TP | SS | n | BOD | COD | TN | TP | SS | |
| GP_A | 468 | −0.226 * | −0.013 | −0.39 * | −0.097 | −0.153 * | 240 | −0.131 | 0.031 | −0.37 * | −0.024 | −0.146 |
| GA_A | 487 | −0.178 * | −0.254 * | −0.249 * | −0.171 * | −0.037 | 243 | −0.107 | −0.176 * | −0.224 * | −0.156 | −0.017 |
| GA_B | 536 | −0.261 * | −0.289 * | −0.206 * | −0.169 * | 0.038 | 291 | −0.21 * | −0.204 * | −0.153 | −0.152 | 0.037 |
| GJ_A | 469 | −0.1 | 0.106 | −0.049 | 0.097 | 0.048 | 240 | −0.209 * | 0.089 | −0.03 | 0.132 | 0.054 |
| GN_A | 467 | −0.289 * | −0.282 * | −0.264 * | −0.319 * | −0.033 | 239 | −0.165 * | −0.171 * | −0.207 * | −0.297 * | 0.024 |
| GPo_A | 467 | −0.257 * | −0.301 * | −0.255 * | −0.153 * | −0.132 * | 239 | −0.166 * | −0.282 * | −0.216 * | −0.177 * | 0.071 |
| DC_A | 468 | −0.294 * | 0.008 | −0.236 * | 0.06 | −0.003 | 239 | −0.275 * | 0.063 | −0.259 * | 0.078 | 0 |
| DC_B | 466 | −0.1 | −0.052 | −0.247 * | −0.034 | −0.004 | 237 | −0.026 | 0.044 | −0.257 * | 0.077 | 0.027 |
| MS_A | 470 | −0.34 * | −0.427 * | −0.247 * | −0.311 * | −0.355 * | 240 | −0.251 * | −0.353 * | −0.213 * | −0.229 * | −0.214 * |
| BHa_A | 468 | −0.262 * | −0.199 * | −0.191 * | −0.127 * | −0.163 * | 239 | −0.182 * | −0.156 | −0.203 * | −0.048 | −0.113 |
| BH_A | 469 | 0.12 * | 0.251 * | 0.109 | 0.186 * | 0.137 * | 240 | 0.169 * | 0.377 * | 0.053 | 0.232 * | 0.053 |
| BH_B | 468 | −0.122 * | 0.173 * | 0.029 | 0.216 * | 0.21 * | 239 | −0.009 | 0.303 * | −0.066 | 0.215 * | 0.239 * |
| BH_C | 465 | −0.06 | 0.215 * | 0.144 * | 0.096 | 0.181 * | 237 | 0.076 | 0.399 * | 0.064 | 0.288 * | 0.204 * |
| BH_D | 467 | −0.172 * | 0.085 | −0.07 | 0.038 | 0.066 | 239 | −0.038 | 0.257 * | −0.17 * | 0.215 * | 0.127 |
| SG_A | 467 | −0.344 * | −0.282 * | −0.206 * | −0.087 | −0.064 | 239 | −0.321 * | −0.313 * | −0.181 * | −0.093 | −0.07 |
| SG_B | 542 | −0.394 * | −0.36 * | −0.255 * | −0.223 * | −0.111 | 304 | −0.386 * | −0.331 * | −0.208 * | −0.327 * | −0.112 |
| SY_A | 469 | −0.161 * | 0.079 | −0.228 * | 0.024 | −0.031 | 240 | −0.16 | 0.041 | −0.199 * | 0.046 | 0.024 |
| SY_B | 542 | 0.14 * | 0.266 * | 0.191 * | 0.309 * | 0.301 * | 304 | 0.204 * | 0.267 * | 0.083 | 0.336 * | 0.293 * |
| SC_A | 467 | −0.29 * | −0.342 * | −0.296 * | −0.209 * | −0.056 | 239 | −0.312 * | −0.347 * | −0.277 * | −0.29 * | −0.094 |
| AY_A | 467 | −0.315 * | −0.436 * | −0.358 * | −0.14 * | −0.167 * | 239 | −0.329 * | −0.533 * | −0.364 * | −0.299 * | −0.255 * |
| YH_A | 468 | −0.258 * | −0.112 | −0.139 * | −0.117 * | −0.063 | 239 | −0.249 * | −0.088 | −0.164 * | −0.018 | −0.047 |
| YP_A | 468 | −0.342 * | −0.355 * | −0.146 * | −0.3 * | −0.168 * | 239 | −0.298 * | −0.31 * | −0.072 | −0.317 * | −0.146 |
| ODa_A | 469 | −0.059 | 0.068 | 0.055 | 0.004 | −0.022 | 240 | −0.11 | 0.051 | 0.074 | 0.103 | 0.065 |
| OD_A | 468 | −0.207 * | 0.032 | −0.267 * | −0.169 * | −0.046 | 239 | −0.19 * | 0.006 | −0.174 * | −0.142 | −0.024 |
| WS_A | 467 | −0.227 * | −0.348 * | −0.313 * | −0.137 * | −0.112 | 239 | −0.329 * | −0.425 * | −0.29 * | −0.271 * | −0.172 * |
| IB_A | 469 | −0.262 * | −0.036 | −0.39 * | −0.126 * | −0.068 | 240 | −0.284 * | −0.06 | −0.432 * | −0.077 | −0.042 |
| IJ_A | 462 | −0.273 * | −0.127 * | −0.206 * | −0.045 | −0.05 | 233 | −0.347 * | −0.154 | −0.21 * | −0.081 | −0.079 |
| IJ_B | 455 | −0.261 * | −0.309 * | −0.161 * | −0.215 * | 0.003 | 232 | −0.308 * | −0.404 * | −0.151 | −0.175 * | −0.042 |
| JC_A | 470 | −0.328 * | −0.286 * | −0.212 * | −0.21 * | −0.071 | 241 | −0.391 * | −0.28 * | −0.243 * | −0.114 | −0.07 |
| JJ_A | 468 | −0.278 * | −0.187 * | −0.261 * | −0.052 | −0.039 | 240 | −0.263 * | −0.173 * | −0.169 * | 0.032 | −0.015 |
| JuC_A | 469 | −0.239 * | −0.045 | −0.081 | 0.018 | −0.039 | 240 | −0.306 * | −0.086 | −0.042 | 0.042 | −0.05 |
| JN_A | 467 | −0.317 * | −0.417 * | −0.201 * | −0.07 | −0.135 * | 239 | −0.397 * | −0.488 * | −0.167 * | −0.05 | −0.188 * |
| JW_A | 259 | −0.372 * | −0.316 * | −0.277 * | −0.178 * | −0.027 | 235 | −0.386 * | −0.352 * | −0.278 * | −0.155 | −0.034 |
| CM_A | 461 | −0.253 * | −0.112 | −0.128 * | −0.037 | 0.013 | 233 | −0.199 * | −0.065 | −0.118 | 0.029 | 0.016 |
| TC_A | 467 | −0.166 * | −0.235 * | −0.341 * | −0.085 | −0.037 | 239 | −0.2 * | −0.278 * | −0.34 * | −0.113 | −0.083 |
| PC_A | 468 | −0.286 * | −0.087 | −0.107 | −0.021 | −0.048 | 239 | −0.284 * | −0.086 | −0.059 | −0.022 | −0.037 |
| HG_A | 469 | −0.258 * | 0.005 | −0.061 | 0.027 | −0.017 | 240 | −0.283 * | 0.005 | −0.013 | 0.108 | 0.025 |
| HG_B | 468 | −0.015 | 0.263 * | −0.379 * | −0.046 | −0.113 | 239 | 0.021 | 0.307 * | −0.349 * | 0.025 | −0.046 |
| HG_C | 469 | 0.084 | 0.159 * | 0.059 | 0.286 * | 0.284 * | 240 | 0.209 * | 0.162 * | 0.1 | 0.319 * | 0.267 * |
| HG_D | 468 | −0.368 * | 0.07 | −0.039 | 0.128 * | 0.005 | 239 | −0.307 * | 0.192 * | −0.028 | 0.195 * | −0.044 |
| HG_E | 531 | −0.308 * | −0.095 | −0.101 | −0.004 | −0.115 | 294 | −0.224 * | −0.045 | −0.095 | 0.051 | −0.112 |
| HG_F | 468 | −0.44 * | −0.111 | −0.152 * | 0.029 | −0.065 | 240 | −0.415 * | 0.03 | −0.203 * | 0.094 | −0.012 |
| HG_G | 466 | −0.288 * | −0.058 | −0.09 | 0.027 | −0.008 | 238 | −0.197 * | 0.06 | −0.084 | 0.081 | 0.08 |
| HG_H | 540 | −0.388 * | −0.309 * | −0.132 * | −0.083 | −0.036 | 304 | −0.396 * | −0.24 * | −0.083 | −0.062 | 0.105 |
| HG_I | 467 | −0.362 * | −0.391 * | −0.092 | −0.048 | 0.044 | 239 | −0.267 * | −0.316 * | −0.005 | 0.004 | 0.159 * |
| HT_A | 467 | −0.33 * | −0.254 * | −0.243 * | −0.179 * | −0.102 | 238 | −0.386 * | −0.276 * | −0.186 * | −0.155 | −0.121 |
| HT_B | 466 | −0.403 * | −0.378 * | −0.269 * | −0.289 * | −0.215 * | 237 | −0.396 * | −0.378 * | −0.213 * | −0.326 * | −0.185 * |
| HC_A | 455 | −0.451 * | −0.33 * | −0.3 * | −0.161 * | −0.218 * | 235 | −0.475 * | −0.317 * | −0.207 * | −0.205 * | −0.303 * |
| HkC_A | 468 | −0.342 * | −0.193 * | −0.302 * | −0.087 | 0.023 | 239 | −0.354 * | −0.17 * | −0.235 * | −0.074 | 0.014 |
References
- Kang, M.S.; Park, S.W.; Lee, J.J.; Yoo, K.H. Applying SWAboxT for TMDL programs to a small watershed containing rice paddy fields. Agric. Water Manag. 2006, 79, 72–92. [Google Scholar] [CrossRef]
- Kim, D.Y.; Yoon, C.G.; Rhee, H.P.; Choi, J.H.; Hwang, H.S. Estimation of Pollution Contribution TMDL Unit Watershed in Han-River according to hydrological characteristic using Flow Duration Curve. J. Korean Soc. Water Environ. 2019, 35, 497–509. [Google Scholar]
- Choi, O.; Kim, H.; Seo, H.; Han, I. Analysis of Water Quality changes & Characterization at the Watershed in Han River Basin for Target indicator in TMDLs. J. Korean Soc. Water Environ. 2017, 33, 15–33. [Google Scholar]
- Total Pollution Load Management System. Available online: http://tmdlms.nier.go.kr/Main.do (accessed on 11 June 2021).
- National Institute of Environmental Research (NIER). Study on Application Method of Watershed Model for Total Water Pollutant Load Management System (TPLMS); National Institute of Environmental Research: Incheon, Korea, 2010.
- Lee, S.; Rhee, H.; Park, J.; Kim, Y.; Hwang, H. A Study on Verification of Delivery Ratio Methodology for Basic Plan at TPLMs. J. Korean Soc. Environ. Eng. 2017, 39, 714–722. [Google Scholar] [CrossRef]
- Birsan, M.V.; Molnar, P.; Burlando, P.; Pfaundler, M. Streamflow trends in Switzerland. J. Hydrol. 2005, 314, 312–329. [Google Scholar] [CrossRef]
- Karpouzos, D.K.; Kavalieratou, S.; Babajimopoulos, C. Trend Analysis of Precipitation Data in Pieria Region (Greece). Eur. Water 2010, 30, 31–40. [Google Scholar]
- Kauffman, J.G.; Homsey, R.A.; Belden, C.A.; Sanchez, R.J. Water Quality Trends in the Delware River Basin (USA) from 1980 to 2005. Environ. Monit. Assess. 2011, 177, 193–225. [Google Scholar] [CrossRef] [PubMed]
- Yenilmez, F.; Keskin, F.; Aksoy, A. Water quality trend analysis in Eymir Lake, Ankara. Phys. Chem. Earth 2011, 36, 135–140. [Google Scholar] [CrossRef]
- Kim, M.-A.; Lee, S.; Mun, H.; Cho, H.-S.; Lee, J.-K.; Kim, K. A Nonparametric Trend Tests Using TMDL Data in the Nakdong River. J. Korean Soc. Water Environ. 2017, 33, 40–50. [Google Scholar]
- Chang, H. Spatial analysis of water quality trends in the Han River basin, South Korea. Water Res. 2008, 42, 3285–3304. [Google Scholar] [CrossRef] [PubMed]
- Kim, H.S.; Park, Y.H.; Kim, Y.S.; Kim, S.Y. A Study on the Regulatory Effect of the Special Water Preservation Area of Lake Paldang Watershed Based on Long-Term Variation of Pollutant Source and Water Quality. J. Korean Soc. Water Environ. 2019, 35, 43–54. [Google Scholar]
- KOWACO. The Pre-Investigation Report for Groundwater Resources; Korea Water Resources Corporation: Daejeon, Korea, 1993; p. 340. [Google Scholar]
- Mann, H.B. Nonparametric tests against trend. Econometrica 1945, 13, 245–249. [Google Scholar] [CrossRef]
- Kendall, M.G. Rank Correlation Methods; Charles Griffin: London, UK, 1975. [Google Scholar]
- Dietz, E.J.; Killeen, T.J. A nonparametric multivariate test for monotone trend with pharmaceutical applications. J. Am. Stat. Assoc. 1981, 76, 169–174. [Google Scholar] [CrossRef]
- Hirsch, R.M.; Slack, J.R. A nonparametric trend test for seasonal data with serial dependence. Water Resour. Res. 1984, 20, 727–732. [Google Scholar] [CrossRef] [Green Version]
- Yun, J.H.; Hwang, S.; Kim, D.H.; Kim, S.M. Trend Analysis of Monthly Water Quality Data in Nakdong River Based on Seasonal Mann-Kendall Test. J. Korean Soc. Agric. Eng. 2015, 57, 153–162. [Google Scholar]
- Viola, F.; Liuzzo, L.; Noto, L.V.; Lo Conti, F.; La Loggia, G. Spatial distribution of temperature trends in Sicily. Int. J. Climatol. 2014, 34, 1–17. [Google Scholar] [CrossRef]
- Kim, S.Y. Application of Mann-Kendall Methods for the Performance Assessment of the Total Pollution Load Management of Geum River. Master’s Thesis, Hanbat National University, Daejeon Metropolitan City, Korea, 2008. [Google Scholar]
- Kim, J.H. Non-Parametric Trend Analysis of Stream Quality in Nakdong River. Master’s Thesis, Ewha Womans University, Seoul Special City, Korea, 2001. [Google Scholar]
- Rafiee, J.; Tse, P.W. Use of autocorrelation of wavelet coefficients for fault diagnosis. Mech. Syst. Signal Process 2009, 23, 1554–1572. [Google Scholar] [CrossRef]
- Box, G.E.; Jenkins, G.M.; Reinsel, G.C. Time Series Analysis: Forecasting and Control, 4th ed.; John Wiley & Sons: New York, NY, USA, 2008. [Google Scholar]
- Venables, W.N.; Ripley, B.D. Modern Applied Statistics with S-PLUS; Springer Science & Business Media: New York, NY, USA, 2013. [Google Scholar]
- Park, M.; Reckhow, D.; Lavine, M.; Rosenfeldt, E.; Stanford, B.; Park, M.-H. Multivariate Analyses for Monitoring EDCs and PPCPs in a Lake Water. Water Environ. Res. 2014, 86, 2233–2241. [Google Scholar] [CrossRef] [PubMed]
- Water Environment Information System. Available online: http://water.nier.go.kr/main/mainContent.do (accessed on 28 July 2021).
- Jeong, D.; Cho, Y.; Choi, I.; Ahn, K.; Chung, H.; Kwon, O. A Study on Impact of Public Sewage Treatment Works Affecting Water Qualities of the Lake Uiam in Chuncheon City. J. Environ. Impact Assess. 2014, 23, 406–416. [Google Scholar] [CrossRef] [Green Version]
- KMA. Monsoon Season Dictionary; KMA: Seoul, Korea, 2011.
- Kim, J.; Kim, B.; Kim, M.; Shin, K. Evaluation of Organic Matter Sources of Phytoplankton in Paldang Reservoir using Stable Isotope Analysis. J. Korean Soc. Water Environ. 2015, 31, 159–165. [Google Scholar] [CrossRef] [Green Version]


Publisher’s Note: MDPI stays neutral with regard to jurisdictional claims in published maps and institutional affiliations. |
© 2021 by the authors. Licensee MDPI, Basel, Switzerland. This article is an open access article distributed under the terms and conditions of the Creative Commons Attribution (CC BY) license (https://creativecommons.org/licenses/by/4.0/).
Share and Cite
Park, M.; Cho, Y.; Shin, K.; Shin, H.; Kim, S.; Yu, S. Analysis of Water Quality Characteristics in Unit Watersheds in the Hangang Basin with Respect to TMDL Implementation. Sustainability 2021, 13, 9999. https://doi.org/10.3390/su13189999
Park M, Cho Y, Shin K, Shin H, Kim S, Yu S. Analysis of Water Quality Characteristics in Unit Watersheds in the Hangang Basin with Respect to TMDL Implementation. Sustainability. 2021; 13(18):9999. https://doi.org/10.3390/su13189999
Chicago/Turabian StylePark, Minji, Yongchul Cho, Kyungyong Shin, Hyungjin Shin, Sanghun Kim, and Soonju Yu. 2021. "Analysis of Water Quality Characteristics in Unit Watersheds in the Hangang Basin with Respect to TMDL Implementation" Sustainability 13, no. 18: 9999. https://doi.org/10.3390/su13189999