Article

Building Climate-Resilient Cotton Production System for Changing Climate Scenarios Using the DSSAT Model

1
Sustainable Agriculture and Food Programme (SAFP), World Wide Fund for Nature (WWF), Lahore 54000, Pakistan
2
Department of Agronomy, University of Agriculture Faisalabad (UAF), Faisalabad 38000, Pakistan
*
Author to whom correspondence should be addressed.
Sustainability 2021, 13(19), 10495; https://doi.org/10.3390/su131910495
Submission received: 21 May 2021 / Revised: 4 August 2021 / Accepted: 5 August 2021 / Published: 22 September 2021

Abstract

:
Cotton production is highly vulnerable to climate change, and heat stress is a major constraint in the cotton zone of Punjab, Pakistan. Adaptation is perceived as a critical step to deal with forecasted and unexpected climatic conditions. The objective of this study was to standardize and authenticate a cotton crop model based on climate and crop husbandry data in order to develop an adaptation package for cotton crop production in the wake of climate change. For the study, the data were collected from the cotton-growing areas of Punjab, viz. Bahawalpur and Khanewal. After the calibration and validation against field data, the Cropping System Model CSM–CROPGRO–Cotton in the shell of the decision support system for agro-technology transfer (DSSAT) was run with a future climate generated under two representative concentrations pathways (RCPs), viz. RCPs 4.5 and 8.5 with five global circulation models (GCMs). The whole study showed that a model is an artistic tool for examining the temporal variation in cotton and determining the potential impact of planting dates on crop growth, phenology, and yield. The results showed that the future climate would have drastic effects on cotton production in the project area. Reduction in seed cotton yield (SCY) was 25.7% and 32.2% under RCPs 4.5 and 8.5, respectively. The comparison of five GCMs showed that a hot/wet climate would be more damaging than other scenarios. The simulations with different production options showed that a 10% and 5% increase in nitrogen and plant population, respectively, compared to the present would be the best strategy in the future. The model further suggested that planting conducted 15 days earlier, combined with the use of water and nitrogen (fertigation), would help to improve yield with 10% less water under the future climate. Overall, the proposed adaptation package would help to recover 33% and 37% of damages in SCY due to the climate change scenarios of RCP 4.5 and 8.5, respectively. Furthermore, the proposed package would also help the farmers increase crop yield by 7.5% over baseline (current) yield.

1. Introduction

Agriculture is highly dependent on climate and, therefore, climate change could have major effects on crop yields and thus food and fiber supply. It is predicted that the global temperature is expected to increase by 2.9 °C to 5.5 °C by 2060, ultimately causing a considerable reduction in crop production [1]. It is anticipated that the adverse impacts of climate change on the agricultural sector will exacerbate the incidence of rural poverty. The impacts on poverty are likely to be especially severe in developing countries such as Pakistan, where the agricultural sector is an important source of livelihood for a majority of the rural farming community. The impacts of climate change for Pakistan’s farmers are likely to be problematic for the food security of many rural households. Pakistan is expected to be one of the countries most affected by climate change in South Asia [2]. As climate change is a threat to water resources, it also imperils the production of food and fiber [3]. Hence, in Pakistan, the cotton crop has faced several challenges such as climatic change, weather variability, pests and diseases attack, and price volatility. Ever-increasing temperature contributes to high evapotranspiration, resulting in reduced crop growth and productivity under water stress. The cotton production in Punjab and Sindh is subjected to low seasonal precipitation and elevated temperatures. Thus, the influence of elevated variations in precipitation from the mean value adversely affects cotton productivity [4].
The livelihood of millions of farmers and industrial laborers depends upon the cotton economy in Pakistan. The cotton crop is grown irrigated to semiarid, mostly in low rainfall and high-temperature conditions, and is tolerant to high temperature and water stress to some extent due to its vertical tap root system [5]. The historical experience, however, shows that heat stress is a major restraint on the production of cotton in various countries, including Pakistan, India, and Syria. Unfortunately, Pakistan falls into this category; a further temperature rise could damage its cotton economy [6]. Therefore, an understanding of the cotton–climate relationship is important for their welfare. Projections suggest that there will be an increase in the temperature (minimum: 2.5 °C and 3.6 °C; maximum: 2.7 °C and 3.8 °C) under 4.5 and 8.5 RCPs, respectively, from 2040–2069 in the cotton area of Punjab, Pakistan. Likewise, a decrease in rainfall would be about 33% and 52% during the cotton growing season under 4.5 and 8.5 RCPs, respectively, for the mid-century (2040–2069) with a hot/dry general circulation model (GCM) [7,8]. Most of the researchers found that climate change and inefficient cotton production management practices have reduced the yield of cotton in Pakistan [9,10,11,12].
It is worth examining the effects of climate change on all agro-ecological areas for future adaptations to national climatic conditions. To assess the direct and indirect effects of the climate on yield at the farm, regional, or higher levels requires integrated models that consider system interactions. For this, different climate adaptation approaches should be organized in association with other science disciplines, support services stakeholder’s engagement, and extensions for cotton crop. Crop growth simulation models (CGSMs) are considered valuable tools and have been used in the tactical and strategic decision support for crop productivity enhancement [13]. Crop models such as Cropping System Models (CSM) and Decision Support Systems for Agro-technology Transfer (DSSAT) can study cotton crop management, crop improvement, genotype, water management, and climate impact studies on cotton production [14,15,16,17,18]. Previous studies reported that these models are also used in studies of climate risk management and for enhancing the resilience in crops and cropping systems [8,19,20]. The DSSAT is a software application program that is comprised of crop simulation models for over 42 crops (as of Version 4.7.5). The tools include database management programs for soil, weather, and crop management, as well as experimental data, application, and utility programs to facilitate the effective use of the models. The crop simulation models simulate growth, development, and yield as a function of the soil–plant–atmosphere dynamics [21,22]. DSSAT and its crop simulation models have been used for a wide range of applications at different spatial and temporal scales. This includes regional assessments of the impact of climate variability and climate change, on-farm precision management, water use, greenhouse gas emissions, and long-term sustainability through soil organic carbon and nitrogen (N) balances [22]. DSSAT offers information with which the users can rapidly appraise new crops, products, and practices for adoption. The Cropping System Model (CSM)–Crop Growth (CROPGRO)–Cotton in the shell of DSSAT can be used to guide cotton farmers to make crop management decisions to optimize the use of limited available resources and lessen the risks associated with the environment [5,11,15]. Previously, the model was also used in water and irrigation use efficiency distribution studies [23].
Keeping the above situation in view, this study was planned to (i) test the model performance for simulating the effects of different agronomic options on crop growth and yield, (ii) study the impacts of climate change on cotton yield in the project area, and (iii) develop an adaptation package for cotton crops in the wake of climate change using a crop simulation model such as DSSAT.

2. Materials and Methods

2.1. The Project Area

Two districts of Punjab, Bahawalpur and Khanewal, were selected due to them possessing large areas under cotton cultivation and a high agricultural vulnerability to climate change [10,11]. Field surveys were conducted by the World Wide Fund for Nature (WWF)–Pakistan in the project area of Bahawalpur and Khanewal regarding cotton crop husbandry.

2.2. Collection of Field Survey Data

The primary data were collected and assessed in this study. Before the data collection, the field facilitators (FFs) were trained to conduct the preliminary survey. For primary data, the farmers in the studied area were interviewed through well-structured and comprehensive questionnaires to gather the data of the farmers’ adoptive practices for cotton cultivation. For secondary data, the Soil Survey of Pakistan (SSOP) and the Pakistan Meteorological Department (PMD) were contacted.

2.3. Experimental Site

The experiment was conducted at the agronomic research area of the University of Agriculture, Faisalabad using RCBD with three replications (n = 3) during the year 2019. Two factors were studied in the experiment: the sowing date (22 April, 7 May, and 22 May) in main plots and the cotton cultivars (NIAB-878, FH-Lalazar, and BS-15) in the subplot. The size of every trial unit was 4.5 m × 8 m, keeping the row-row distance at 75 cm or the plant-plant distance at 22.5 cm. The experimental site was ploughed with the disc harrow and then with one application of the rotavator to make the soil porous, followed by two cultivations and planking. After this, the seedbed was prepared with the help of a bed-shaper. The seed was sown using the choppa method at a rate of 20 kg ha−1. After seed sowing, a combination of pre-emergence herbicides, S-metolachlor and pendimethalin (@ 900 mL acre−1), were applied to overcome the infestation of weeds. The irrigation scheduling was done according to the recommendations of the Punjab Agriculture Department. After sowing, low irrigation was applied immediately to get better germination. After four days, interval irrigation was conducted to ensure good emergence. Subsequent other irrigations were applied at an interval of fifteen days throughout crop duration. Nitrogen (N), phosphorus (P), and potassium (K) fertilizers were applied at a rate of 150:125:100 kg ha−1, respectively, whereas nitrogen application was done in three equal split doses. The phosphorus and potassium, along with one split of nitrogen, were applied at the time of sowing while the remaining nitrogen splits were side dressed at the time of square formation and flowering. For all of the treatments, all other agronomic operations such as inter-culture operations and disease and insect pest control were kept regular and uniform. Data on crop phenology, growth, radiation use efficiency, and SCY were collected.

2.4. Crop Modeling

The Decision Support System for Agrotechnology Transfer (DSSAT) is a software application program comprised of crop simulation models for over 42 crops (as of Version 4.7.5) as well as tools to facilitate the effective use of the models. The tools include database management programs for soil, weather, crop management and experimental data, utilities, and application programs. The crop simulation models simulate growth, development, and yield as a function of the soil–plant–atmosphere dynamics [13,14,15].
In the current study, the CSM–CROPGRO–Cotton model in the shell of DSSAT [24,25] was used to study the impact of climate change on cotton performance. Furthermore, this model was also used to optimize the production options such as the sowing date, variety selection, plant population, fertilizer rate, and irrigation requirement for developing an adaptation package to enhance climate resilience in cotton in Bahawalpur and Khanewal.
Calibration is a process of adjusting some model parameters to the local conditions. It is also necessary for getting genetic coefficients for new cultivars used in the modeling study. The model was calibrated with the experimental data that included phenology, biomass, LAI, and yield components. The model calibration was started to optimize the most important parameters in soil and genotype files under the non-limiting conditions of irrigation and nitrogen to obtain the crop coefficients potential, which improves the simulations. The soil parameters were adjusted for the best simulation of soil moisture and fertility. It included the soil fertility factor (SLPF), the soil root growth factor (SRGF) (as cotton is a deep-rooted crop), and the drained upper limit (SDUL) of each layer. The SLPF was adjusted before the genetic cultivar coefficients calibration, as it affects the overall crop growth and cottonseed yield and the simulation with a suitable SLPF would be expected to be close to the recorded observation. The simulated cottonseed yield was compared with the observation of all experimental treatments for the adjustment of the SLPF with the lowest root mean square error (RMSE) and a higher index of agreement (d-statistic). Finally, cultivar coefficients were estimated for each variety (Table 1). Cultivar coefficients were determined successively starting from the coefficients dealing with the vegetative growth and phenology of the plant followed by those described by SCY against the best-performing sowing date. To select the most suitable set of coefficients, the iterative approach proposed by Hunt et al. was employed [26].
To check the accuracy of the model simulations, it was run with data recorded against the remaining two sowing date treatments. The model was further validated with data collected during field surveys and experiments conducted by WWF–Pakistan in the project area (i.e., Bahawalpur and Khanewal), and the field information regarding crop husbandry was used as input data for the model. The genetic coefficients for other varieties found in the field were also estimated using this field survey data. Simulation performance was evaluated by calculating different statistic indices like RMSE [27] and mean percentage difference (MPD) across all locations. For individual sowing, the date error (%) between simulated and observed grain yield was calculated. The time course simulation of crop biomass and LAI was assessed by d-statistics, an aggregate overall indicator [28]. These measurements were calculated as
RMSE = [ i = 1 n P i O i 2 n ] 0.5
MPD = i = 1 n O i P i O i 100 / n
Error   % = P O O 100
d = 1 i 1 n P i O i 2 i = 1 n P i + O i 2
where Pi and Oi are the predicted and observed values for studied variables, respectively, and n is the number of observations. A linear regression analysis between the observed and simulated grain yield and biomass at harvest was done to evaluate the performance of the model at different locations. Model performance improved as R2 and d-index value approached unity, while RMSE, MPD, and error proceeded to zero.

2.5. Soil and Weather Data for Model

The Lyallpur soil series was used for Faisalabad during the calibration of the model with experimental data. The data relating to the soil series of each location (Bahawalpur and Khanewal) were collected from the SSOP (Table 2). The soil profile data of the sand, silt, clay, organic carbon (OC %), pH in water, cation exchange capacity (cmol kg−1), and total nitrogen % were collected and used as input for the model. The organic carbon percentage was computed by dividing the value of organic matter by 1.70. The parameters such as bulk density (gcm−3), permanent wilting point (%), and field capacity (%) were calculated by the model using the methods described by Rawls et al. [29].
The daily maximum temperature (Tmax), minimum temperature (Tmin), and rainfall and sunshine hours for the cropping season (2019) were also collected (Figure 1a,b). The solar radiations were calculated using the Angstrom formula (Angstrom 1924). These data were also used as the input data set in model simulations.

2.6. Statistical Downscaling and Climate Change Projections

Baseline climate data (1989–2019) for daily Tmax, Tmin, solar radiations and rainfall were obtained from the PMD. The climate change scenarios were generated for mid-century (2039–2069) under RCP 8.5. It was assumed that global annual greenhouse gas emissions continue to rise throughout the twenty-first century using the delta method approach. Five General Circulation Models (GCMs) were used for simulating the climate systems in response to climate change factors, e.g., greenhouse gasses (Table 3) and for representing the uncertainty of the prediction of the temperatures and precipitation for all locations from the Coupled Model Inter-comparison Project (CMIP5) [30]. In GCM simulations, the shape parameters of the gamma distribution for a wet event are not of sufficient quality; therefore, mean monthly changes were imposed to the baseline climate using a stretch distribution approach [31]. Parameters such as solar radiation and humidity were assumed to be unchanged during this process. Finally, cool/wet, cool/dry, hot/wet, hot/dry, and middle climate scenarios were developed for the GCMs. Rosenzweig et al. [32] described the detailed protocol.

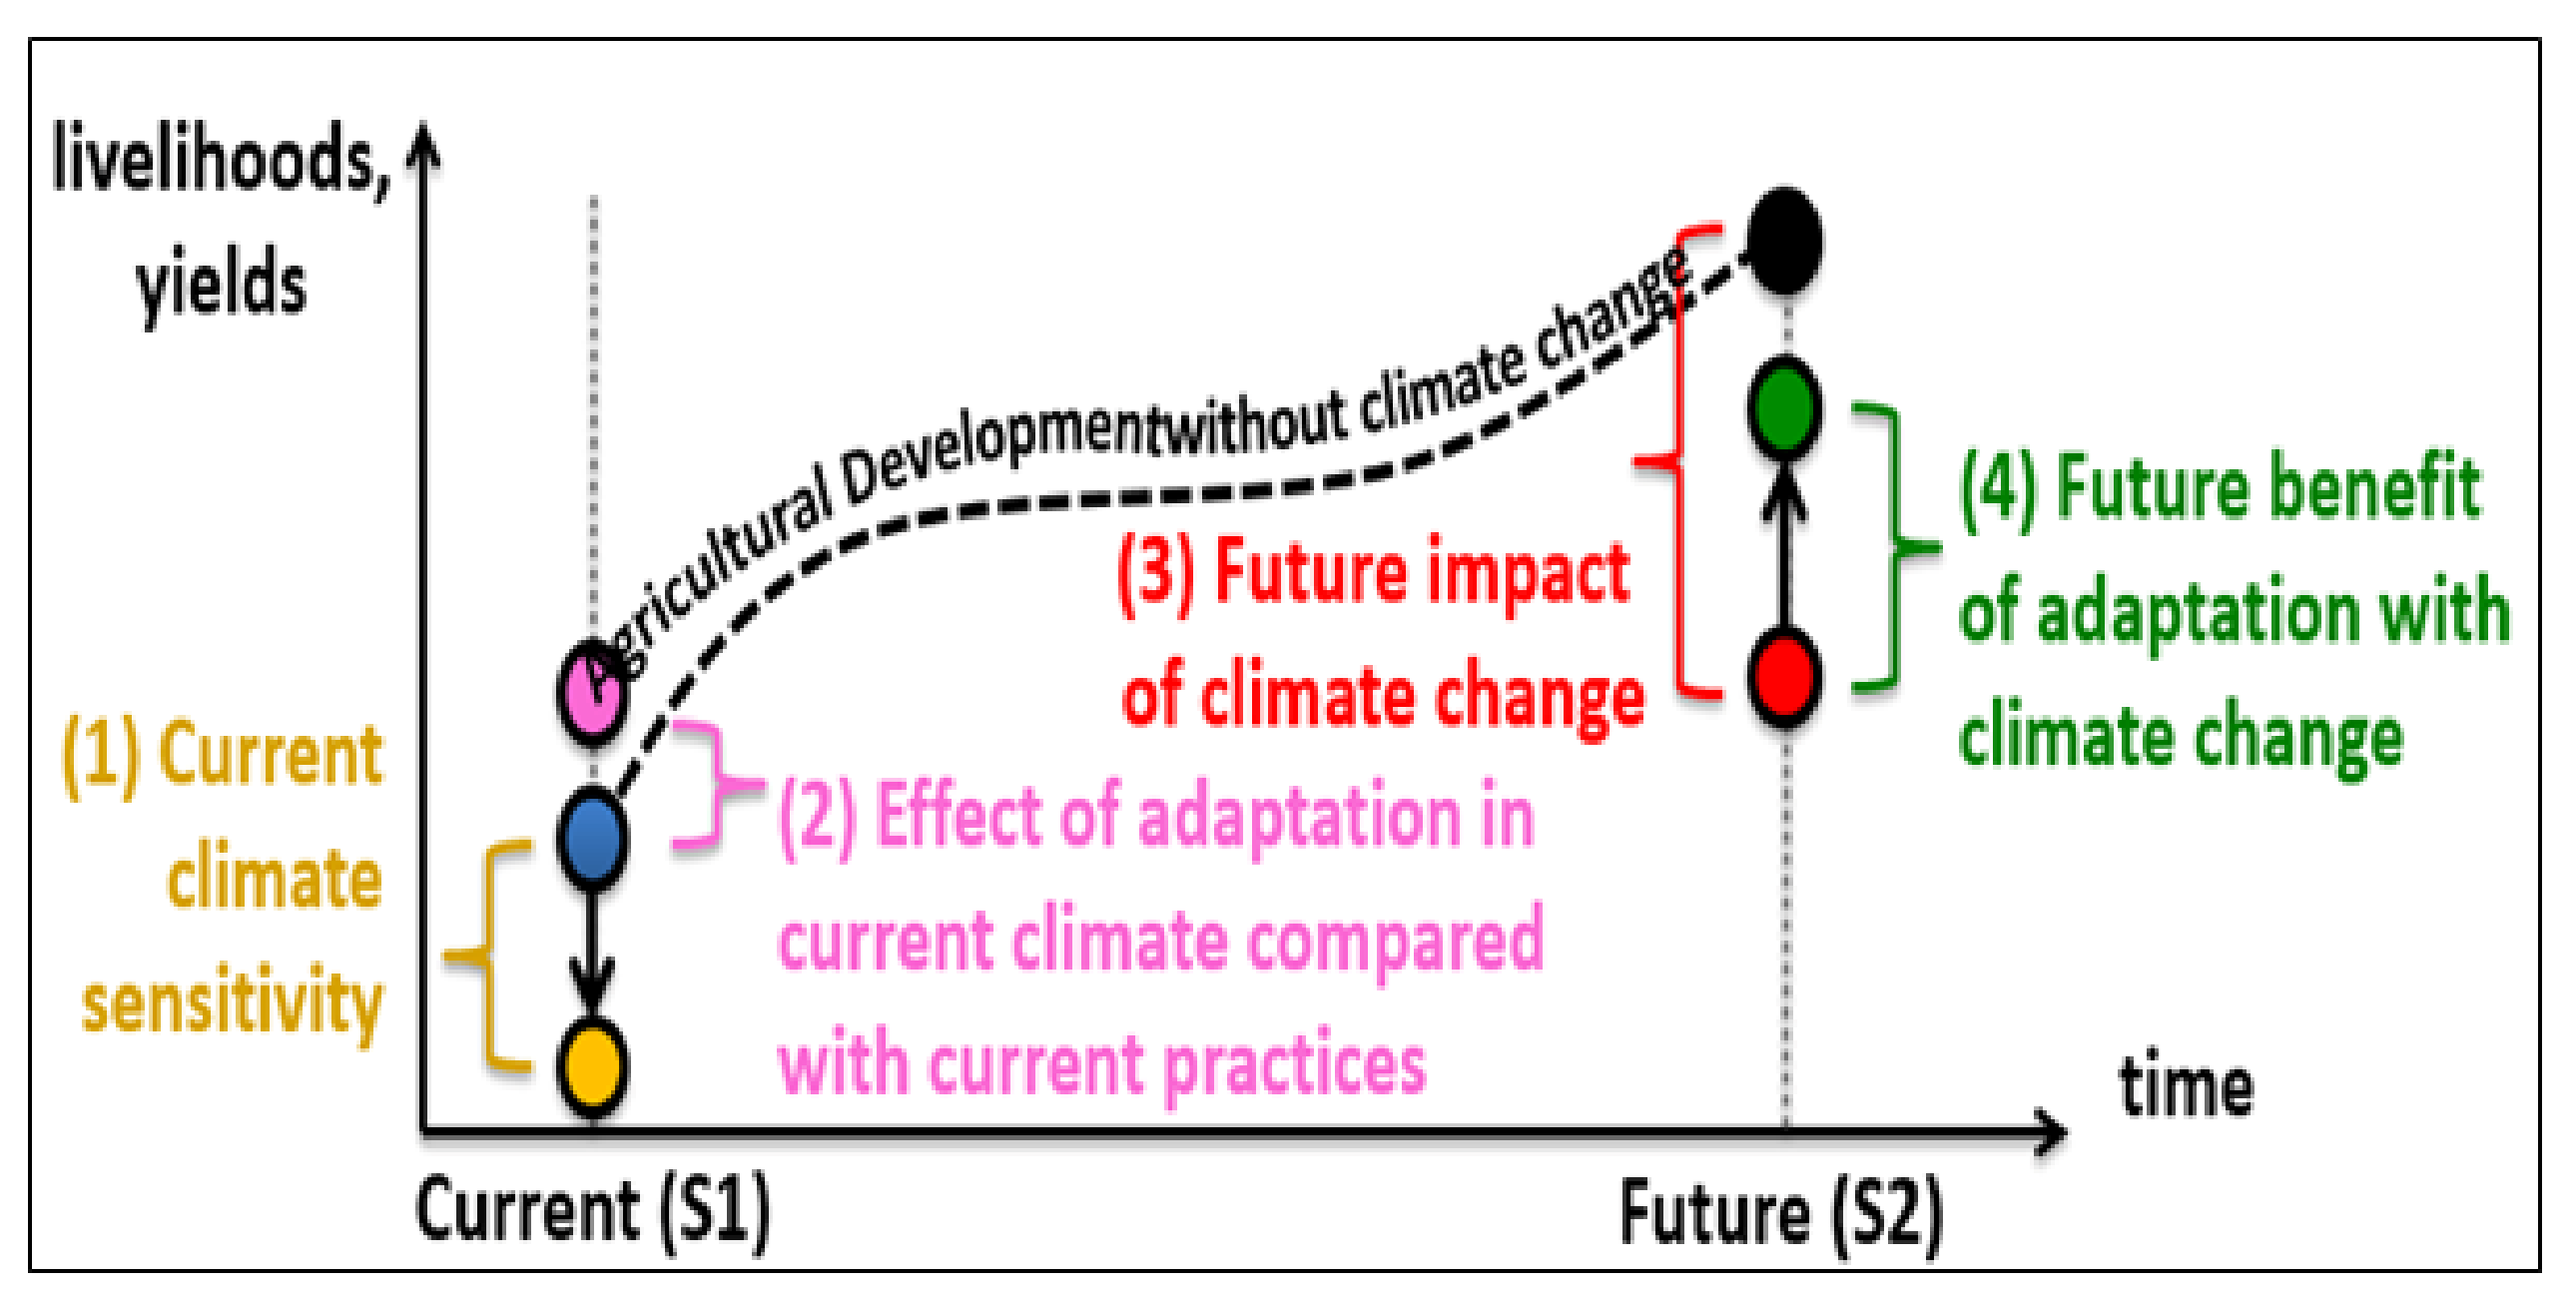
2.7. Climate Change Impact Assessment

A seasonal analysis tool in the shell of DSSAT was used to evaluate the impact of climate change on cotton for mid-century scenarios as predicted by the Pakistan Meteorological Department through the Geophysical Fluid Dynamics Laboratory Climate Model 3 (GFDL-CM3) model. Seasonal files were created from the management practices of optimum sowing dates for both locations. The baseline climate (1989–2019) and future scenarios generated by the GFDL-CM3 model were used to create the weather files for each location. The Carbon dioxide (CO2) concentration of 571 ppm was used for RCP 8.5 under the mid-century, as proposed by IPCC (2013). The impact of climate change was calculated from the future and baseline to the mean yield using the following equation.
% Change = Simulated Observed / Obesrved × 100
The accuracy and precision of the model simulations were further evaluated by running the model with data collected against the remaining treatments (7 May and 22 May). The surveyed data, including the crop husbandry practices of farmers in the project area (Bahawalpur and Khanewal), were used as the input data set, and the model was validated to assess its accuracy at the farmer field.

2.8. Climate Change Scenario Generations

Climate change projections for the region were generated using the output of the five GCMs from the latest CMIP5 family under RCP 4.5 and RCP 8.5 scenarios (CO2 concentration at 571 ppm). A major indication of climate change in the target region complies with the global trend of positive increases in both maximum and minimum temperature. However, there are highly heterogeneous change patterns observed in the precipitation regime owing to the high inter-annual variability in the region. The integrated assessment of the target region is projected with the temperature changes to be highest under GCMs with hot/wet and hot/dry characteristics. For the cotton season, the highest of the changes were projected in a hot/wet climate with a 3.6 °C (3.5 °C) increase in minimum temperature and a 4.3 °C (3.8 °C) increase in maximum temperature (Table 4). Available observed data and generated future data were used for developing the weather files in DSSAT. The simulations were compared with the observed data to study the impact of climate change on cotton productivity in the project area.

2.9. Adaptation Strategies for Climate-Resilient Cotton Production

Adaptation strategies were developed by modifying the crop management practices in the model to cope with possible climate change. The values showing the maximum increase in yield under the mid-century scenarios of RCP 8.5 for both locations were considered as the adaptation strategies for climate-resilient cotton production in the project area. The selected adaptation strategies were variety selection, optimization of planting density, change in planting time, optimization of the amount of nitrogen, and irrigational water (Figure 2). The model was tested against the set of different values/practices and the best combination was selected for maximizing the crop yield under changing climates.

3. Results

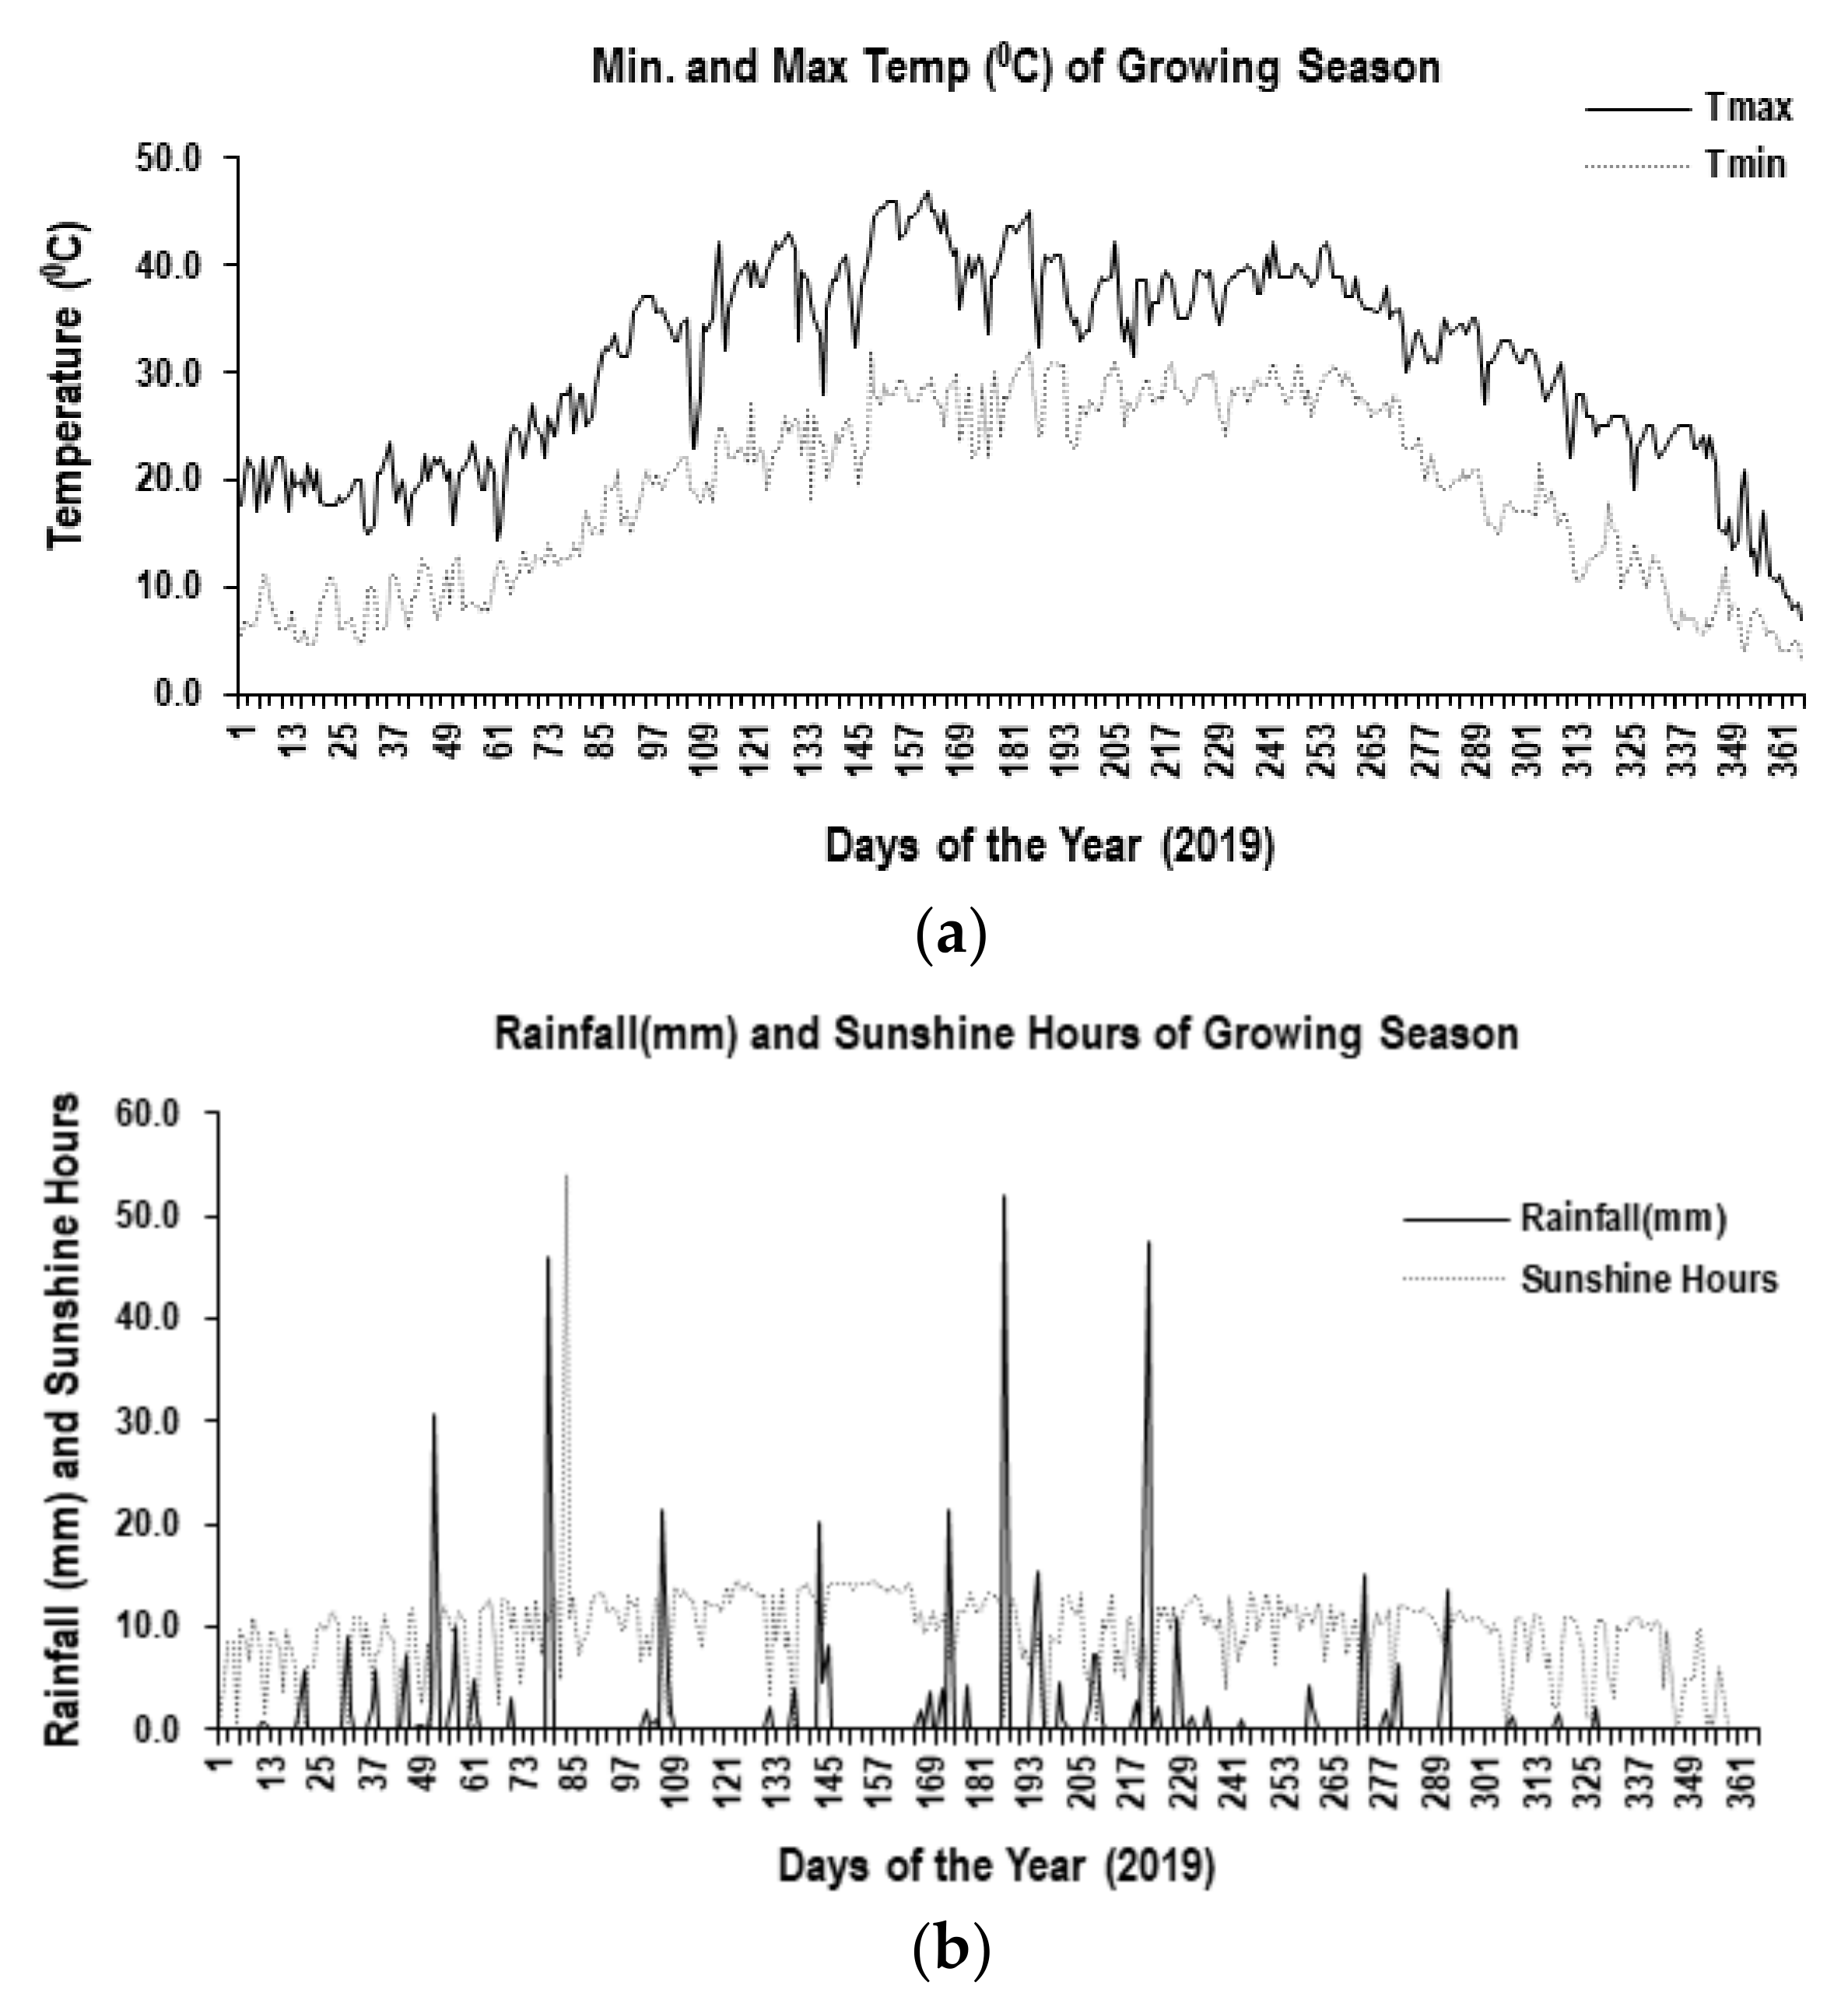
3.1. Soil and Weather Data

The geographical coordinates and characteristics of the dominant soil series found in the project area were given in Table 2. This data was used to simulate the cotton yield at the farmer level in the project area using the farmer’s crop husbandry practices as the input data set for the model. Likewise, mean monthly changes in the mean Tmax, Tmin, and precipitation were calculated and compared with the future 30-year climate to baseline. After that, monthly changes in the standard deviation (SD) of Tmax, SD of Tmin, and rainy days (>0.1 mm) were calculated and compared with the future climate to baseline (Table 4).

3.2. Parameterization and Calibration with Experimental Data

The calibration results in Table 5 revealed that the error percentage between the observed and simulated days to anthesis for NIAB-878, FH-Lalazaa, and BS-15 was 1.67%, as the model predicted. The calibration results regarding physiological maturity with −1.08, −1.08, and −1.08 error percentages were compared to the observed days in NIAB-878, FH-Lalazaar, and BS-15, respectively. In LAI, the results indicated that error percentage differences of −1.92, −3.39, and −5.39 were calculated in NIAB-878, FH-Lalazaar, and BS-15, respectively. In NIAB-878 for TDM, a 260 kg ha−1 difference was calculated with an error percentage of 1.95, and FH-Lalazaar was calibrated with an error percent of 7.08. The difference in TDM for BS-15 was calculated with an error percentage of 5.44, whereas the average percentage difference of 4.82 was calculated in all cultivars collectively for TDM. The observed and simulated SCY was 3159.72 kg ha−1 and 3209 kg ha−1, 2942.77 kg ha−1 and 3058 kg ha−1, 2984.16 kg ha−1, and 3125 kg ha−1 for NIAB-878, FH-Lalazaar, and BS-15, with an average percentage difference of 3.40. These results were reliable enough to evaluate the model against other treatments. The comparison of the time courses TDM (Figure 3) and LAI (Figure 4) also showed that the model simulates the growth pattern of cotton in a good manner.

3.3. Evaluation of the Model with Experimental Data

The accuracy and precision of the model simulations were further evaluated by running the model with data collected against the remaining treatments (7 May and 22 May). The following parameters were compared:

3.3.1. Days to Anthesis

The model evaluation results indicated that the days to anthesis were in the range of good accuracy with a mean error of 9.87%. Table 6 shows the observed and simulated values of days to anthesis for two sowing dates (7 May and 22 May) in three different cotton varieties (NIAB-878, FH-Lalazaar, and BS-15). For NIAB-878, the error difference was 5.36% and 12% on both sowing dates. In the case of FH-Lalazaar, the model evaluated days to anthesis quite well. The error differences in FH-Lalazaar for the anthesis were 7.27% and 14.29% for the second and third sowings. For FH-142, the evaluation results for various sowing dates were also satisfactory. The difference in days to anthesis was calculated at 7.27% in the second and third sowings. The d-index, RMSE and mean percent difference (MPD) were calculated with the values of 0.58, 5.4, and 10.08%, respectively. The deviation in growing climatic conditions for the different cotton varieties in different sowing windows might be responsible for the different phenological (flower initiation) responses.

3.3.2. Days to Physiological Maturity

The model evaluation results indicated that days to physiological maturity were in the range of good accuracy with a mean error of 6.29%. Table 6 shows the observed and simulated values of days to physiological maturity for two sowing dates (7 May and 22 May) in three different cotton varieties (NIAB-878, FH-Lalazaar, and BS-15). For NIAB-878, a 4.05% and 8.70% percent difference was seen after the evaluation for days to physiological maturity after sowing. In the case of FH-Lalazaar, the model evaluated days to physiological maturity after sowing quite well. The error differences in FH-Lalazaar for physiological maturity were 4.05% and 8.70% for the second and third sowings. For BS-15, the evaluation results for various sowing dates were also satisfactory. The difference in days to physiological maturity was calculated at 4.05% and 8.70% in the second and third sowings. The d-index, RMSE and mean percent difference (MPD) were calculated with the values of 0.56, 11.07, and 6.37% respectively. The deviation in growing climatic conditions in the various seedling ages in different fine cotton varieties might be responsible for the different phenological (boll opening) responses.

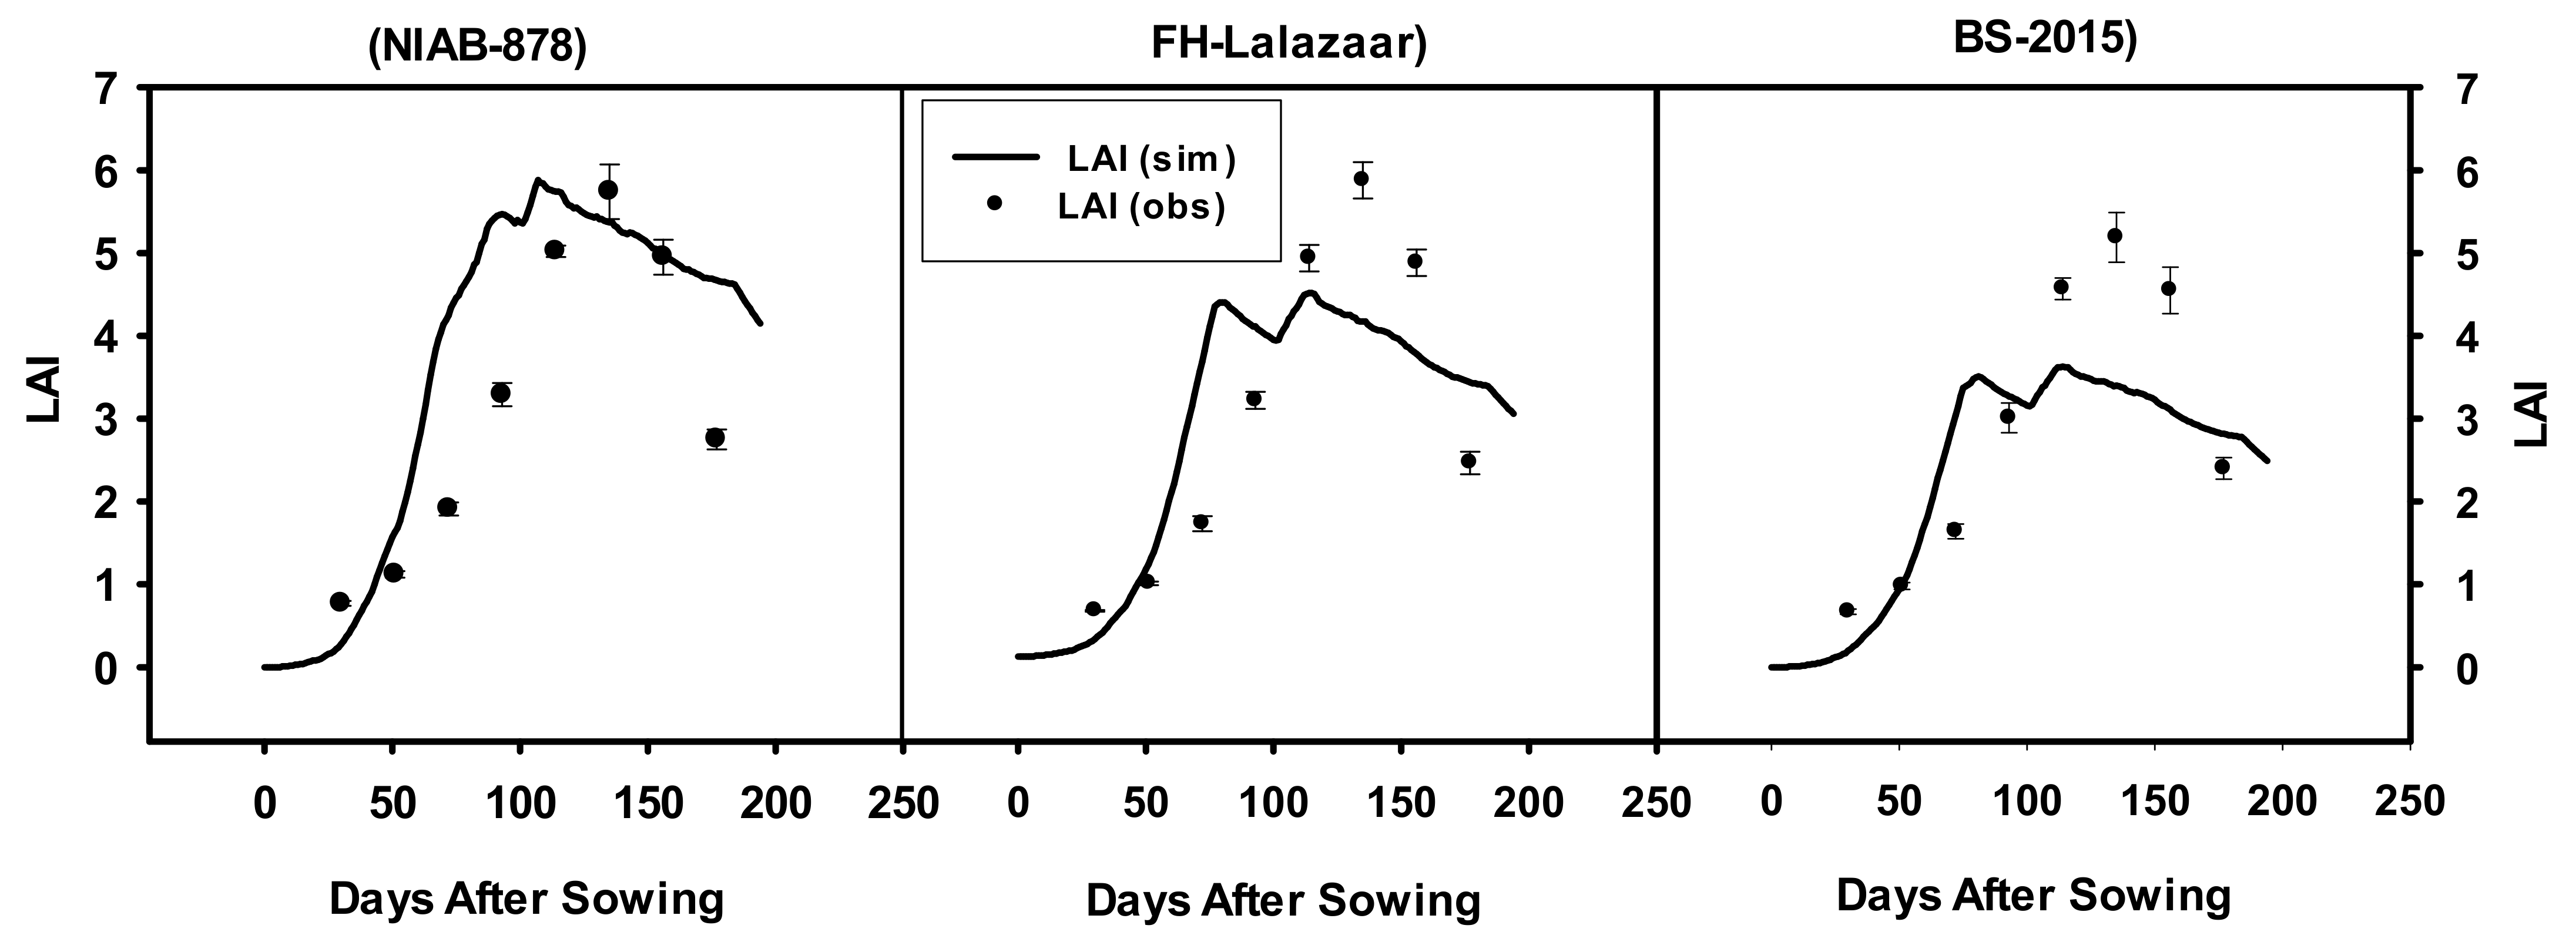
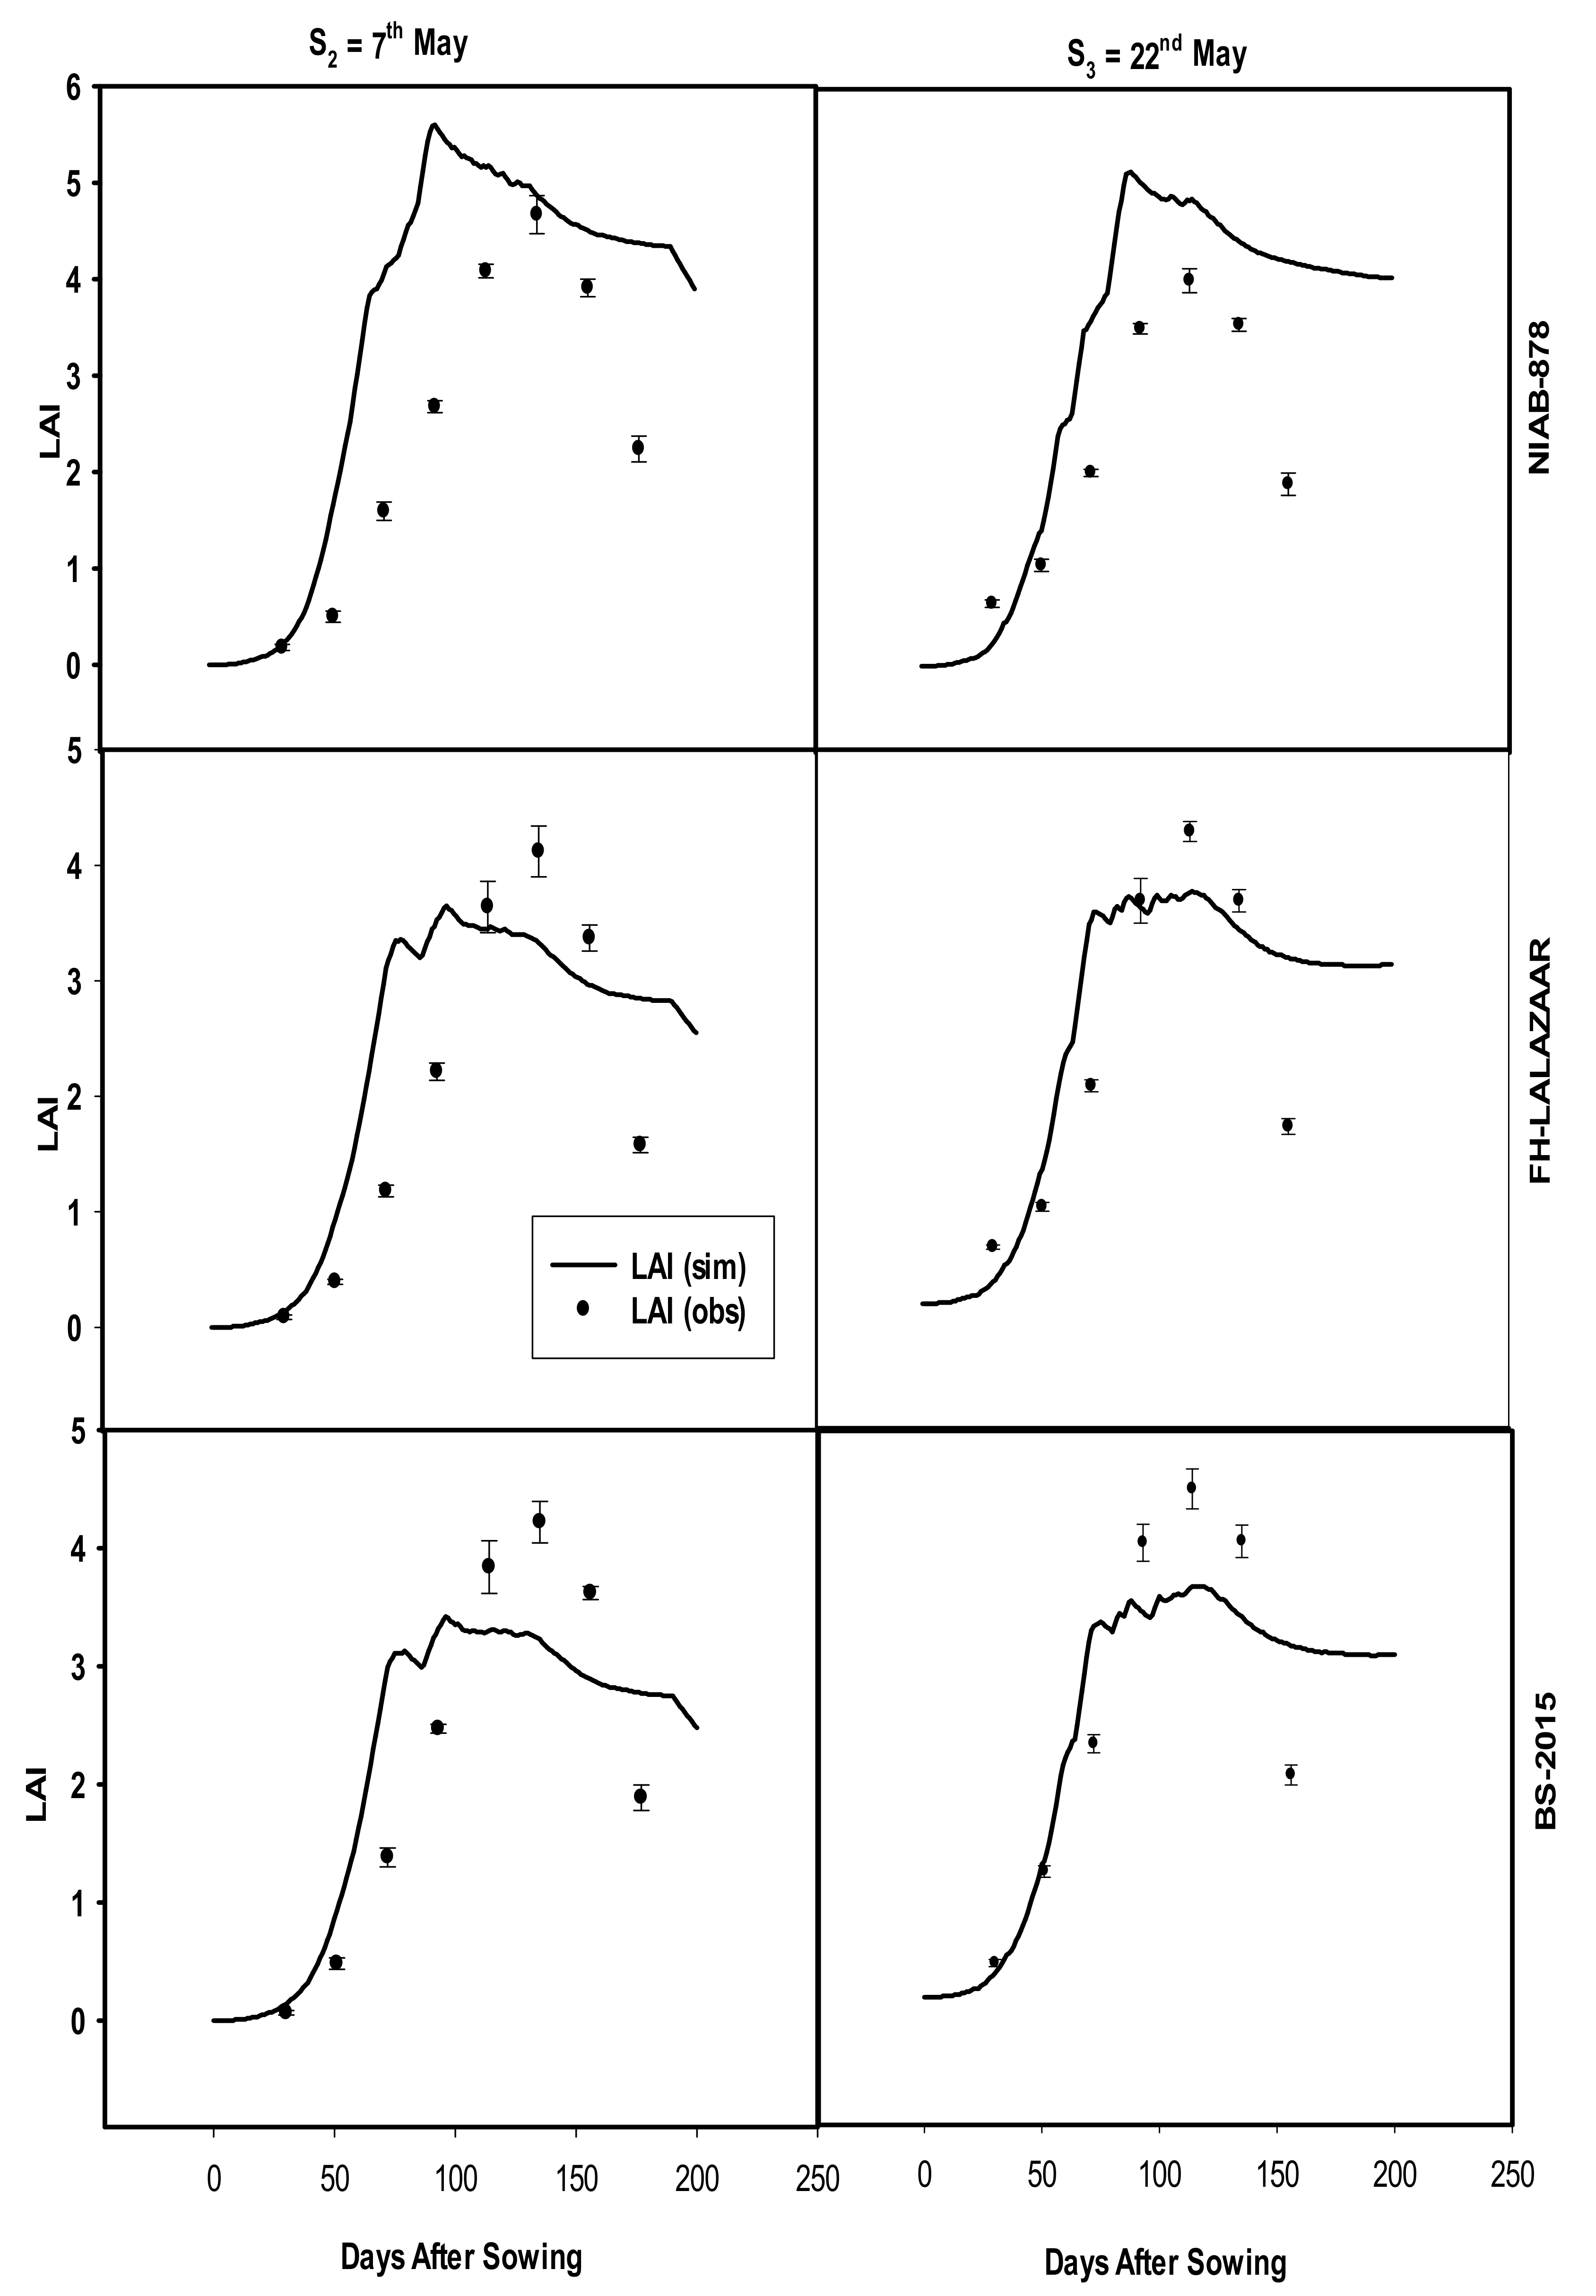
3.3.3. Leaf Area Index (LAI)

The model fairly simulated the LAI fairly well, with an average error of −6.58%. The data in Table 7 shows the RMSE value to be 0.33, while the value of the D-index among the simulated and observed values was 0.86 and the MPD value was 6.73%. The model evaluation results for NIAB-878 demonstrated that the LAI was simulated with an error difference of −9.42% and 12.97% in the second and third sowings. The error differences of 0.24% and −6.45% were measured in both sowing dates of FH-Lalazar. The evaluation results regarding BS-15 show that the crop model simulated LAI in second and third sowings with estimated error differences of −0.71% and −10.58%.

3.3.4. Seed Cotton Yield

After the calibration, the crop model was evaluated for SCY against two sowing dates (7 May and 22 May) and three cotton genotypes, and the simulated results were quite precise for this agronomic parameter. The model evaluation results regarding SCY for NIAB-878 demonstrated that the model over-simulated with an error difference of 4.69% and 4.26% in the second and third sowing dates, respectively. Furthermore, the mean error difference was 6.28%, collectively, in all sowing dates. The SCY simulation for FH-Lalazaar was also quite satisfactory. Error differences of 7.73% and 9.34% were measured in both of the sowing dates of FH-Lalazaar (Table 7). The evaluation results regarding BS-15 showed that the crop model over simulated SCY with an error percent of 5.65% and 10.02% for the second and third sowings, whereas the mean value of error difference was 6.82% for all the treatments. The statistical indices were calculated. The root mean square (RMSE) value was 183.53 kg ha−1 with a mean percent difference (MPD) of 6.95%, and the d-index value was 0.77 (Table 7). The comparison of time courses TDM and LAI also showed that the model simulates the growth pattern of cotton in a good manner (Figure 5 and Figure 6).

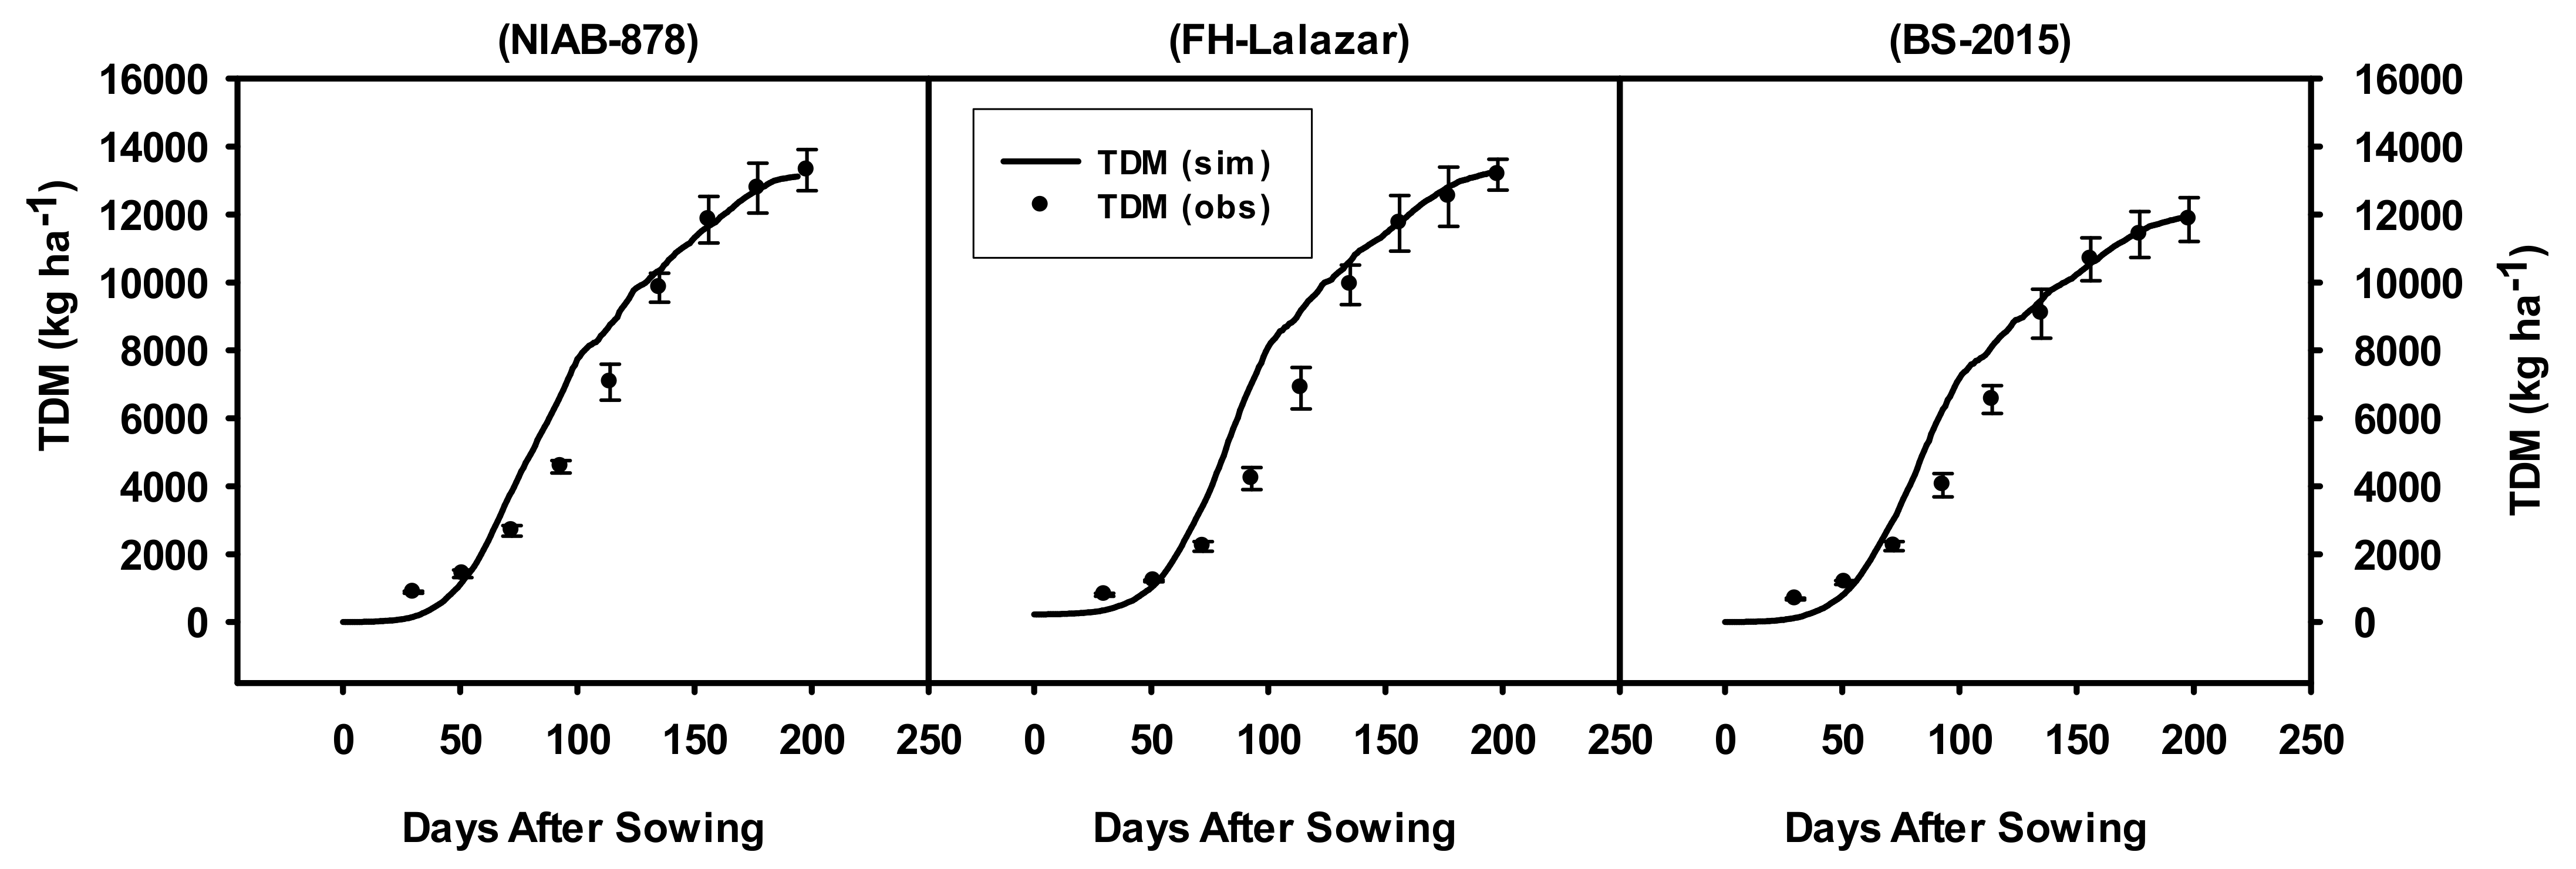
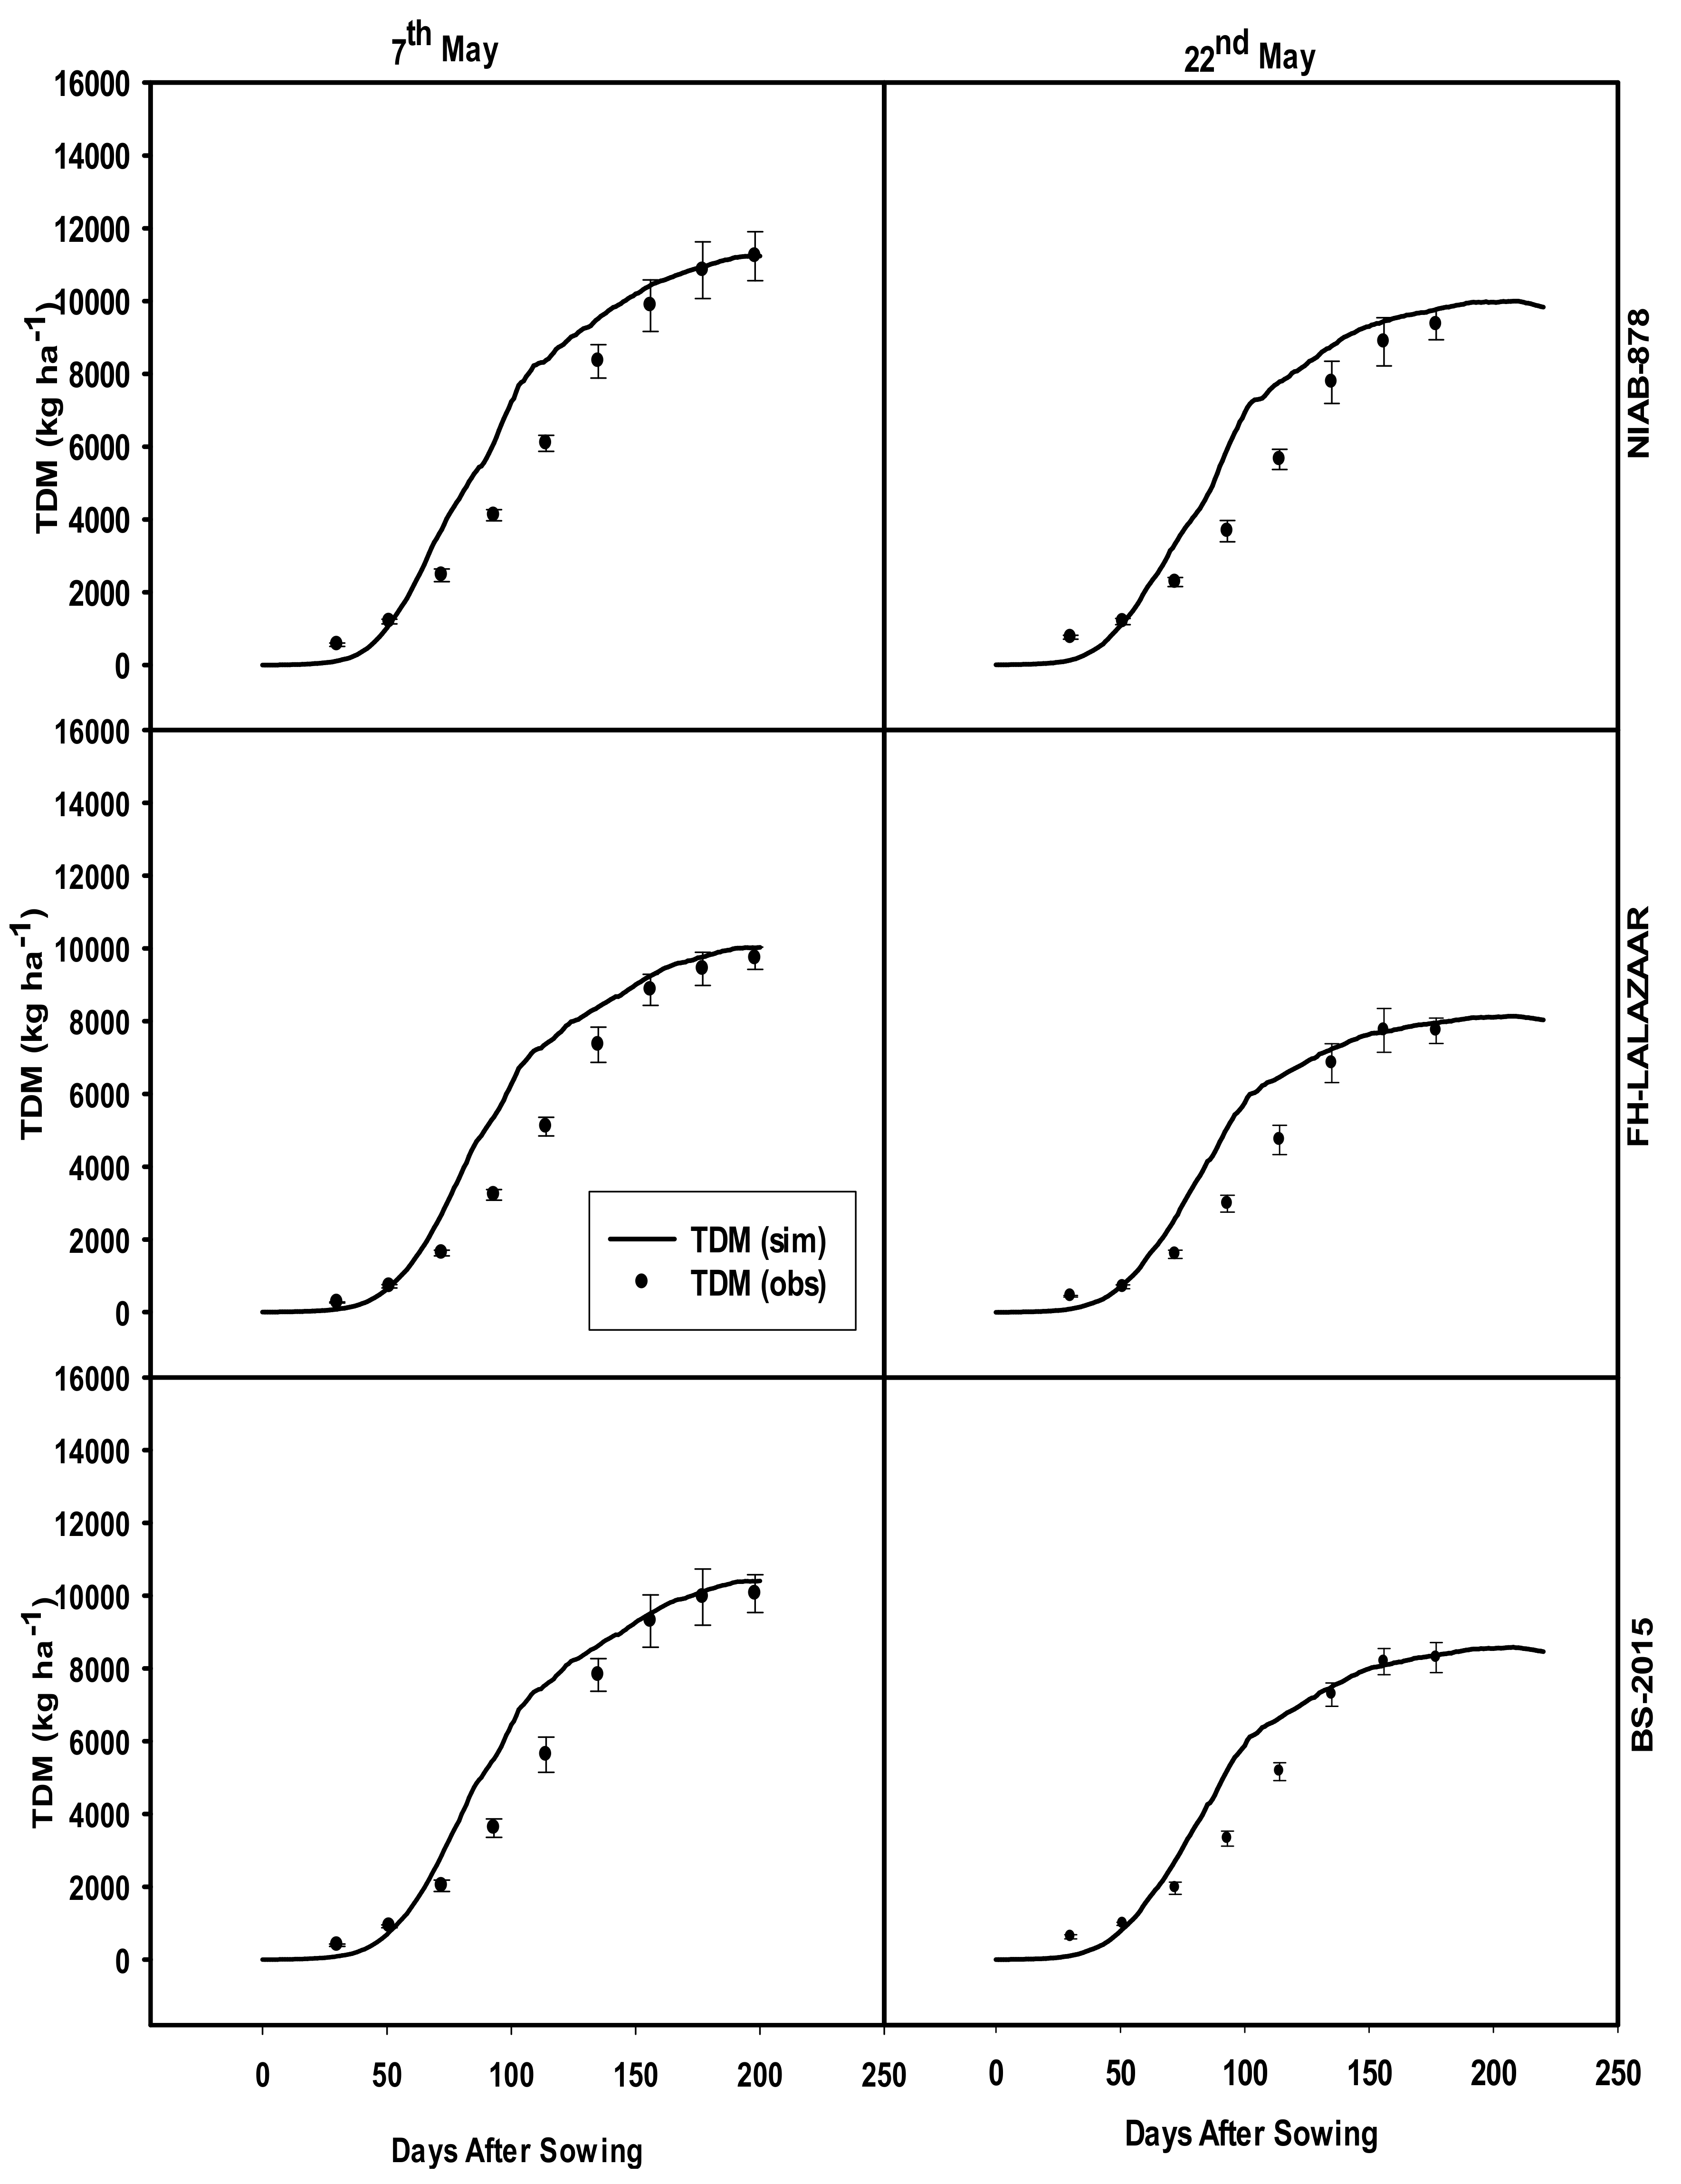
3.3.5. Total Dry Matter

The above-ground biomass of the two sowing dates (7 May and 22 May) and three cotton cultivars were evaluated, and the simulated results were quite accurate for this agronomic parameter. The model evaluation results for NIAB-878 demonstrated that above-ground biomass was simulated with an error difference of 2.65% and 5.85% in the second and third sowings. The RMSE simulation for FH-Lalazaar was also quite satisfactory. Error differences of 12.92% and 15.81% were measured in both sowing dates of FH-Lalazaar (Table 7). The evaluation results regarding BS-15 showed that the crop model simulated above-ground biomass in the second and third sowings with estimated error differences of 11.85% and 9.93%. The calculated d-index value was 0.83, the mean percent difference (MPD) value was 9.84%, and the root means square error (RMSE) value was 963.11 kg ha−1. The d-index value designates a significant relationship between the experiential and simulated values of this factor (Table 7).

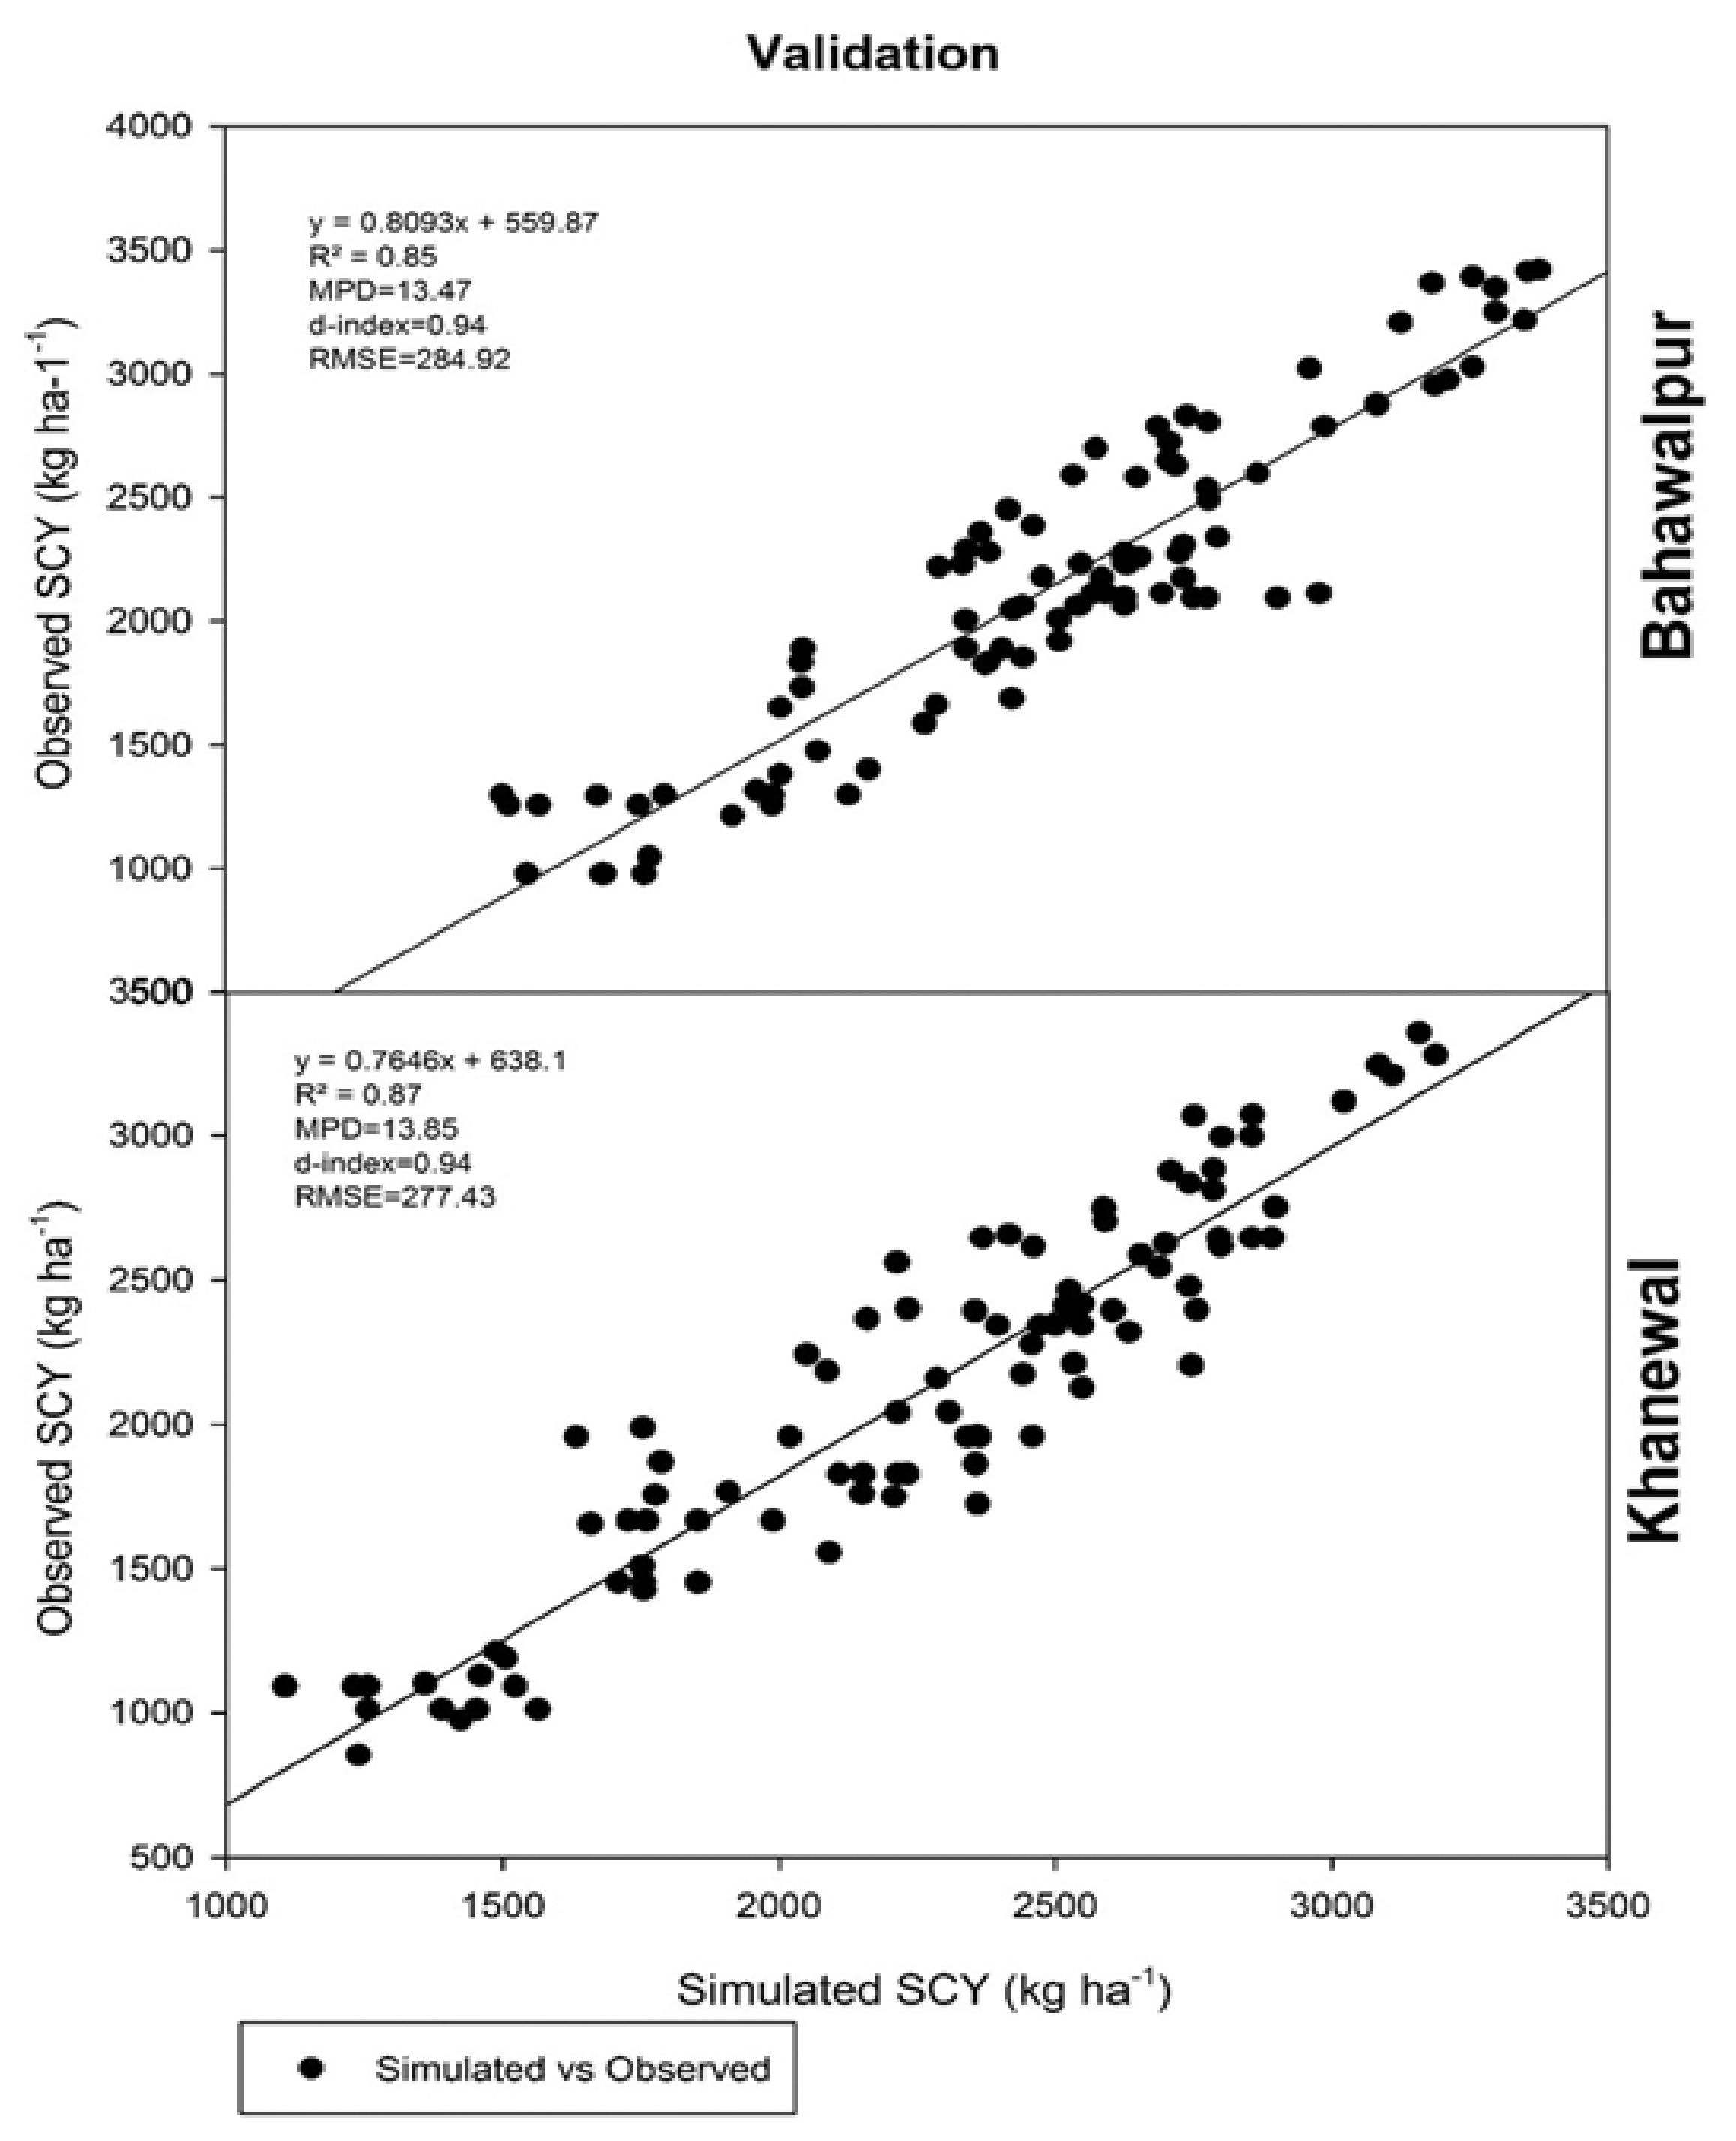
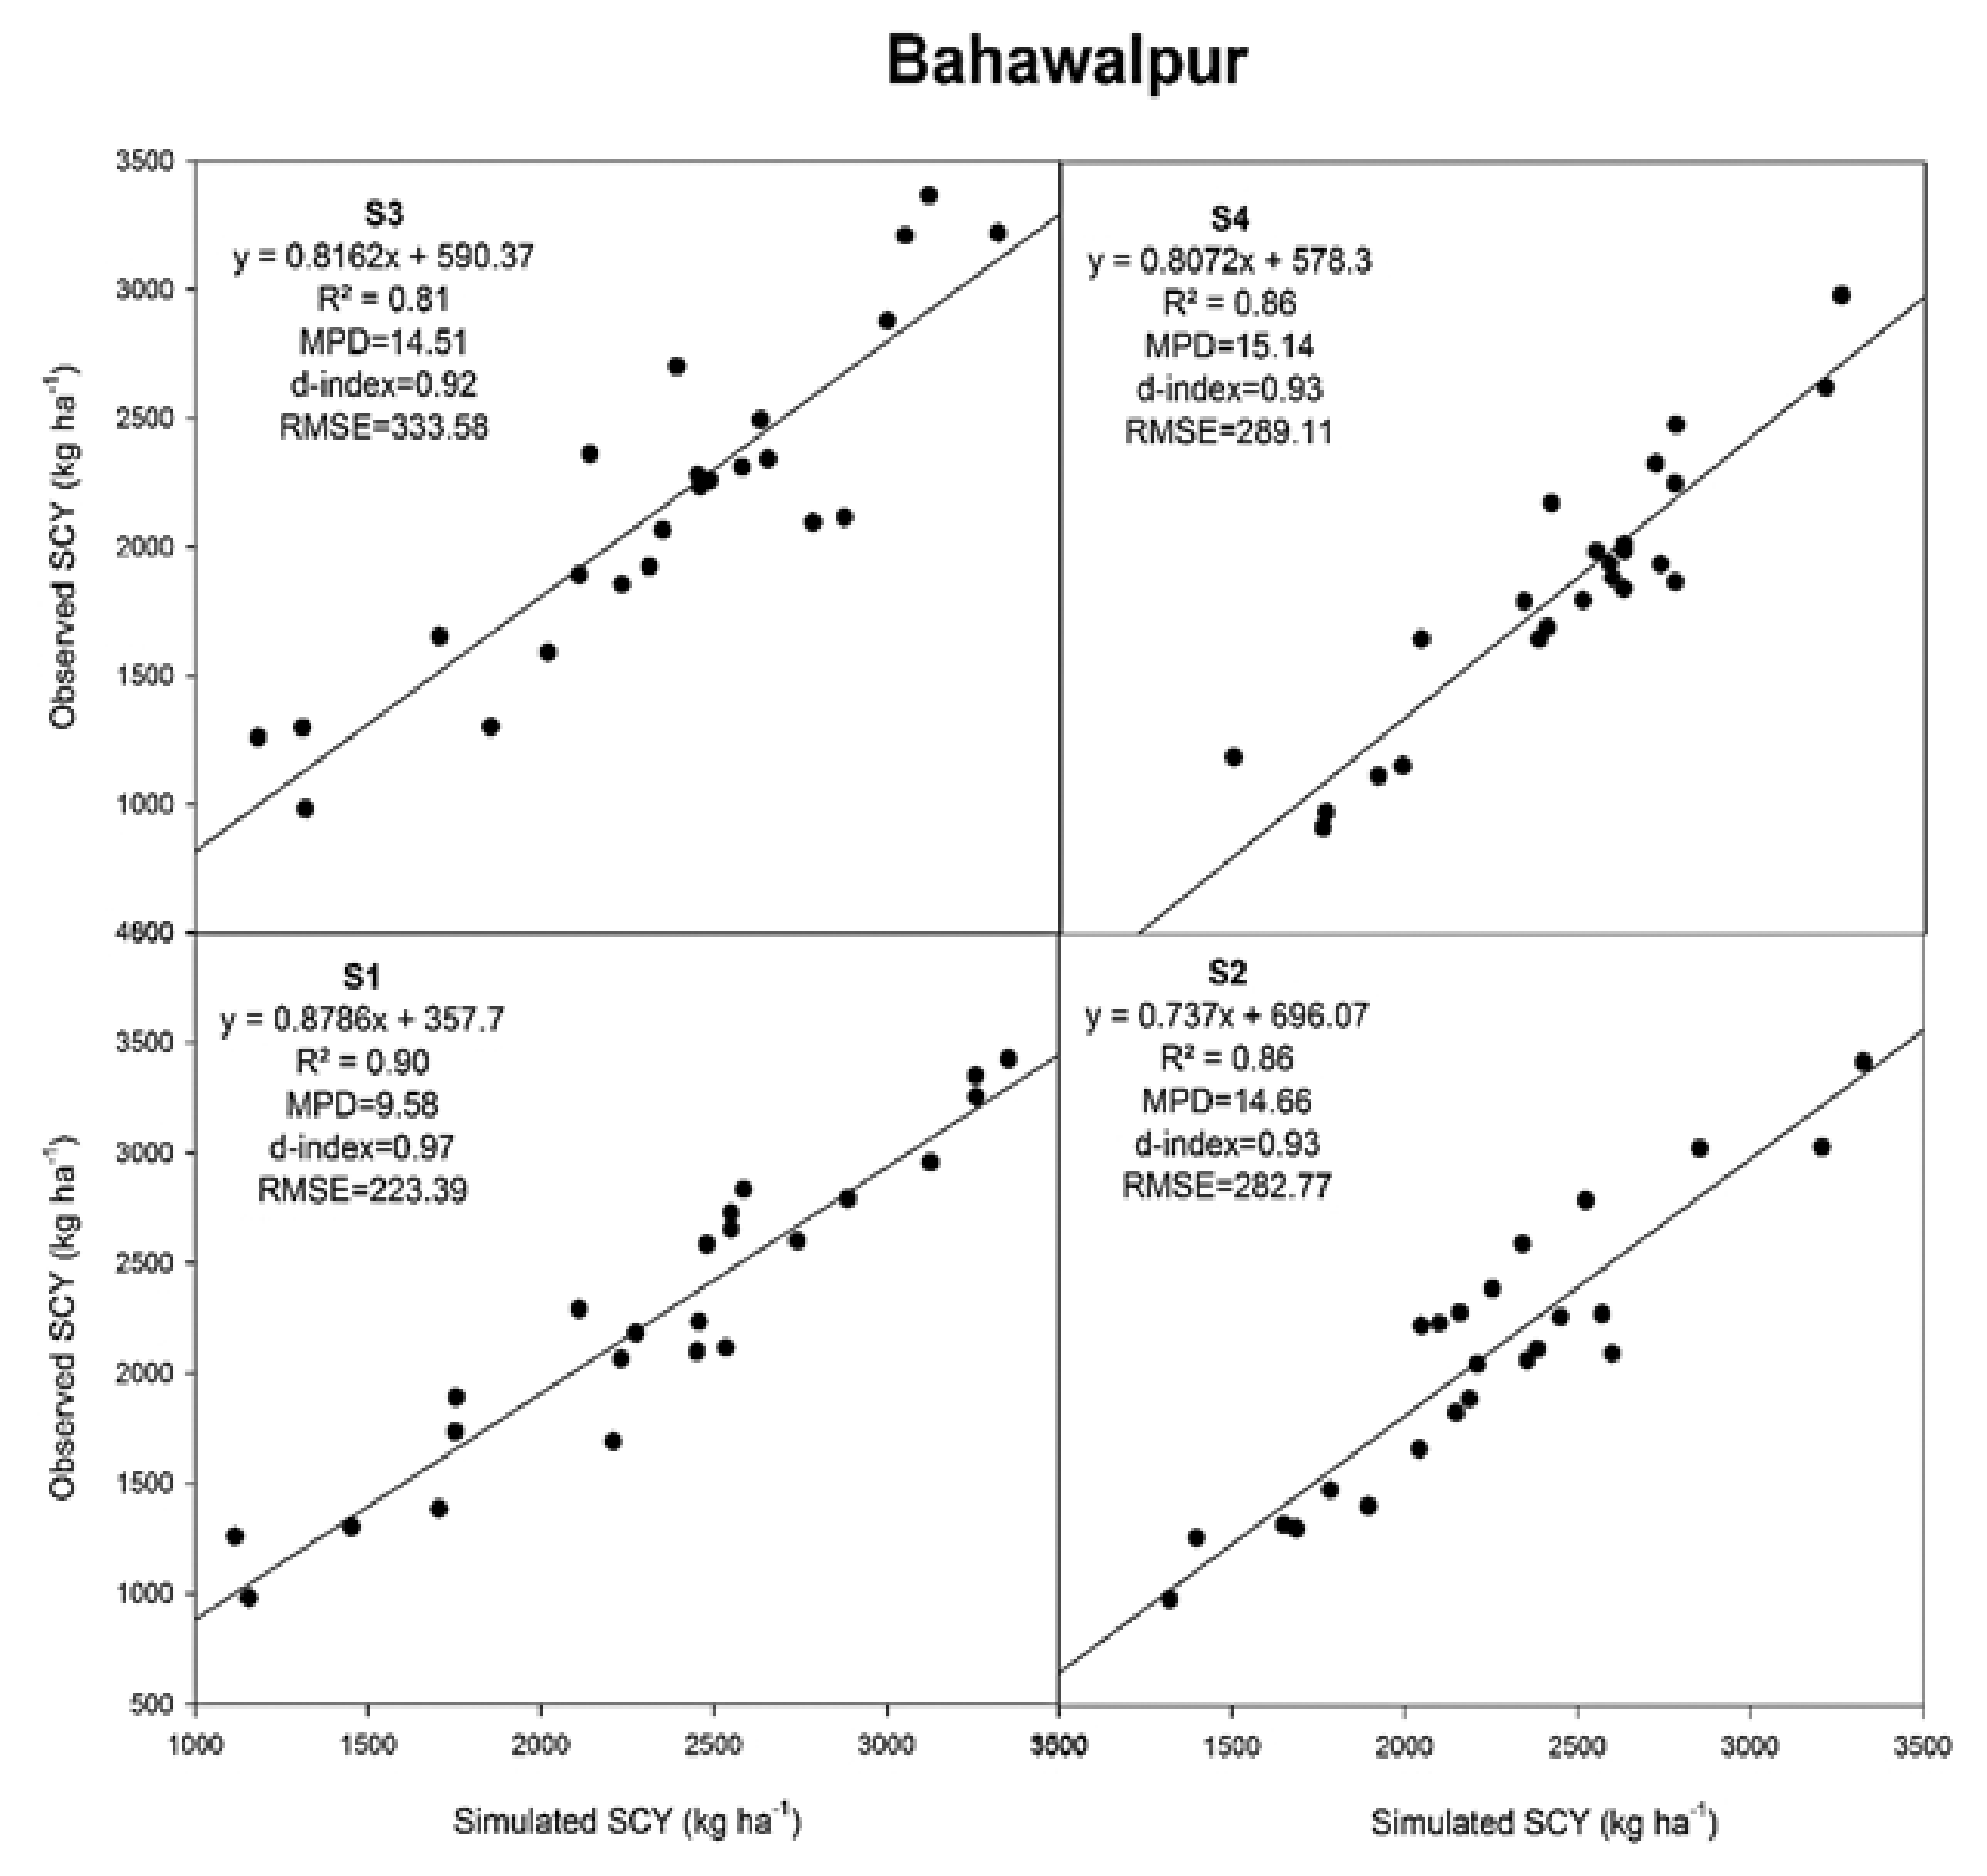
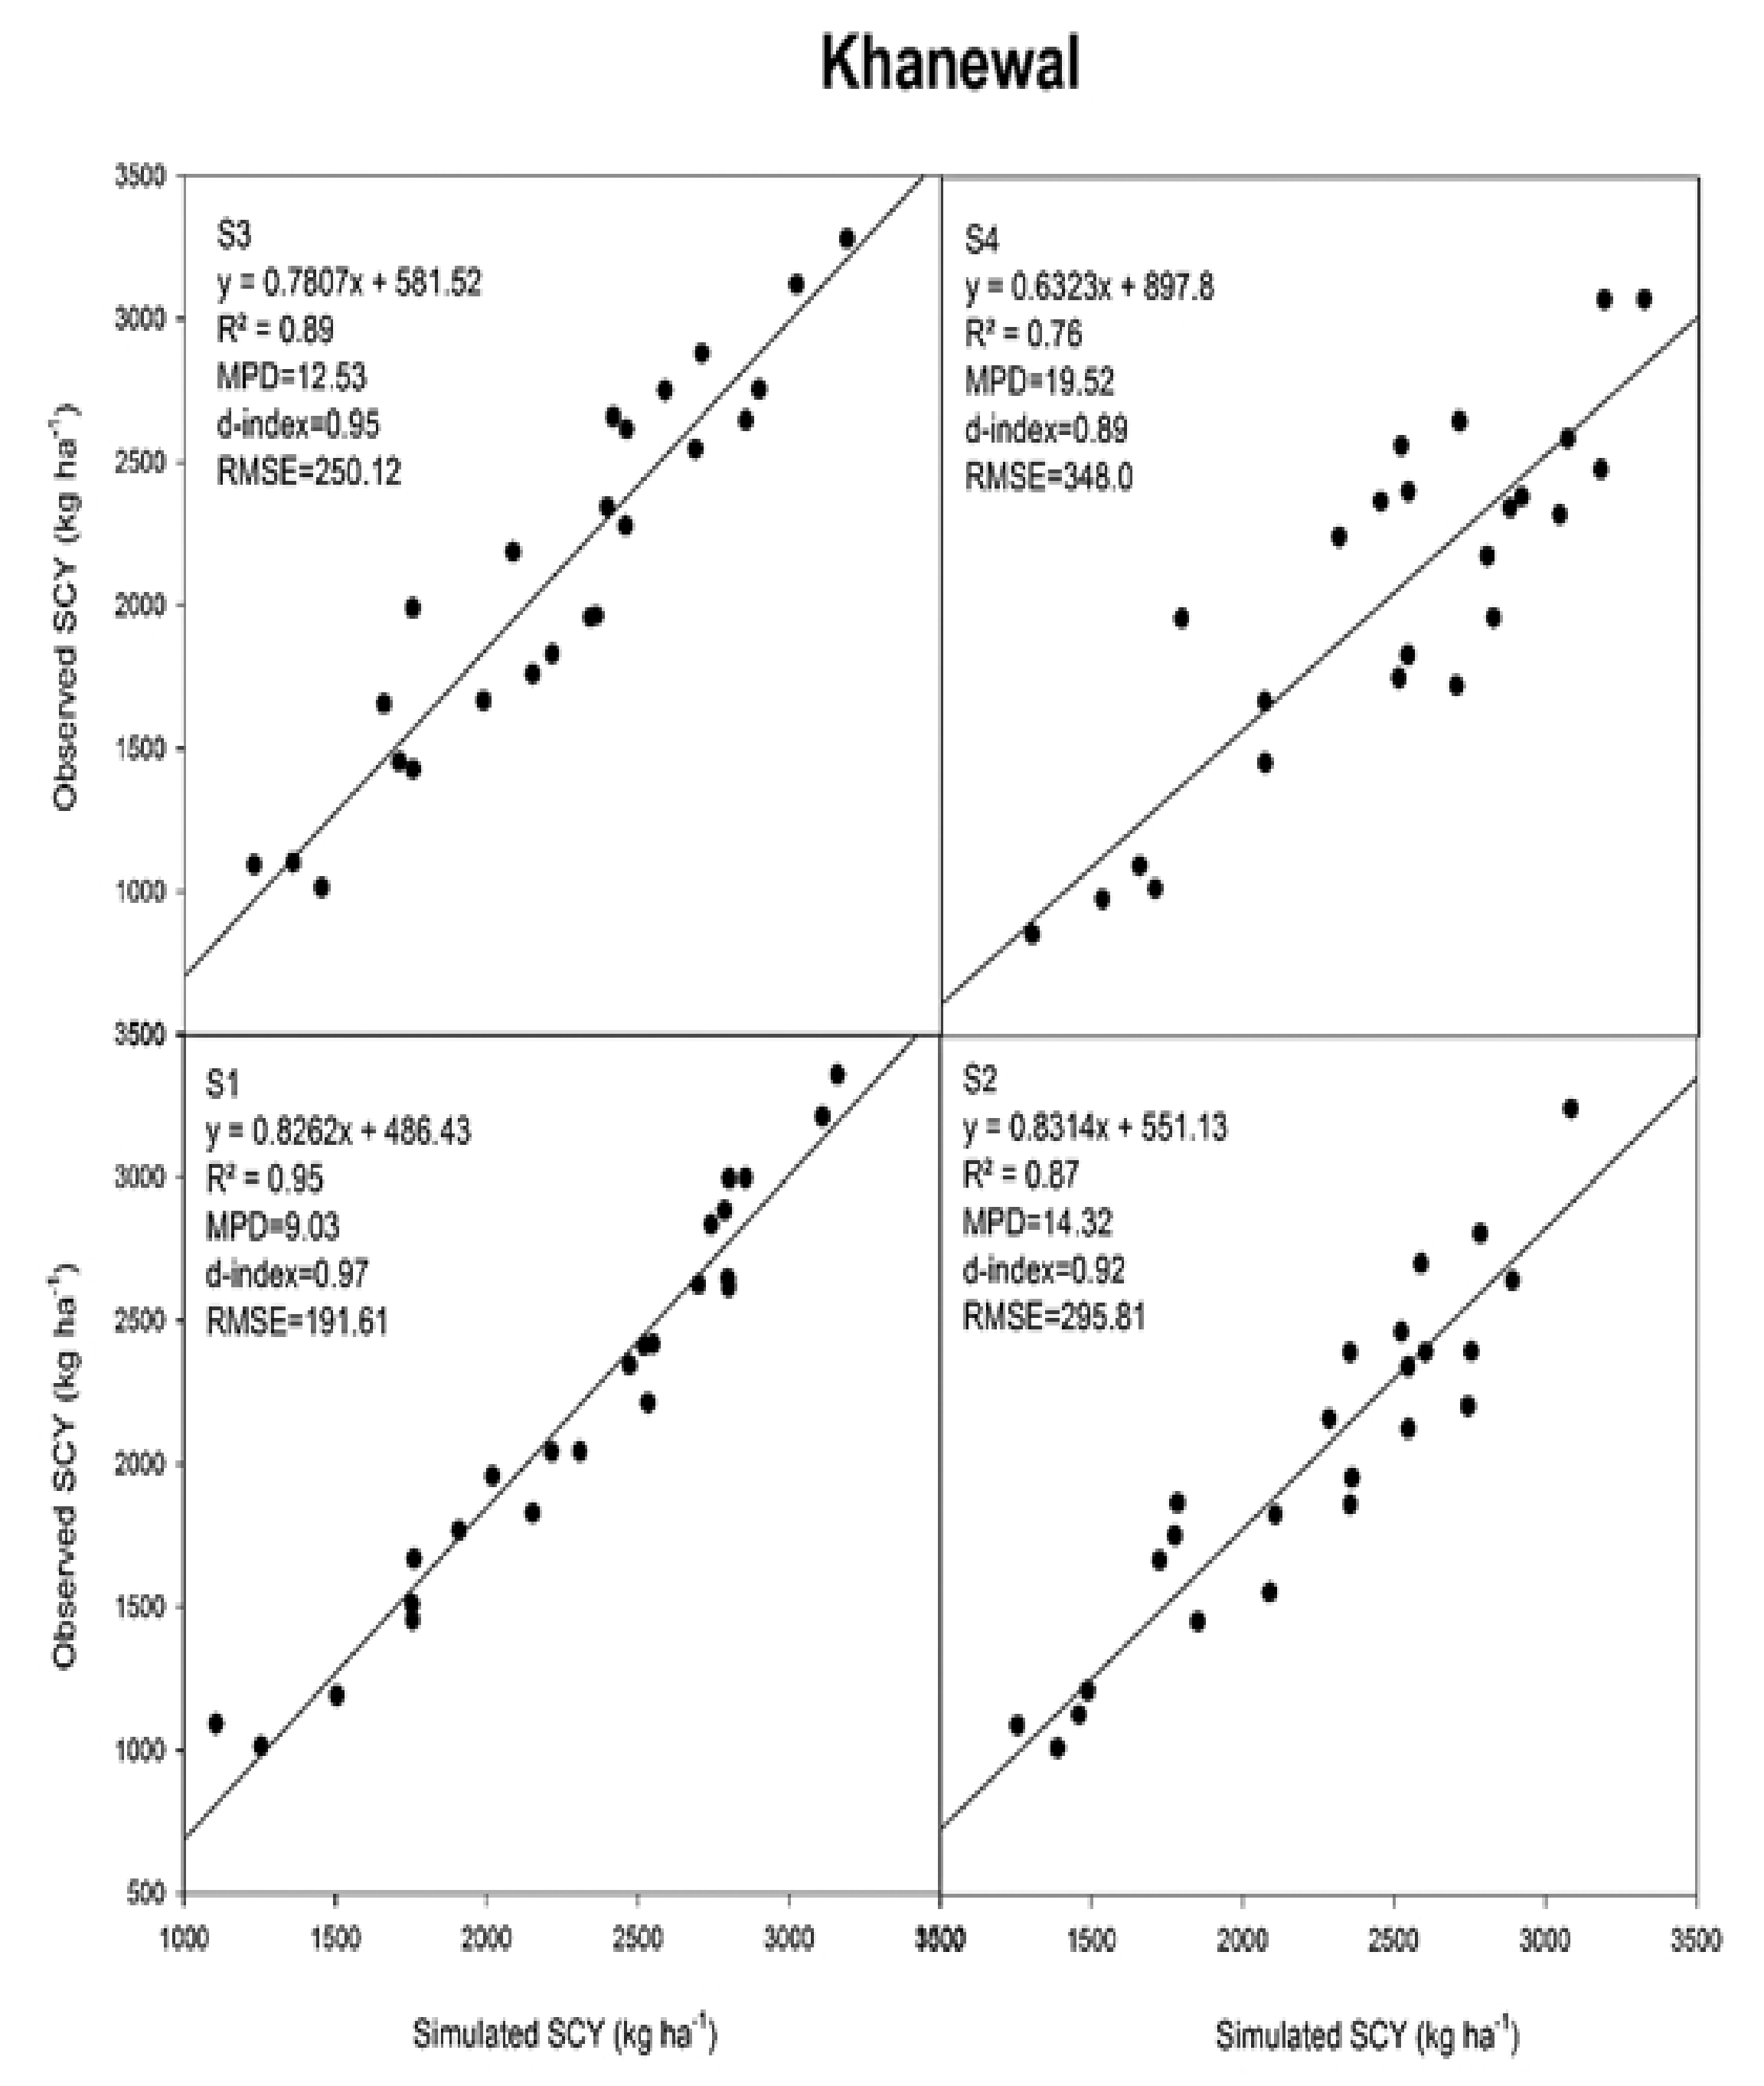
3.4. Model Validation with Surveyed Data

The surveyed data, including the crop husbandry practices of farmers in the project areas (Bahawalpur and Khanewal), were used as the input data set, and the model was validated to assess its accuracy in the farmer’s field (Figure 7). The results showed that the model accounts for the effect of crop husbandry, e.g., the differences in fertilizers, irrigation variety, and weather data for each location. The data presented in Table 8 shows that the model simulated the SCY of different cultivars well, with an average mean percent difference of −0.65% and a RMSE of 27.88 kg ha−1 for the Bahawalpur area (Table 8). Similar results were observed for the Khanewal district area (Table 9), where the MPD ranges from −4.74% to 26.52% with an average of 4.91% during the year 2018 and a RMSE of 42.06 kg ha−1. The model simulation was further assessed with the farmer data set collected during 2019. Significant results were recorded with high values of R2 and D-index and low values of error and RMSE for both the Bahawalpur and Khanewal districts (Figure 8 and Figure 9) for the year 2019.
The highest changes of the probable hot/wet climate conditions in the future may be attributed to a significant increase in maximum temperature in the May, June, and July (MJJ) months of the cotton season, with an average projected increase of 3.9 °C over the season. The highest of the changes under hot/wet conditions may be attributed to the average increase of 4.5 °C in the MJJ months of the cotton-growing season under the RCP 8.5 scenario. The output of the GCM Geophysical Fluid Dynamics Laboratory Climate Model (GFDL-CM3) was selected for the study. This model predicted the highest change in Tmax and Tmin for the project area, as clear from Figure 10 and Figure 11.
The results of the calibration and evaluation with an experimental data set and further validation of the model at the farmer’s field showed that the CS
M-CROPGRO-Cotton in the shell of DSSAT can be used for assessing the impact of climate change on cotton productivity and the optimization of crop production options for current and future climatic conditions.

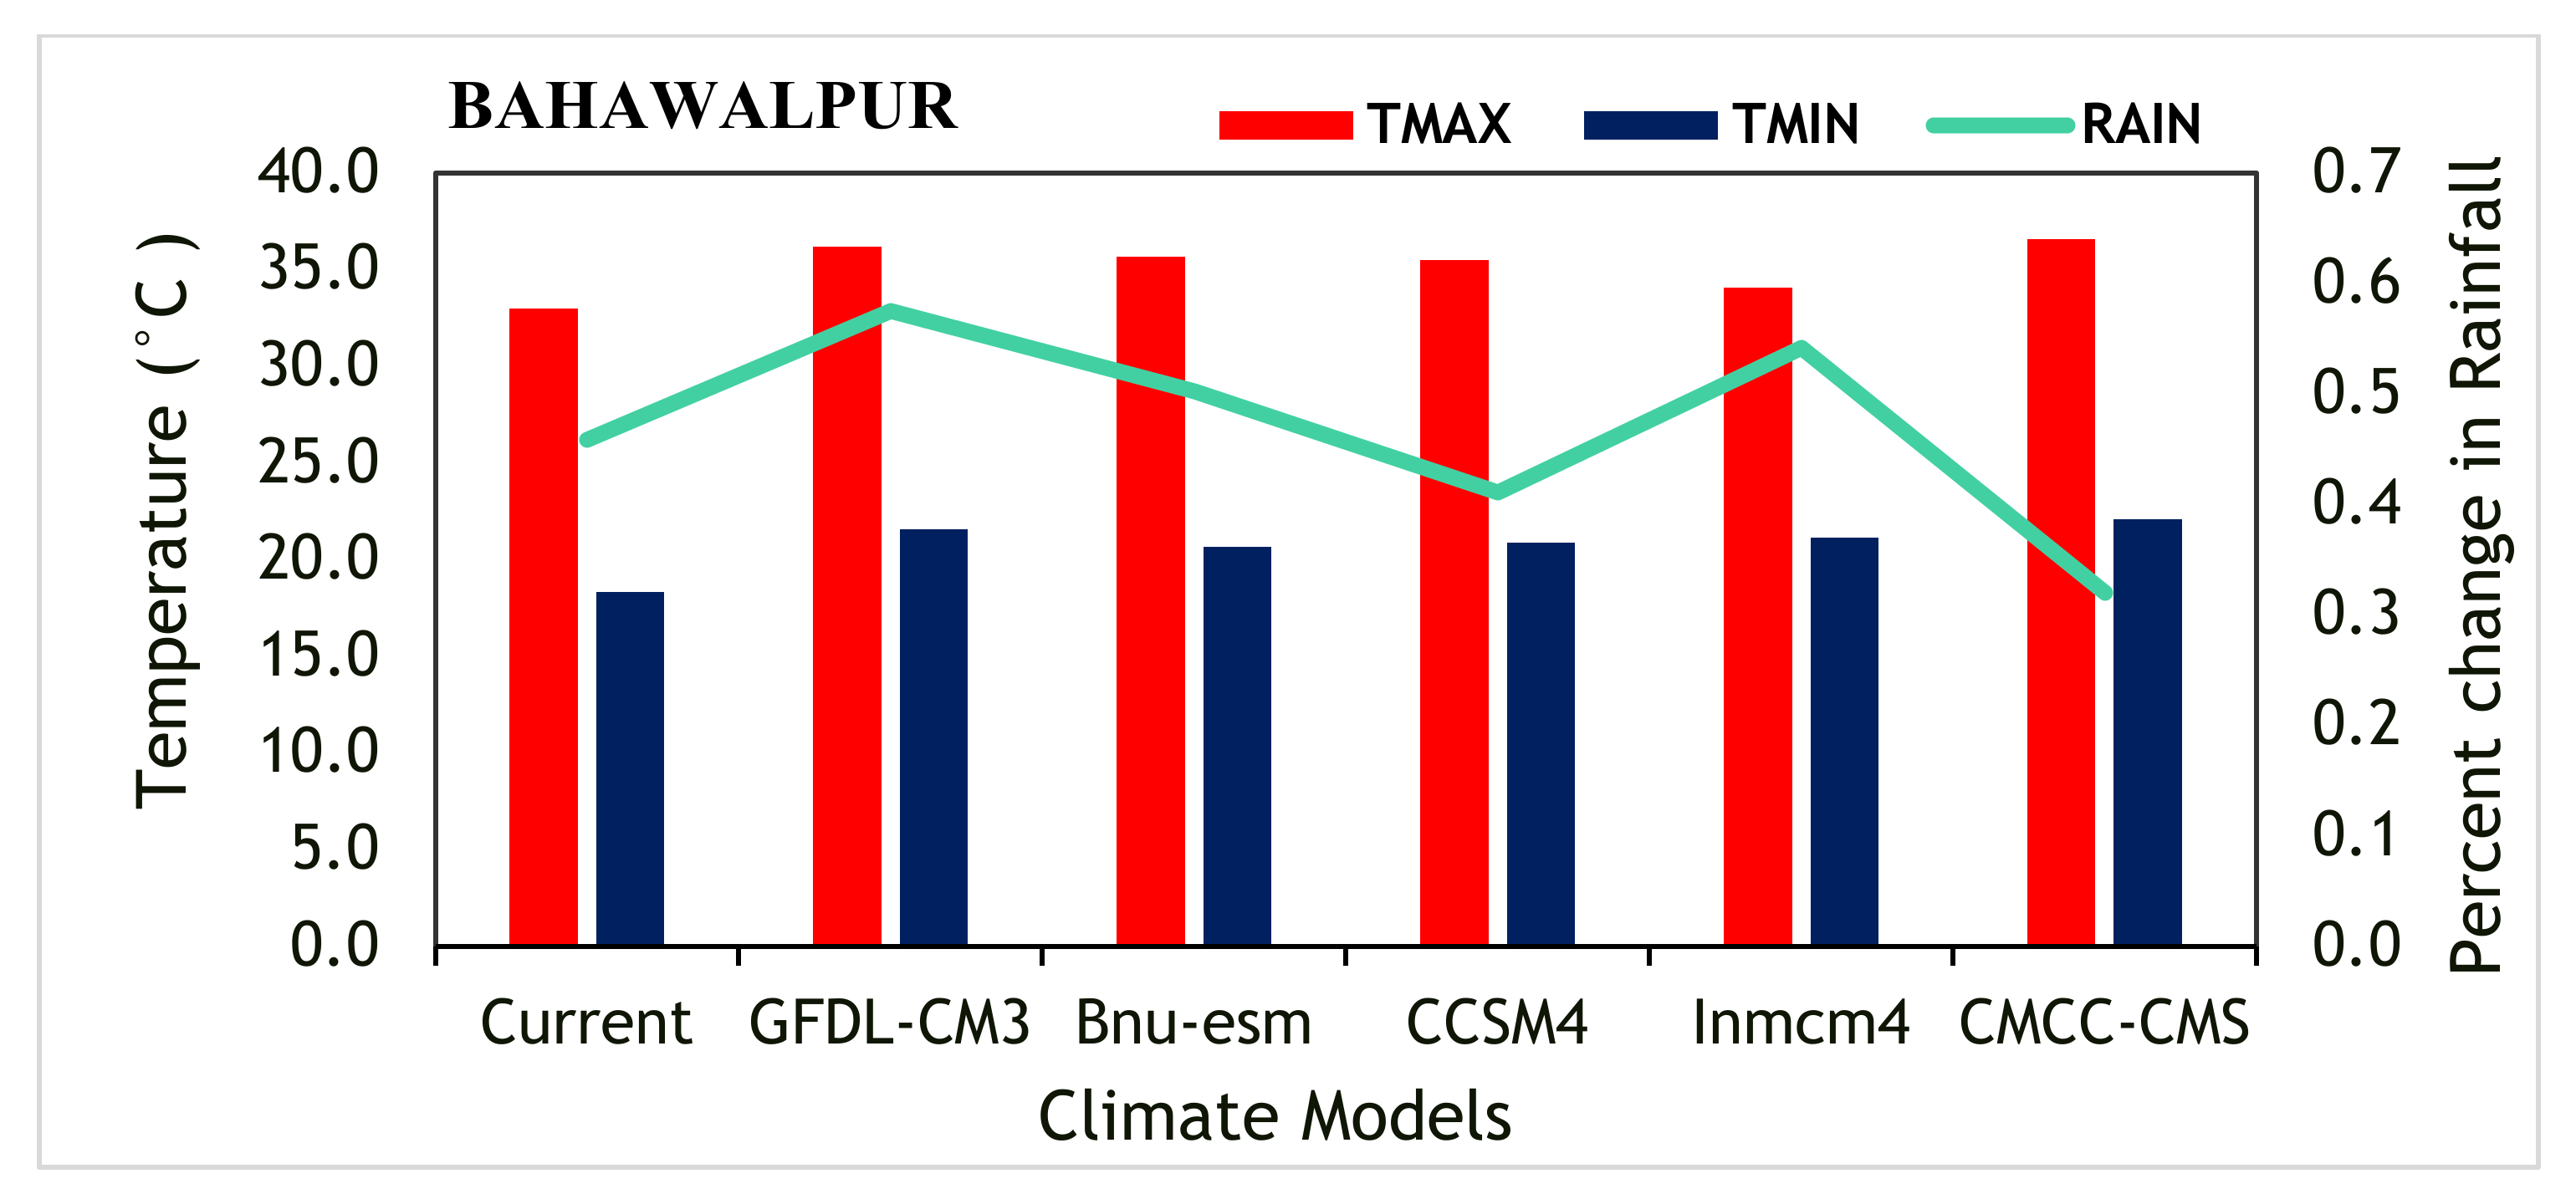
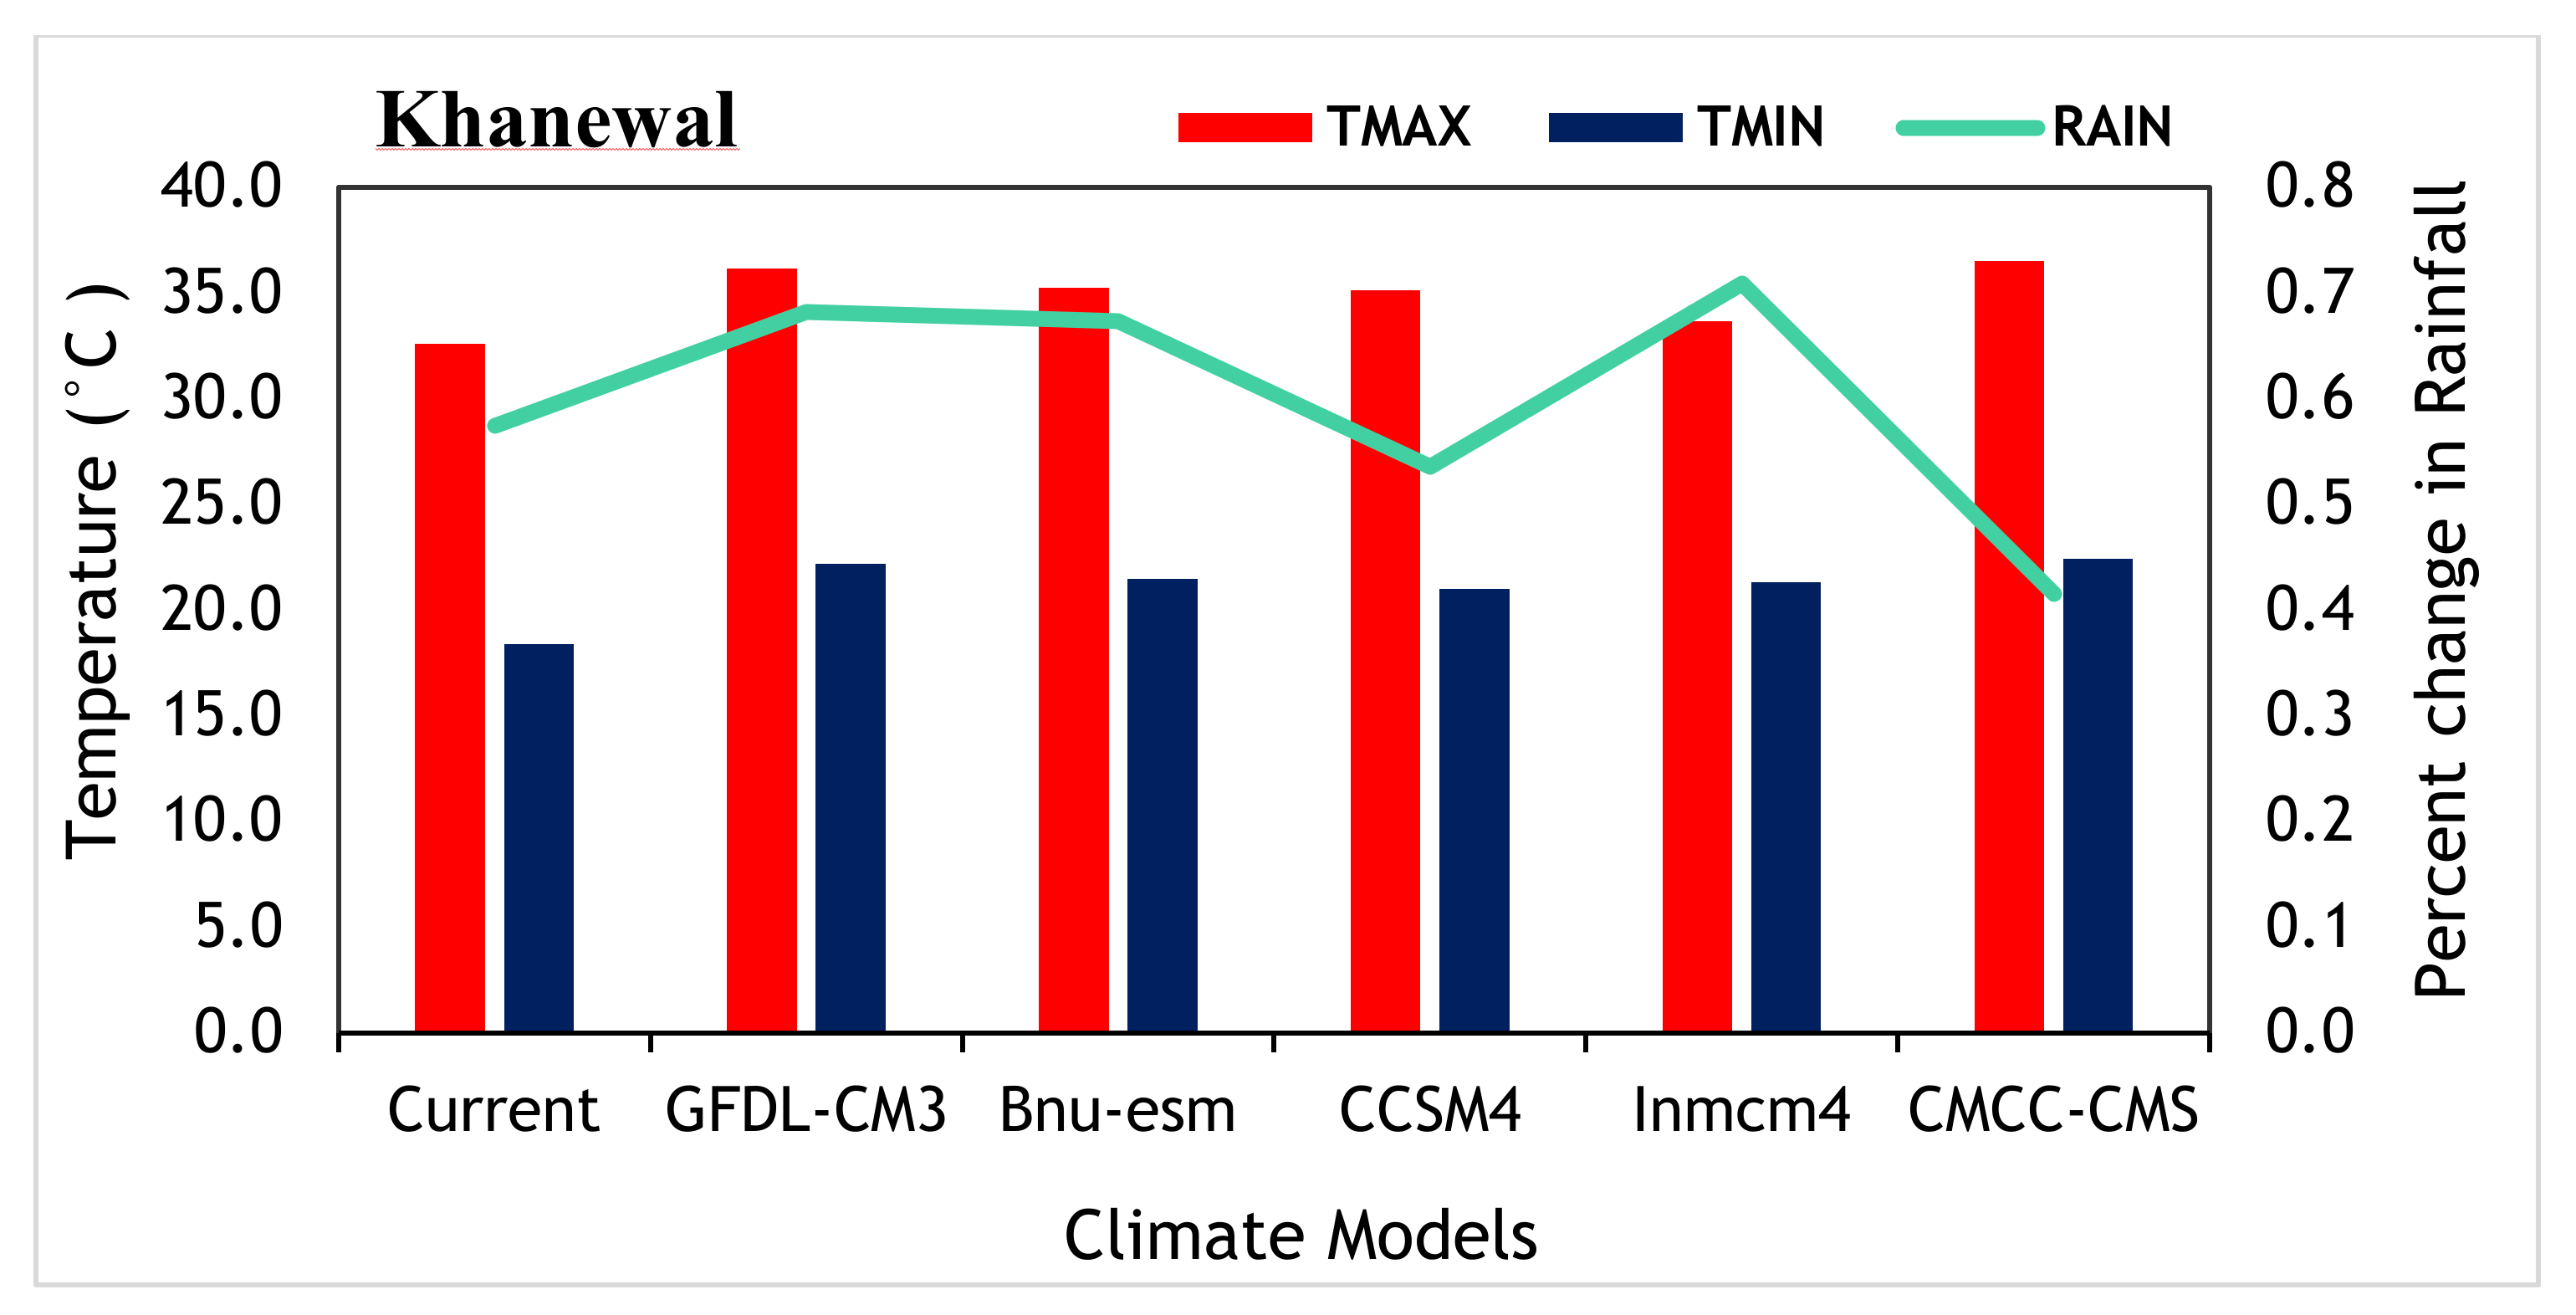
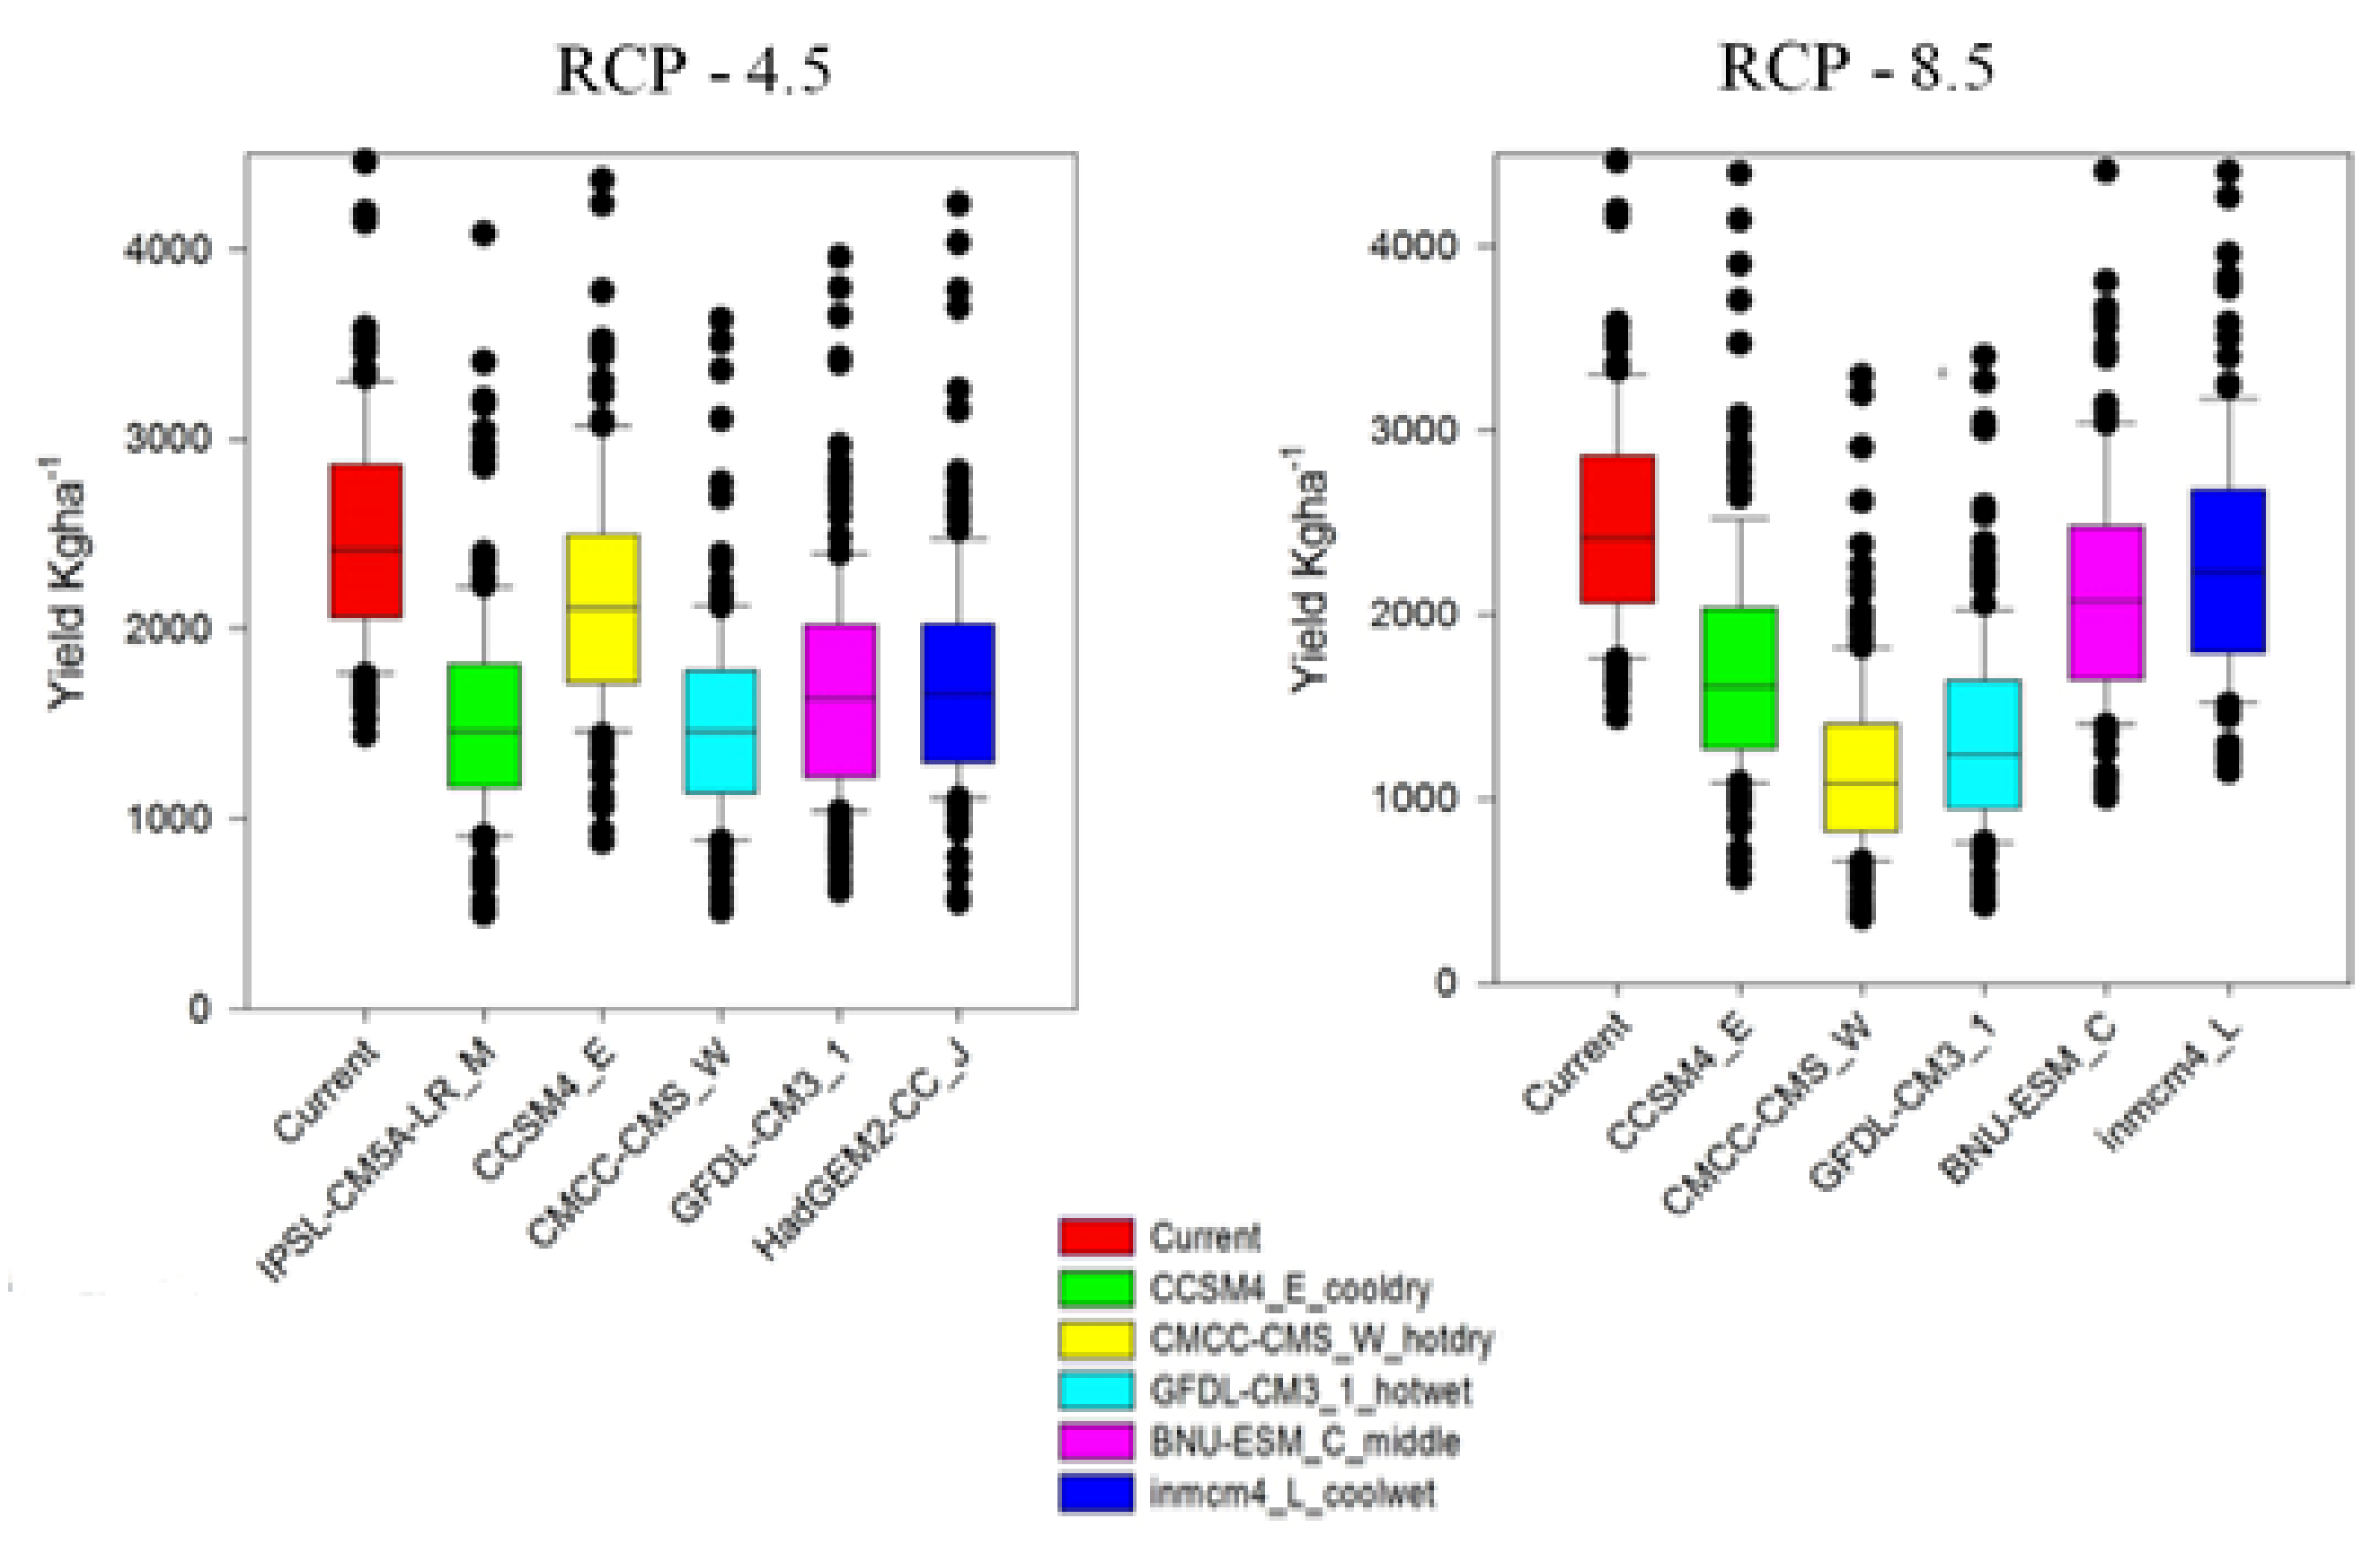
3.5. Impact of Mid Century (2040–2069) Climate Change Scenarios

The current crop area and production in the project are presented in Table 10. The crop husbandry parameter used in the X-build file is given in Table 11. The comparison of baseline and future simulations showed that climate change would reduce cotton yield (Figure 12). After the calibration and validation of experimental and survey data, the model was run with thirty years of historical climate (1989–2019) data for simulations for the development of baseline and generated data GCM (GFDL-CM3) for the years 2040–2069 under RCP 4.5 and 8.5 for future climate change scenarios (Table 12 and Table 13).

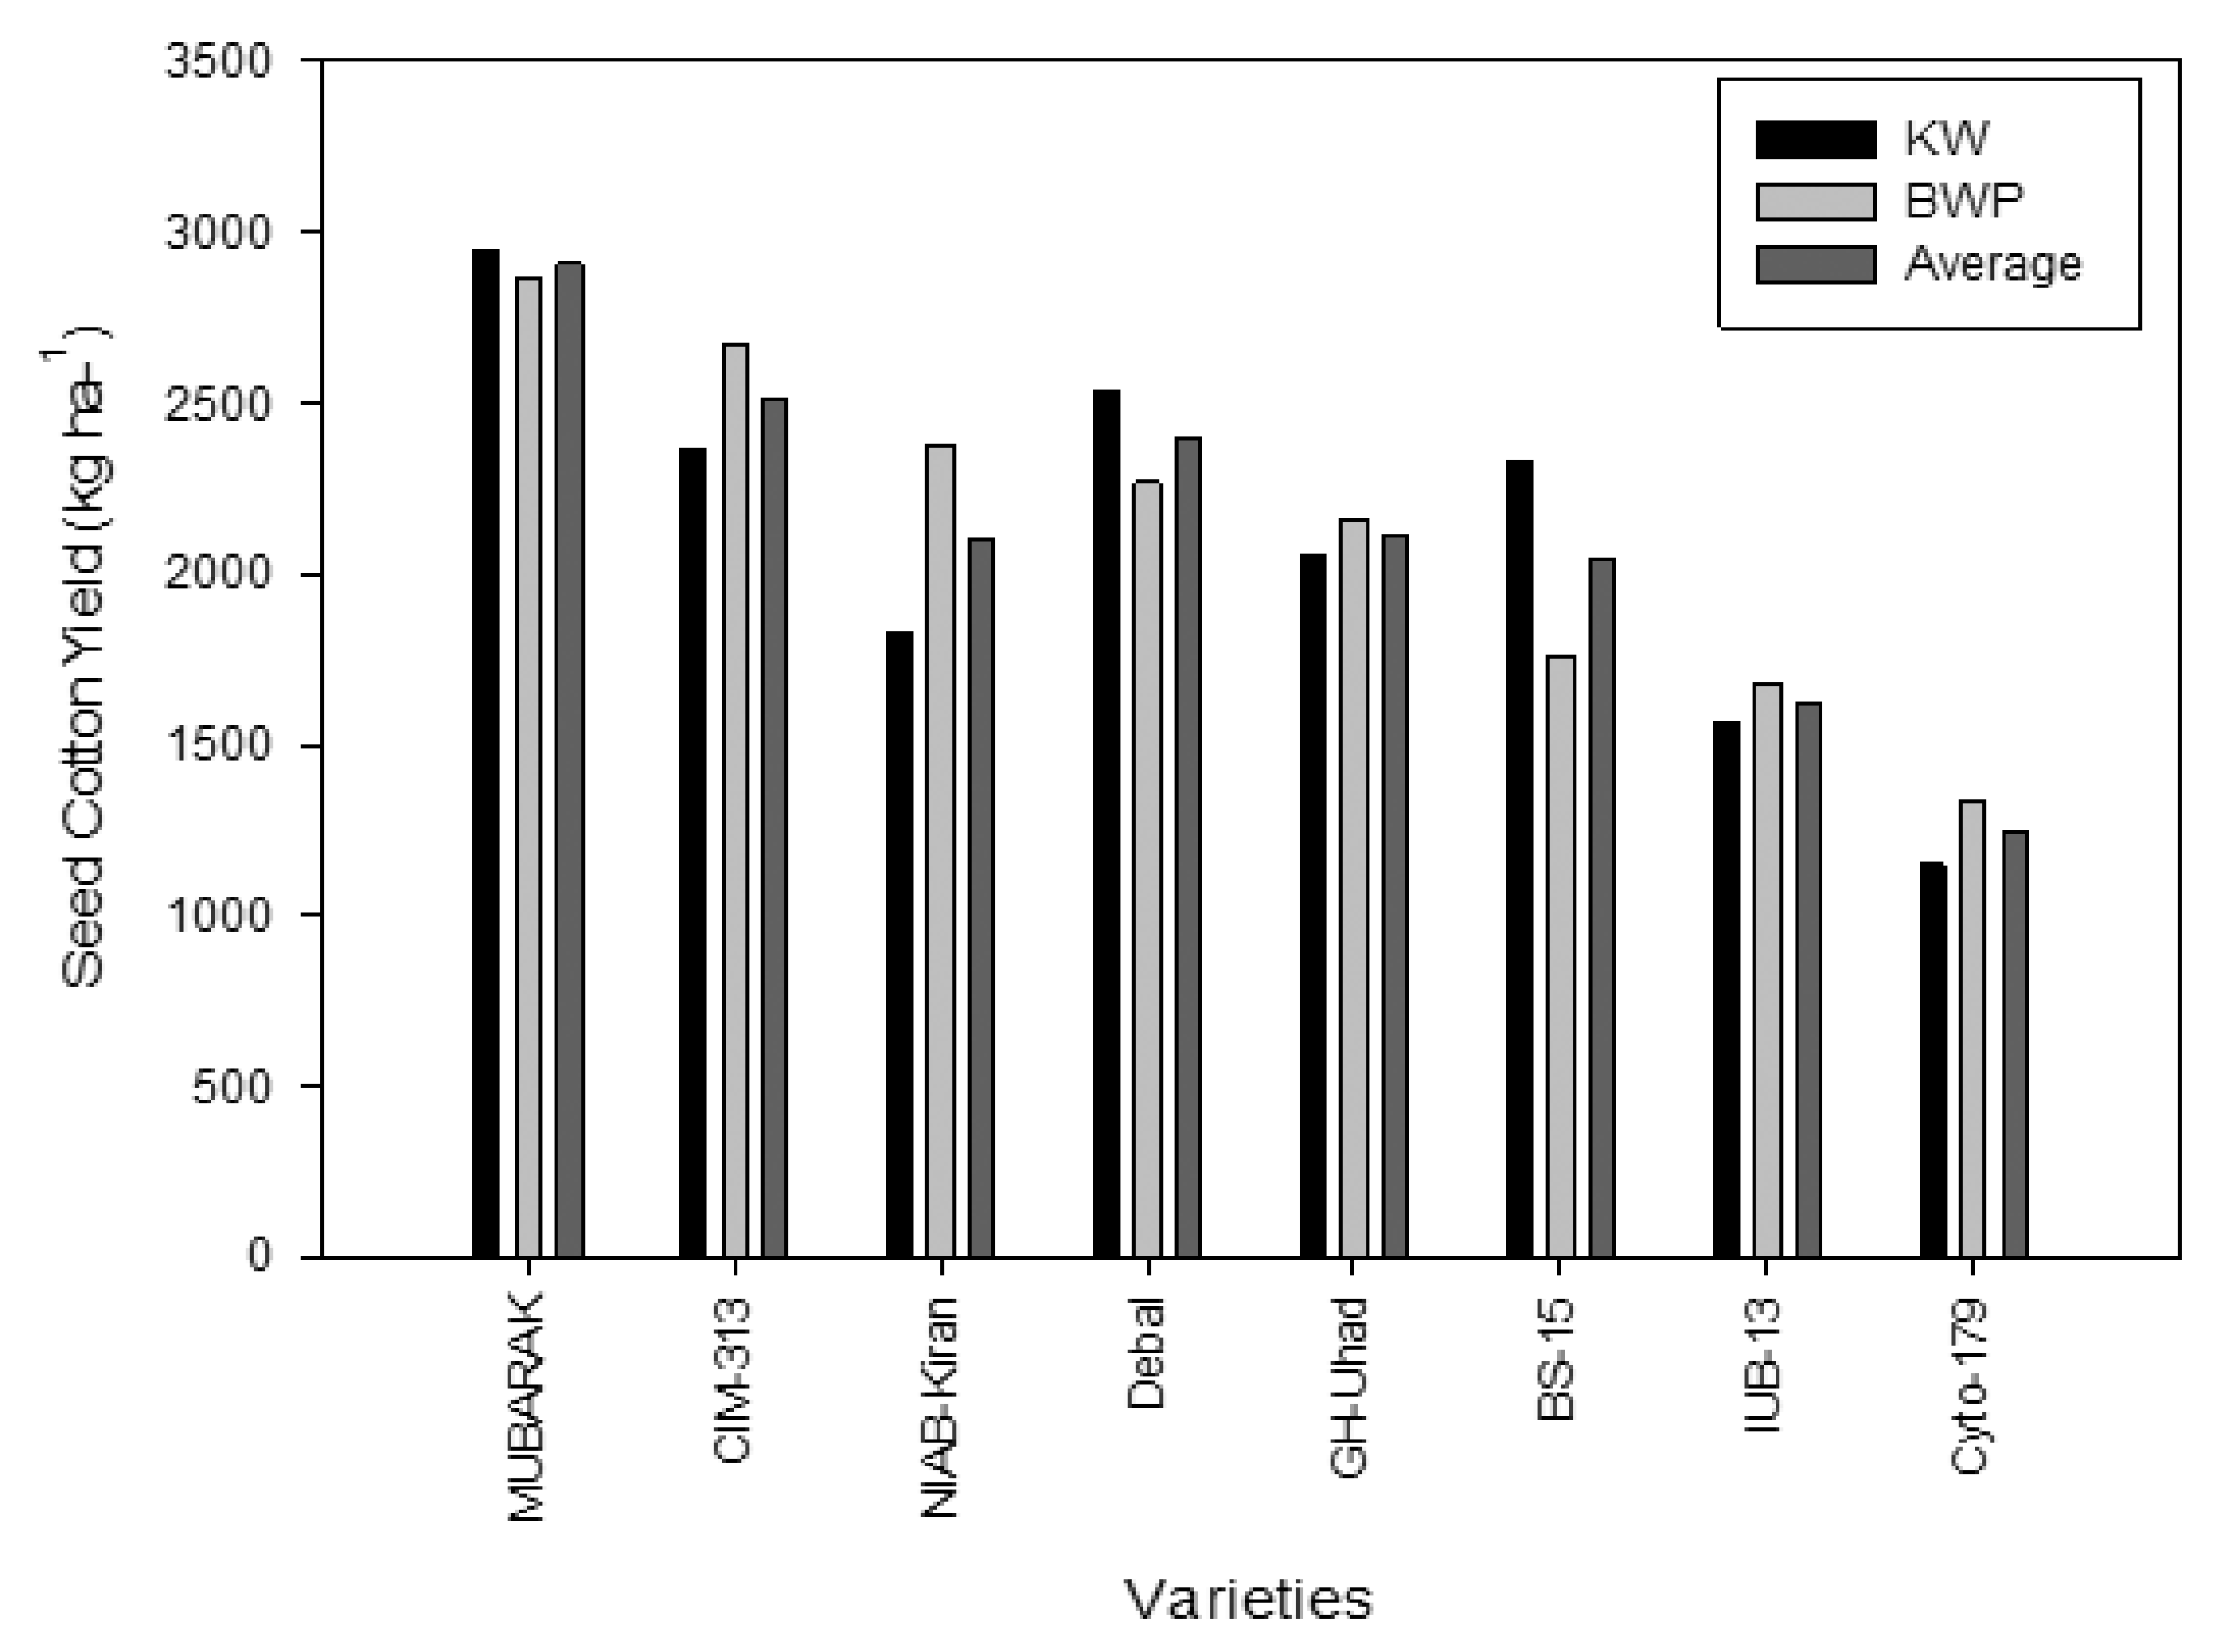
3.6. Selection of Suitable Variety

A comparison of cotton verities showed that Mubarak and Debal perform better than other varieties at the Khanewal location, while Mubarak and CIM-313 perform better than others at Bahawalpur. However, Mubarak performs better at both location and produce SCY 2907 kg ha−1. The poorest performance (1244 kg ha−1) was observed in Cyto-179 (Figure 13).

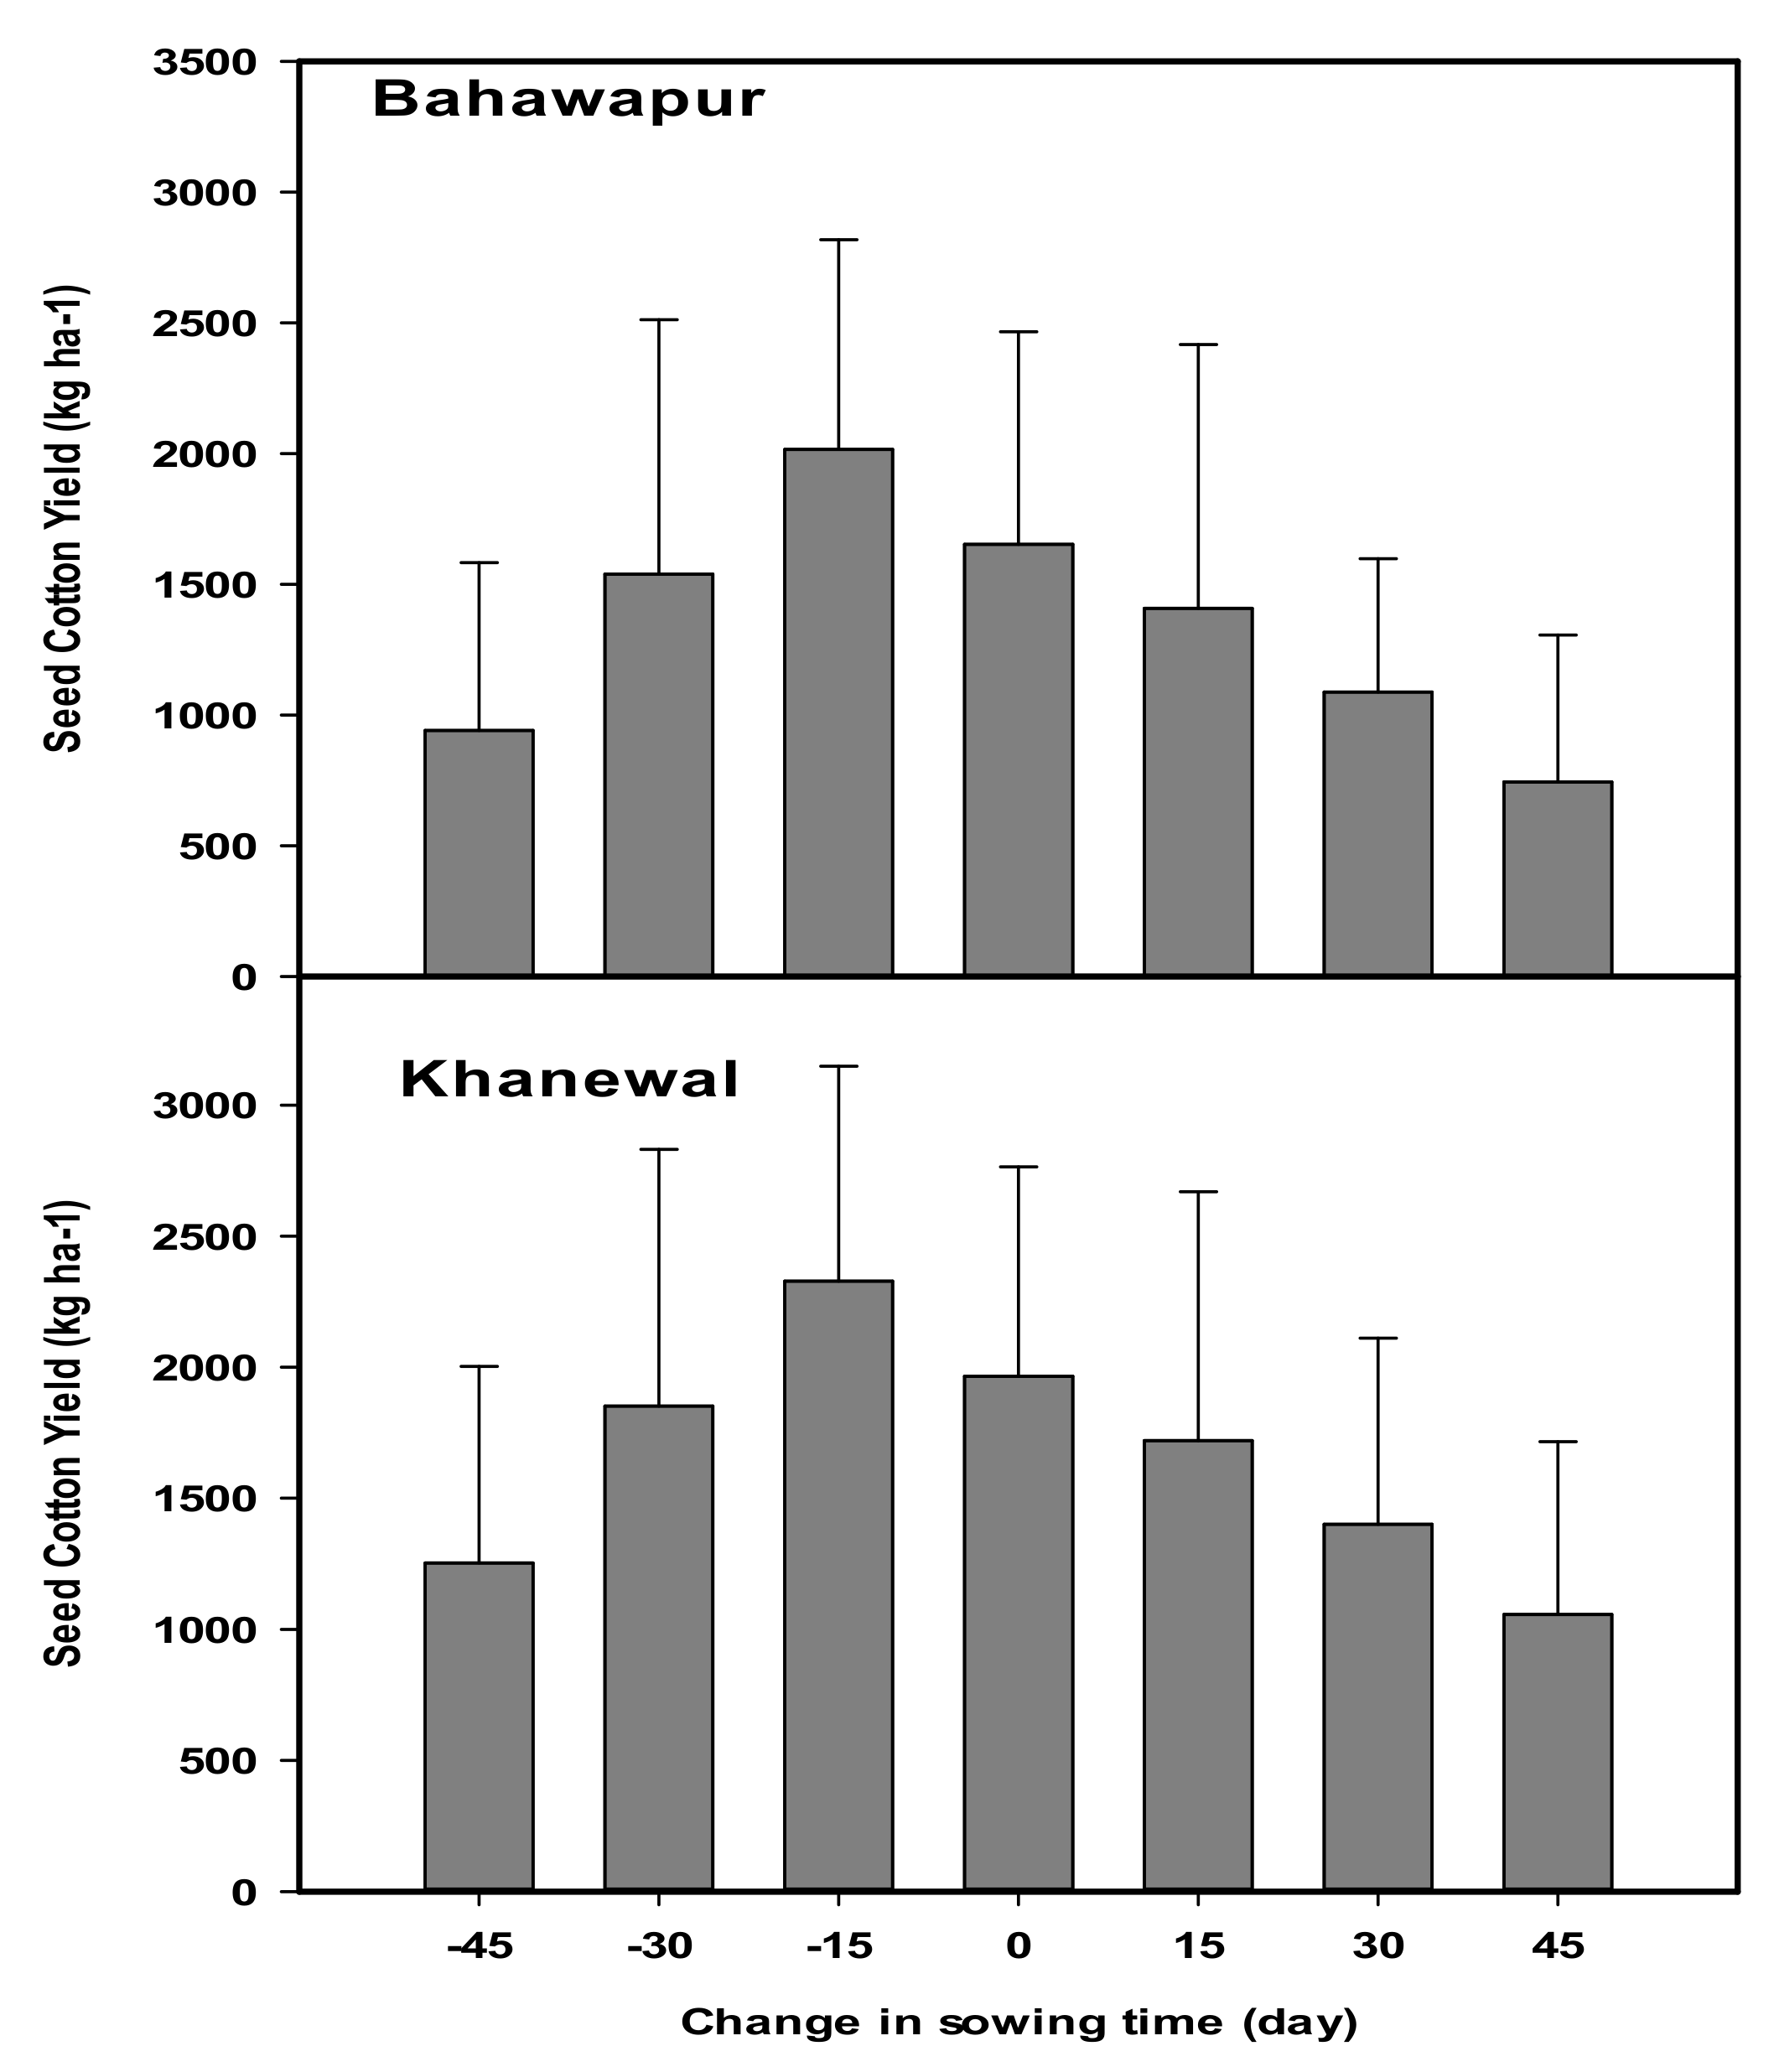
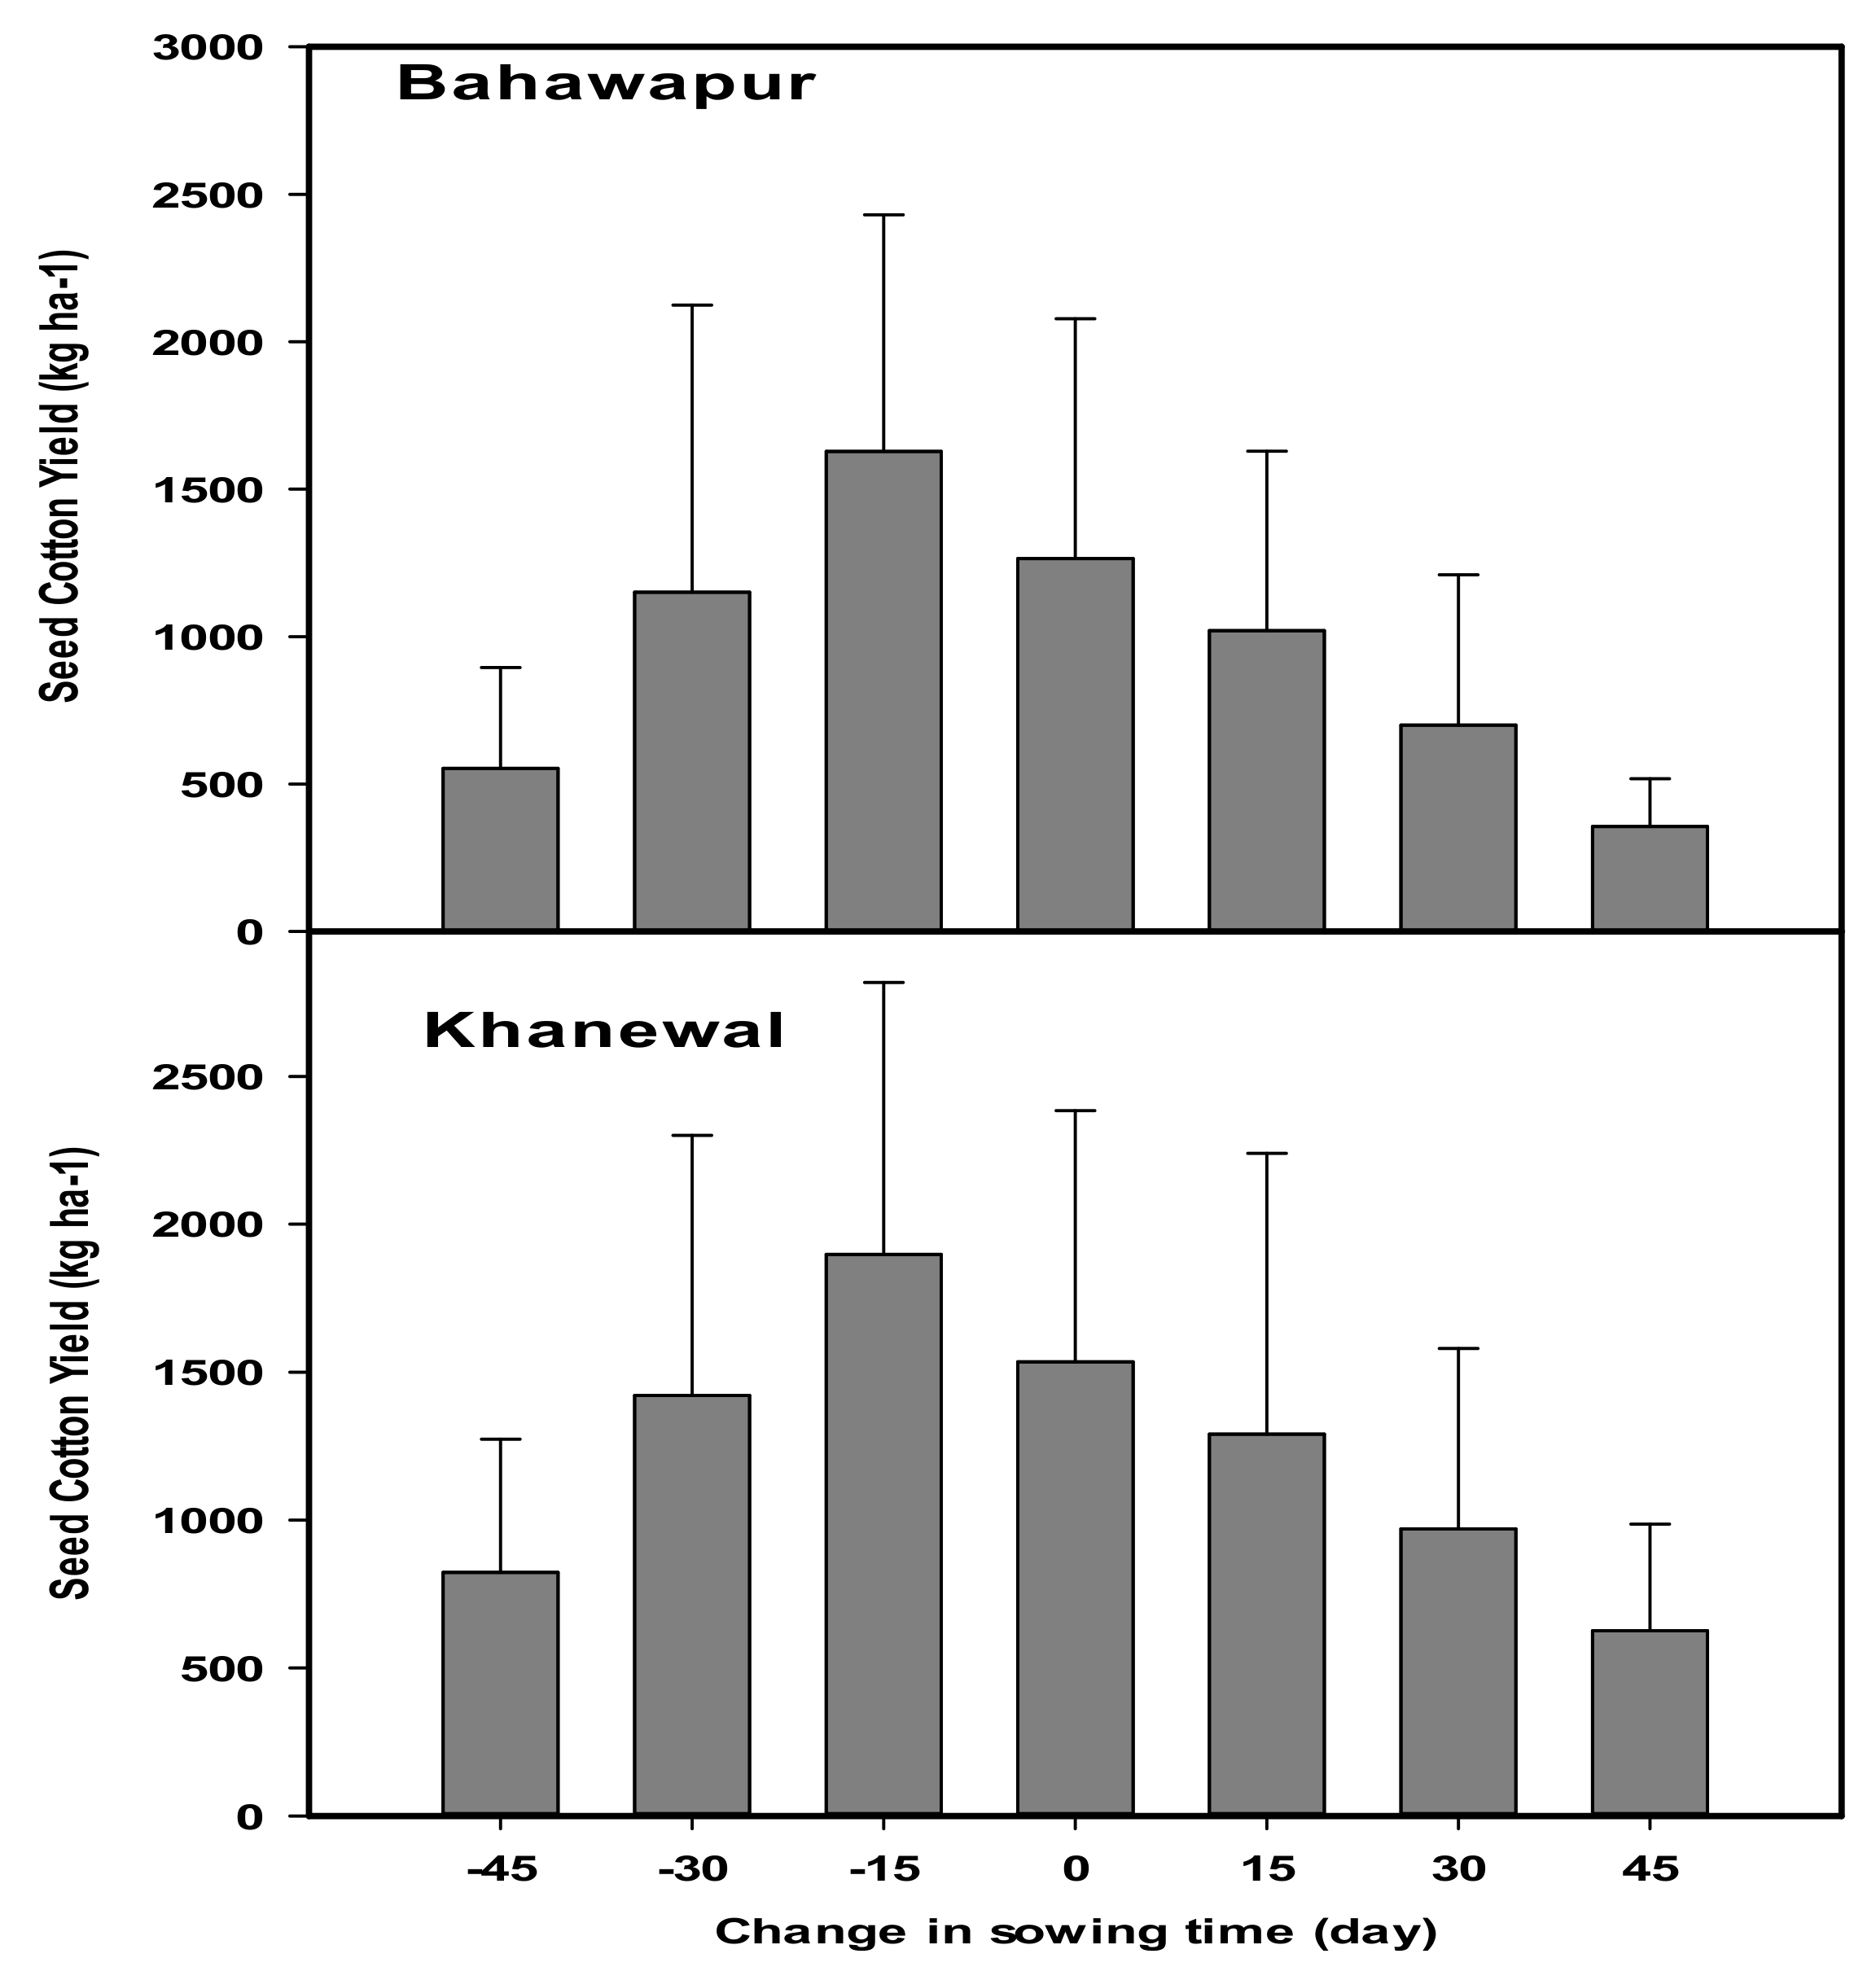
3.7. Optimization of Planting Time

The same behavior was shown by different varieties against planting dates. So the better performing variety Mubarak was used in further simulations for the development of the adaptation package. The model was run with seven planting dates (−45, −30, −15, 0, +15, +30, and +45) with an interval of 15 days. The current sowing date was 15 May (0). The model was run with 30 years of climatic data (2040–2069) generated by GCM (GFDL-CM3) for mid-century scenarios under RCP 4.5 and 8.5. The results showed that planting 15 and 30 days earlier would be the best strategy for both locations under RCP 4.5 and 8.5 (Figure 14 and Figure 15).

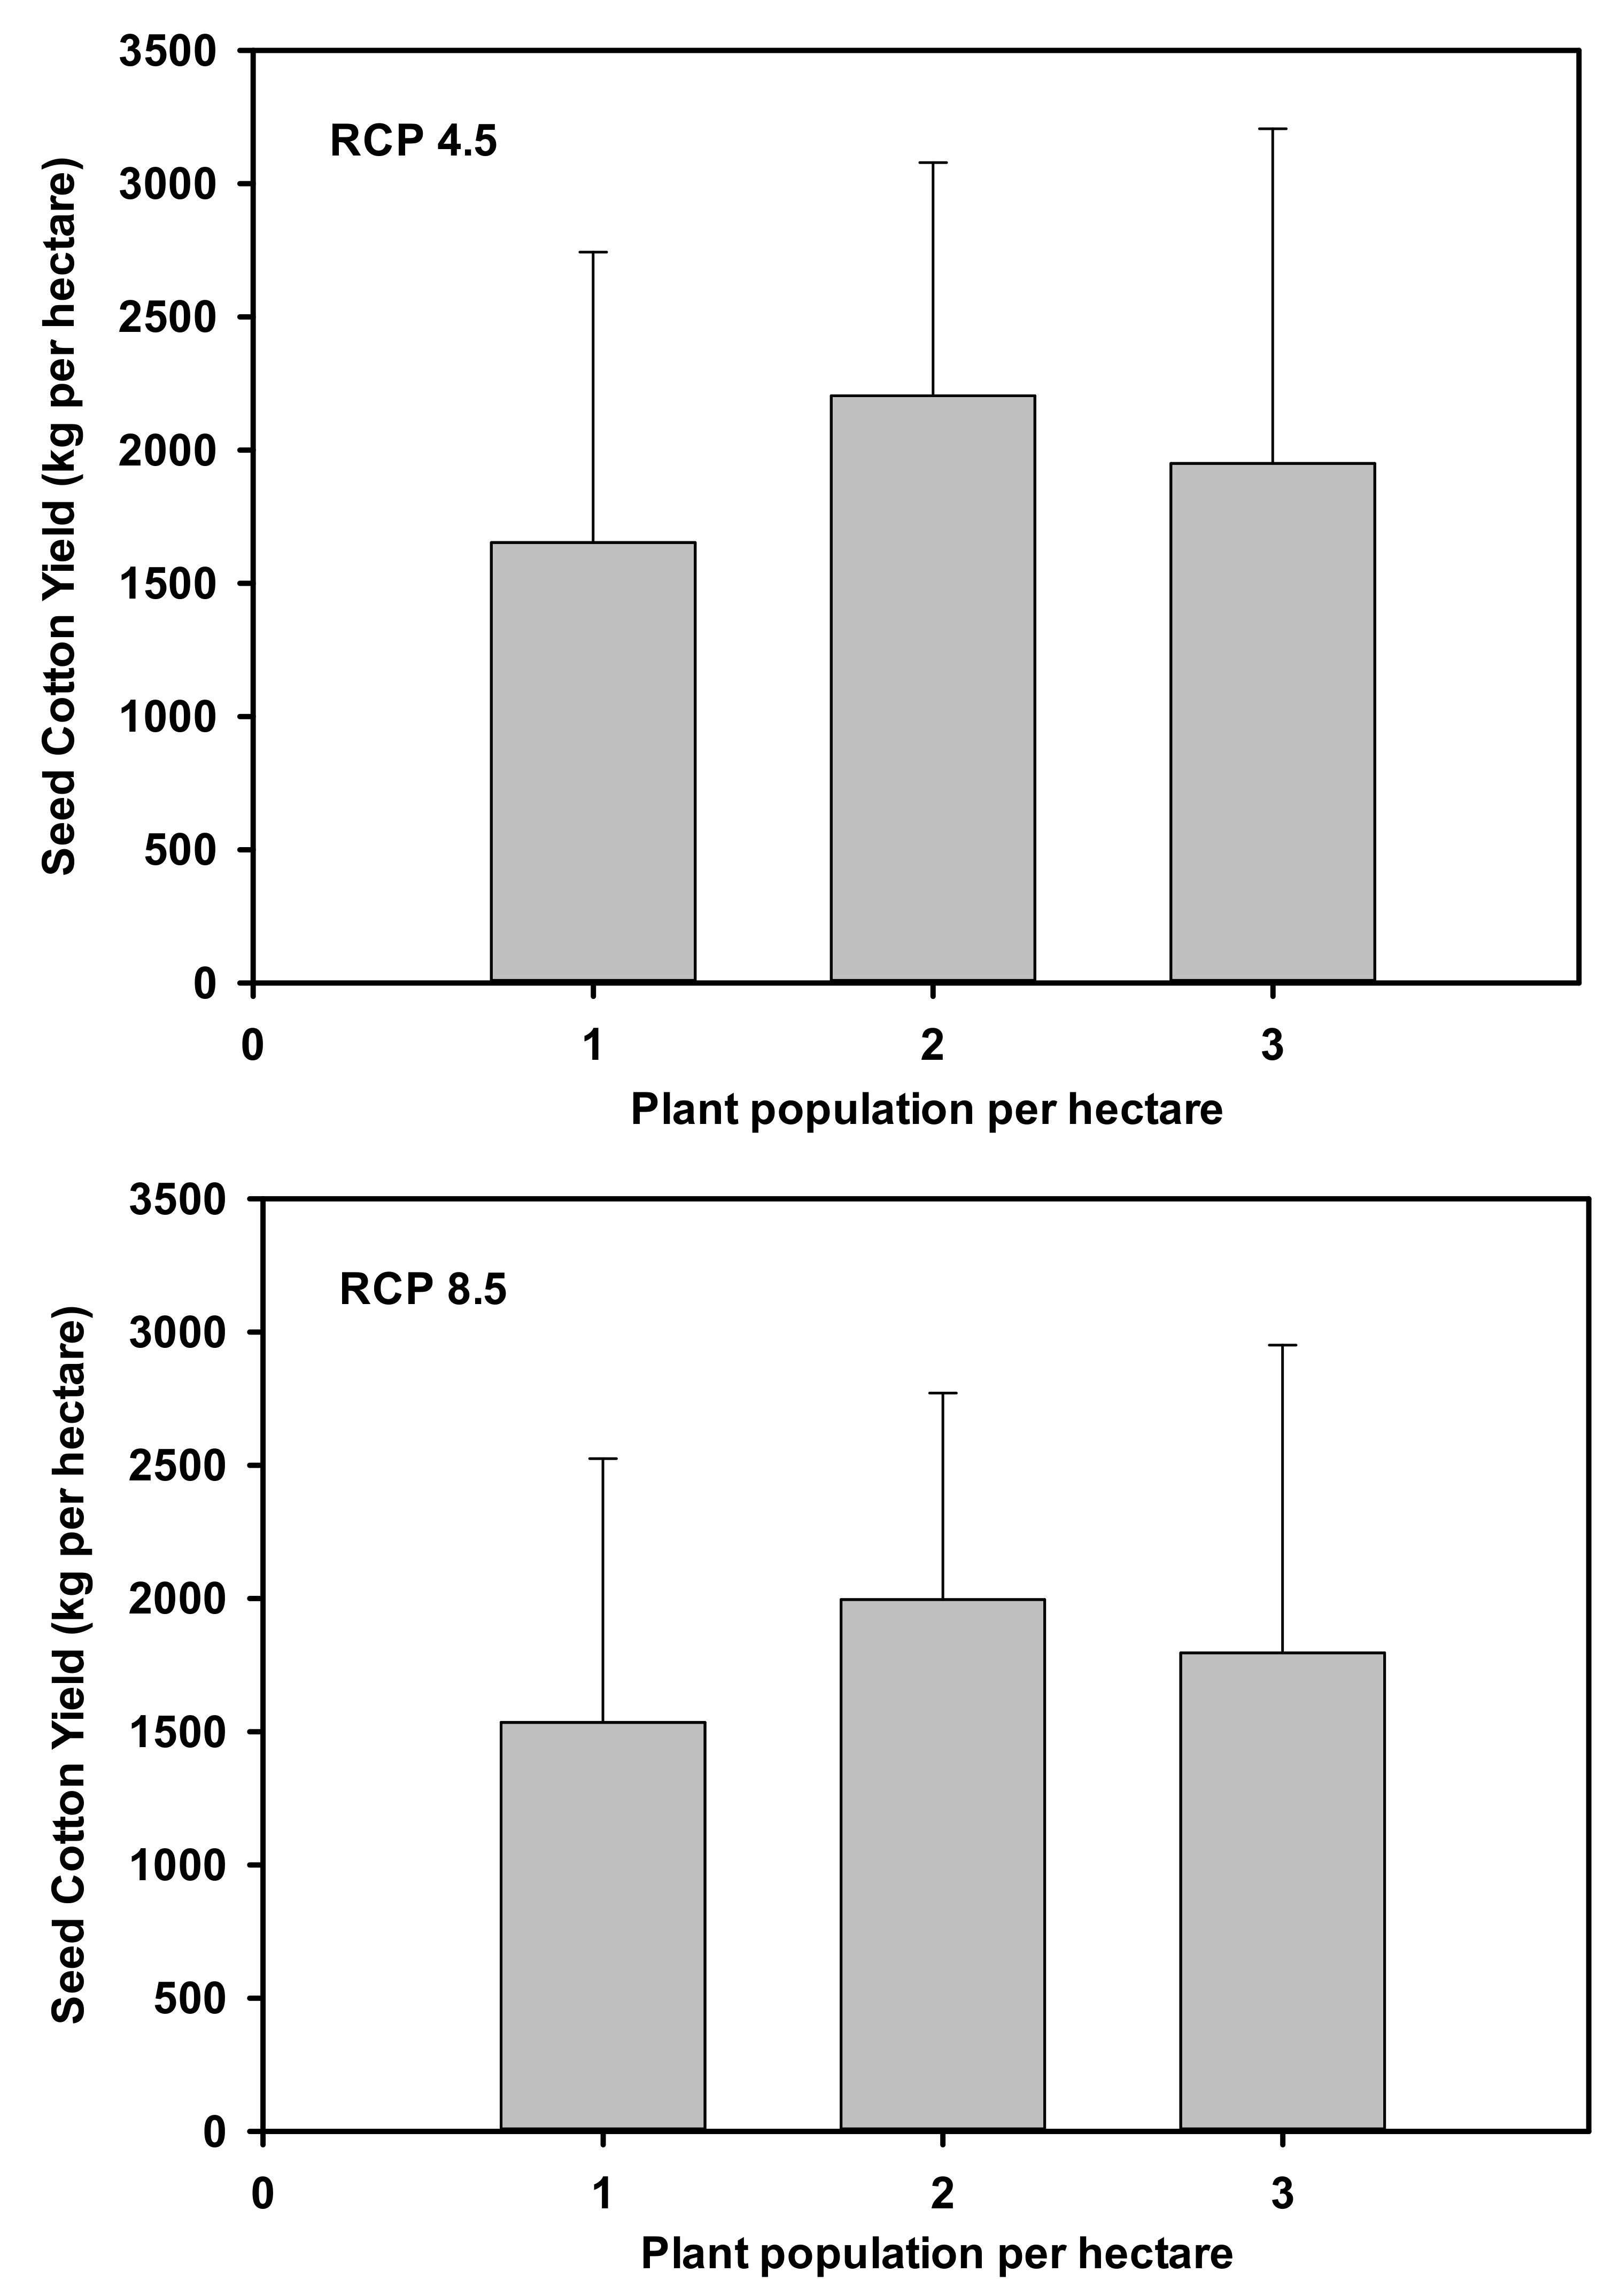
3.8. Optimization of Planting Density

The model was run with three planting densities (46,500, 62,000, and 93,000 plants per hectare) developed by varying plant-to-plant distances (15, 22.5, and 30 cm) in the field. The results showed that under future climate scenarios, 62000 plants per hectare will maximize the SCY during 2040–2069 under both RCP 4.5 and 8.5 in the project area (Figure 16). A further increase in plant population per unit area will increase the plant-to-plant competition for nutrition, space, light, air, etc. and decrease the yield.

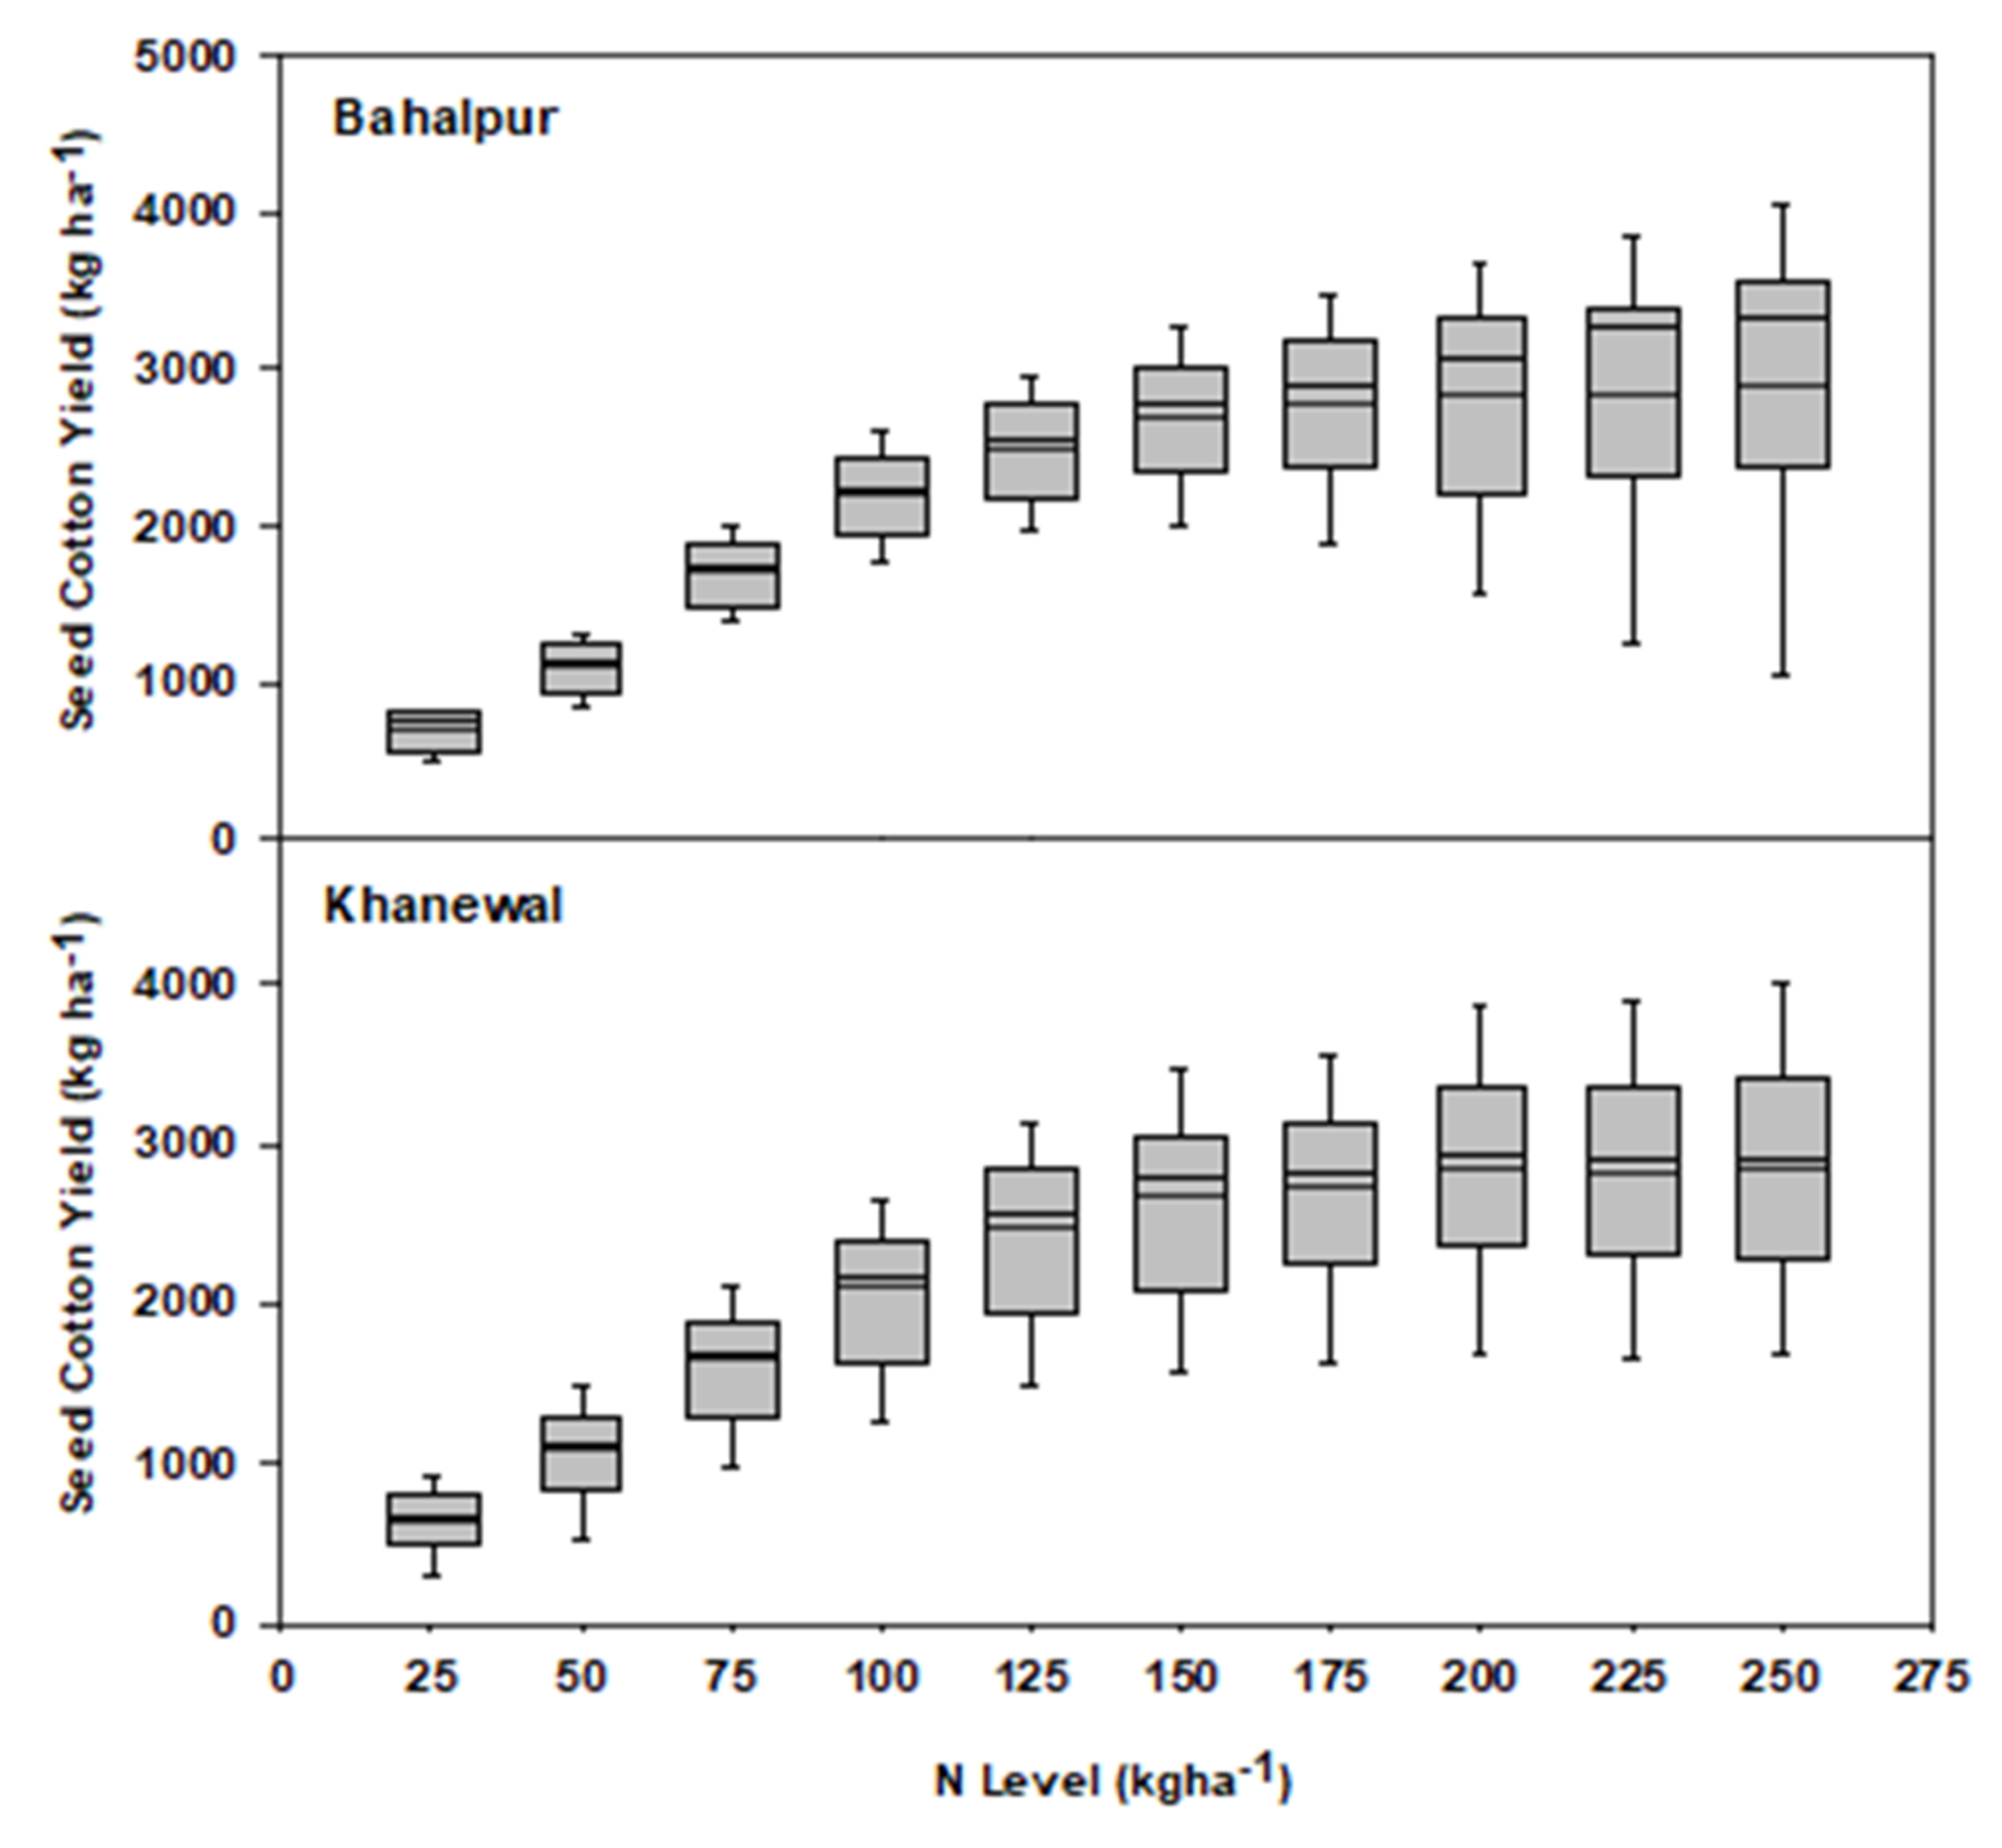
3.9. Optimization of Amount of Nitrogen

Nitrogen (N) is an essential nutrient for better crop growth, and our soils are deficient in organic matter and nitrogen. During the early crop season, the cotton zone faces high temperatures and less rainfall. These arid environmental conditions reduce the organic matter and nitrogen in these soils. Keeping in view the importance of nitrogen, the model was run with ten nitrogen levels (25, 50, 75, 100, 125, 150, 175, 200, 225, and 250 kg ha−1) to discover the optimum rate for better cotton production. The results showed that nitrogen application had a linear relationship with SCY until 150 kg N ha−1. After that addition, the crop yield is not effected (Figure 17). It can be concluded that 150 kg N ha−1 will be the best strategy for maximizing crop yield under future scenarios at both locations.

3.10. Adaptation Package for Climate-Resilient Cotton Production

Agricultural production systems are complex, interlinked, and dependent on various factors. Crop production is the climate-prone sector of the economy. The anticipation of and adaptations to climate change are important. There are certain planned and unplanned adaptations regarding climate vulnerability in agricultural systems that maintain the balance in the ecosystem and minimize economic losses. The policies regarding high development must have a synergy effect with climate change for the better adaptive capacity of the nation. To minimize the climate losses, there can be adaptation strategies on farm/regional and national levels. After doing the above sensitivity analysis against different production options, a biophysically viable adaptation package was developed for the climate-resilient cotton production in the area (Table 14). To make the adaptation package more reliable, the model was run with 30 years of climatic data (2040–2069). The results showed that with the adoption of this package, there will be 11% benefits over baseline and 33% recovery of climate change damages under RCP 4.5 projections (Table 15). The model was run with 30 years of future climate data for 2040–2069 under RCP 8.5 for the evaluation adaptation package. The results showed that the package will help the farmers increase crop yield 7.5% over baseline yield and help recover 37% of the damages due to climate change RCP 8.5 projections (Table 16).

4. Discussion

CROPGRO-Cotton in the shell of DSSAT has been tested by researchers for the growth and yield simulation of crops sown under different climatic conditions with different crop management practices [13,25,33,34,35]. These studies concluded that CROPGRO-Cotton is capable of estimating climatic impacts on cotton crops. The estimation of climatic impact and possible adaptations for Pakistani cotton with the model are vitally important. The CSM-CROPGRO-Cotton model was well parameterized using the data of field trials conducted at the University of Agriculture, Faisalabad and the surveyed data of farmers’ fields at the Bahawalpur and Khanewal districts of Punjab-Pakistan. The Model performed well during the calibration for all studied parameters presented in Table 5. The lowest percent error showed a low variation between the observed and predicted values, which indicates the accuracy of the model during calibration. The slight over-prediction in days to flowering, TDM accumulation, and SCY and the under-prediction in days to physiological maturity and LAI might be due to the poor prediction of seedling emergence at lower soil temperature. The model computed soil temperature from the air temperature for the upper soil layer, while in deeper layers it was computed from the annual air temperature [10]. The model simulated fairly well the dynamics in SCY and TDM for most of the planting dates. Similar performance of the model was also reported by Wajid et al. [36] for SCY with lower MPD values of 5.30% and 4.38% during the calibration and evaluation, respectively, while he was studying the impact of the planting date on cotton performance. Furthermore, an analysis of seasonal simulations exposed that late planting had increased the risk of obtaining very low SCY. This risk was generated by climatic conditions such as lesser solar radiation and variations in temperature, precipitation, and photothermal units when planting was too late and too early (Table 8 and Table 9).
The model validation with surveyed data including the crop husbandry practices of farmers in Bahawalpur and Khanewal showed that the model accounts for the effect of crop husbandry, e.g., differences in fertilizers, irrigation variety, and weather data for each location (Figure 6). The comparison of values showed that the model simulated the SCY of different cultivars well, with an average mean percent difference of −0.65%, and 4.9 % at Bahawalpur and Khanewal (Table 8 and Table 9). The model simulation was further assessed with the farmer data set collected during 2019. Significant results were recorded with high values of R2 and D-index and low values of error and RMSE for both the Bahawalpur and Khanewal districts (Figure 7 and Figure 8) for the year 2019. These results of calibration and evaluation with an experimental data set and the further validation of the model at farmers’ fields showed that the CSM-CROPGRO-Cotton in the shell of DSSAT can be used for assessing the impact of climate change on cotton productivity and for the optimization of crop production options for current and future climatic conditions. Overall, a comparison of the simulated and observed data showed that the model simulated well under the non-limiting condition as compared to under stressed conditions.
To make the adaptation package more reliable, the model was run with 30 years of climatic data (2040–2069). Future climate data for 2040–2069 under RCP 4.5 and 8.5 will be damaging for cotton production due to high temperature and lesser rainfall, as predicted under RCP 4.5 and 4.8 (Table 12 and Table 13), which will be a cause of lesser production under the arid environments of Bahawalpur and Khanewal with present crop husbandry practices. However, the results showed that RCP 8.5 will be more damaging than such types, results that were also reported by San José et al. and Abadie et al. [37,38].
The model was run with different production options for developing the adaptations to minimize the adverse effects of the changing climate. The results showed that with the adoption of this package, there will be 11% benefits over baseline and 33% recovery of climate change damages under RCP 4.5 (Table 15). The results displayed that the package will help the farmers increase crop yield 7.5% over baseline yield and help recover 37% of the damages due to climate change, under RCP 8.5 projections (Table 16). An early sowing date (15 days earlier than present) will be the best strategy along with other proposed options for the future, as late planting pushes the crop into a lower radiation time of the year. The higher temperatures at early vegetative growth phases led to earlier flowering, boll set, boll opening and the lower growth of canopy (LAI) these results are in line with Wajid et al. [36], who applied CSM-CROPGRO-Cotton for the optimization of different cotton management practices under the semi-arid climatic conditions in central Punjab.
These benefits of the adaptation package will be more if plant breeders help to evolve more heat and drought—tolerant varieties than the present—day varieties such as Mubarak. The breed is suggesting an emphasis on fast-growing varieties with lesser LAI and no stomata on leaves to avoid excessive transpiration losses.

5. Conclusions

The current study revealed that that the CSM-CROPGRO-Cotton model in the shell of DSSAT V. 4.7 is an artistic tool for the simulation of crop growth, phenology, and yield. A close agreement between the simulated and observed data is proof of these qualities. Furthermore, a well-calibrated CSMCROPGRO-Cotton and validated model could be used for climate change impact assessment and the optimization of site-specific production technology with the use of minimum resources. The proposed adaptation package could be proven effective in quantifying the climate change impact on SCY in the project area and in developing possible adaptation strategies for sustainable cotton production that can mitigate the harsh effects of climate change.

Author Contributions

All authors have participated in (a) the conception and design or analysis and interpretation of the data; (b) drafting the article or revising it critically for important intellectual content, and (c) the approval of the final version. Conceptualization, A.I. and M.M.A.; methodology, T.K. and Z.A.A.; validation, T.K.; formal analysis, A.A.; investigation, M.I., M.J.A., and Z.A.A.; data curation, T.K.; visualization, A.A.; writing—original draft preparation, T.K.; writing—review and editing, Z.A.A.; supervision, M.M.A.; project administration, A.I. All authors have read and agreed to the published version of the manuscript.

Funding

This research was funded by WWF-Sweden, grant number “30026” and “The APC was funded by 30026”.

Institutional Review Board Statement

No applicable.

Informed Consent Statement

No applicable.

Data Availability Statement

No applicable.

Acknowledgments

The authors highly acknowledge the services of the Department of Agronomy, University of Agriculture Faisalabad (UAF), Pakistan for providing the platform to carry out the present research work.

Conflicts of Interest

The authors declare that they have no conflict of interest.

References

  1. Arshad, A.; Raza, M.A.; Zhang, Y.; Zhang, L.; Wang, X.; Ahmed, M.; Habib-ur-Rehman, M. Impact of Climate Warming on Cotton Growth and Yields in China and Pakistan: A Regional Perspective. Agriculture 2021, 11, 97. [Google Scholar] [CrossRef]
  2. Ullah, A.; Ahmad, A.; Khaliq, T.; Akhtar, J. Recognizing production options for pearl millet in Pakistan under changing climate scenarios. J. Integr. Agric. 2017, 16, 762–773. [Google Scholar] [CrossRef] [Green Version]
  3. Zhu, T.; Ringler, C.; Iqbal, M.M.; Sulser, T.B.; Goheer, M.A. Climate change impacts and adaptation options for water and food in Pakistan: Scenario analysis using an integrated global water and food projections model. Water Int. 2013, 38, 651–669. [Google Scholar] [CrossRef]
  4. Iqbal, M.; Ul-Allah, S.; Naeem, M.; Ijaz, M.; Sattar, A.; Sher, A. Response of cotton genotypes to water and heat stress: From field to genes. Euphytica 2017, 213, 131. [Google Scholar] [CrossRef]
  5. International Trade Centre. Cotton and Climate Change: Impacts and Options to Mitigate and Adapt; Technical Paper, Doc. No. MAR-11-200; EITC: Geneva, Switzerland, 2011; Volume xii, 32p. [Google Scholar]
  6. Naheed, G.; Rasul, G. Recent Water Requirement of Cotton Crop in Pakistan. Pak. J. Meteor. 2010, 6, 75–84. [Google Scholar]
  7. Ahmad, A.; Ashfaq, M.; Rasul, G.; Wajid, S.A.; Ahmad, I.; Khaliq, T.; Nasir, J.; Rasul, F.; Riaz, F.; Ahmad, B.; et al. Development of Climate Change Adaptation Strategies for Cotton–Wheat Cropping System of Punjab Pakistan in Handbook of Climate Change and Agroecosystems; Rosenzweig, C., Mutter, C.Z., Contreras, E.M., Eds.; World Scientific: Singapore, 2021. [Google Scholar] [CrossRef]
  8. Rahman, M.H.; Ahmad, A.; Wajid, A.; Hussain, M.; Rasul, F.; Ishaque, W.; Islam, M.A.; Shelia, V.; Awais, M.; Ullah, A.; et al. Application of CSM-CROPGRO-Cotton model for cultivars and optimum planting dates: Evaluation in changing semi-arid climate. Field Crops Res. 2019, 238, 139–152. [Google Scholar] [CrossRef]
  9. Gattoo, M.A.; Mustafa, G.; Iqbal, M. Impact of Farm Households’ Adaptations to Climate Change on Food Security: Evidence from Different Agro-ecologies of Pakistan. Pak. Dev. Rev. 2016, 55, 561–588. [Google Scholar] [CrossRef] [Green Version]
  10. Aslam, A.Q.; Ahmad, S.R.; Ahmad, I.; Hussain, Y.; Hussain, M.S. Vulnerability and impact assessment of extreme climatic event: A case study of southern Punjab, Pakistan. Sci. Total Environ. 2017, 580, 468–481. [Google Scholar] [CrossRef] [PubMed]
  11. Imran, M.; Ali, A.; Ashfaq, M.; Hassan, S.; Culas, R.; Ma, C. Impact of Climate Smart Agriculture (CSA) Practices on Cotton Production and Livelihood of Farmers in Punjab, Pakistan. Sustainability 2018, 10, 2101. [Google Scholar] [CrossRef] [Green Version]
  12. Raza, A.; Razzaq, A.; Mehmood, S.; Zou, X.; Zhang, X.; Lv, Y.; Xu, J. Impact of Climate Change on Crops Adaptation and Strategies to Tackle Its Outcome: A Review. Plants 2019, 8, 34. [Google Scholar] [CrossRef] [Green Version]
  13. Jones, J.; Hoogenboom, G.; Porter, C.; Boote, K.; Batchelor, W.; Hunt, L.; Wilkens, P.; Singh, U.; Gijsman, A.; Ritchie, J. The DSSAT cropping system model. Eur. J. Agron. 2003, 18, 235–265. [Google Scholar] [CrossRef]
  14. Hoogenboom, G.; Porter, C.H.; Boote, K.J.; Shelia, V.; Wilkens, P.W.; Singh, U.; White, J.W.; Asseng, S.; Lizaso, J.I.; Moreno, L.P.; et al. The DSSAT crop modeling ecosystem. In Advances in Crop Modeling for a Sustainable Agriculture; Boote, K.J., Ed.; Burleigh Dodds Science Publishing: Cambridge, UK, 2019; pp. 173–216. [Google Scholar] [CrossRef]
  15. Hoogenboom, G.; Porter, C.H.; Shelia, V.; Boote, K.J.; Singh, U.; White, J.W.; Hunt, L.A.; Ogoshi, R.; Lizaso, J.I.; Koo, J.; et al. Decision Support System for Agrotechnology Transfer (DSSAT) Version 4.7.5; DSSAT Foundation: Gainesville, FL, USA, 2019; Available online: https://DSSAT.net (accessed on 21 September 2021).
  16. Thorp, K.R.; Barnes, E.M.; Hunsaker, D.J.; Kimball, B.A.; White, J.W.; Nazareth, V.J.; Hoogenboom, G. Evaluation of CSM-CROPGRO-cotton for simulating effects of management and climate change on cotton growth and evapotranspiration in an arid environment. Trans. ASABE 2014, 57, 1627–1642. [Google Scholar] [CrossRef]
  17. Shin, D.W.; Cocke, S.; Baigorria, G.A.; RomeroFFS, C.C.; Kim, B.-M.; Kim, K.-Y. Future Crop Yield Projections Using a Multi-model Set of Regional Climate Models and a Plausible Adaptation Practice in the Southeast United States. Atmosphere 2020, 11, 1300. [Google Scholar] [CrossRef]
  18. Gul, F.; Ahmed, I.; Ashfaq, M.; Jan, D.; Fahad, S.; Li, X.; Wang, D.; Fahad, M.; Fayyaz, M.; Shah, S.A. Use of crop growth model to simulate the impact of climate change on yield of various wheat cultivars under different agro-environmental conditions in Khyber Pakhtunkhwa, Pakistan. Arab. J. Geosci. 2020, 13, 112. [Google Scholar] [CrossRef]
  19. Elias, E.H.; Flynn, R.; Idowu, O.J.; Reyes, J.; Sanogo, S.; Schutte, B.J.; Smith, R.; Steele, C.; Sutherland, C. Crop vulnerability to weather and climate risk: Analysis of interacting systems and adaptation efficacy for sustainable crop production. Sustainability 2019, 11, 6619. [Google Scholar] [CrossRef] [Green Version]
  20. Anser, M.K.; Hina, T.; Hameed, S.; Nasir, M.H.; Ahmad, I.; ur Rehman Naseer, M.A. Modeling Adaptation Strategies against Climate Change Impacts in Integrated Rice-Wheat Agricultural Production System of Pakistan. Int. J. Environ. Res. Public Health 2020, 17, 2522. [Google Scholar] [CrossRef] [Green Version]
  21. Tolomio, M.; Casa, R. Dynamic crop models and remote sensing irrigation decision support systems: A review of water stress concepts for improved estimation of water requirements. Remote Sens. 2020, 23, 3945. [Google Scholar] [CrossRef]
  22. Yan, W.; Jiang, W.; Han, X.; Hua, W.; Yang, J.; Luo, P. Simulating and Predicting Crop Yield and Soil Fertility under Climate Change with Fertilizer Management in Northeast China Based on the Decision Support System for Agrotechnology Transfer Model. Sustainability 2020, 12, 2194. [Google Scholar] [CrossRef] [Green Version]
  23. Hatfield, J.L.; Dold, C. Water-use efficiency: Advances and challenges in a changing climate. Front. Plant Sci. 2019, 10, 103. [Google Scholar] [CrossRef] [Green Version]
  24. Modala, N.R.; Ale, S.; Rajan, N.; Munster, C.L.; DeLaune, P.B.; Thorp, K.R.; Nair, S.S.; Barnes, E.M. Evaluation of the CSM-CROPGRO-Cotton Model for the Texas Rolling Plains Region and Simulation of Deficit Irrigation Strategies for Increasing Water Use Efficiency. Trans. ASABE 2015, 685–696. [Google Scholar] [CrossRef]
  25. Adhikari, P.; Gowda, P.H.; Marek, G.W.; Brauer, D.K.; Kisekka, I.; Northup, B.; Rocateli, A. Calibration and Validation of CSM-CROPGRO-Cotton Model Using Lysimeter Data in the Texas High Plains. J. Contemp. Water Res. Educ. 2017, 162, 61–78. [Google Scholar] [CrossRef] [Green Version]
  26. Hunt, L.A.; Pararajasingham, S.; Jones, J.W.; Hoogenboom, G.; Imamura, D.T.; Ogoshi, R.M. GENCALC: Software to Facilitate the Use of Crop Models for Analyzing Field Experiments. Agron. J. 1993, 85, 1090–1094. [Google Scholar] [CrossRef]
  27. Wallach, D.; Goffinet, B. Mean squared error of prediction as a criterion for evaluating and comparing system models. Ecol. Modell. 1989, 44, 299–306. [Google Scholar] [CrossRef]
  28. Willmott, C.J. Some Comments on the Evaluation of Model Performance. Bull. Am. Meteorol. Soc. 1982, 63, 1309–1313. [Google Scholar] [CrossRef] [Green Version]
  29. Rawls, W.J.; Brakensiek, D.L.; Saxtonn, K.E. Estimation of Soil Water Properties. Trans. ASAE 1982, 25, 1316–1320. [Google Scholar] [CrossRef]
  30. Taylor, K.E.; Stouffer, R.J.; Meehl, G.A. An Overview of CMIP5 and the Experiment Design. Bull. Am. Meteorol. Soc. 2012, 93, 485–498. [Google Scholar] [CrossRef] [Green Version]
  31. Ruane, A.C.; Goldberg, R.; Chryssanthacopoulos, J. Climate forcing datasets for agricultural modeling: Merged products for gap-filling and historical climate series estimation. Agric. For. Meteorol. 2015, 200, 233–248. [Google Scholar] [CrossRef] [Green Version]
  32. Rosenzweig, C.; Jones, J.W.; Hatfield, J.L.; Antle, J.M.; Ruane, A.C.; Mutter, C.Z. The Agricultural Model Intercomparison and Improvement Project: Phase I Activities by a Global Community of Science. In Handbook of Climate Change and Agroecosystems: The Agricultural Model Intercomparison and Improvement Project (Agmip) Integrated Crop and Economic Assessments—Joint Publication with Asa, Cssa, And Sssa (In 2 Parts); GISS Publications: New York, NY, USA, 2015; Volume 3, p. 1. [Google Scholar]
  33. Pedreira, B.C.; Pedreira, C.G.S.; Boote, K.J.; Lara, M.A.S.; Alderman, P.D. Adapting the CROPGRO perennial forage model to predict growth of Brachiaria brizantha. Field Crops Res. 2011, 120, 370–379. [Google Scholar] [CrossRef]
  34. Ortiz, B.V.; Hoogenboom, G.; Vellidis, G.; Boote, K.; Davis, R.F.; Perry, C. Adapting the CROPGRO-cotton model to simulate cotton biomass and yield under southern root-knot nematode parasitism. Trans. ASABE 2009, 52, 2129–2140. [Google Scholar] [CrossRef]
  35. Malik, W.; Boote, K.J.; Hoogenboom, G.; Cavero, J.; Dechmi, F. Adapting the CROPGRO Model to Simulate Alfalfa Growth and Yield. Agron. J. 2018, 110, 1777–1790. [Google Scholar] [CrossRef] [Green Version]
  36. Wajid, A.; Ahmad, A.; Khaliq, T.; Alam, S.; Hussaun, A.; Hussain, K.; Naseem, W.; Usman, M.; Ahmad, S. Quantification of growth, yield and radiation use efficiency of promising cotton cultivars at varying nitrogen levels. Pak. J. Bot. 2010, 42, 1703–1711. [Google Scholar]
  37. San José, R.; Pérez, J.L.; González, R.M.; Pecci, J.; Garzón, A.; Palacios, M. Impacts of the 4.5 and 8.5 RCP global climate scenarios on urban meteorology and air quality: Application to Madrid, Antwerp, Milan, Helsinki and London. J. Comput. Appl. Math. 2016, 293, 192–201. [Google Scholar] [CrossRef]
  38. Abadie, L.M.; Jackson, L.P.; Sainz de Murieta, E.; Jevrejeva, S.; Galarraga, I. Comparing urban coastal flood risk in 136 cities under two alternative sea-level projections: RCP 8.5 and an expert opinion-based high-end scenario. Ocean Coast. Manag. 2020, 193, 105249. [Google Scholar] [CrossRef]
Figure 1. (a) Minimum and Maximum Temperature (°C) recorded during 2019. (b) Rainfall and Sunshine hour trends during 2019.
Sustainability 13 10495 g001
Figure 2. Pictorial view of the methodology of the climate change impact assessment and adaptations for sustainable crop yield in the future.
Sustainability 13 10495 g002
Figure 3. Comparison of the observed and simulated TDM of cotton cultivars (NIAB-878, FH-Lalazaar and BS-15) during calibration with a sowing date of 22 April 2019.
Sustainability 13 10495 g003
Figure 4. Comparison of the observed and simulated LAI of cotton cultivars (NIAB-878, FH-Lalazaar and BS-15) during calibration with a sowing date of 22 April 2019.
Sustainability 13 10495 g004
Figure 5. Comparison of the observed and simulated TDM of cotton cultivars (NIAB-878, FH-Lalazaar and BS-15) at different sowing dates (7th and 22nd May) during the evaluation of the model.
Sustainability 13 10495 g005
Figure 6. Comparison of the observed and simulated LAI of cotton cultivars (NIAB-878, FH-Lalazaar and BS-15) at different sowing dates (7th and 22nd May) during the evaluation of the model.
Sustainability 13 10495 g006
Figure 7. Relationship between the simulated and observed SCY during the validation of the model with data recorded during a survey at a farmer’s field in the project area during 2019.
Sustainability 13 10495 g007
Figure 8. Relationship between the simulated and observed SCY during the validation of the model with data recorded during a survey at a farmer’s field in the Bahawalpur district during 2019.
Sustainability 13 10495 g008
Figure 9. Relationship between the simulated and observed SCY during the validation of the model with data recorded during a survey at a farmer’s field in the Khanewal district during 2019.
Sustainability 13 10495 g009
Figure 10. Climate Change Projection under RCP 8.5 for the Bahawalpur area.
Sustainability 13 10495 g010
Figure 11. Climate Change Projection under RCP 8.5 for Khanewal area.
Sustainability 13 10495 g011
Figure 12. Impact of climate change predicted by different GCMs for 2040–2069 under RCPs 4.5 and 8.5 for the Project Area.
Sustainability 13 10495 g012
Figure 13. Comparison of different cotton cultivars at the Bahawalpur and Khanewal locations.
Sustainability 13 10495 g013
Figure 14. Optimization of the planting date for maximizing cotton production (kg ha−1) under the changing climate scenario (2040–2069) of RCP 4.5. Current planting date: 15 May (0).
Sustainability 13 10495 g014
Figure 15. Optimization of the planting date for maximizing cotton production (kg ha−1) under the changing climate scenario (2040–2069) of RCP 8.5. Current planting date: 15 May (0).
Sustainability 13 10495 g015
Figure 16. Optimization of planting density (1:46,500, 2:62,000 and 3:93,000 plants) for maximizing cotton production (kg ha−1) under the changing climate scenario (2040–2069) of RCP 4.5 and 8.5.
Sustainability 13 10495 g016
Figure 17. Impact of the nitrogen level on SCY (kg ha−1) at the Bahawalpur and Khanewal districts.
Sustainability 13 10495 g017
Table 1. Genetic Coefficients of different cultivars estimated during the calibration of the model.
ParametersCalibrated ValueTesting RangeDefault Value
NIAB-878FH-LalazarBS-15IUB-13MubarakGH-UhadDebalCyto-179NIAB-KiranCIM-313
Development
FL-EM55555555553–94
EM-FL4645404243444344464335 to 5038
FL-SH1113121516141516121405–2012
FL-SD2425283026202126222710–3015
SD-PM4849485052464551434530–6042
FL-LF6870726970697166657335–8075
Growth
LFMAX1.451.501.131.151.421.521.371.341.481.470.5–2.01.1
SLAVR139155150145165163140145142160100–250170
SIZLF275305300280320315305 285 290 310200–400300
Yield
XFRT0.650.630.690.700.610.670.600.650.670.640.50–0.900.85
SFDUR3135323330343630323515–4024
PODUR14.013.014.5 13.5 14.015.015.514.513.5135–208
THRSH65 68 63 70 71736972707240–9070
PL-EM: Thermal time between planting and emergence, EM-FL: Photothermal time between plant emergence and flower appearance, FL-SH: Photothermal time between first flower and first boll, FL-SD: Photothermal time between first flower and first seed, SD-PM: Photothermal time between first seed and physiological maturity, FL-LF: Photothermal time between first flower and the end of leaf expansion, LFMAX: Maximum leaf photosynthesis rate at 30 °C, 350 ppm CO2, and high light (mg CO2 m−2 S−1), SLAVR: Specific leaf area of cultivar under standard growth conditions (cm−2 g−1), SIZLF: Maximum size of the full leaf (cm2), XFRT: Maximum fraction of daily growth that is partitioned to seed + shell, SFDUR: Seed filling duration for pod cohort at standard growth conditions, PODUR: Time required for cultivar to reach final boll load under optimal conditions, THRSH The maximum ratio of (seed/(seed + shell)) at maturity.
Table 2. Characteristics of the dominant soil series of the project area.
DistrictSoil SeriesCharacteristics
Bahawalpur
(29°25′ N and 71°40′ E)
BijnotFine sands
TharFine sands
MaruwalaLoamy fine sands.
Khanewal
(30°17′ N and 71°55′ E)
MianiSilty clay loams
NabipurLoams
SultanpurSilt loams and very fine sandy loams
Table 3. Detail of the General Circulation Models (GCMs) used in climate change scenario development.
GCMs NamesCategories
GFDL-CM3_1Hotwet
BNU-ESMMiddle
CCSM4_ECooldry
INMCM4Coolwet
CMCC-CMS_WHotdry
Table 4. Integrated Climate Change Projections (2040–2069) for Hot/Dry Conditions in the project area.
VariablesScenariosCotton
Δ Tmax (°C)RCP 4.52.4
RCP 8.53.5
Δ Tmin (°C)RCP 4.52.7
RCP 8.53.8
Δ Rain (%)RCP 4.5−33.1
RCP 8.5−51.7
Note: Tmax = maximum temperature; Tmin = minimum temperature; RCP = representative concentration pathway.
Table 5. Comparison of the observed and simulated results during the calibration of the model for cotton cultivars (NIAB-878, FH-Lalazar, and BS-15) on a sowing date of 22 April.
ParametersNIAB-878FH-LalazarBS-15Average
Obs.Sim.Error %obs.Sim.Error %Obs.Sim.Error %Obs.Sim.Error %
Days to Anthesis60611.6760611.6760611.6760611.67
Days to physiological maturity186184−1.08186184−1.08186184−1.08186184−1.08
LAI5.745.63−1.925.024.85−3.395.194.91−5.395.325.13−3.57
TDM (kg ha−1)13,30913,5681.9511,49312,3067.0811,85412,5015.4412,21812,7924.82
SCY (kg ha−1)316032091.56294330583.92298431254.72302931313.40
Note: Obs. = observed; Sim. = simulated; LAI = leaf area index; SCY = seed cotton yield.
Table 6. Comparison of the observed and simulated days to anthesis and the physiological maturity of the different cotton cultivars at different sowing dates.
TreatmentsDays to AnthesisDays to Physiological Maturity
Obs.Sim.Error (%)Obs.Sim.Error (%)
S2V156595.361731804.05
S2V255597.271731804.05
S2V355597.271731804.05
S3V1505612.001611758.70
S3V2495614.291611758.70
S3V3495614.291611758.70
Average52589.871671786.29
D-Index 0.58 0.56
MPD 10.08 6.37
RMSE 5.40 11.07
Note: S2 = 7 May; S3 = 22 May; V1 = NIAB-878; V2 = FH-Lalazaar; V3 = BS 15; Obs. = observed; Sim. = simulated; MPD = mean percent difference; RMSE = root mean square error.
Table 7. Comparison of the observed and simulated results to SCY, TDM, and LAI of the different cotton cultivars at different sowing dates.
TreatmentsLAISCY (kg ha−1)RMSE (kg ha−1)
Obs.Sim.Error (%)Obs.Sim.Error (%)Obs.Sim.Error (%)
S2V14.674.23−9.42282429564.6911232115302.65
S2V24.124.130.24268128887.7397311098812.92
S2V34.224.19−0.71275329085.65100581125011.85
S3V14.013.49−12.97258826984.26935298995.85
S3V23.413.19−6.45232925479.347738896115.81
S3V33.593.21−10.582404264510.02829991239.93
Average4.003.74−6.58259692773.76.839401102929.47
D-Index 0.86 0.77 0.83
MPD 6.73 6.95 9.84
RMSE 0.33 183.53 963.11
Note: S2 = 7 May; S3 = 22 May; V1 = NIAB-878; V2 = FH-Lalazaar; V3 = BS 15; Obs. = observed; Sim. = simulated; LAI = leaf area index; SCY = seed cotton yield; MPD = mean percent difference; RMSE = root mean square error.
Table 8. Comparison of the observed and simulated results of the model validation with data recorded for different cotton cultivars sown on 2 May 2018 at a farmer’s field in the Bahawalpur district.
CultivarsObs.
SCY
(kg ha−1)
Sim.
SCY
(kg ha−1)
RMSE
(kg ha−1)
MPD
(%)
BS-153347.013257.4320.03−2.68
IUB-132789.702886.8221.723.48
Mubarak1382.591454.5972.005.21
GH-Uhad2584.222479.7223.37−4.04
Debal2180.252274.5521.094.33
Cyto-1793251.203258.541.640.23
NIAB-Kiran2652.302549.2023.05−3.89
CIM-3132289.262109.6740.16−7.84
Average2559.572565.0727.88−0.65
Note: Obs = observed; Sim = simulated; SCY = seed cotton yield; MPD = mean percent difference; RMSE = root mean square error.
Table 9. Comparison of the observed and simulated results of the model validation with data recorded for different cotton cultivars sown on 2 May 2018 at a farmer’s field in the Khanewal district.
CultivarsObs.
SCY
(kg ha−1)
Sim.
SCY
(kg ha−1)
RMSE
(kg ha−1)
MPD
(%)
BS-152996.482854.5531.74−4.74
IUB-132210.462532.7872.0714.58
Mubarak1189.191504.5970.5326.52
GH-Uhad2834.282741.5920.73−3.27
Debal2625.002698.5516.452.80
Cyto-1793209.943108.5422.67−3.16
NIAB-Kiran2042.402307.4159.2612.98
CIM-3132993.762801.4743.00−6.42
Average2512.692568.6942.064.91
Note: Obs = observed; Sim = simulated; SCY = seed cotton yield; MPD = mean percent difference; RMSE = root mean square error.
Table 10. Comparison of area, production, and average SCY in the project area.
District20182019Average Yield
(kg ha−1)
AreaProductionYield
(kg ha−1)
AreaProductionYield
(000 ha)Bales *(000 ha)Bales(kg ha−1)
Bahawalpur268.51125.02018265.5992.017941906
Khanewal179.7769.42056167.1682.917881922
Note: * 1 Bale: 170 kg.
Table 11. Crop husbandry practices used in the area for cotton production at farmer’s fields.
DistrictVarietySowing TimeNitrogenPhosphorusNo of SpraysNo. of Irrigations
kg acre−1kg acre−1
BahawalpurIUB-1315 May6720.4516
KhanewalIUB-1315 May5622.5715
Table 12. Impact of climate change predicted for 2040–2069 under the representative concentration pathway (RCP 4.5) on cotton yield in the project area.
DistrictAverage Cotton Yield (kg ha−1)Yield Difference
Baseline (1989–2019)2018 & 2019GFDL-CM3 (2040–2069)(kg ha−1)%
Bahawalpur235619061653−703−29.84
Khanewal250519221965−540−21.56
Average235619061653−621.5−25.7
Table 13. Impact of climate change predicted for 2040–2069 under the representative concentration pathway (RCP 8.5) on cotton yield in the project area.
DistrictAverage Cotton Yield (kg ha−1)Yield Difference
Baseline (1989–2019)2018 & 2019GFDL-CM3 (2040–2069)(kg ha−1)%
Bahawalpur190623561565−791−33.57
Khanewal192225051735−770−30.74
Average191424311650−781−32.16
Table 14. Adaptation Package climate-resilient cotton production in the project area.
VariablesDirection of ChangePercentage Change
Nitrogen (kg ha−1)Increase10
Planting density (Plant m−2)Increase 5
Irrigation ManagementDecrease10
Sowing DatesEarly15 days
Fertilizer application methodFertigation
Variety selectionHeat and drought tolerant
Table 15. Impact of the adaptation package on SCY under the present and future climate scenarios of the representative concentration pathway (RCP 4.5).
DistrictBaselineGFDL-CM3With AdaptationRecovery over BaselineRecovery over Future Climate
1989–20192040–20692040–2069(kg ha−1)%(kg ha−1)%
Bahawalpur235616532592235.610.0938.636.2
Khanewal250519652806300.612.0840.629.9
Average243118092699268.111.0889.633.1
Table 16. Impact of the adaptation package on SCY under the present and future climate scenarios of the representative concentration pathway (RCP 8.5).
DistrictBaselineGFDL-CM3With AdaptationRecovery over BaselineRecovery over Future Climate
1989–20192040–20692040–2069(kg ha−1)%(kg ha−1)%
Bahawalpur235615652545188.08.0979.538.5
Khanewal250517352680175.07.0945.435.3
Average243116502613181.57.5962.536.9
Publisher’s Note: MDPI stays neutral with regard to jurisdictional claims in published maps and institutional affiliations.

