Building Climate-Resilient Cotton Production System for Changing Climate Scenarios Using the DSSAT Model
Abstract
:1. Introduction
2. Materials and Methods
2.1. The Project Area
2.2. Collection of Field Survey Data
2.3. Experimental Site
2.4. Crop Modeling
2.5. Soil and Weather Data for Model
2.6. Statistical Downscaling and Climate Change Projections
2.7. Climate Change Impact Assessment
2.8. Climate Change Scenario Generations
2.9. Adaptation Strategies for Climate-Resilient Cotton Production
3. Results
3.1. Soil and Weather Data
3.2. Parameterization and Calibration with Experimental Data
3.3. Evaluation of the Model with Experimental Data
3.3.1. Days to Anthesis
3.3.2. Days to Physiological Maturity
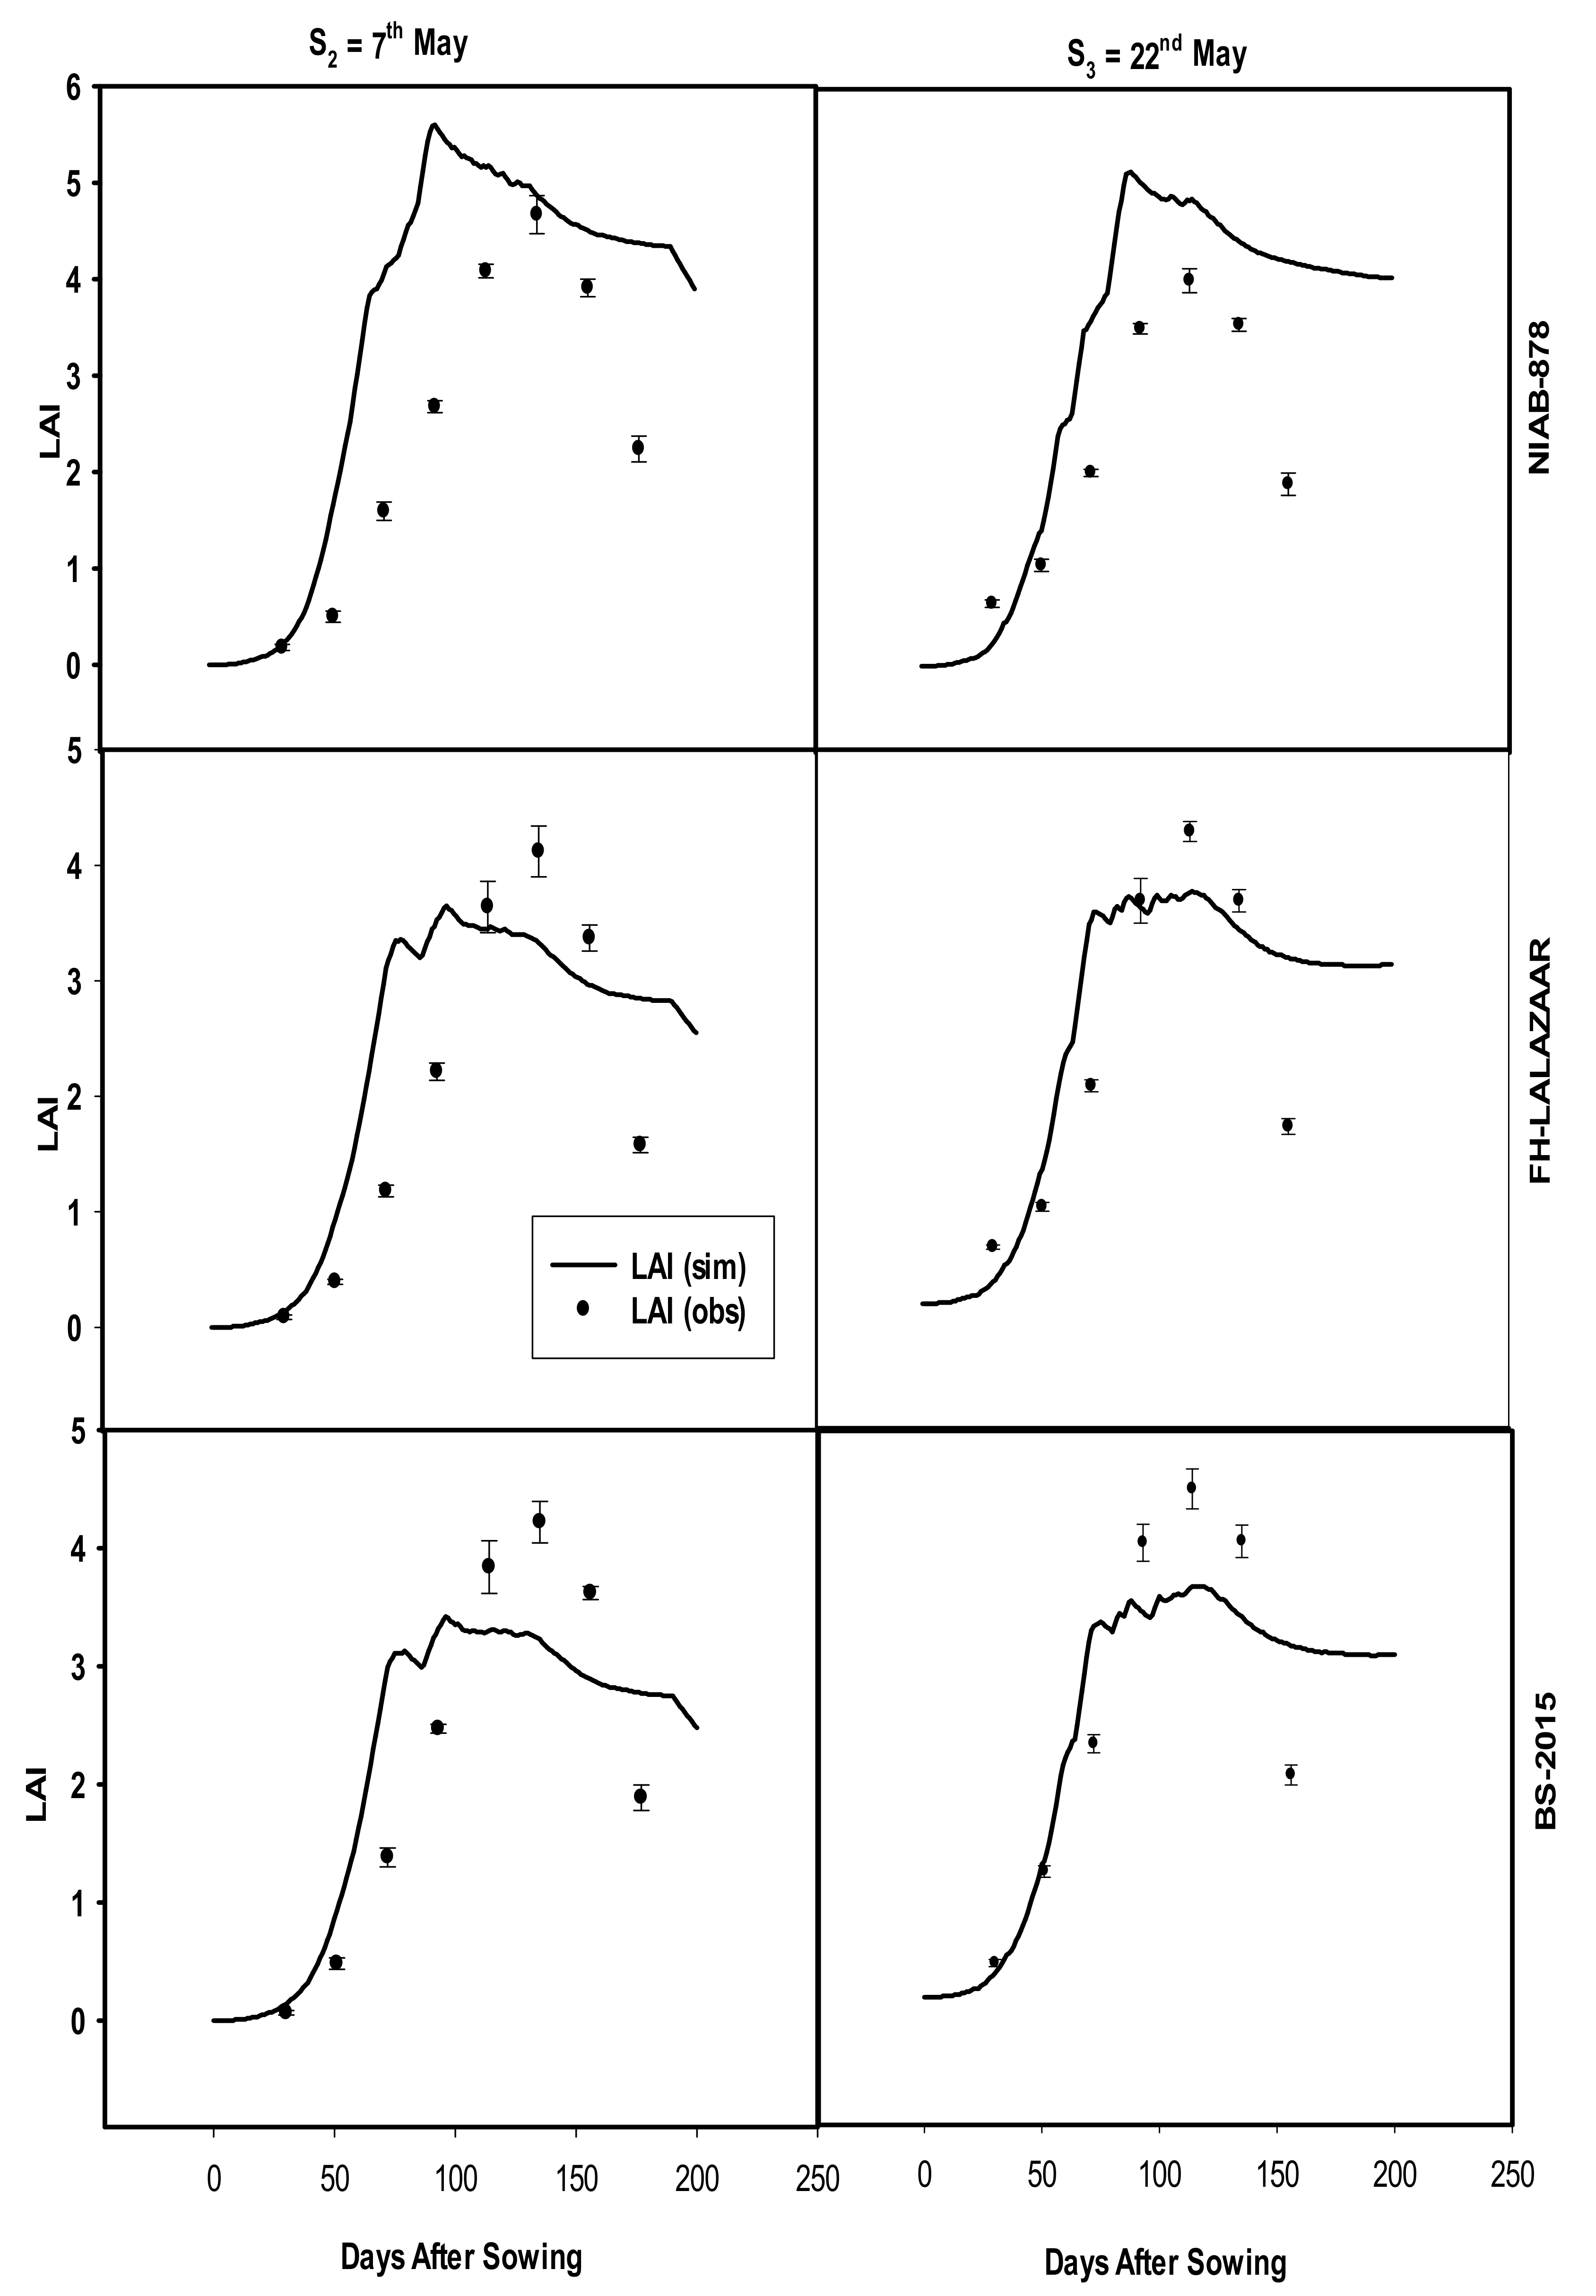
3.3.3. Leaf Area Index (LAI)
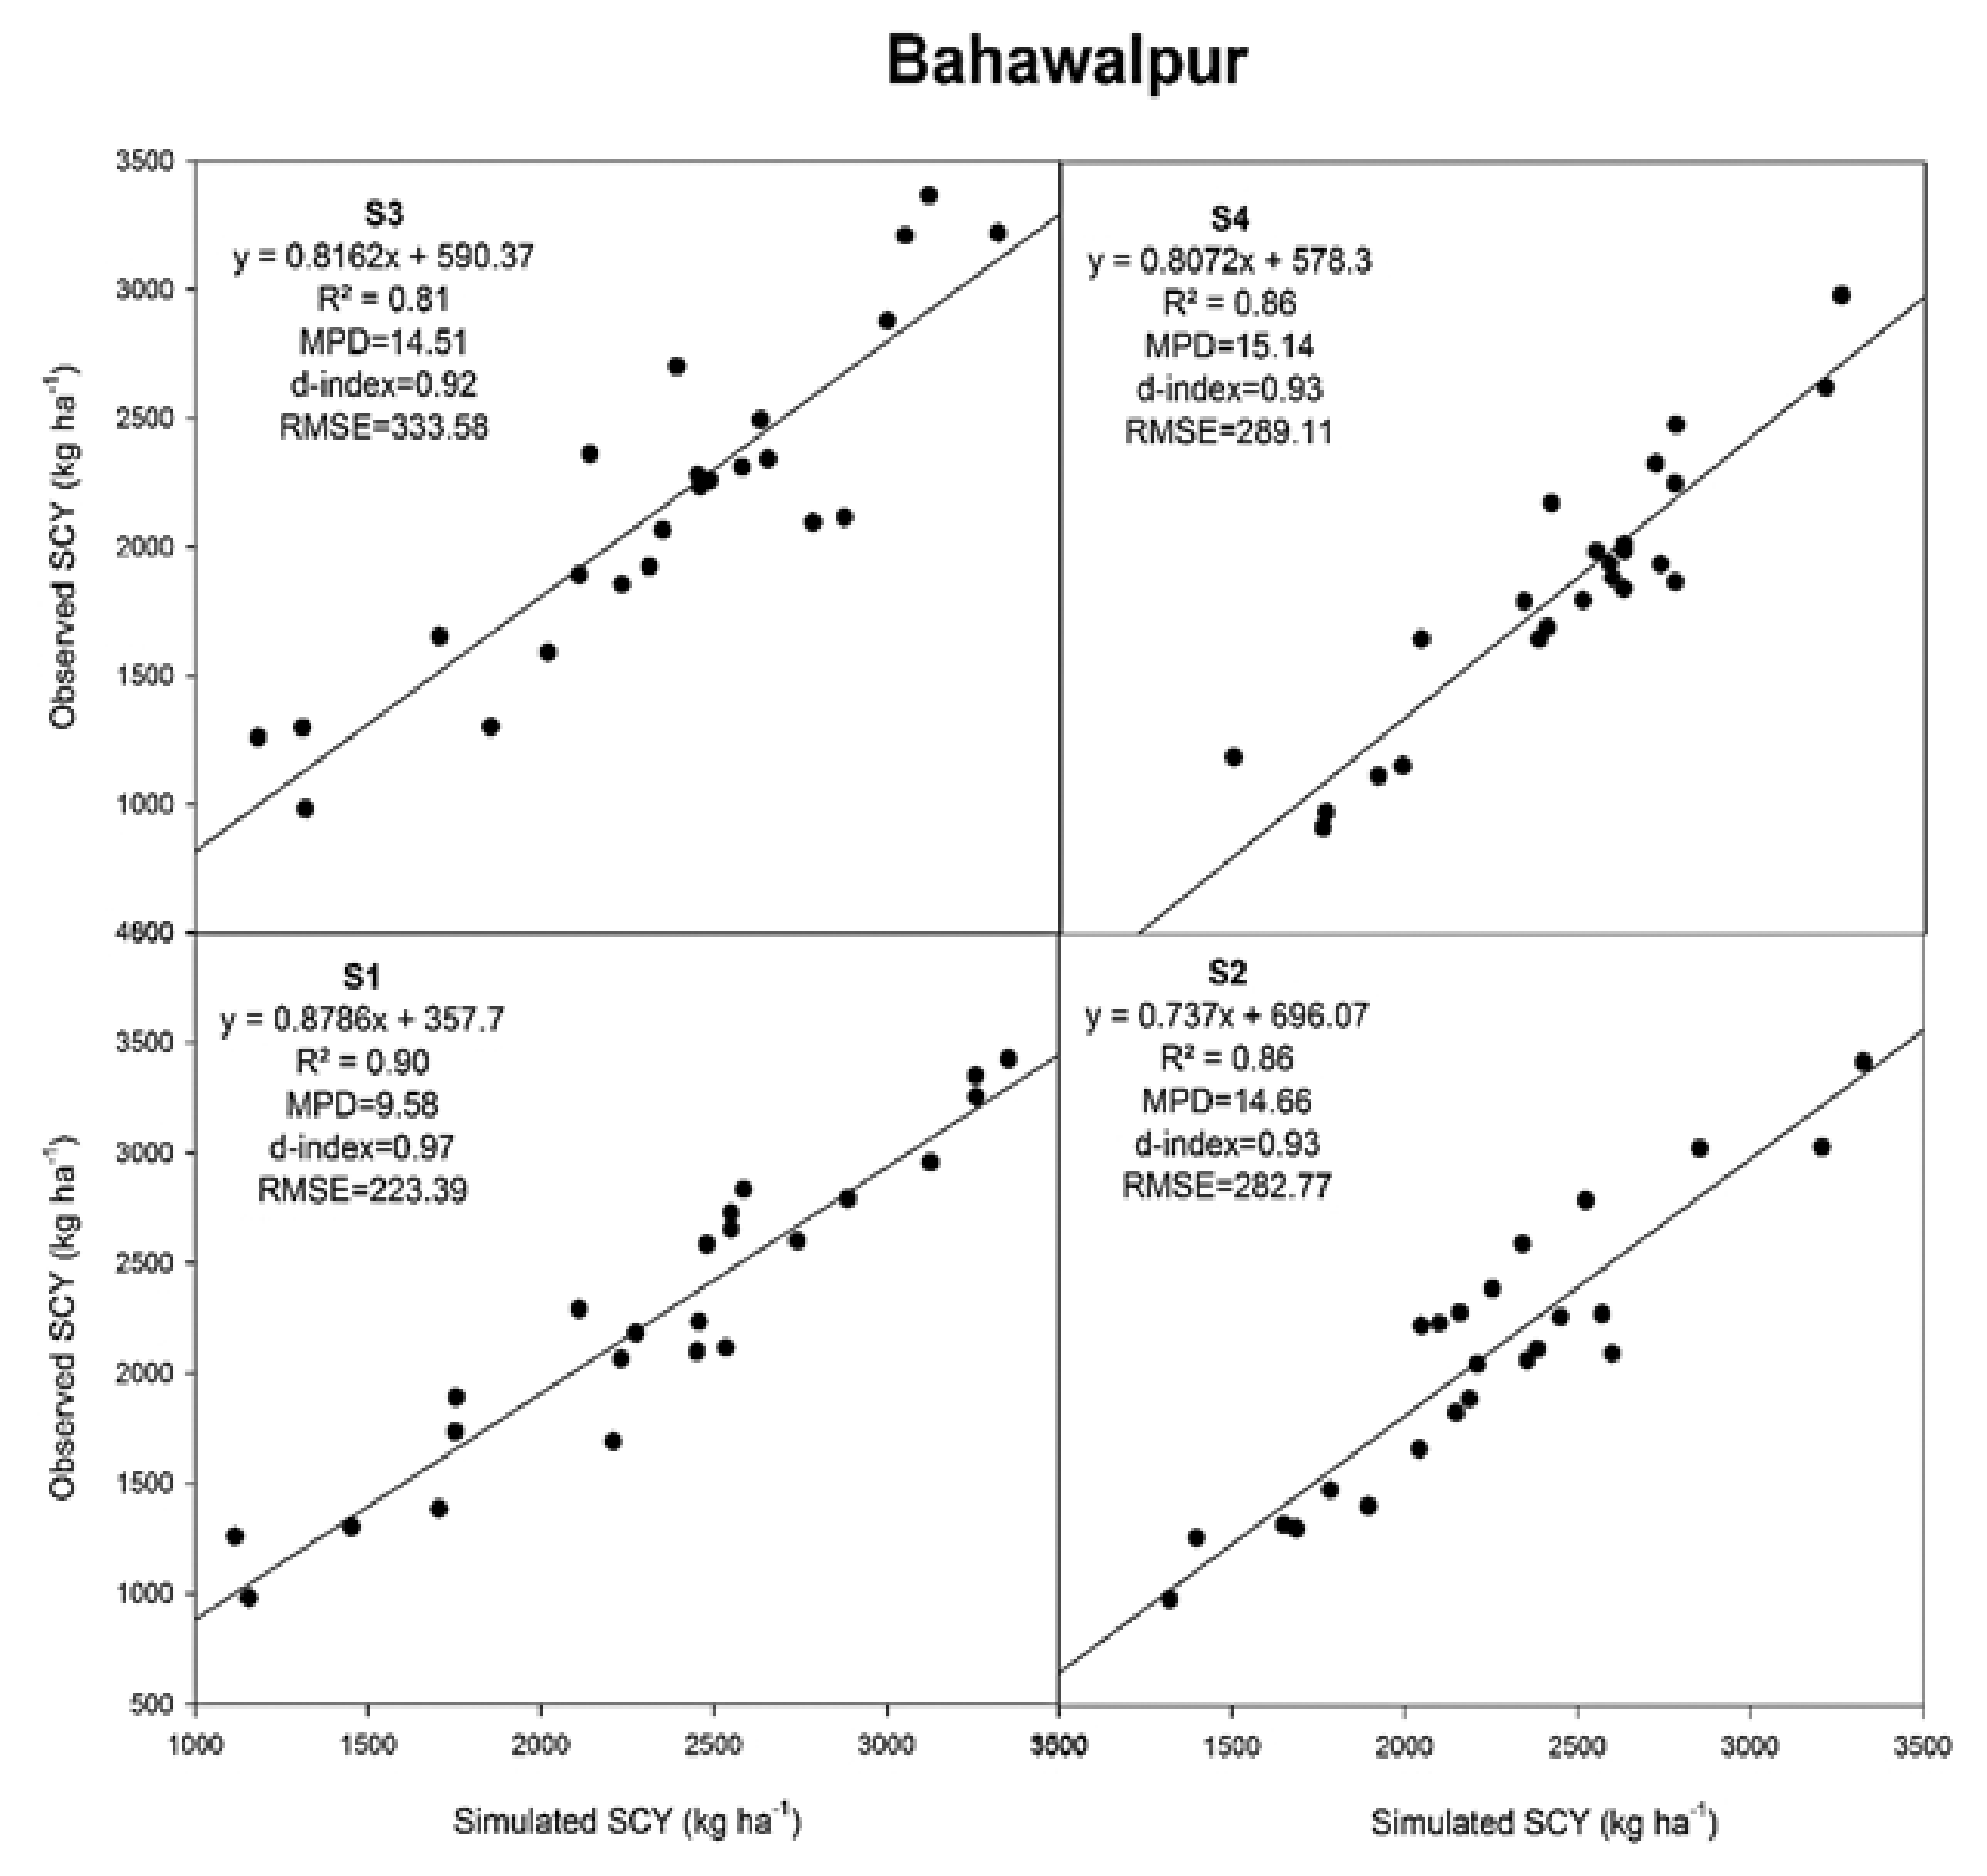
3.3.4. Seed Cotton Yield
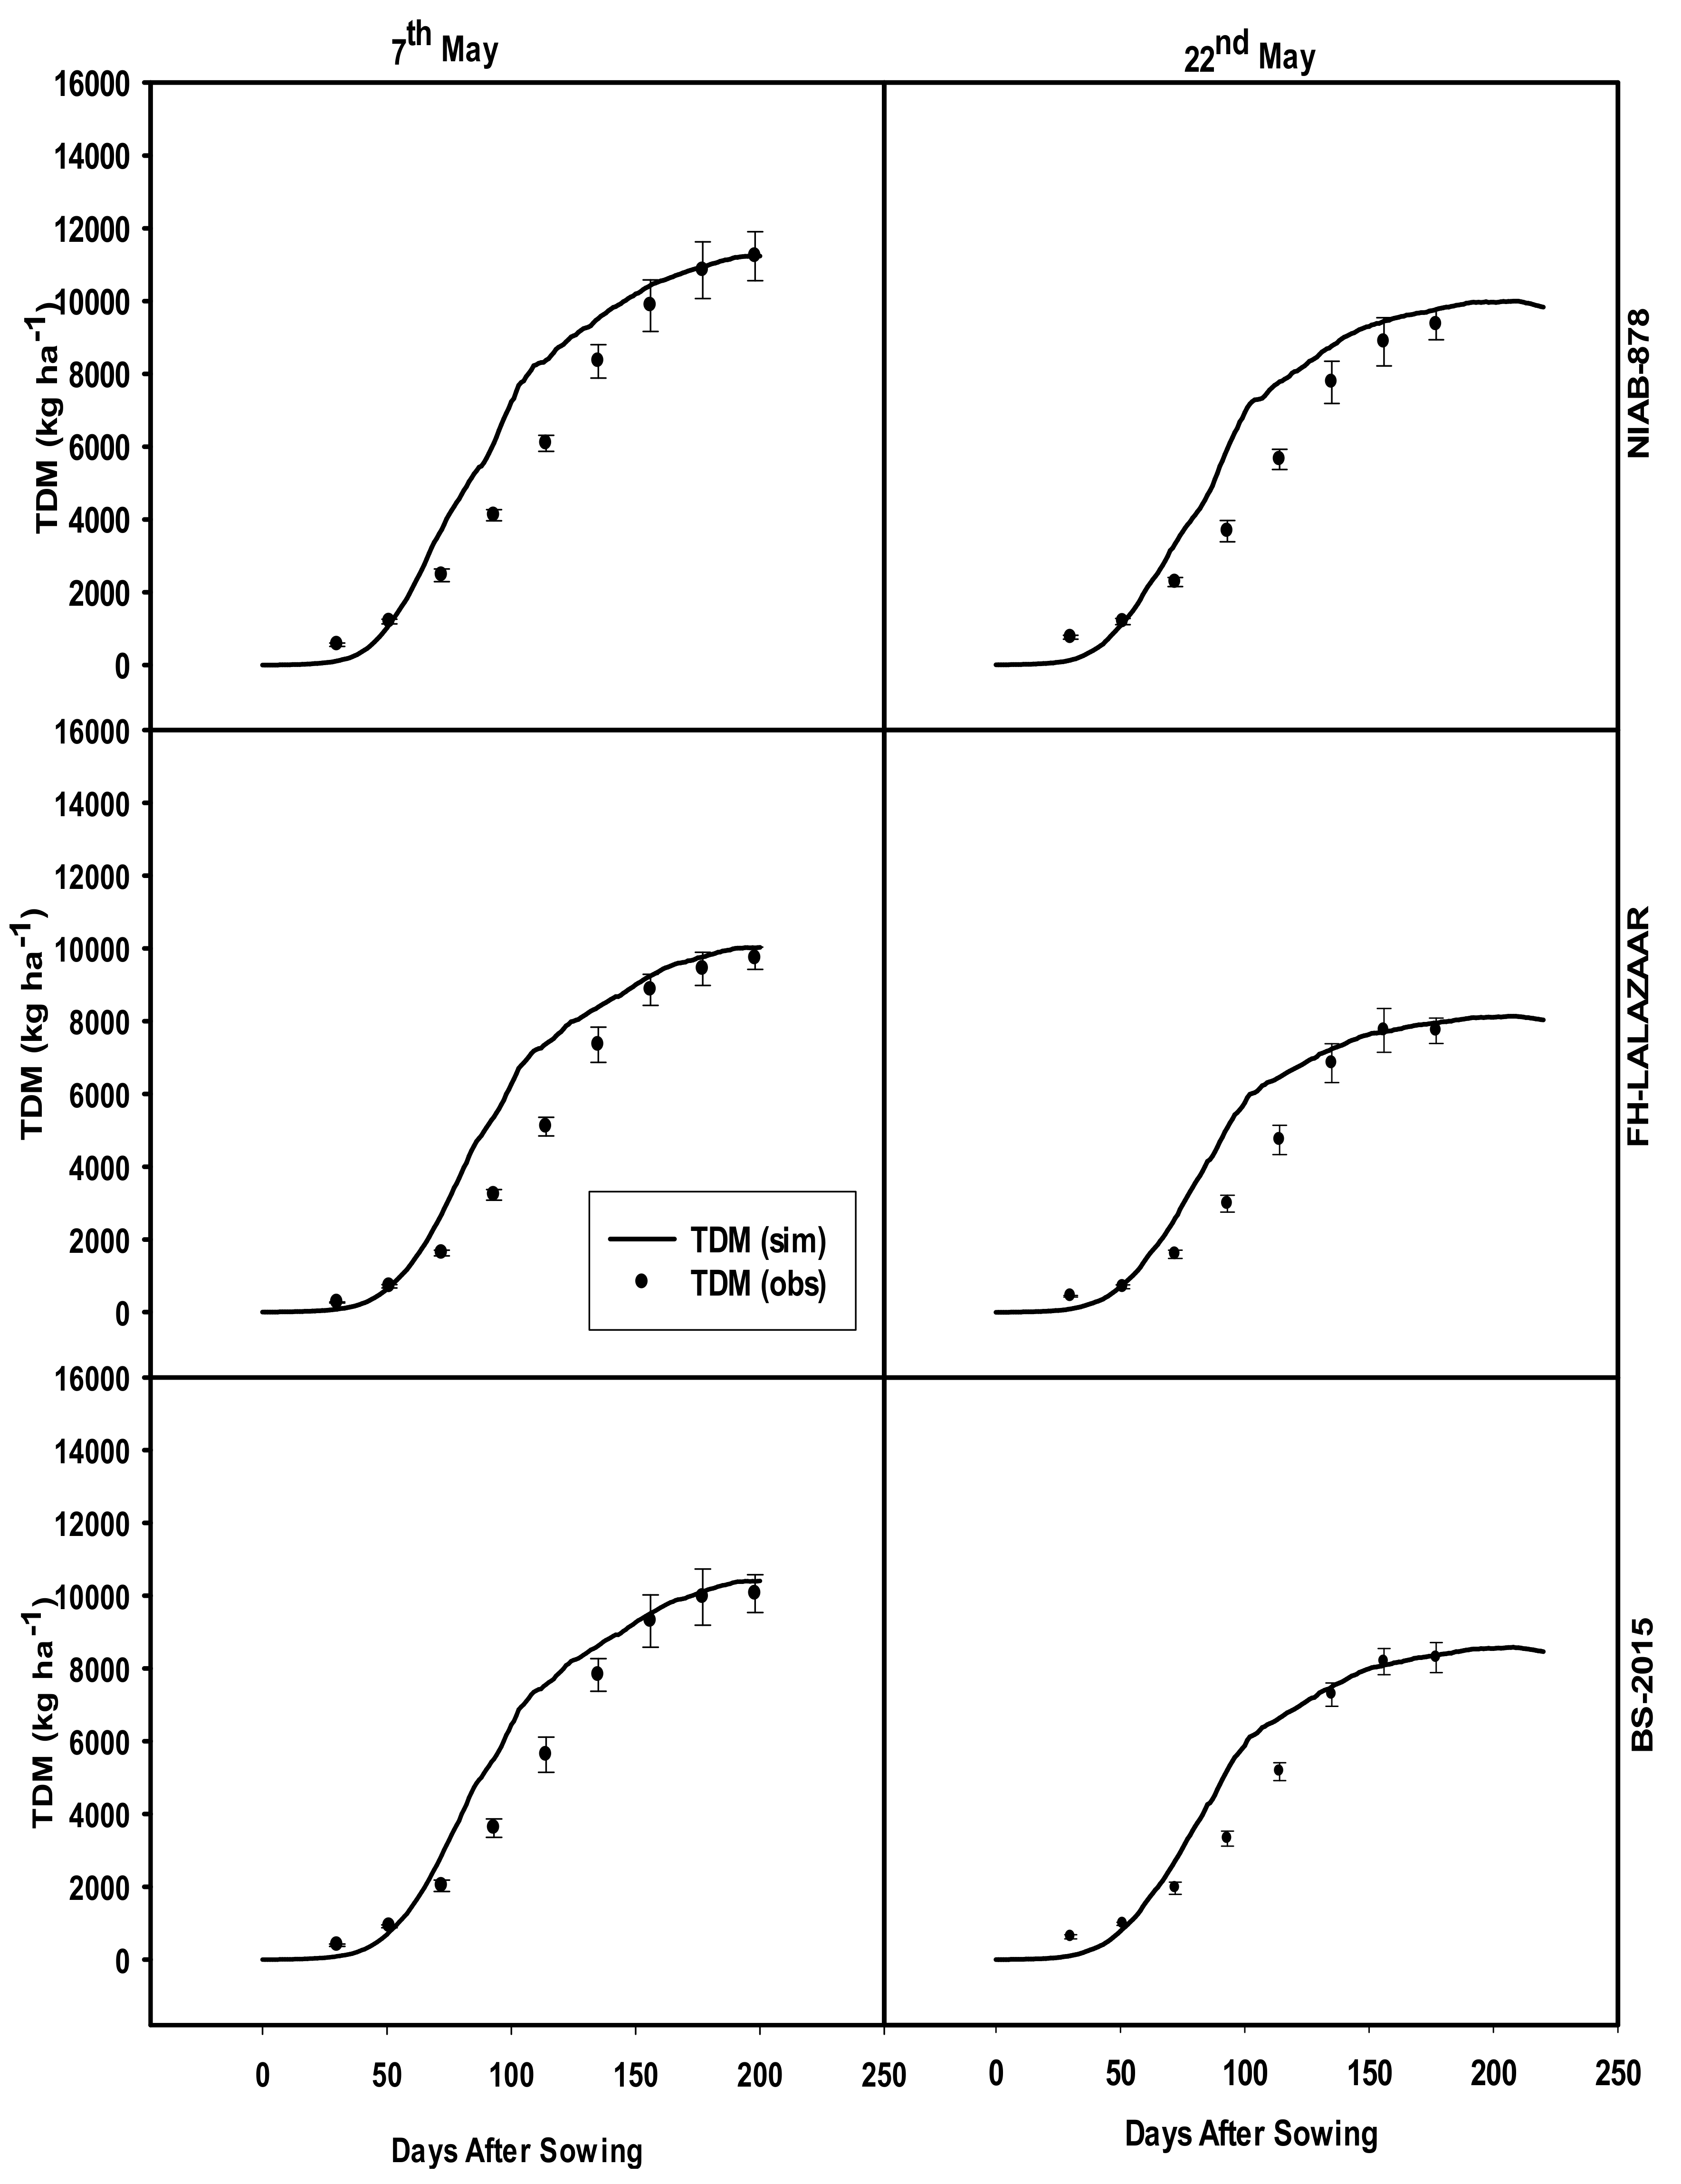
3.3.5. Total Dry Matter
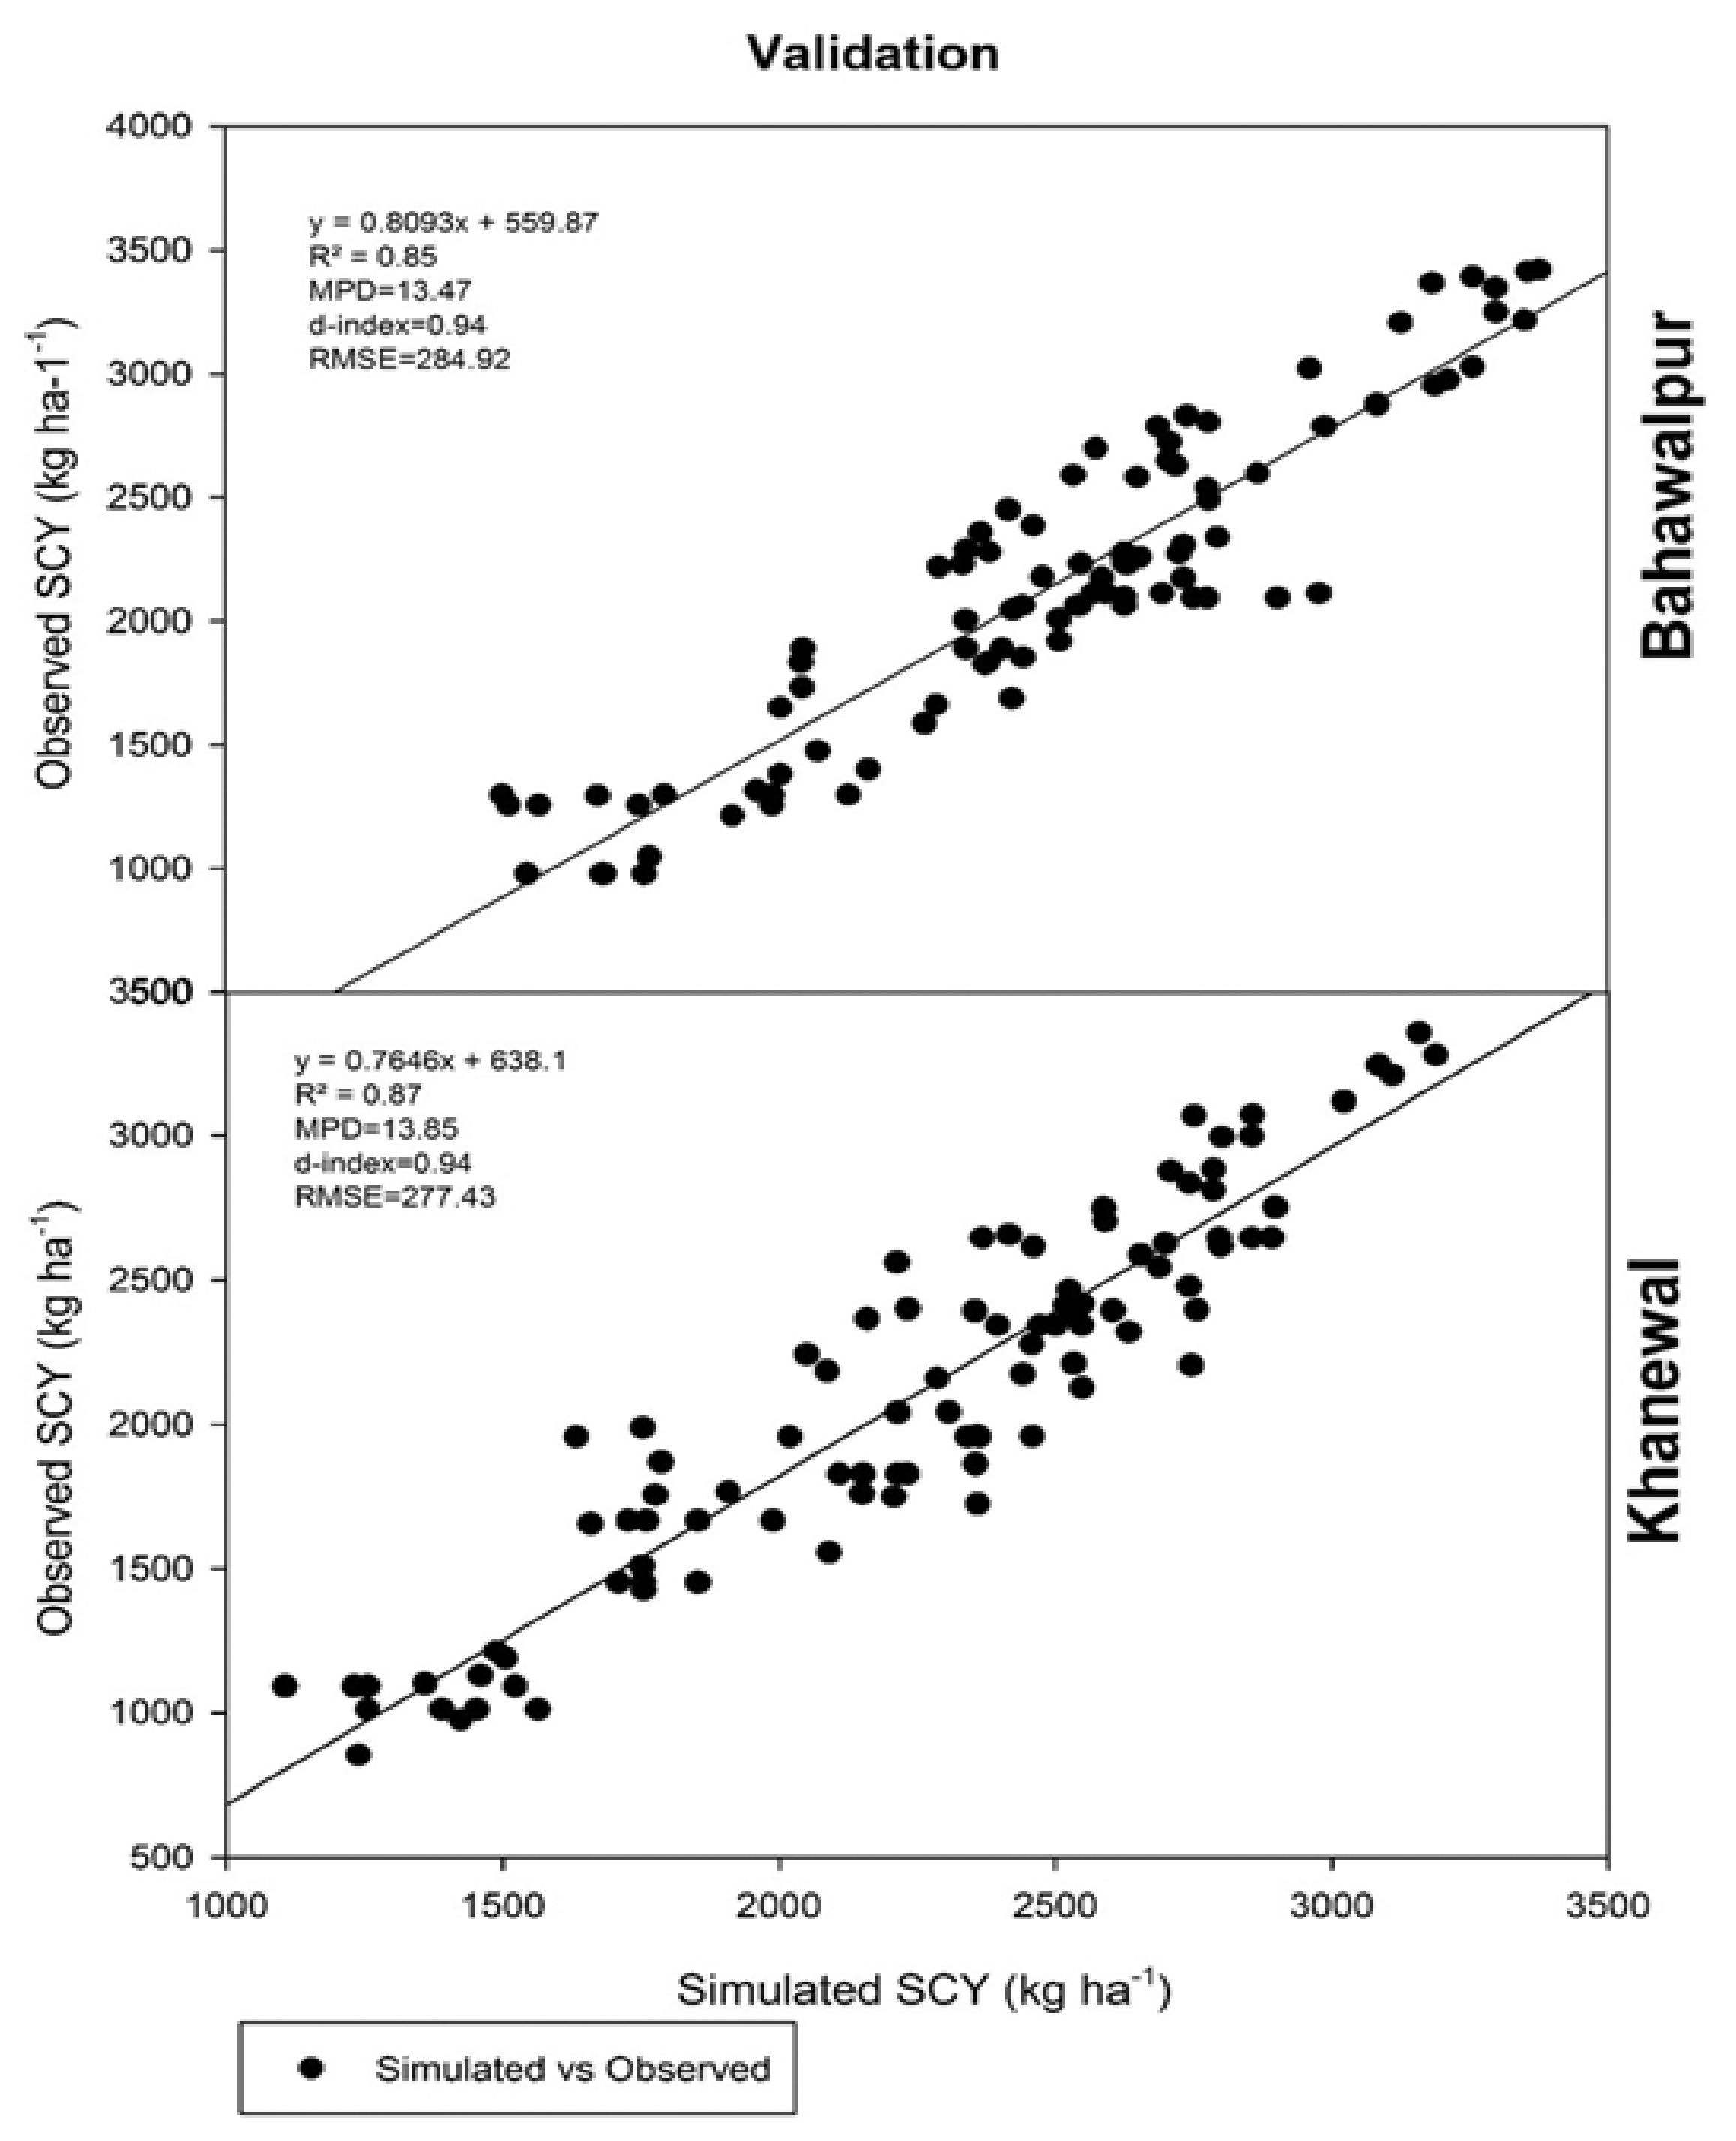
3.4. Model Validation with Surveyed Data
3.5. Impact of Mid Century (2040–2069) Climate Change Scenarios
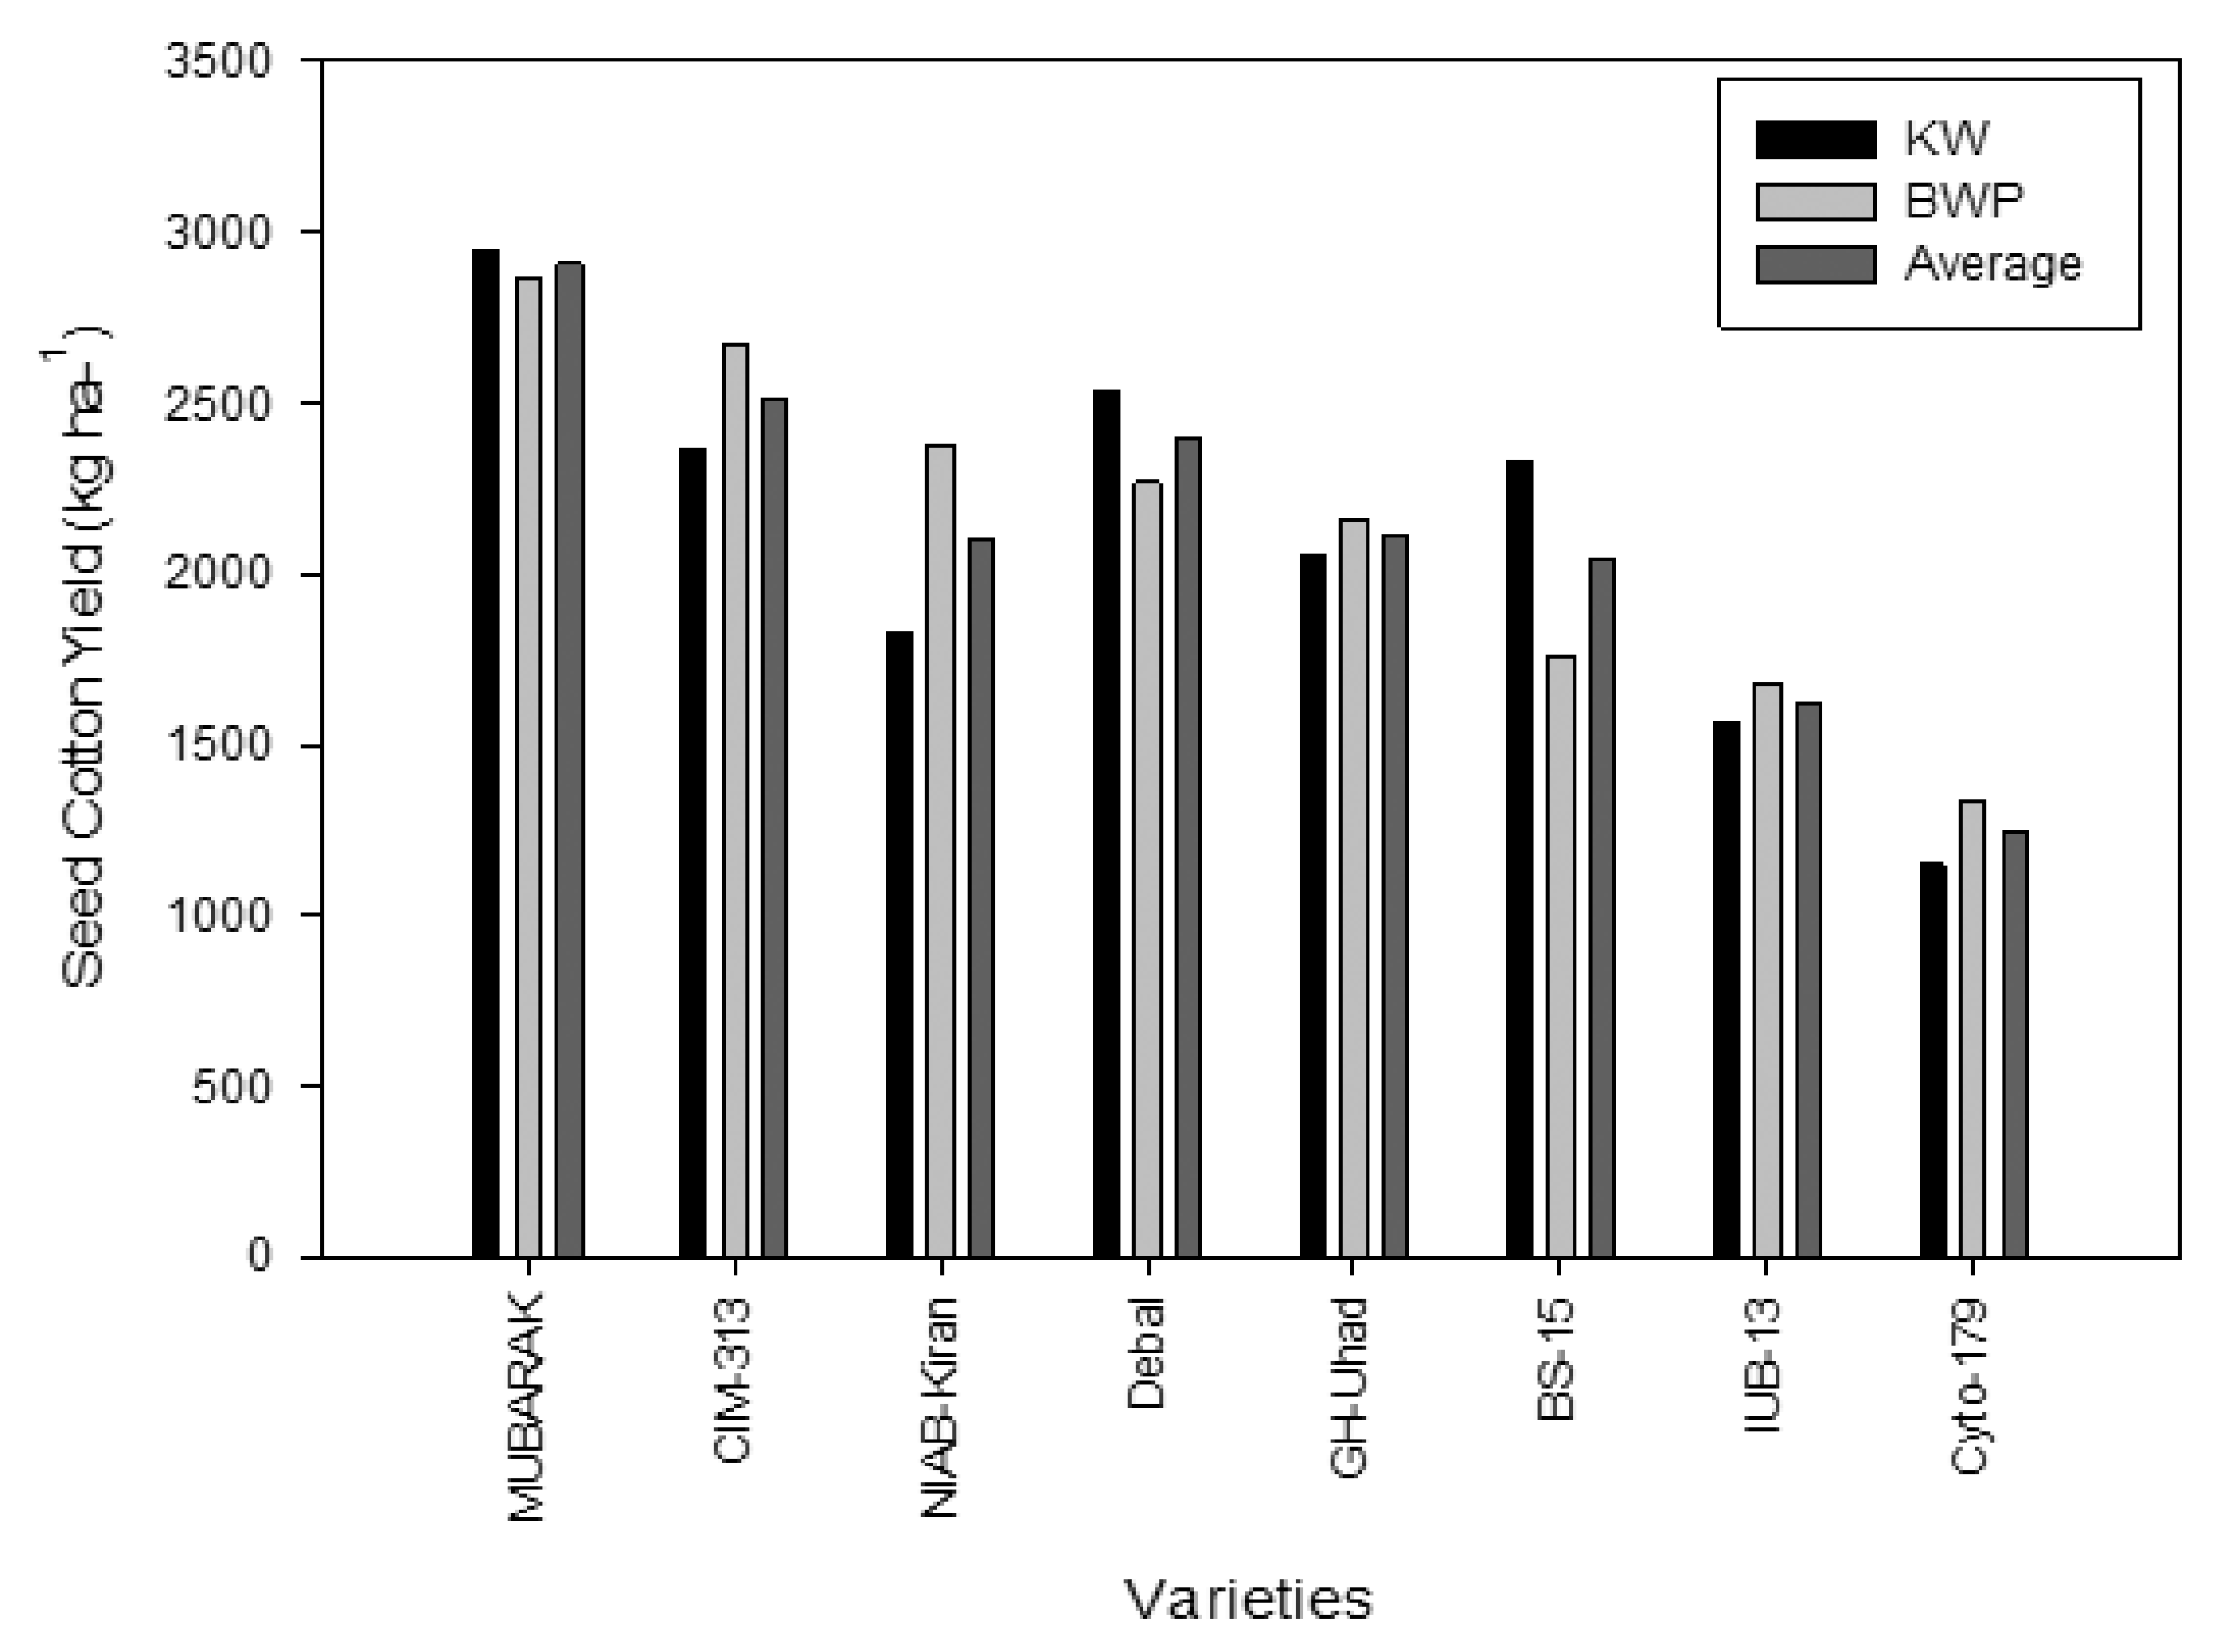
3.6. Selection of Suitable Variety
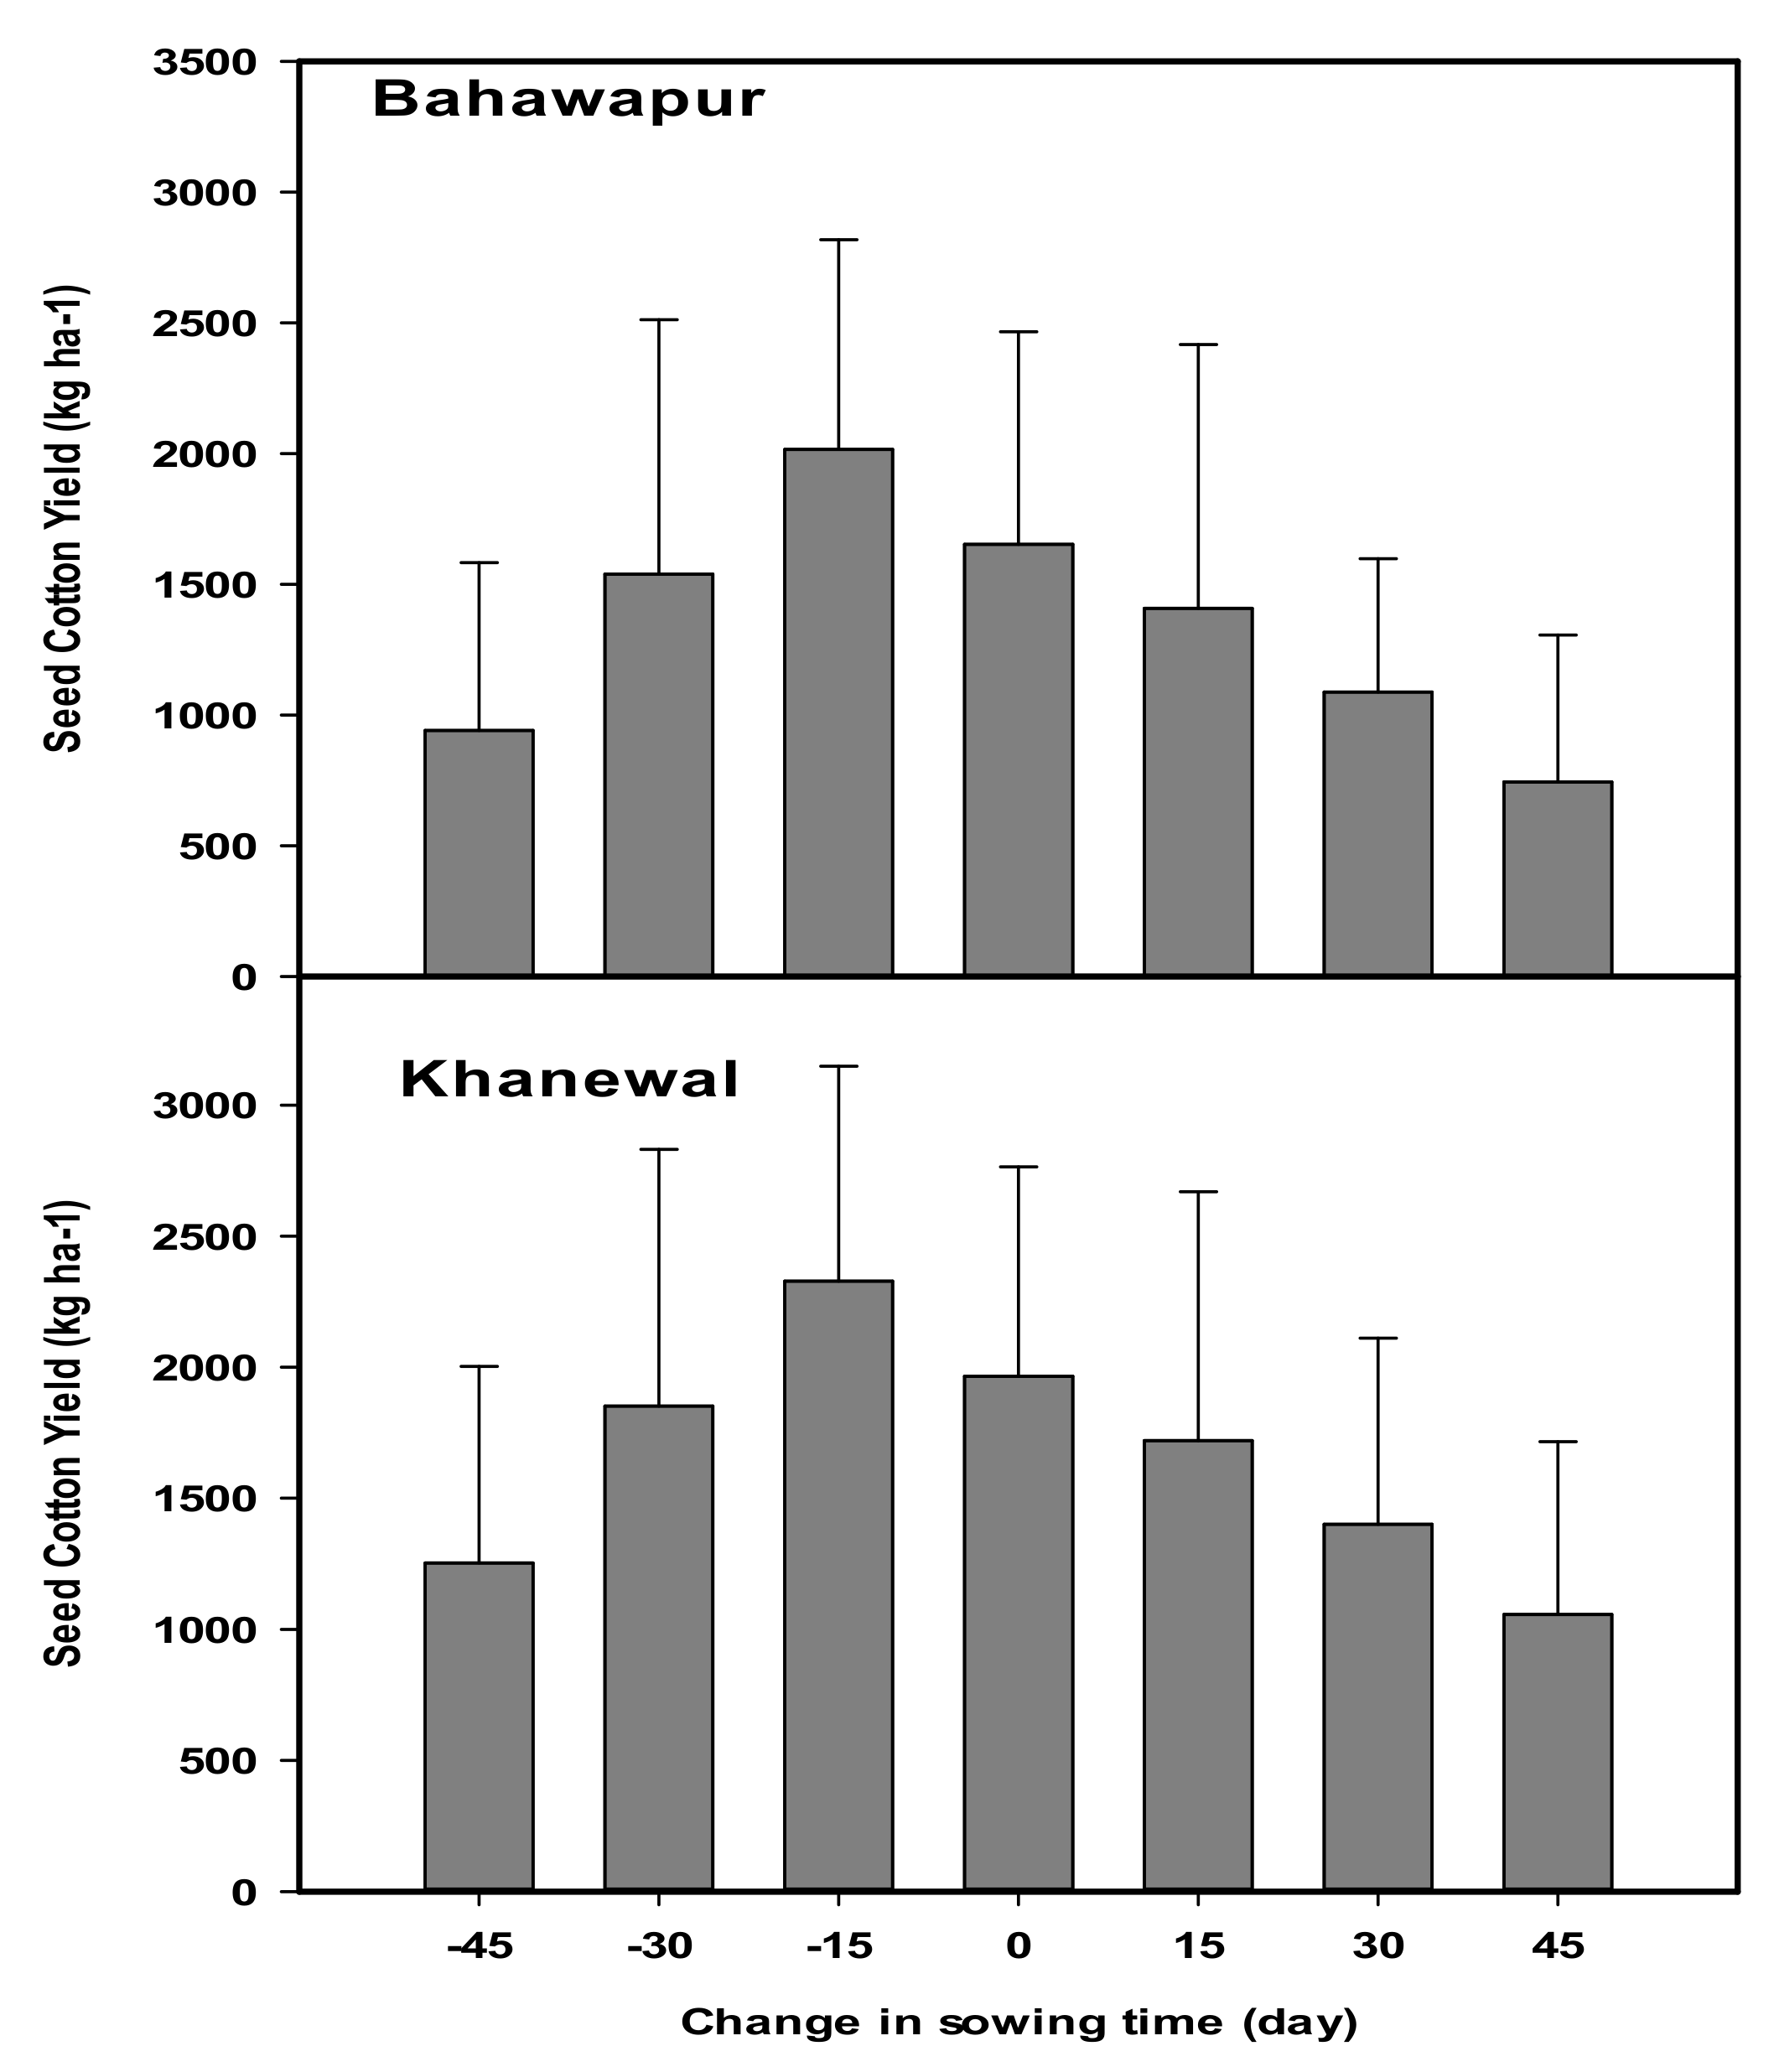
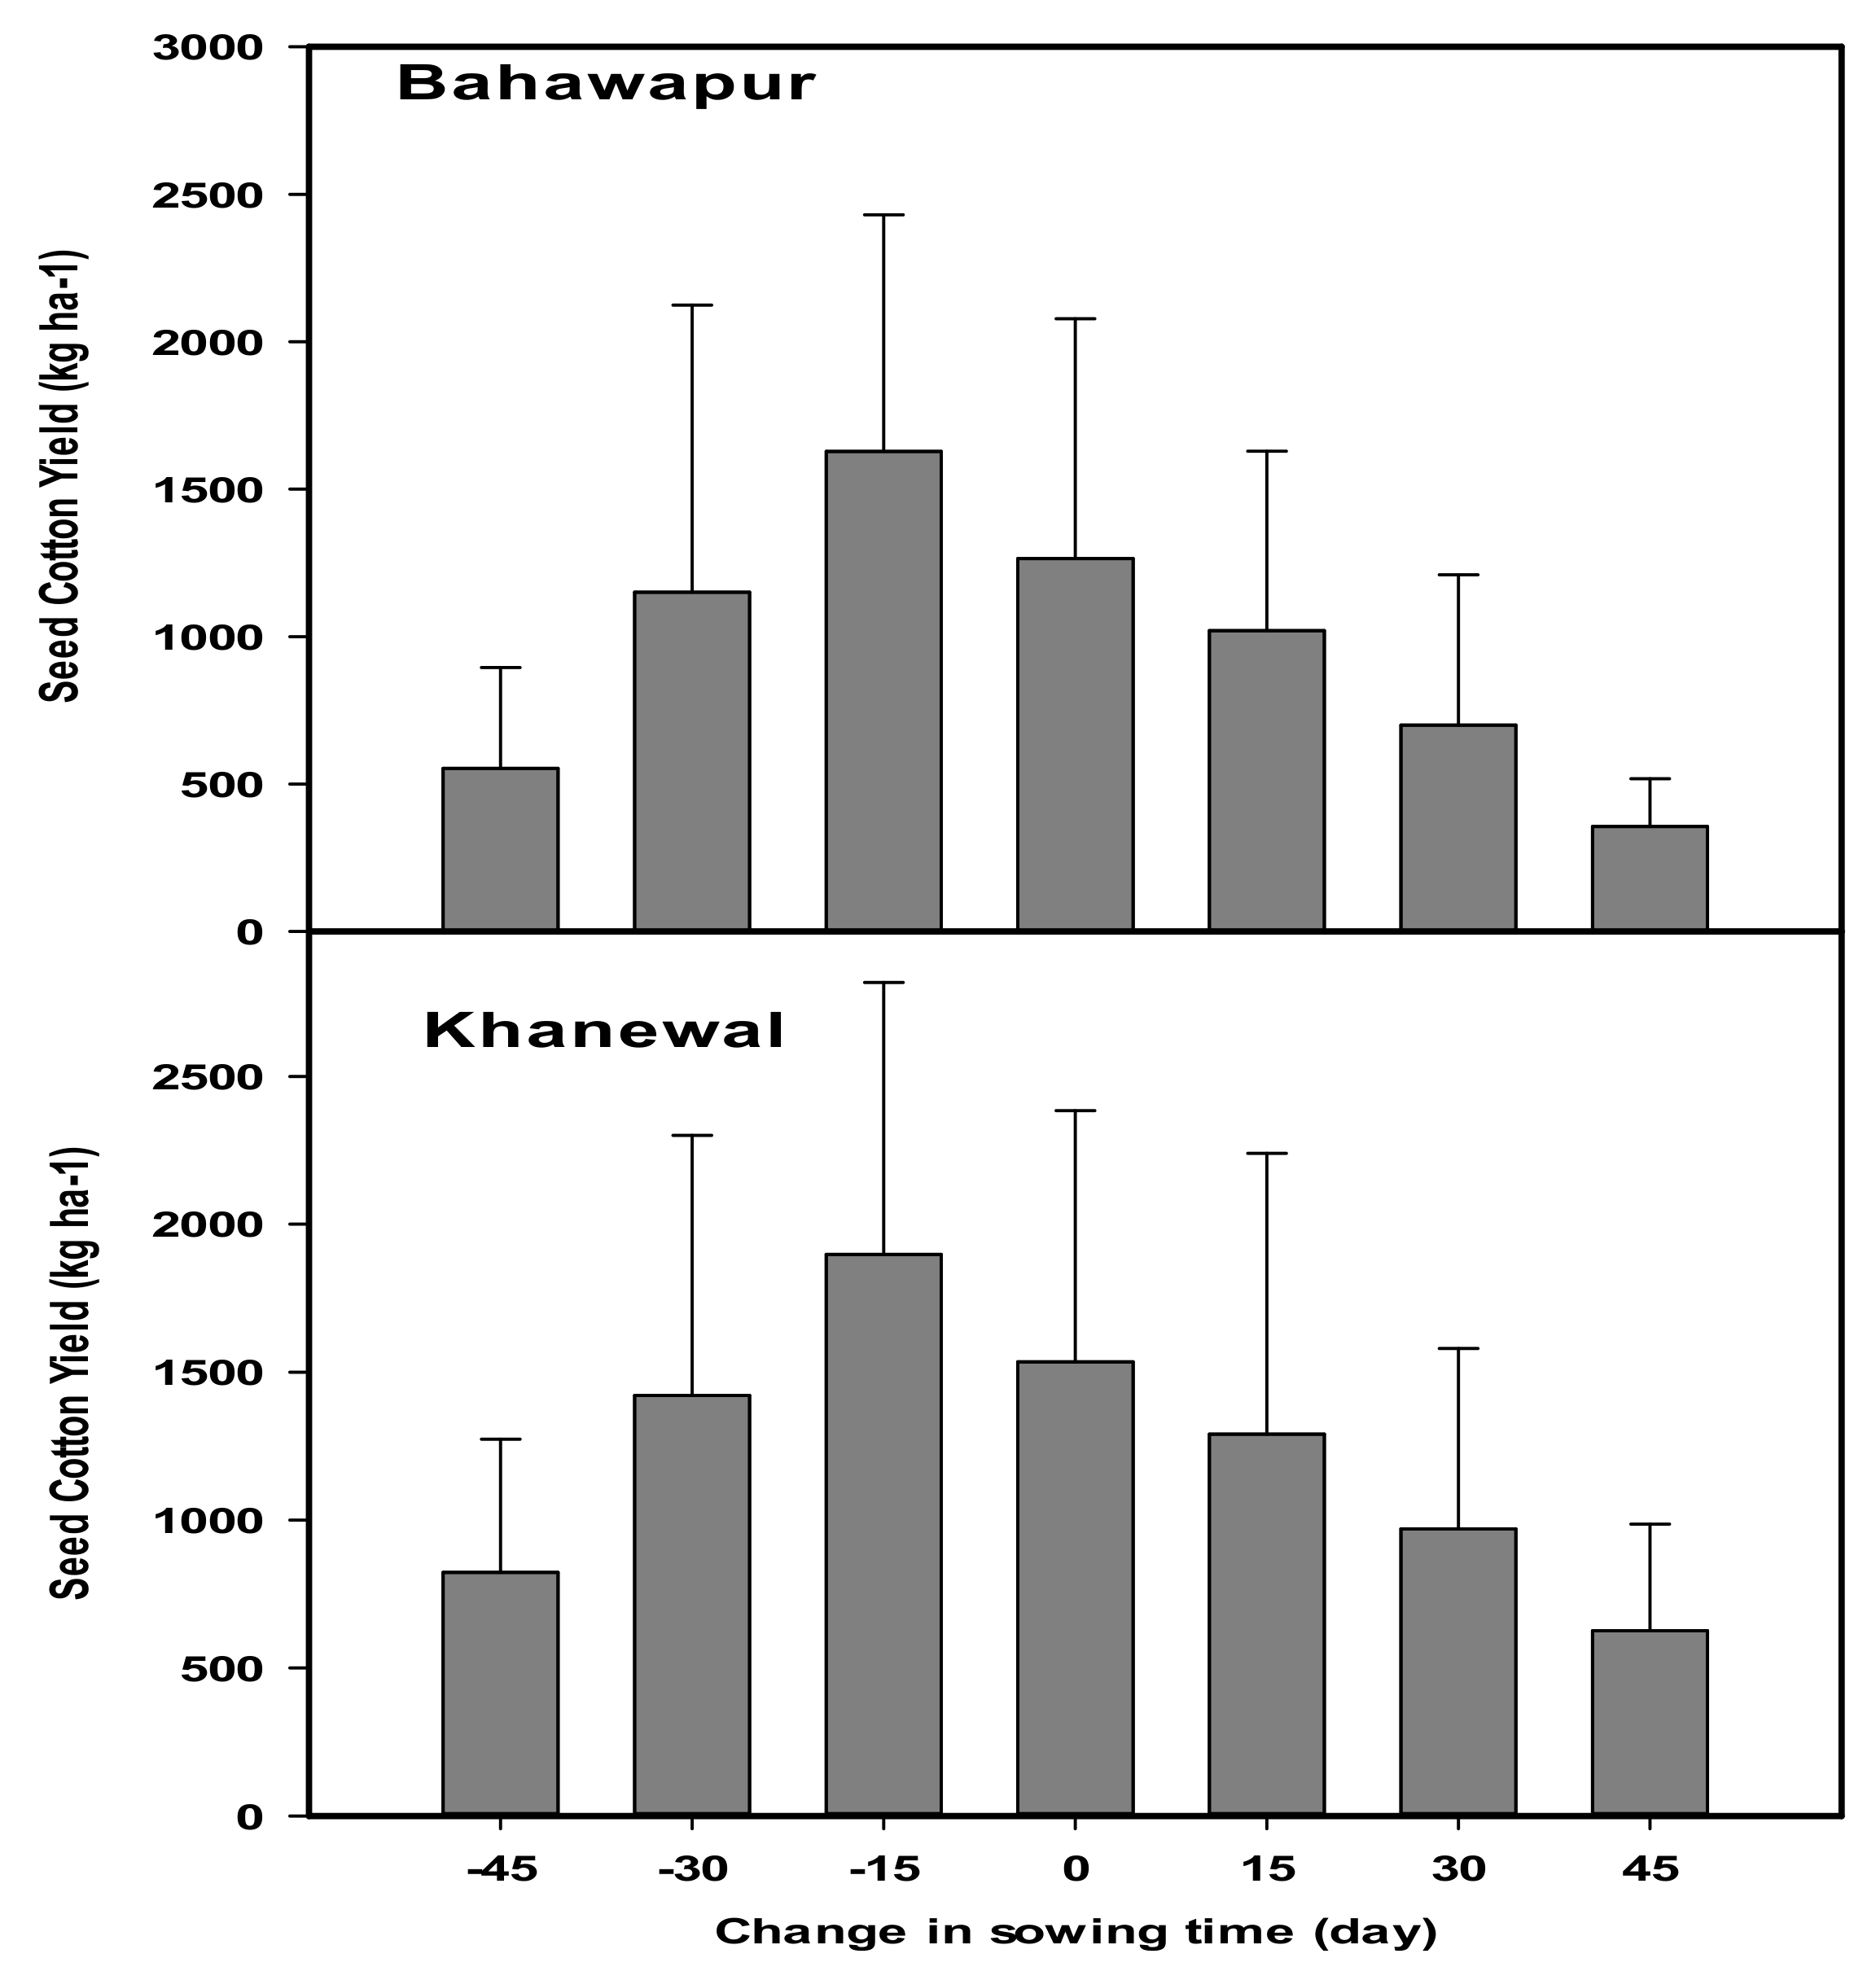
3.7. Optimization of Planting Time
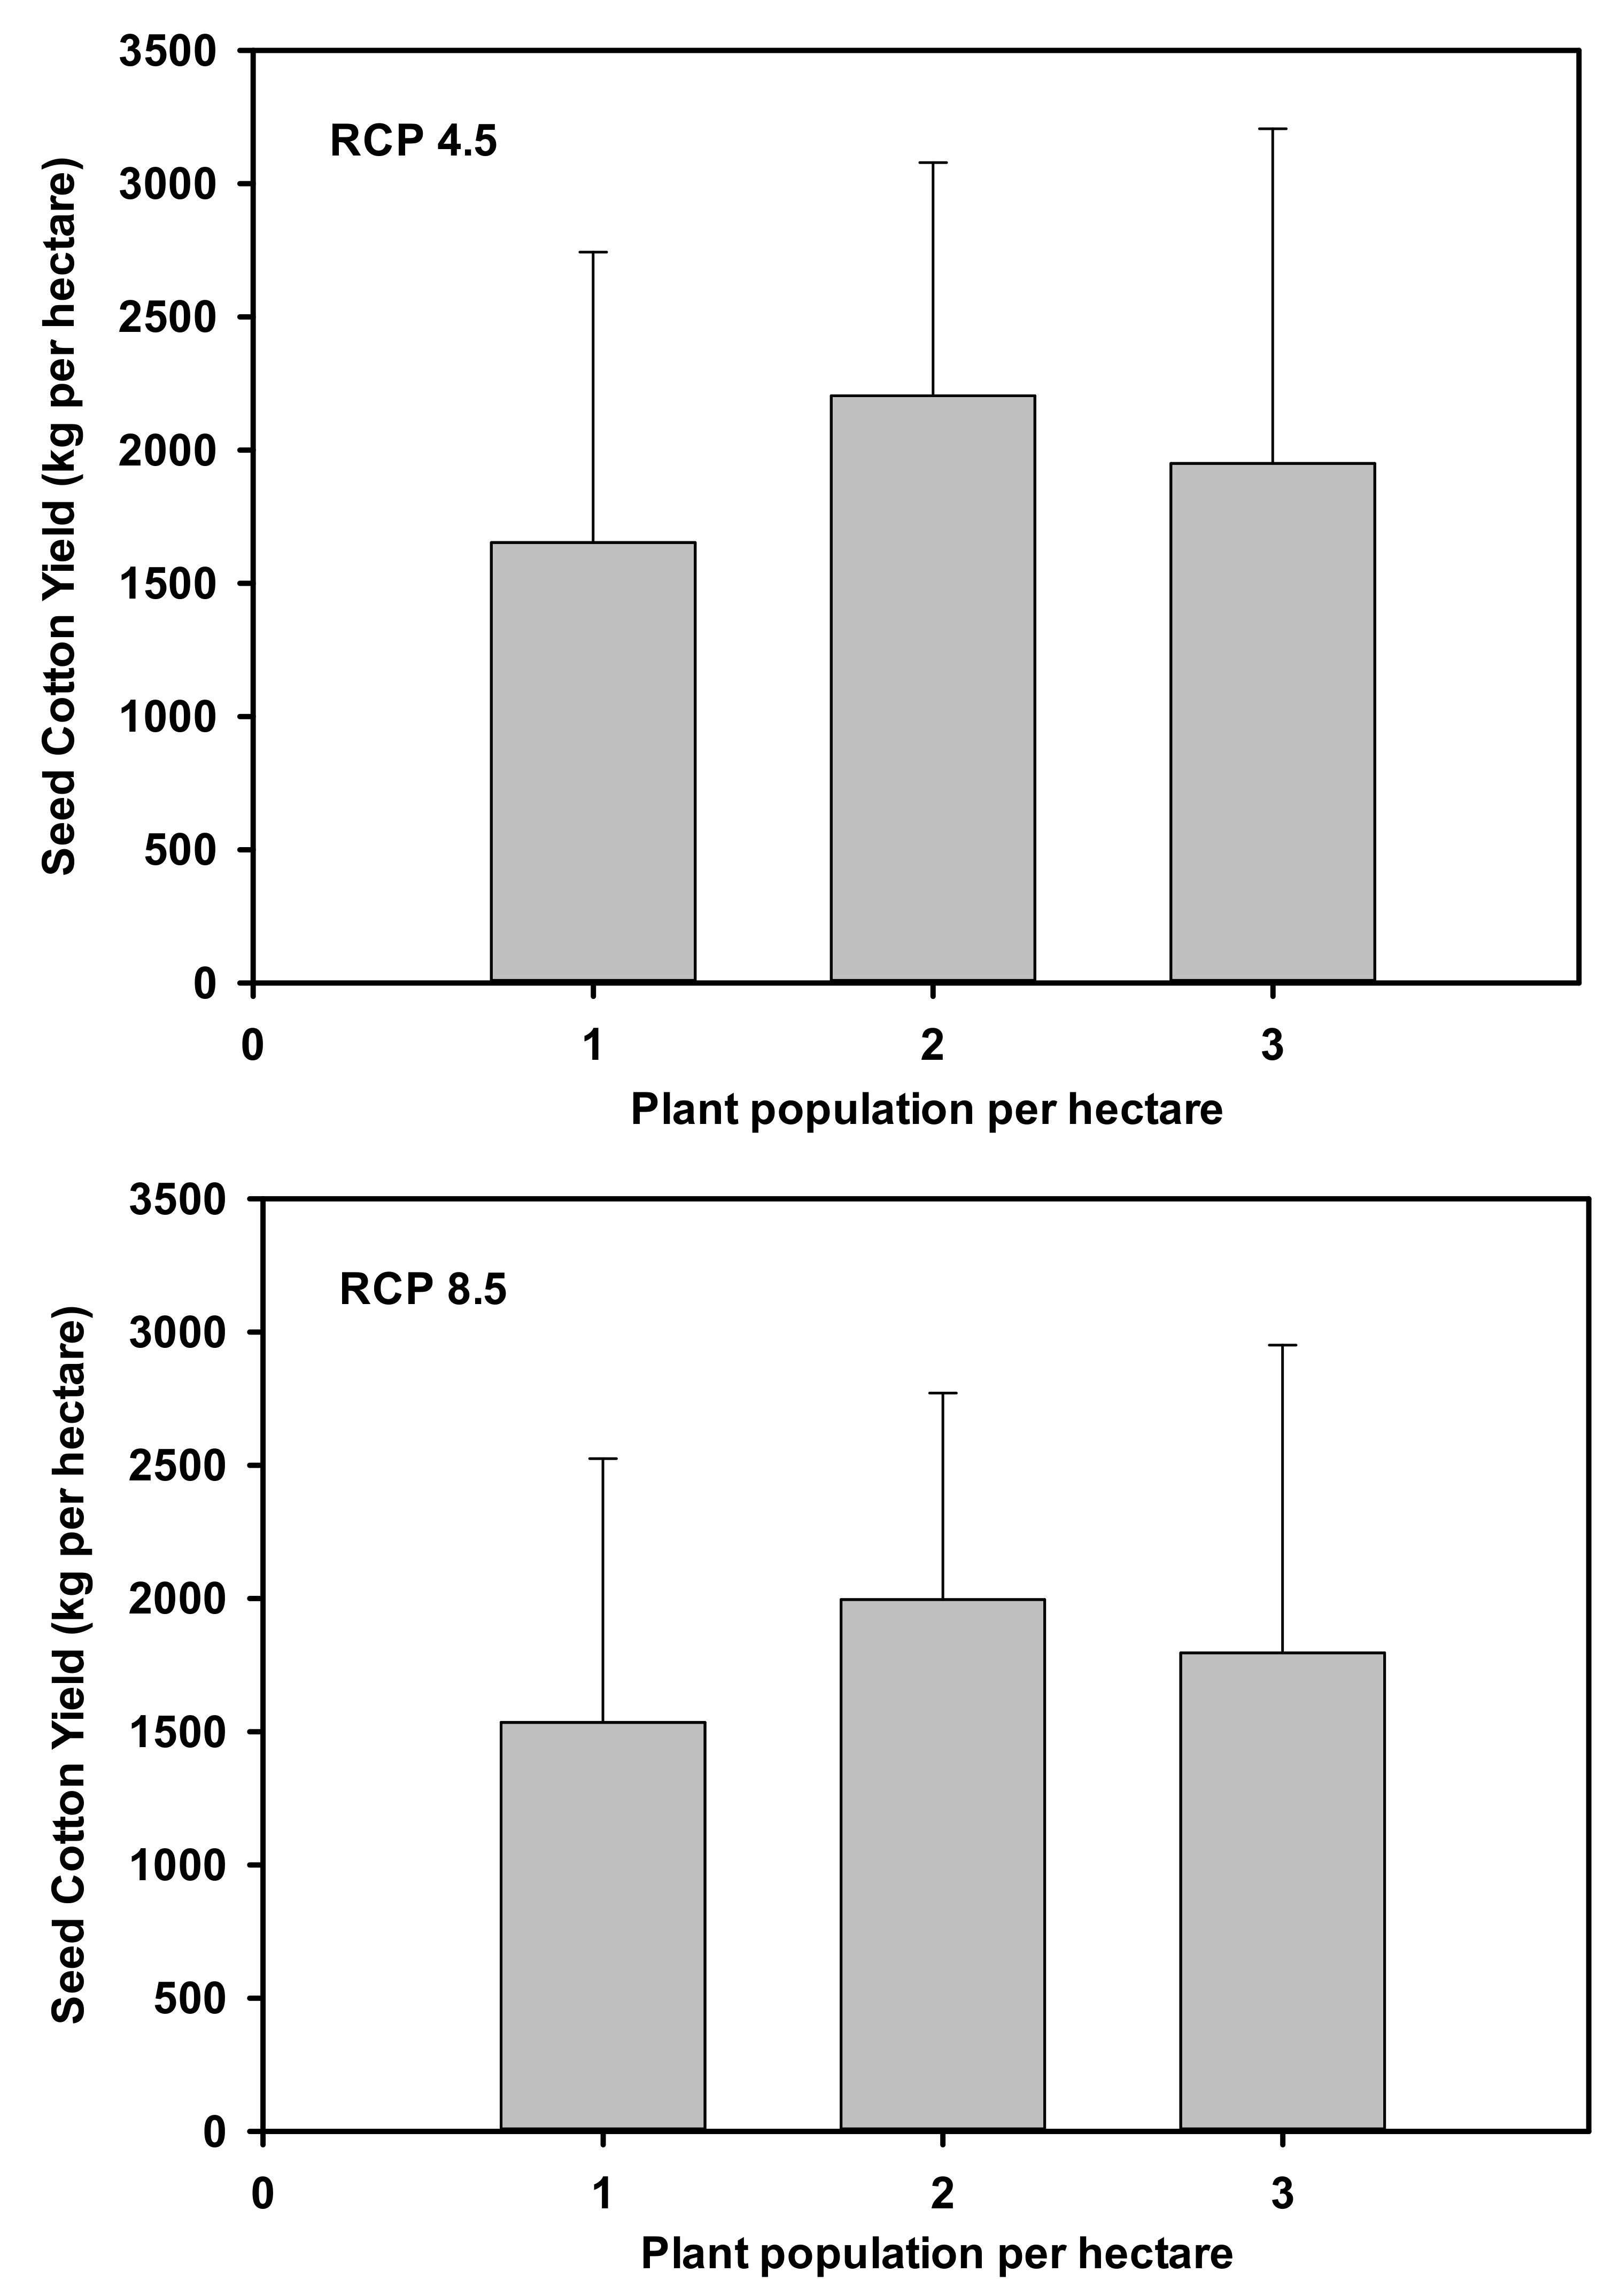
3.8. Optimization of Planting Density
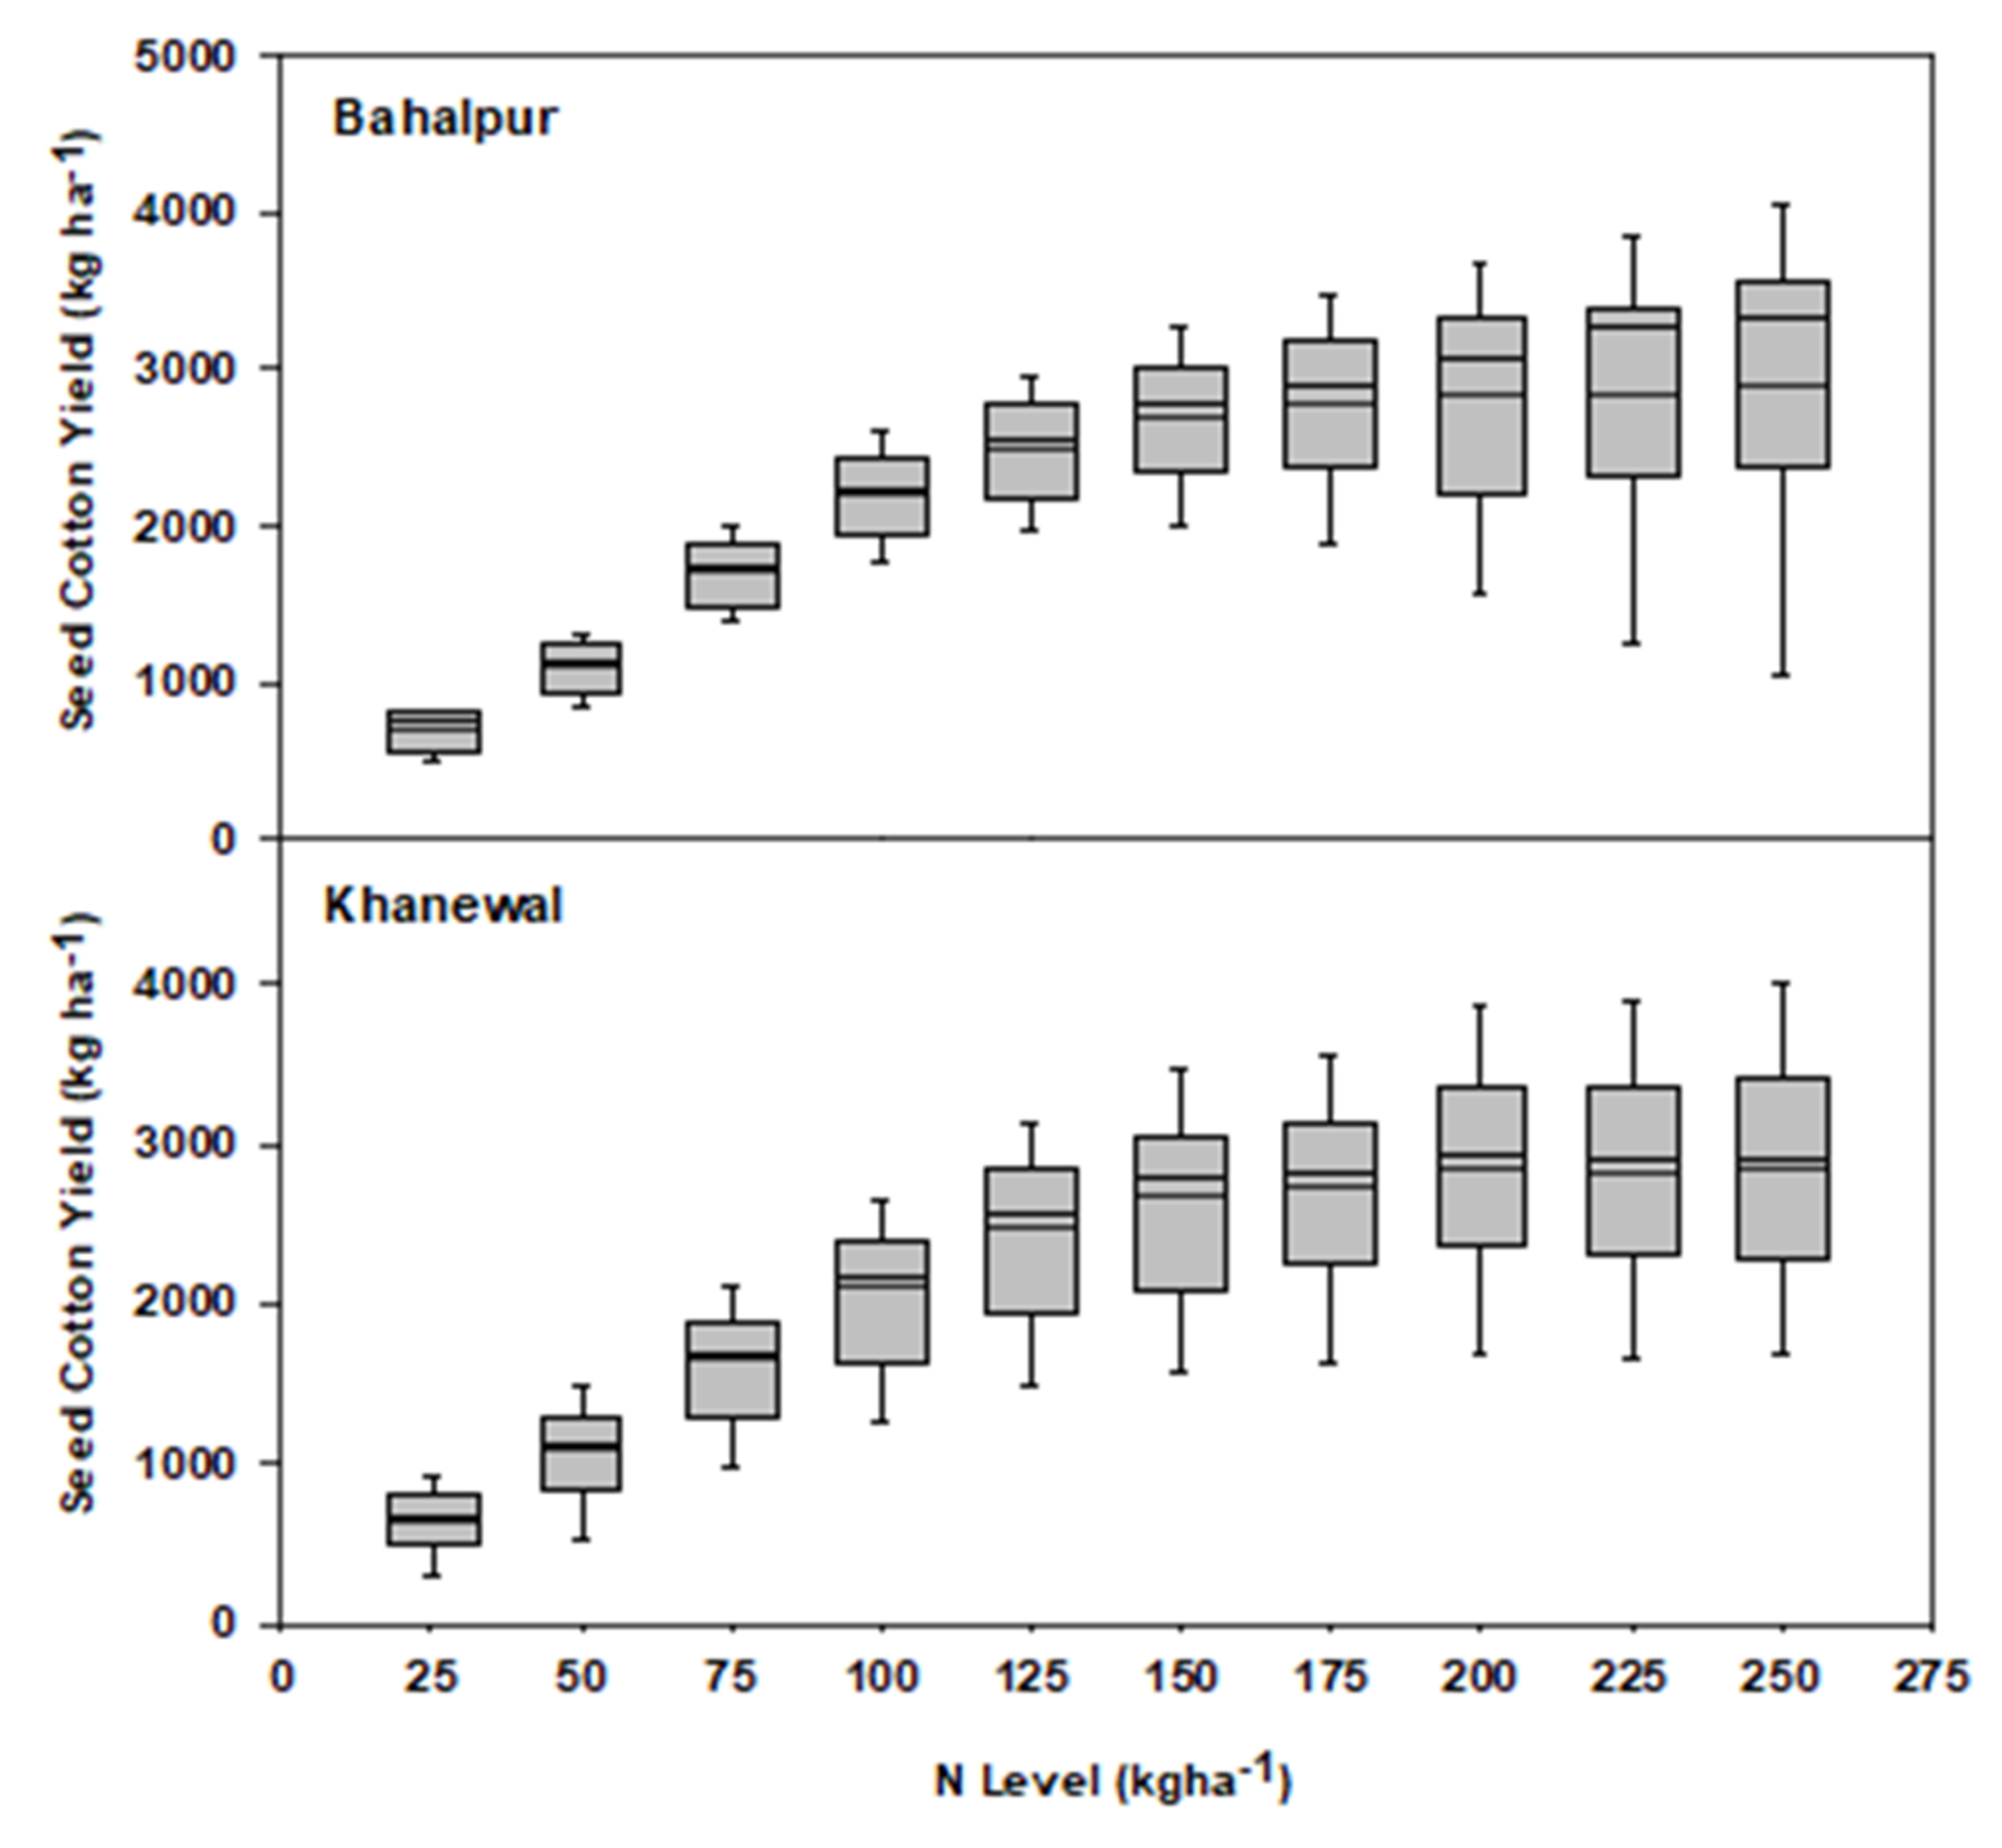
3.9. Optimization of Amount of Nitrogen
3.10. Adaptation Package for Climate-Resilient Cotton Production
4. Discussion
5. Conclusions
Author Contributions
Funding
Institutional Review Board Statement
Informed Consent Statement
Data Availability Statement
Acknowledgments
Conflicts of Interest
References
- Arshad, A.; Raza, M.A.; Zhang, Y.; Zhang, L.; Wang, X.; Ahmed, M.; Habib-ur-Rehman, M. Impact of Climate Warming on Cotton Growth and Yields in China and Pakistan: A Regional Perspective. Agriculture 2021, 11, 97. [Google Scholar] [CrossRef]
- Ullah, A.; Ahmad, A.; Khaliq, T.; Akhtar, J. Recognizing production options for pearl millet in Pakistan under changing climate scenarios. J. Integr. Agric. 2017, 16, 762–773. [Google Scholar] [CrossRef] [Green Version]
- Zhu, T.; Ringler, C.; Iqbal, M.M.; Sulser, T.B.; Goheer, M.A. Climate change impacts and adaptation options for water and food in Pakistan: Scenario analysis using an integrated global water and food projections model. Water Int. 2013, 38, 651–669. [Google Scholar] [CrossRef]
- Iqbal, M.; Ul-Allah, S.; Naeem, M.; Ijaz, M.; Sattar, A.; Sher, A. Response of cotton genotypes to water and heat stress: From field to genes. Euphytica 2017, 213, 131. [Google Scholar] [CrossRef]
- International Trade Centre. Cotton and Climate Change: Impacts and Options to Mitigate and Adapt; Technical Paper, Doc. No. MAR-11-200; EITC: Geneva, Switzerland, 2011; Volume xii, 32p. [Google Scholar]
- Naheed, G.; Rasul, G. Recent Water Requirement of Cotton Crop in Pakistan. Pak. J. Meteor. 2010, 6, 75–84. [Google Scholar]
- Ahmad, A.; Ashfaq, M.; Rasul, G.; Wajid, S.A.; Ahmad, I.; Khaliq, T.; Nasir, J.; Rasul, F.; Riaz, F.; Ahmad, B.; et al. Development of Climate Change Adaptation Strategies for Cotton–Wheat Cropping System of Punjab Pakistan in Handbook of Climate Change and Agroecosystems; Rosenzweig, C., Mutter, C.Z., Contreras, E.M., Eds.; World Scientific: Singapore, 2021. [Google Scholar] [CrossRef]
- Rahman, M.H.; Ahmad, A.; Wajid, A.; Hussain, M.; Rasul, F.; Ishaque, W.; Islam, M.A.; Shelia, V.; Awais, M.; Ullah, A.; et al. Application of CSM-CROPGRO-Cotton model for cultivars and optimum planting dates: Evaluation in changing semi-arid climate. Field Crops Res. 2019, 238, 139–152. [Google Scholar] [CrossRef]
- Gattoo, M.A.; Mustafa, G.; Iqbal, M. Impact of Farm Households’ Adaptations to Climate Change on Food Security: Evidence from Different Agro-ecologies of Pakistan. Pak. Dev. Rev. 2016, 55, 561–588. [Google Scholar] [CrossRef] [Green Version]
- Aslam, A.Q.; Ahmad, S.R.; Ahmad, I.; Hussain, Y.; Hussain, M.S. Vulnerability and impact assessment of extreme climatic event: A case study of southern Punjab, Pakistan. Sci. Total Environ. 2017, 580, 468–481. [Google Scholar] [CrossRef] [PubMed]
- Imran, M.; Ali, A.; Ashfaq, M.; Hassan, S.; Culas, R.; Ma, C. Impact of Climate Smart Agriculture (CSA) Practices on Cotton Production and Livelihood of Farmers in Punjab, Pakistan. Sustainability 2018, 10, 2101. [Google Scholar] [CrossRef] [Green Version]
- Raza, A.; Razzaq, A.; Mehmood, S.; Zou, X.; Zhang, X.; Lv, Y.; Xu, J. Impact of Climate Change on Crops Adaptation and Strategies to Tackle Its Outcome: A Review. Plants 2019, 8, 34. [Google Scholar] [CrossRef] [Green Version]
- Jones, J.; Hoogenboom, G.; Porter, C.; Boote, K.; Batchelor, W.; Hunt, L.; Wilkens, P.; Singh, U.; Gijsman, A.; Ritchie, J. The DSSAT cropping system model. Eur. J. Agron. 2003, 18, 235–265. [Google Scholar] [CrossRef]
- Hoogenboom, G.; Porter, C.H.; Boote, K.J.; Shelia, V.; Wilkens, P.W.; Singh, U.; White, J.W.; Asseng, S.; Lizaso, J.I.; Moreno, L.P.; et al. The DSSAT crop modeling ecosystem. In Advances in Crop Modeling for a Sustainable Agriculture; Boote, K.J., Ed.; Burleigh Dodds Science Publishing: Cambridge, UK, 2019; pp. 173–216. [Google Scholar] [CrossRef]
- Hoogenboom, G.; Porter, C.H.; Shelia, V.; Boote, K.J.; Singh, U.; White, J.W.; Hunt, L.A.; Ogoshi, R.; Lizaso, J.I.; Koo, J.; et al. Decision Support System for Agrotechnology Transfer (DSSAT) Version 4.7.5; DSSAT Foundation: Gainesville, FL, USA, 2019; Available online: https://DSSAT.net (accessed on 21 September 2021).
- Thorp, K.R.; Barnes, E.M.; Hunsaker, D.J.; Kimball, B.A.; White, J.W.; Nazareth, V.J.; Hoogenboom, G. Evaluation of CSM-CROPGRO-cotton for simulating effects of management and climate change on cotton growth and evapotranspiration in an arid environment. Trans. ASABE 2014, 57, 1627–1642. [Google Scholar] [CrossRef]
- Shin, D.W.; Cocke, S.; Baigorria, G.A.; RomeroFFS, C.C.; Kim, B.-M.; Kim, K.-Y. Future Crop Yield Projections Using a Multi-model Set of Regional Climate Models and a Plausible Adaptation Practice in the Southeast United States. Atmosphere 2020, 11, 1300. [Google Scholar] [CrossRef]
- Gul, F.; Ahmed, I.; Ashfaq, M.; Jan, D.; Fahad, S.; Li, X.; Wang, D.; Fahad, M.; Fayyaz, M.; Shah, S.A. Use of crop growth model to simulate the impact of climate change on yield of various wheat cultivars under different agro-environmental conditions in Khyber Pakhtunkhwa, Pakistan. Arab. J. Geosci. 2020, 13, 112. [Google Scholar] [CrossRef]
- Elias, E.H.; Flynn, R.; Idowu, O.J.; Reyes, J.; Sanogo, S.; Schutte, B.J.; Smith, R.; Steele, C.; Sutherland, C. Crop vulnerability to weather and climate risk: Analysis of interacting systems and adaptation efficacy for sustainable crop production. Sustainability 2019, 11, 6619. [Google Scholar] [CrossRef] [Green Version]
- Anser, M.K.; Hina, T.; Hameed, S.; Nasir, M.H.; Ahmad, I.; ur Rehman Naseer, M.A. Modeling Adaptation Strategies against Climate Change Impacts in Integrated Rice-Wheat Agricultural Production System of Pakistan. Int. J. Environ. Res. Public Health 2020, 17, 2522. [Google Scholar] [CrossRef] [Green Version]
- Tolomio, M.; Casa, R. Dynamic crop models and remote sensing irrigation decision support systems: A review of water stress concepts for improved estimation of water requirements. Remote Sens. 2020, 23, 3945. [Google Scholar] [CrossRef]
- Yan, W.; Jiang, W.; Han, X.; Hua, W.; Yang, J.; Luo, P. Simulating and Predicting Crop Yield and Soil Fertility under Climate Change with Fertilizer Management in Northeast China Based on the Decision Support System for Agrotechnology Transfer Model. Sustainability 2020, 12, 2194. [Google Scholar] [CrossRef] [Green Version]
- Hatfield, J.L.; Dold, C. Water-use efficiency: Advances and challenges in a changing climate. Front. Plant Sci. 2019, 10, 103. [Google Scholar] [CrossRef] [Green Version]
- Modala, N.R.; Ale, S.; Rajan, N.; Munster, C.L.; DeLaune, P.B.; Thorp, K.R.; Nair, S.S.; Barnes, E.M. Evaluation of the CSM-CROPGRO-Cotton Model for the Texas Rolling Plains Region and Simulation of Deficit Irrigation Strategies for Increasing Water Use Efficiency. Trans. ASABE 2015, 685–696. [Google Scholar] [CrossRef]
- Adhikari, P.; Gowda, P.H.; Marek, G.W.; Brauer, D.K.; Kisekka, I.; Northup, B.; Rocateli, A. Calibration and Validation of CSM-CROPGRO-Cotton Model Using Lysimeter Data in the Texas High Plains. J. Contemp. Water Res. Educ. 2017, 162, 61–78. [Google Scholar] [CrossRef] [Green Version]
- Hunt, L.A.; Pararajasingham, S.; Jones, J.W.; Hoogenboom, G.; Imamura, D.T.; Ogoshi, R.M. GENCALC: Software to Facilitate the Use of Crop Models for Analyzing Field Experiments. Agron. J. 1993, 85, 1090–1094. [Google Scholar] [CrossRef]
- Wallach, D.; Goffinet, B. Mean squared error of prediction as a criterion for evaluating and comparing system models. Ecol. Modell. 1989, 44, 299–306. [Google Scholar] [CrossRef]
- Willmott, C.J. Some Comments on the Evaluation of Model Performance. Bull. Am. Meteorol. Soc. 1982, 63, 1309–1313. [Google Scholar] [CrossRef] [Green Version]
- Rawls, W.J.; Brakensiek, D.L.; Saxtonn, K.E. Estimation of Soil Water Properties. Trans. ASAE 1982, 25, 1316–1320. [Google Scholar] [CrossRef]
- Taylor, K.E.; Stouffer, R.J.; Meehl, G.A. An Overview of CMIP5 and the Experiment Design. Bull. Am. Meteorol. Soc. 2012, 93, 485–498. [Google Scholar] [CrossRef] [Green Version]
- Ruane, A.C.; Goldberg, R.; Chryssanthacopoulos, J. Climate forcing datasets for agricultural modeling: Merged products for gap-filling and historical climate series estimation. Agric. For. Meteorol. 2015, 200, 233–248. [Google Scholar] [CrossRef] [Green Version]
- Rosenzweig, C.; Jones, J.W.; Hatfield, J.L.; Antle, J.M.; Ruane, A.C.; Mutter, C.Z. The Agricultural Model Intercomparison and Improvement Project: Phase I Activities by a Global Community of Science. In Handbook of Climate Change and Agroecosystems: The Agricultural Model Intercomparison and Improvement Project (Agmip) Integrated Crop and Economic Assessments—Joint Publication with Asa, Cssa, And Sssa (In 2 Parts); GISS Publications: New York, NY, USA, 2015; Volume 3, p. 1. [Google Scholar]
- Pedreira, B.C.; Pedreira, C.G.S.; Boote, K.J.; Lara, M.A.S.; Alderman, P.D. Adapting the CROPGRO perennial forage model to predict growth of Brachiaria brizantha. Field Crops Res. 2011, 120, 370–379. [Google Scholar] [CrossRef]
- Ortiz, B.V.; Hoogenboom, G.; Vellidis, G.; Boote, K.; Davis, R.F.; Perry, C. Adapting the CROPGRO-cotton model to simulate cotton biomass and yield under southern root-knot nematode parasitism. Trans. ASABE 2009, 52, 2129–2140. [Google Scholar] [CrossRef]
- Malik, W.; Boote, K.J.; Hoogenboom, G.; Cavero, J.; Dechmi, F. Adapting the CROPGRO Model to Simulate Alfalfa Growth and Yield. Agron. J. 2018, 110, 1777–1790. [Google Scholar] [CrossRef] [Green Version]
- Wajid, A.; Ahmad, A.; Khaliq, T.; Alam, S.; Hussaun, A.; Hussain, K.; Naseem, W.; Usman, M.; Ahmad, S. Quantification of growth, yield and radiation use efficiency of promising cotton cultivars at varying nitrogen levels. Pak. J. Bot. 2010, 42, 1703–1711. [Google Scholar]
- San José, R.; Pérez, J.L.; González, R.M.; Pecci, J.; Garzón, A.; Palacios, M. Impacts of the 4.5 and 8.5 RCP global climate scenarios on urban meteorology and air quality: Application to Madrid, Antwerp, Milan, Helsinki and London. J. Comput. Appl. Math. 2016, 293, 192–201. [Google Scholar] [CrossRef]
- Abadie, L.M.; Jackson, L.P.; Sainz de Murieta, E.; Jevrejeva, S.; Galarraga, I. Comparing urban coastal flood risk in 136 cities under two alternative sea-level projections: RCP 8.5 and an expert opinion-based high-end scenario. Ocean Coast. Manag. 2020, 193, 105249. [Google Scholar] [CrossRef]
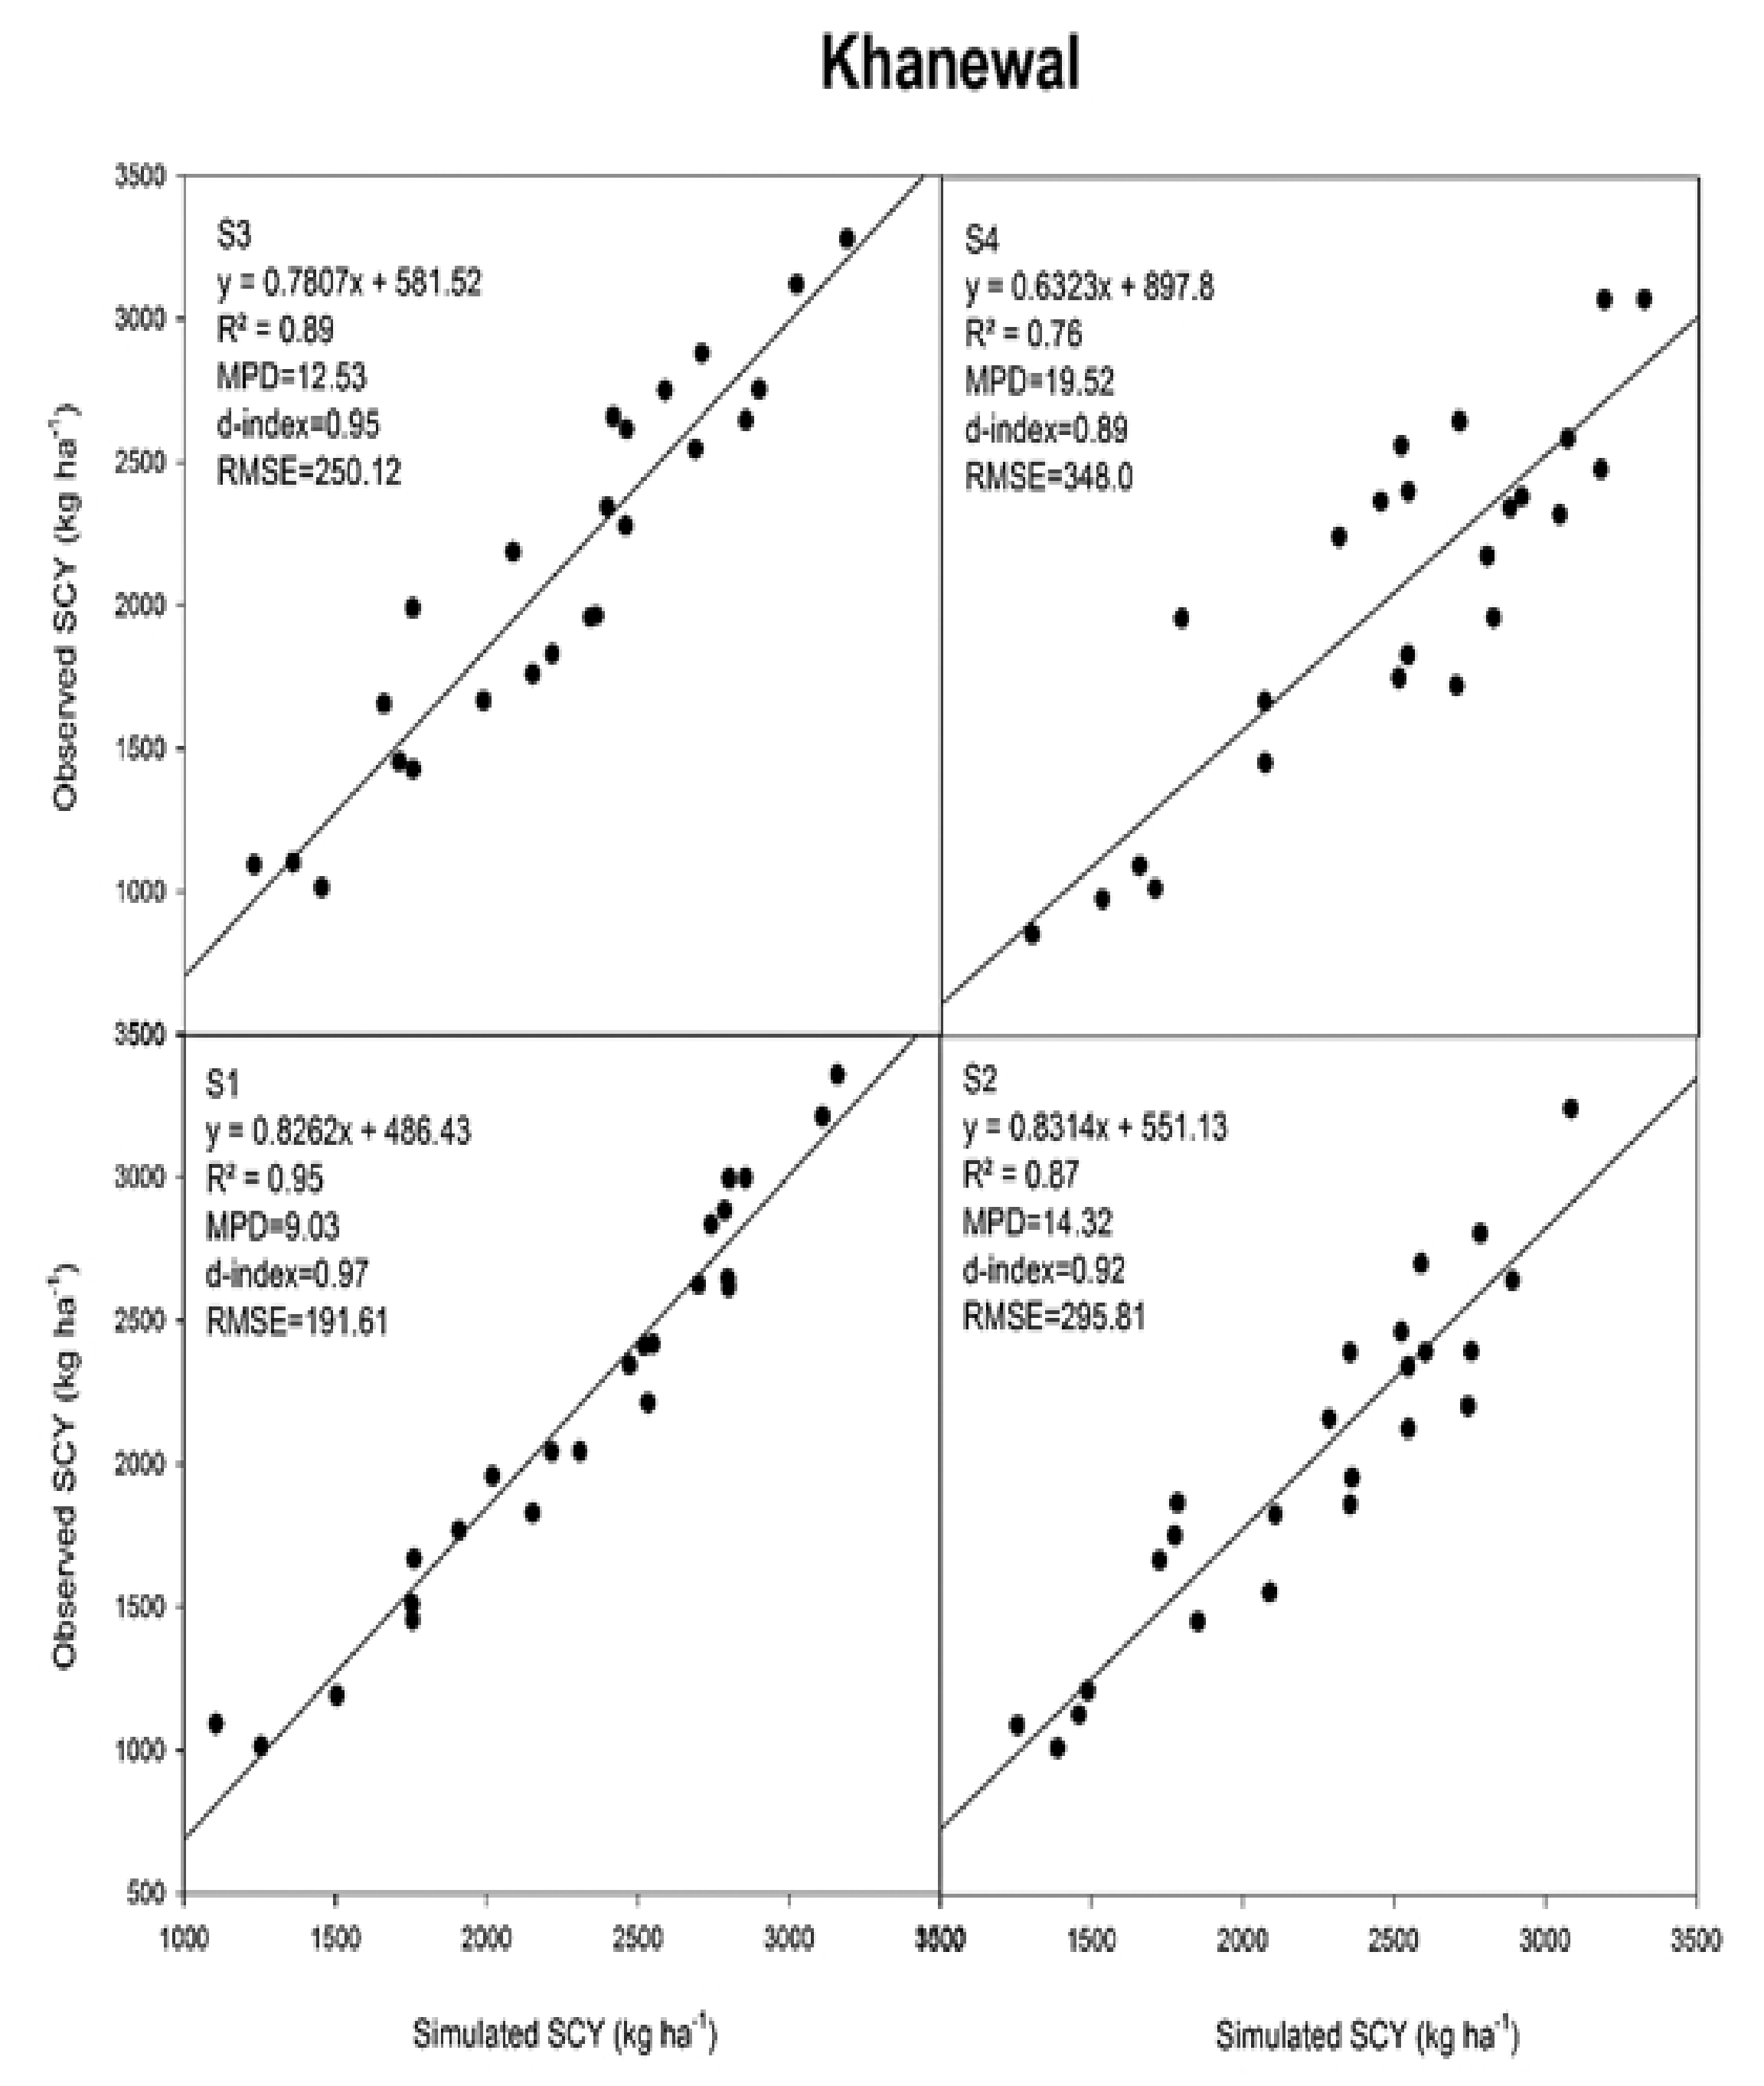
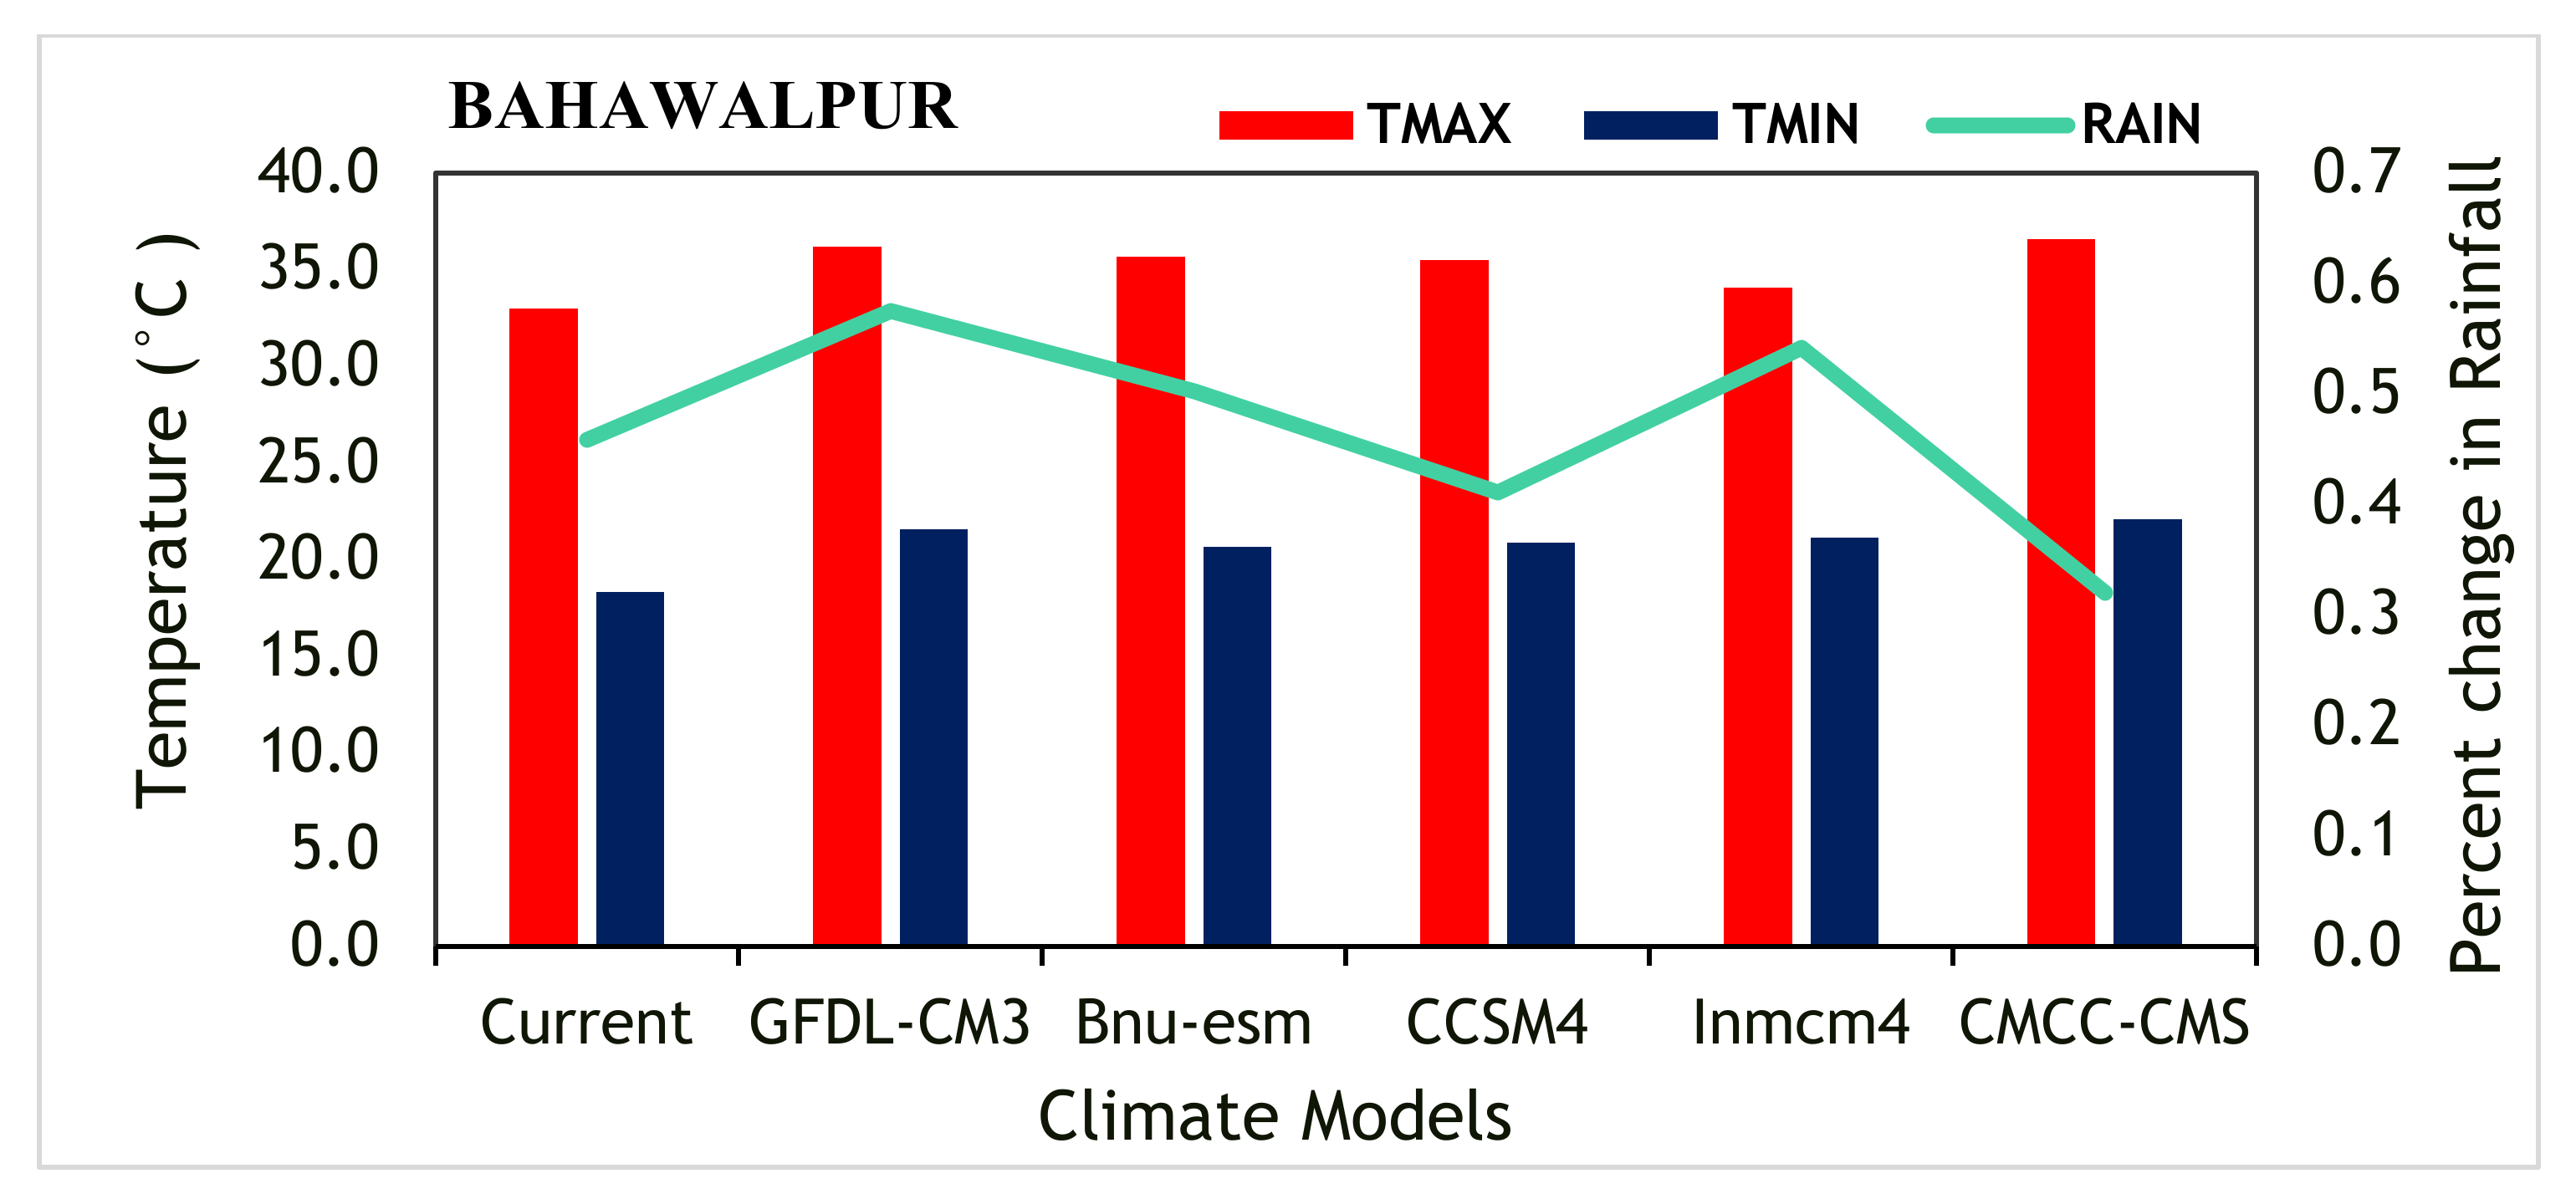
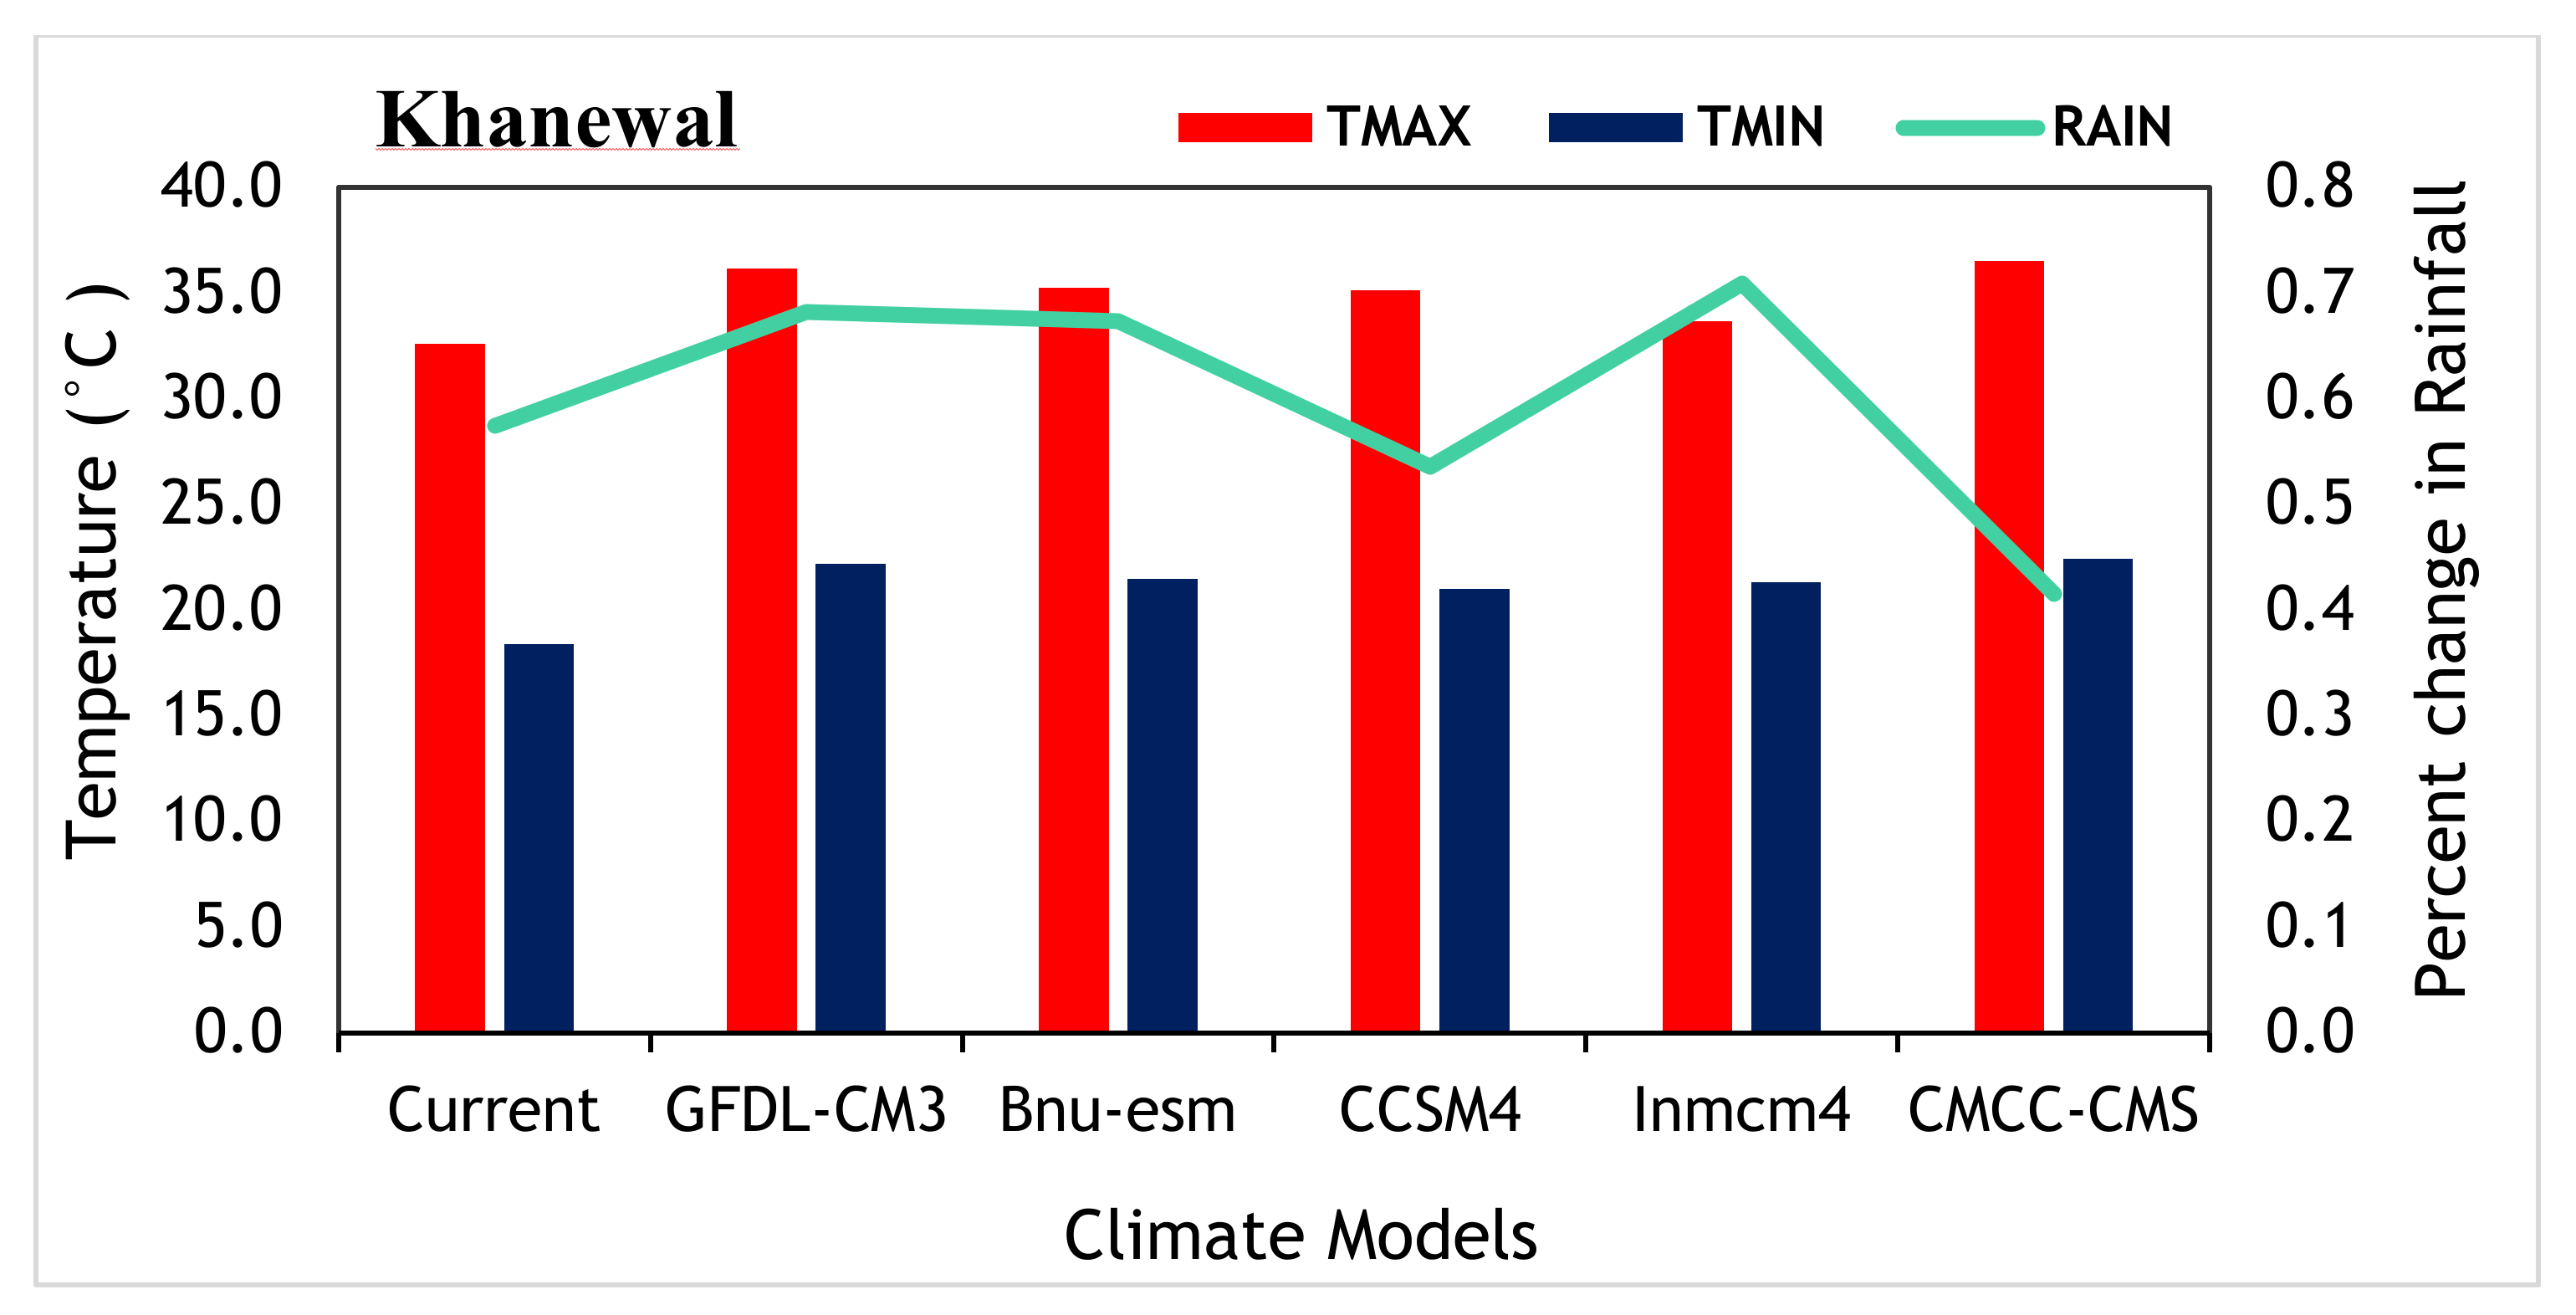
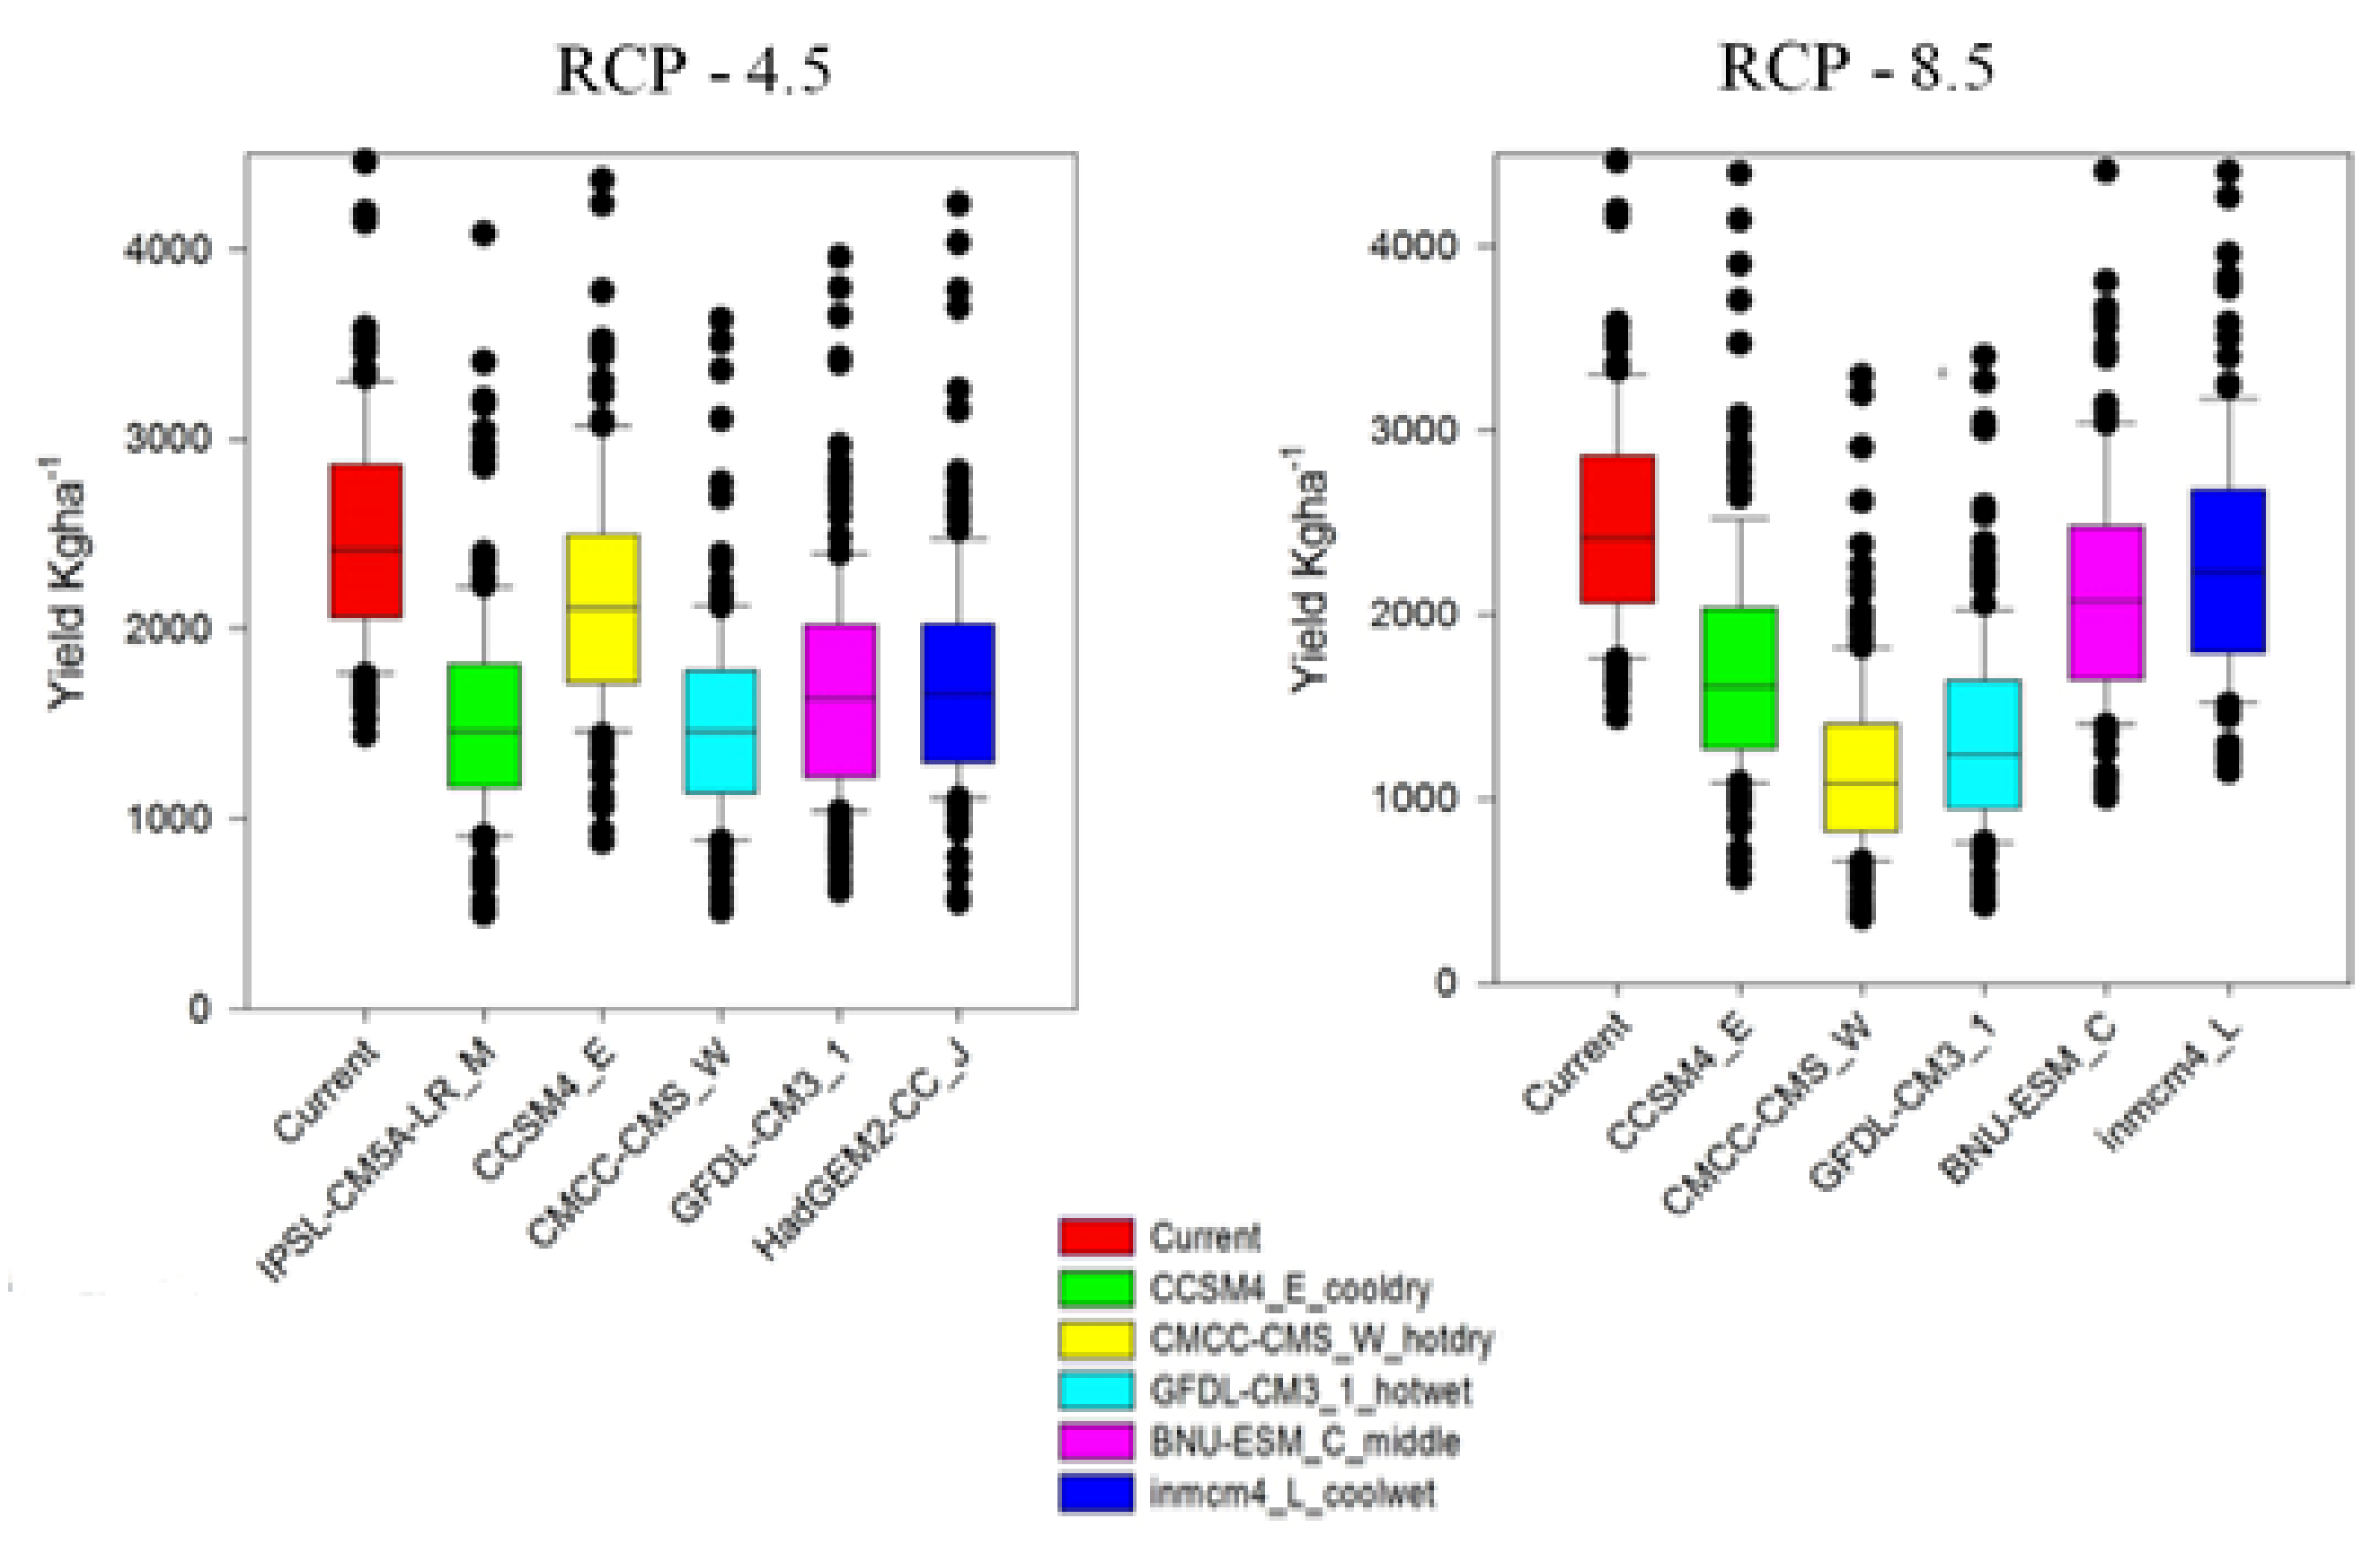
| Parameters | Calibrated Value | Testing Range | Default Value | |||||||||
|---|---|---|---|---|---|---|---|---|---|---|---|---|
| NIAB-878 | FH-Lalazar | BS-15 | IUB-13 | Mubarak | GH-Uhad | Debal | Cyto-179 | NIAB-Kiran | CIM-313 | |||
| Development | ||||||||||||
| FL-EM | 5 | 5 | 5 | 5 | 5 | 5 | 5 | 5 | 5 | 5 | 3–9 | 4 |
| EM-FL | 46 | 45 | 40 | 42 | 43 | 44 | 43 | 44 | 46 | 43 | 35 to 50 | 38 |
| FL-SH | 11 | 13 | 12 | 15 | 16 | 14 | 15 | 16 | 12 | 14 | 05–20 | 12 |
| FL-SD | 24 | 25 | 28 | 30 | 26 | 20 | 21 | 26 | 22 | 27 | 10–30 | 15 |
| SD-PM | 48 | 49 | 48 | 50 | 52 | 46 | 45 | 51 | 43 | 45 | 30–60 | 42 |
| FL-LF | 68 | 70 | 72 | 69 | 70 | 69 | 71 | 66 | 65 | 73 | 35–80 | 75 |
| Growth | ||||||||||||
| LFMAX | 1.45 | 1.50 | 1.13 | 1.15 | 1.42 | 1.52 | 1.37 | 1.34 | 1.48 | 1.47 | 0.5–2.0 | 1.1 |
| SLAVR | 139 | 155 | 150 | 145 | 165 | 163 | 140 | 145 | 142 | 160 | 100–250 | 170 |
| SIZLF | 275 | 305 | 300 | 280 | 320 | 315 | 305 | 285 | 290 | 310 | 200–400 | 300 |
| Yield | ||||||||||||
| XFRT | 0.65 | 0.63 | 0.69 | 0.70 | 0.61 | 0.67 | 0.60 | 0.65 | 0.67 | 0.64 | 0.50–0.90 | 0.85 |
| SFDUR | 31 | 35 | 32 | 33 | 30 | 34 | 36 | 30 | 32 | 35 | 15–40 | 24 |
| PODUR | 14.0 | 13.0 | 14.5 | 13.5 | 14.0 | 15.0 | 15.5 | 14.5 | 13.5 | 13 | 5–20 | 8 |
| THRSH | 65 | 68 | 63 | 70 | 71 | 73 | 69 | 72 | 70 | 72 | 40–90 | 70 |
| District | Soil Series | Characteristics |
|---|---|---|
| Bahawalpur (29°25′ N and 71°40′ E) | Bijnot | Fine sands |
| Thar | Fine sands | |
| Maruwala | Loamy fine sands. | |
| Khanewal (30°17′ N and 71°55′ E) | Miani | Silty clay loams |
| Nabipur | Loams | |
| Sultanpur | Silt loams and very fine sandy loams |
| GCMs Names | Categories |
|---|---|
| GFDL-CM3_1 | Hotwet |
| BNU-ESM | Middle |
| CCSM4_E | Cooldry |
| INMCM4 | Coolwet |
| CMCC-CMS_W | Hotdry |
| Variables | Scenarios | Cotton |
|---|---|---|
| Δ Tmax (°C) | RCP 4.5 | 2.4 |
| RCP 8.5 | 3.5 | |
| Δ Tmin (°C) | RCP 4.5 | 2.7 |
| RCP 8.5 | 3.8 | |
| Δ Rain (%) | RCP 4.5 | −33.1 |
| RCP 8.5 | −51.7 |
| Parameters | NIAB-878 | FH-Lalazar | BS-15 | Average | ||||||||
|---|---|---|---|---|---|---|---|---|---|---|---|---|
| Obs. | Sim. | Error % | obs. | Sim. | Error % | Obs. | Sim. | Error % | Obs. | Sim. | Error % | |
| Days to Anthesis | 60 | 61 | 1.67 | 60 | 61 | 1.67 | 60 | 61 | 1.67 | 60 | 61 | 1.67 |
| Days to physiological maturity | 186 | 184 | −1.08 | 186 | 184 | −1.08 | 186 | 184 | −1.08 | 186 | 184 | −1.08 |
| LAI | 5.74 | 5.63 | −1.92 | 5.02 | 4.85 | −3.39 | 5.19 | 4.91 | −5.39 | 5.32 | 5.13 | −3.57 |
| TDM (kg ha−1) | 13,309 | 13,568 | 1.95 | 11,493 | 12,306 | 7.08 | 11,854 | 12,501 | 5.44 | 12,218 | 12,792 | 4.82 |
| SCY (kg ha−1) | 3160 | 3209 | 1.56 | 2943 | 3058 | 3.92 | 2984 | 3125 | 4.72 | 3029 | 3131 | 3.40 |
| Treatments | Days to Anthesis | Days to Physiological Maturity | ||||
|---|---|---|---|---|---|---|
| Obs. | Sim. | Error (%) | Obs. | Sim. | Error (%) | |
| S2V1 | 56 | 59 | 5.36 | 173 | 180 | 4.05 |
| S2V2 | 55 | 59 | 7.27 | 173 | 180 | 4.05 |
| S2V3 | 55 | 59 | 7.27 | 173 | 180 | 4.05 |
| S3V1 | 50 | 56 | 12.00 | 161 | 175 | 8.70 |
| S3V2 | 49 | 56 | 14.29 | 161 | 175 | 8.70 |
| S3V3 | 49 | 56 | 14.29 | 161 | 175 | 8.70 |
| Average | 52 | 58 | 9.87 | 167 | 178 | 6.29 |
| D-Index | 0.58 | 0.56 | ||||
| MPD | 10.08 | 6.37 | ||||
| RMSE | 5.40 | 11.07 | ||||
| Treatments | LAI | SCY (kg ha−1) | RMSE (kg ha−1) | ||||||
|---|---|---|---|---|---|---|---|---|---|
| Obs. | Sim. | Error (%) | Obs. | Sim. | Error (%) | Obs. | Sim. | Error (%) | |
| S2V1 | 4.67 | 4.23 | −9.42 | 2824 | 2956 | 4.69 | 11232 | 11530 | 2.65 |
| S2V2 | 4.12 | 4.13 | 0.24 | 2681 | 2888 | 7.73 | 9731 | 10988 | 12.92 |
| S2V3 | 4.22 | 4.19 | −0.71 | 2753 | 2908 | 5.65 | 10058 | 11250 | 11.85 |
| S3V1 | 4.01 | 3.49 | −12.97 | 2588 | 2698 | 4.26 | 9352 | 9899 | 5.85 |
| S3V2 | 3.41 | 3.19 | −6.45 | 2329 | 2547 | 9.34 | 7738 | 8961 | 15.81 |
| S3V3 | 3.59 | 3.21 | −10.58 | 2404 | 2645 | 10.02 | 8299 | 9123 | 9.93 |
| Average | 4.00 | 3.74 | −6.58 | 25969 | 2773.7 | 6.83 | 9401 | 10292 | 9.47 |
| D-Index | 0.86 | 0.77 | 0.83 | ||||||
| MPD | 6.73 | 6.95 | 9.84 | ||||||
| RMSE | 0.33 | 183.53 | 963.11 | ||||||
| Cultivars | Obs. SCY (kg ha−1) | Sim. SCY (kg ha−1) | RMSE (kg ha−1) | MPD (%) |
|---|---|---|---|---|
| BS-15 | 3347.01 | 3257.43 | 20.03 | −2.68 |
| IUB-13 | 2789.70 | 2886.82 | 21.72 | 3.48 |
| Mubarak | 1382.59 | 1454.59 | 72.00 | 5.21 |
| GH-Uhad | 2584.22 | 2479.72 | 23.37 | −4.04 |
| Debal | 2180.25 | 2274.55 | 21.09 | 4.33 |
| Cyto-179 | 3251.20 | 3258.54 | 1.64 | 0.23 |
| NIAB-Kiran | 2652.30 | 2549.20 | 23.05 | −3.89 |
| CIM-313 | 2289.26 | 2109.67 | 40.16 | −7.84 |
| Average | 2559.57 | 2565.07 | 27.88 | −0.65 |
| Cultivars | Obs. SCY (kg ha−1) | Sim. SCY (kg ha−1) | RMSE (kg ha−1) | MPD (%) |
|---|---|---|---|---|
| BS-15 | 2996.48 | 2854.55 | 31.74 | −4.74 |
| IUB-13 | 2210.46 | 2532.78 | 72.07 | 14.58 |
| Mubarak | 1189.19 | 1504.59 | 70.53 | 26.52 |
| GH-Uhad | 2834.28 | 2741.59 | 20.73 | −3.27 |
| Debal | 2625.00 | 2698.55 | 16.45 | 2.80 |
| Cyto-179 | 3209.94 | 3108.54 | 22.67 | −3.16 |
| NIAB-Kiran | 2042.40 | 2307.41 | 59.26 | 12.98 |
| CIM-313 | 2993.76 | 2801.47 | 43.00 | −6.42 |
| Average | 2512.69 | 2568.69 | 42.06 | 4.91 |
| District | 2018 | 2019 | Average Yield (kg ha−1) | ||||
|---|---|---|---|---|---|---|---|
| Area | Production | Yield (kg ha−1) | Area | Production | Yield | ||
| (000 ha) | Bales * | (000 ha) | Bales | (kg ha−1) | |||
| Bahawalpur | 268.5 | 1125.0 | 2018 | 265.5 | 992.0 | 1794 | 1906 |
| Khanewal | 179.7 | 769.4 | 2056 | 167.1 | 682.9 | 1788 | 1922 |
| District | Variety | Sowing Time | Nitrogen | Phosphorus | No of Sprays | No. of Irrigations |
|---|---|---|---|---|---|---|
| kg acre−1 | kg acre−1 | |||||
| Bahawalpur | IUB-13 | 15 May | 67 | 20.4 | 5 | 16 |
| Khanewal | IUB-13 | 15 May | 56 | 22.5 | 7 | 15 |
| District | Average Cotton Yield (kg ha−1) | Yield Difference | |||
|---|---|---|---|---|---|
| Baseline (1989–2019) | 2018 & 2019 | GFDL-CM3 (2040–2069) | (kg ha−1) | % | |
| Bahawalpur | 2356 | 1906 | 1653 | −703 | −29.84 |
| Khanewal | 2505 | 1922 | 1965 | −540 | −21.56 |
| Average | 2356 | 1906 | 1653 | −621.5 | −25.7 |
| District | Average Cotton Yield (kg ha−1) | Yield Difference | |||
|---|---|---|---|---|---|
| Baseline (1989–2019) | 2018 & 2019 | GFDL-CM3 (2040–2069) | (kg ha−1) | % | |
| Bahawalpur | 1906 | 2356 | 1565 | −791 | −33.57 |
| Khanewal | 1922 | 2505 | 1735 | −770 | −30.74 |
| Average | 1914 | 2431 | 1650 | −781 | −32.16 |
| Variables | Direction of Change | Percentage Change |
|---|---|---|
| Nitrogen (kg ha−1) | Increase | 10 |
| Planting density (Plant m−2) | Increase | 5 |
| Irrigation Management | Decrease | 10 |
| Sowing Dates | Early | 15 days |
| Fertilizer application method | Fertigation | |
| Variety selection | Heat and drought tolerant | |
| District | Baseline | GFDL-CM3 | With Adaptation | Recovery over Baseline | Recovery over Future Climate | ||
|---|---|---|---|---|---|---|---|
| 1989–2019 | 2040–2069 | 2040–2069 | (kg ha−1) | % | (kg ha−1) | % | |
| Bahawalpur | 2356 | 1653 | 2592 | 235.6 | 10.0 | 938.6 | 36.2 |
| Khanewal | 2505 | 1965 | 2806 | 300.6 | 12.0 | 840.6 | 29.9 |
| Average | 2431 | 1809 | 2699 | 268.1 | 11.0 | 889.6 | 33.1 |
| District | Baseline | GFDL-CM3 | With Adaptation | Recovery over Baseline | Recovery over Future Climate | ||
|---|---|---|---|---|---|---|---|
| 1989–2019 | 2040–2069 | 2040–2069 | (kg ha−1) | % | (kg ha−1) | % | |
| Bahawalpur | 2356 | 1565 | 2545 | 188.0 | 8.0 | 979.5 | 38.5 |
| Khanewal | 2505 | 1735 | 2680 | 175.0 | 7.0 | 945.4 | 35.3 |
| Average | 2431 | 1650 | 2613 | 181.5 | 7.5 | 962.5 | 36.9 |
Publisher’s Note: MDPI stays neutral with regard to jurisdictional claims in published maps and institutional affiliations. |
© 2021 by the authors. Licensee MDPI, Basel, Switzerland. This article is an open access article distributed under the terms and conditions of the Creative Commons Attribution (CC BY) license (https://creativecommons.org/licenses/by/4.0/).
Share and Cite
Arshad Awan, Z.; Khaliq, T.; Masood Akhtar, M.; Imran, A.; Irfan, M.; Jarrar Ahmed, M.; Ahmad, A. Building Climate-Resilient Cotton Production System for Changing Climate Scenarios Using the DSSAT Model. Sustainability 2021, 13, 10495. https://doi.org/10.3390/su131910495
Arshad Awan Z, Khaliq T, Masood Akhtar M, Imran A, Irfan M, Jarrar Ahmed M, Ahmad A. Building Climate-Resilient Cotton Production System for Changing Climate Scenarios Using the DSSAT Model. Sustainability. 2021; 13(19):10495. https://doi.org/10.3390/su131910495
Chicago/Turabian StyleArshad Awan, Zoia, Tasneem Khaliq, Muhammad Masood Akhtar, Asad Imran, Muhammad Irfan, Muhammad Jarrar Ahmed, and Ashfaq Ahmad. 2021. "Building Climate-Resilient Cotton Production System for Changing Climate Scenarios Using the DSSAT Model" Sustainability 13, no. 19: 10495. https://doi.org/10.3390/su131910495
APA StyleArshad Awan, Z., Khaliq, T., Masood Akhtar, M., Imran, A., Irfan, M., Jarrar Ahmed, M., & Ahmad, A. (2021). Building Climate-Resilient Cotton Production System for Changing Climate Scenarios Using the DSSAT Model. Sustainability, 13(19), 10495. https://doi.org/10.3390/su131910495


