
Effects of Fog in a Brazilian Road Segment Analyzed by a Driving Simulator for Sustainable Transport: Drivers’ Speed Profile under In-Vehicle Warning Systems


Abstract
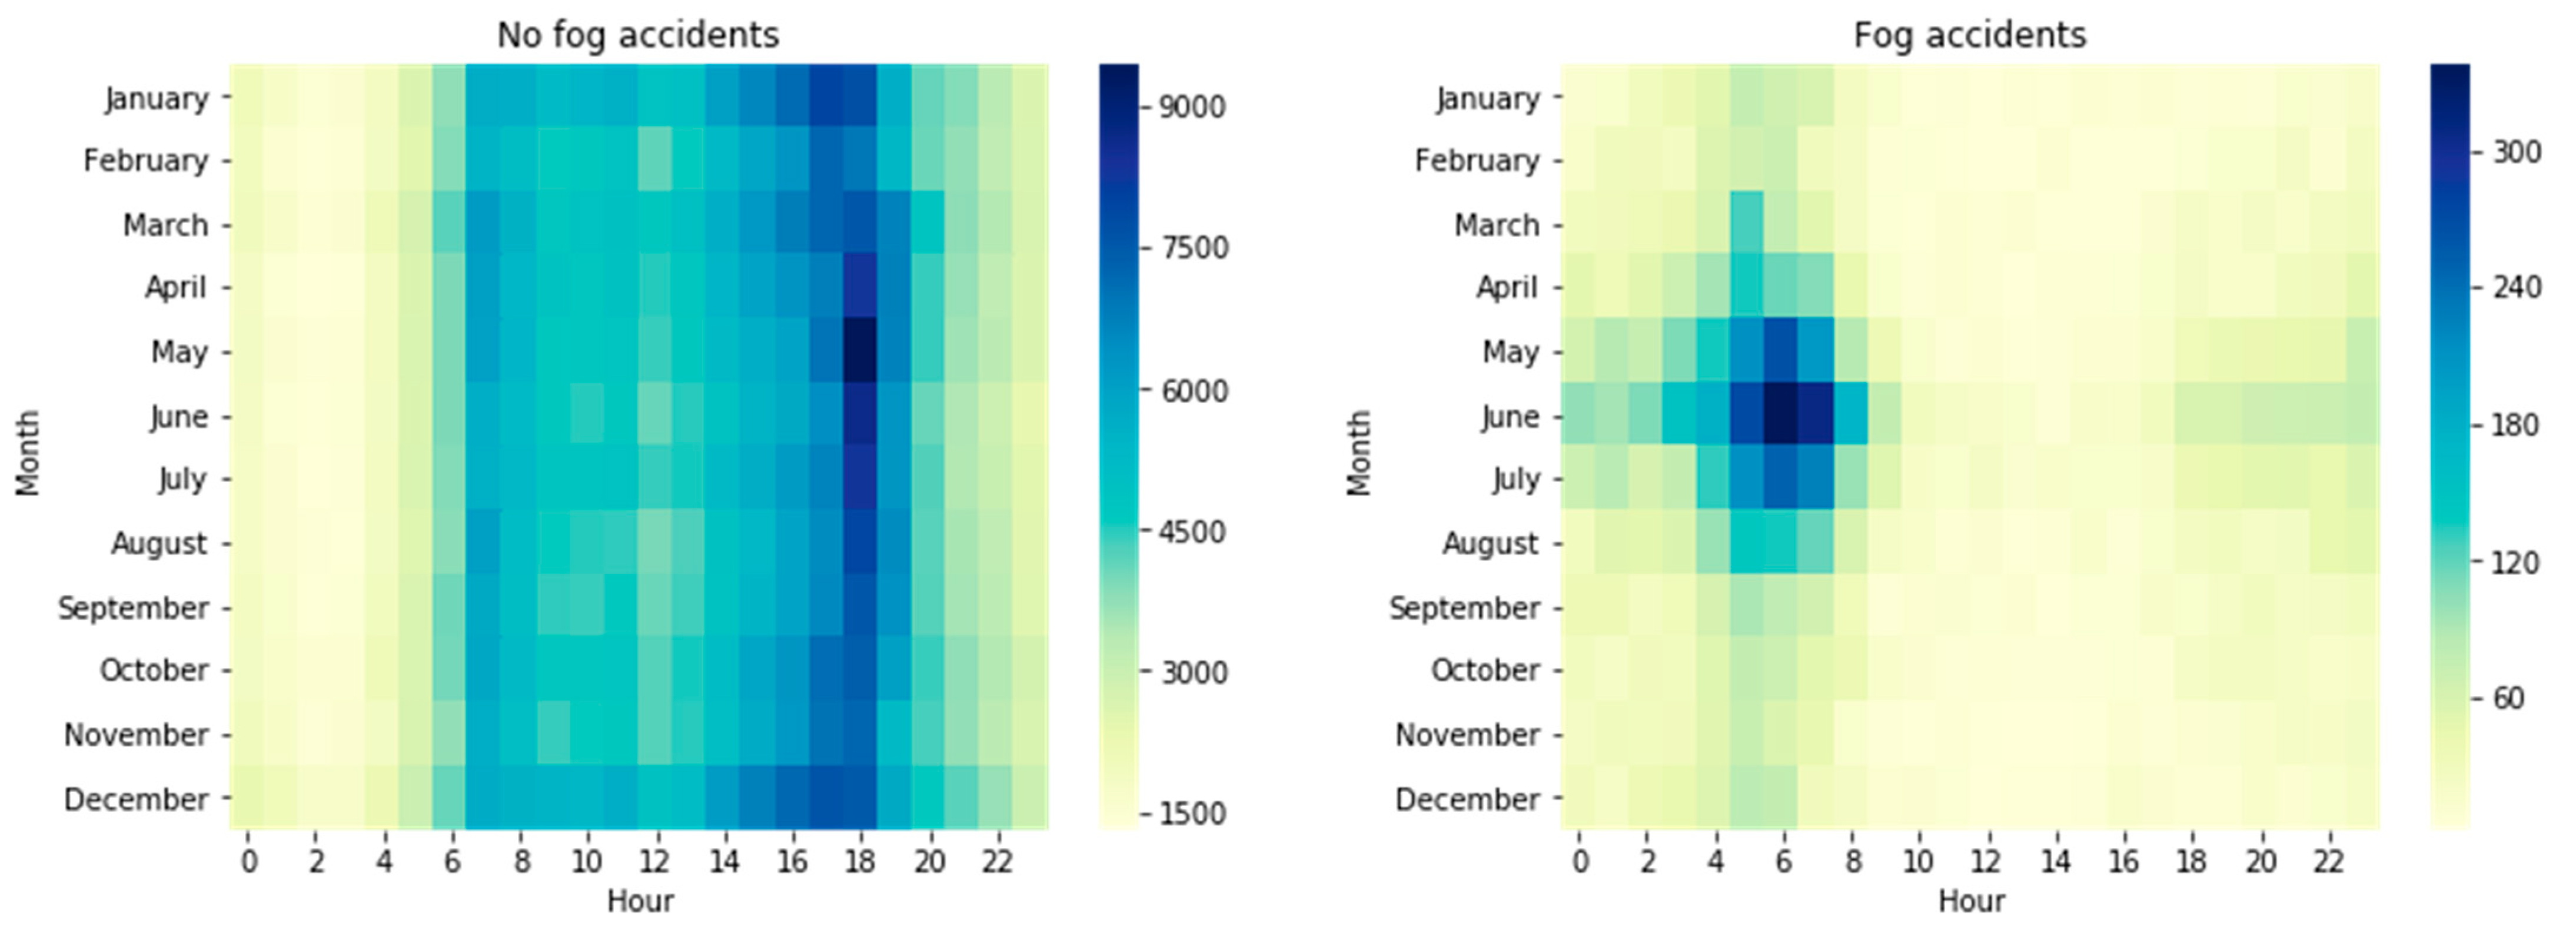
:1. Introduction
2. Methods
2.1. Apparatus
2.2. Simulated Location
2.3. Analyses of Curve
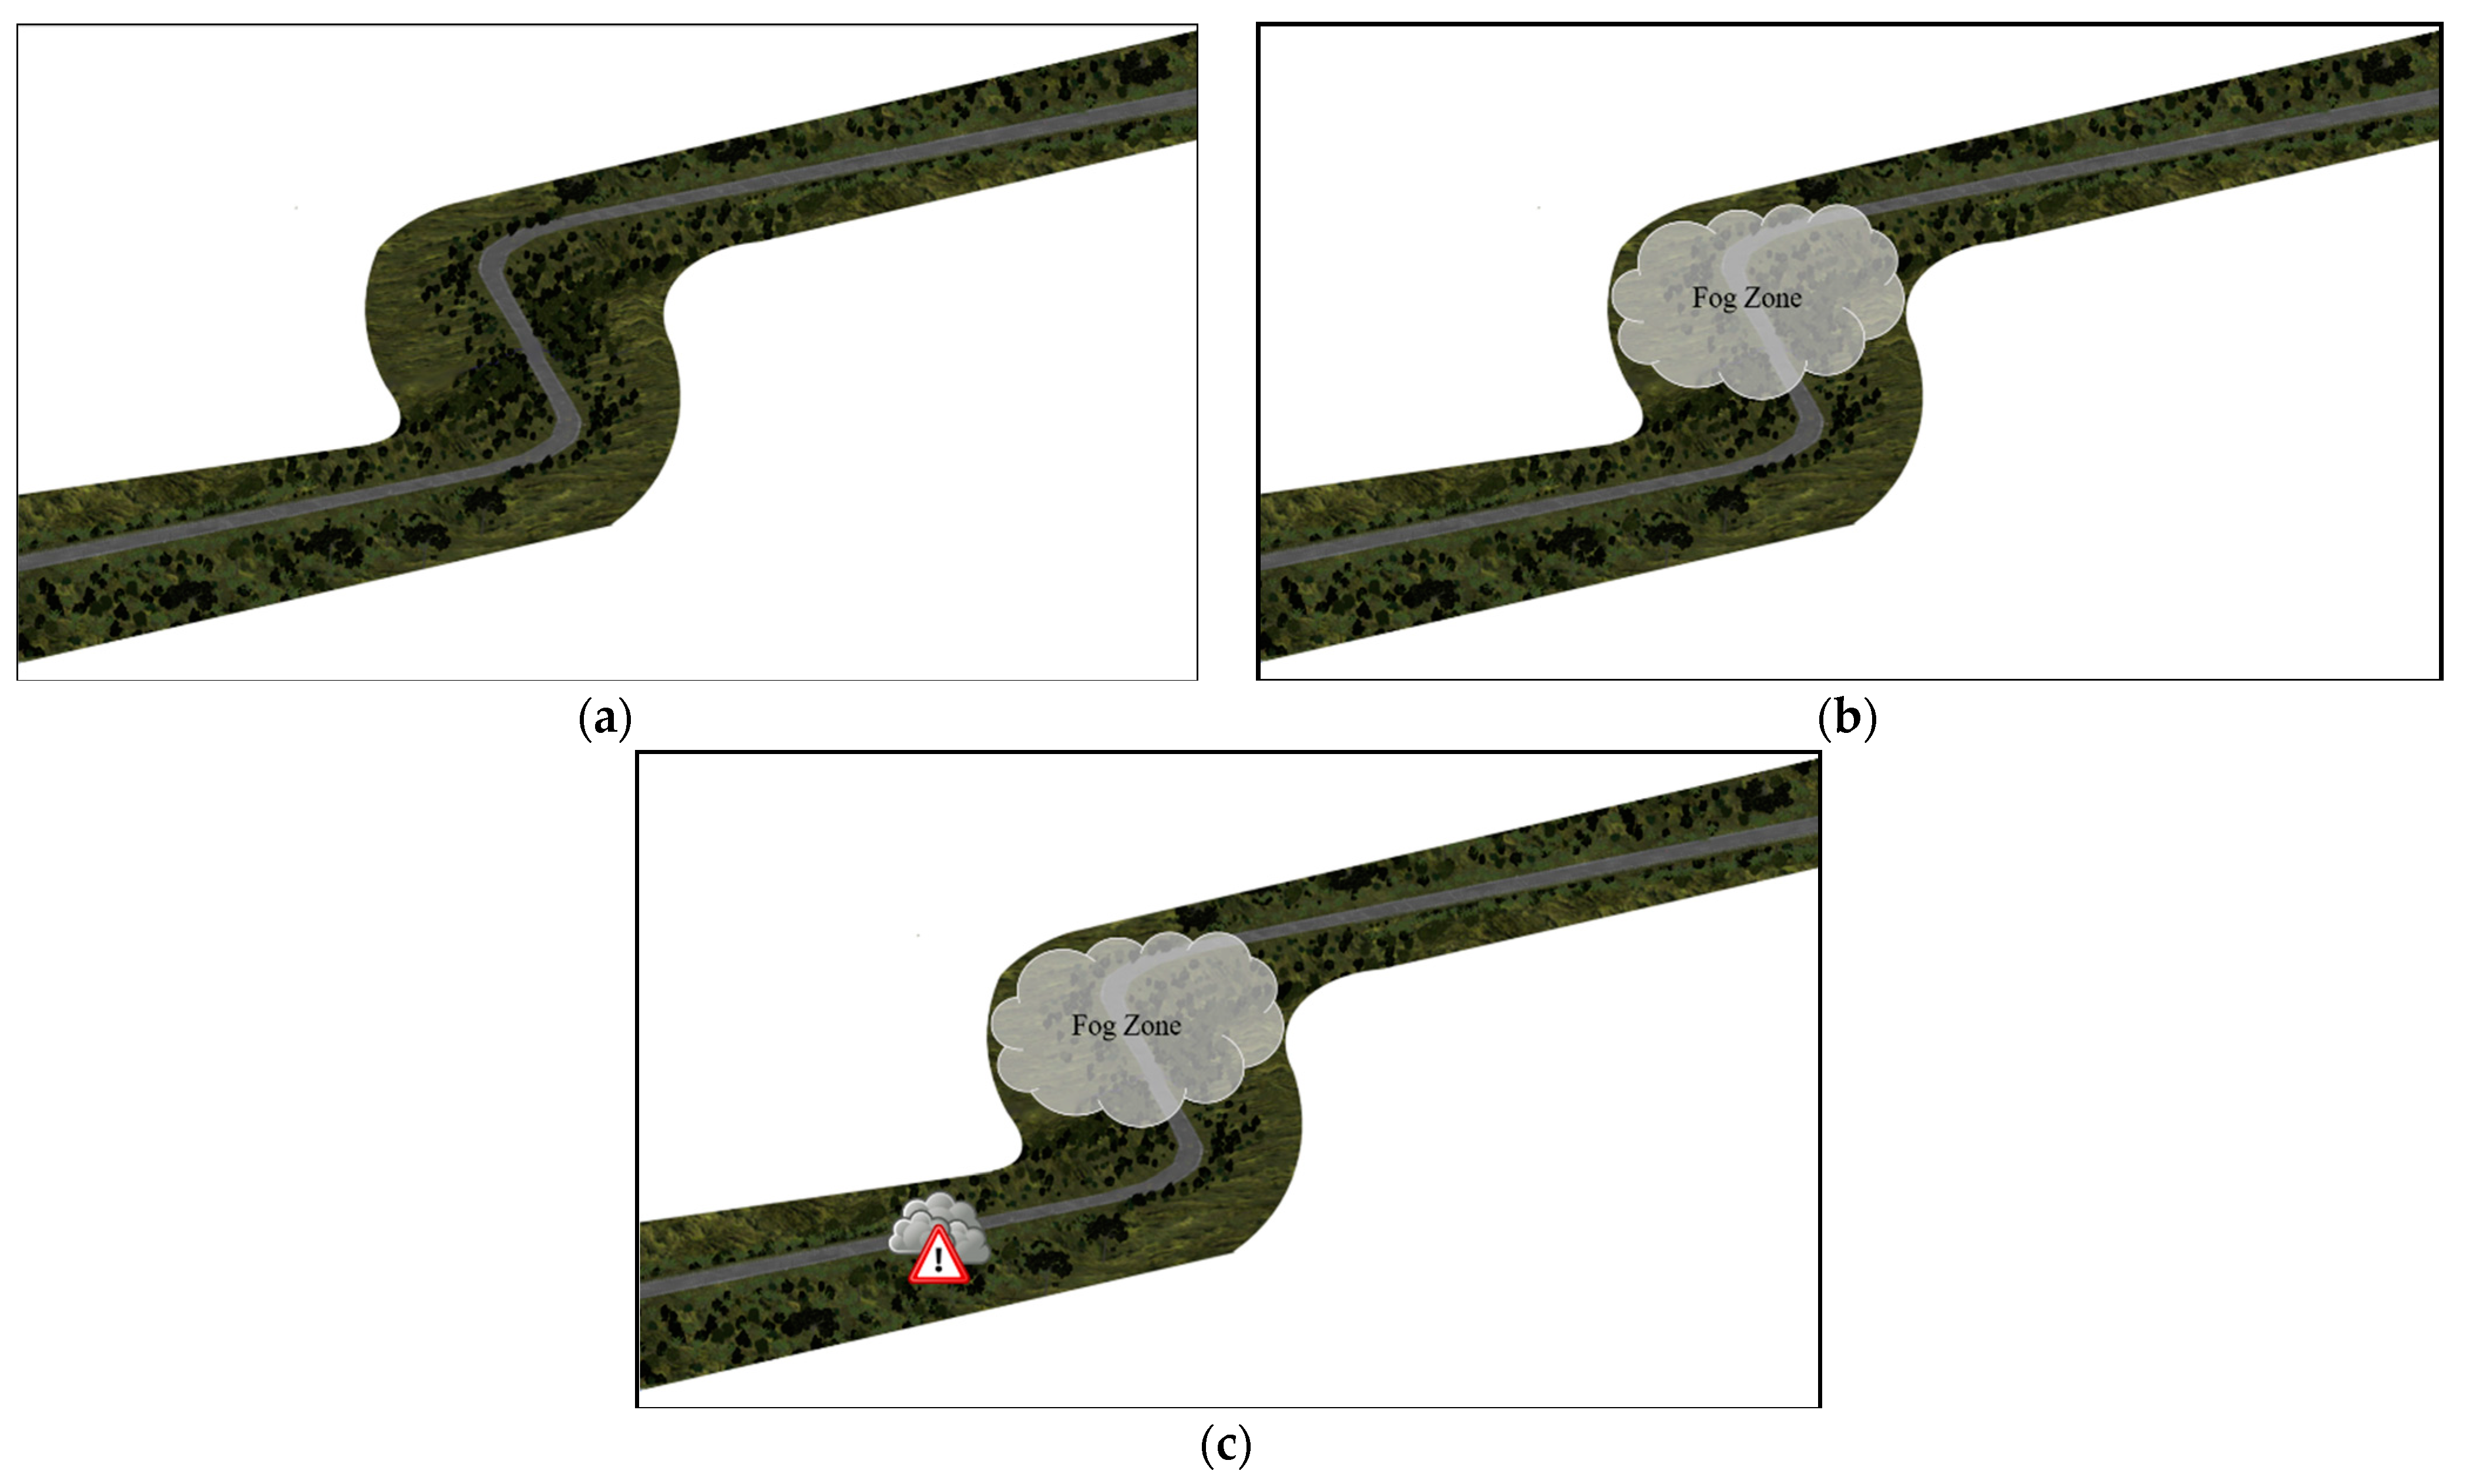
2.4. Scenarios
2.5. Experimental Design and Procedure
2.6. Data Analysis
3. Results and Discussion
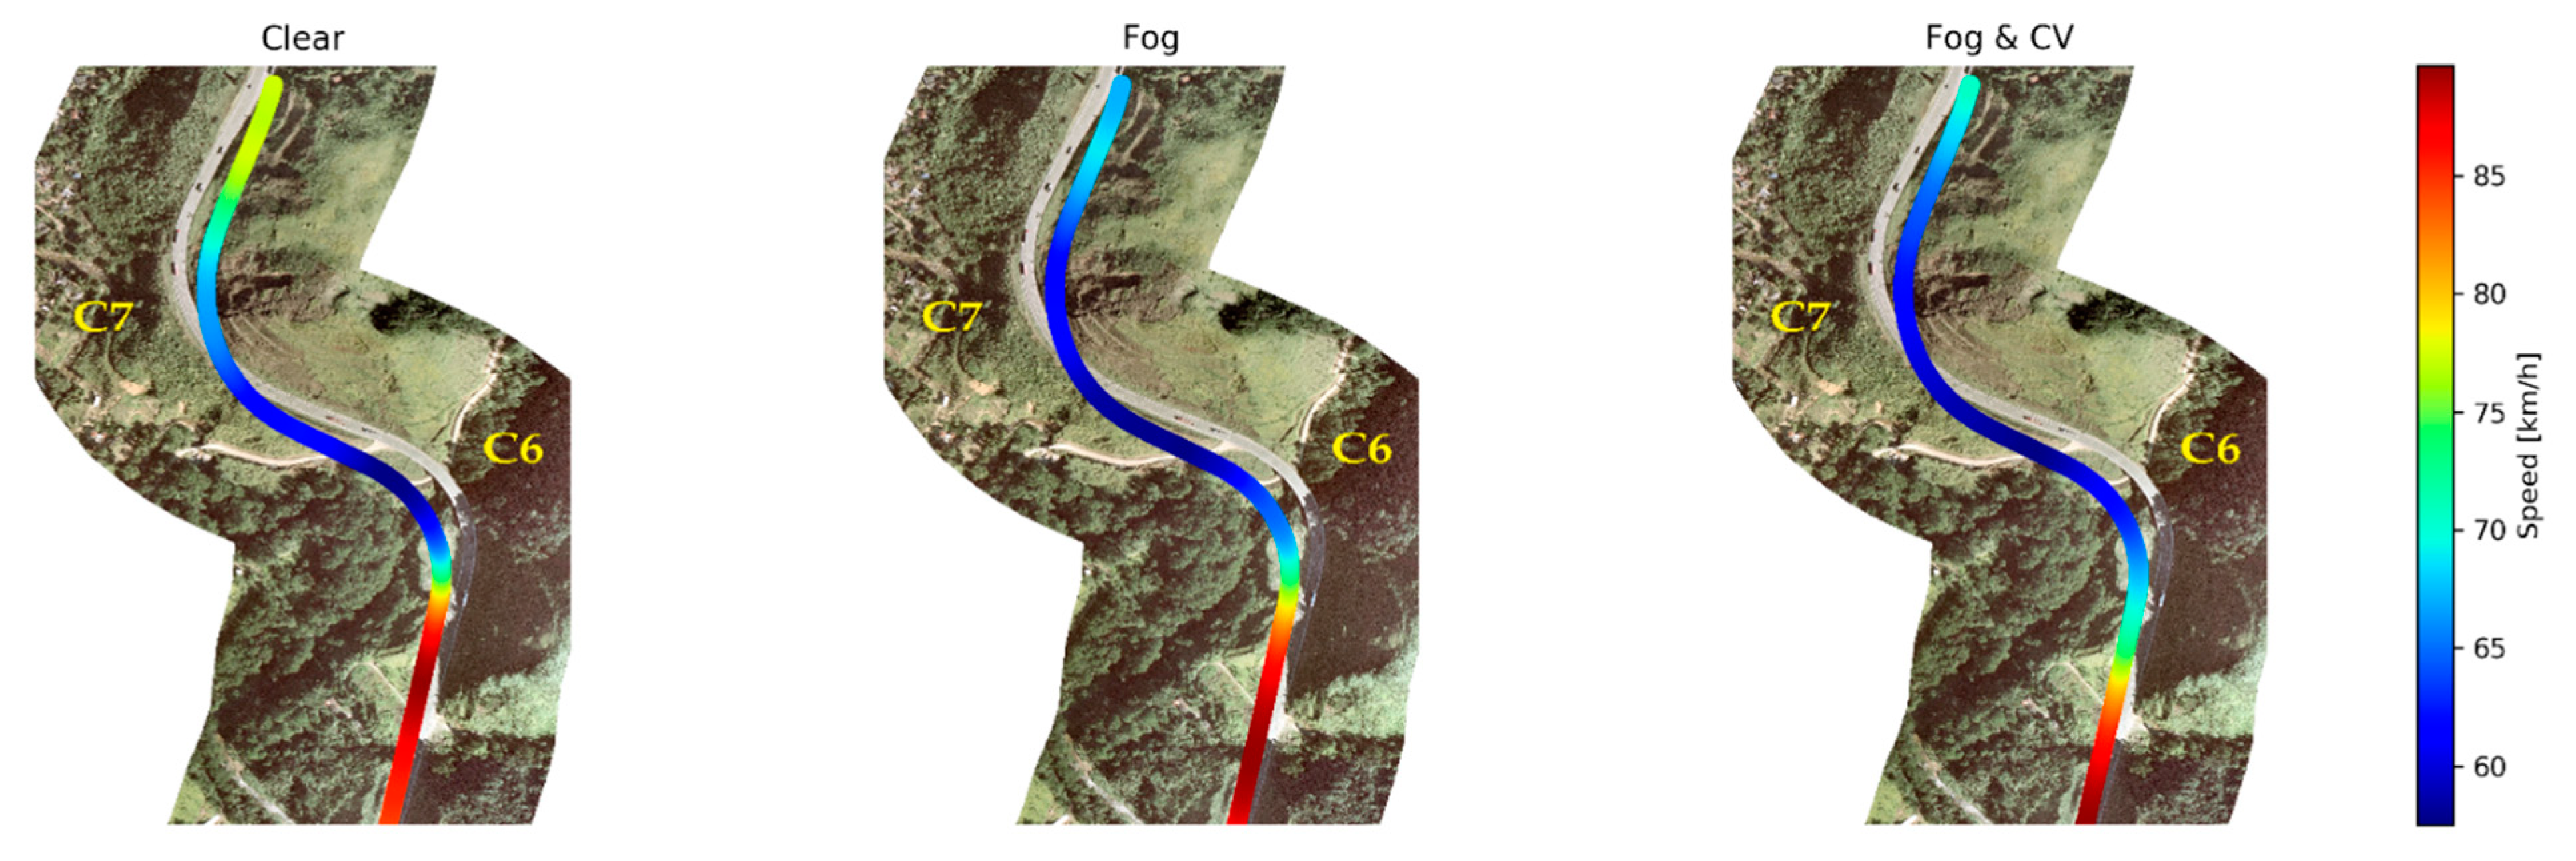
3.1. General Results
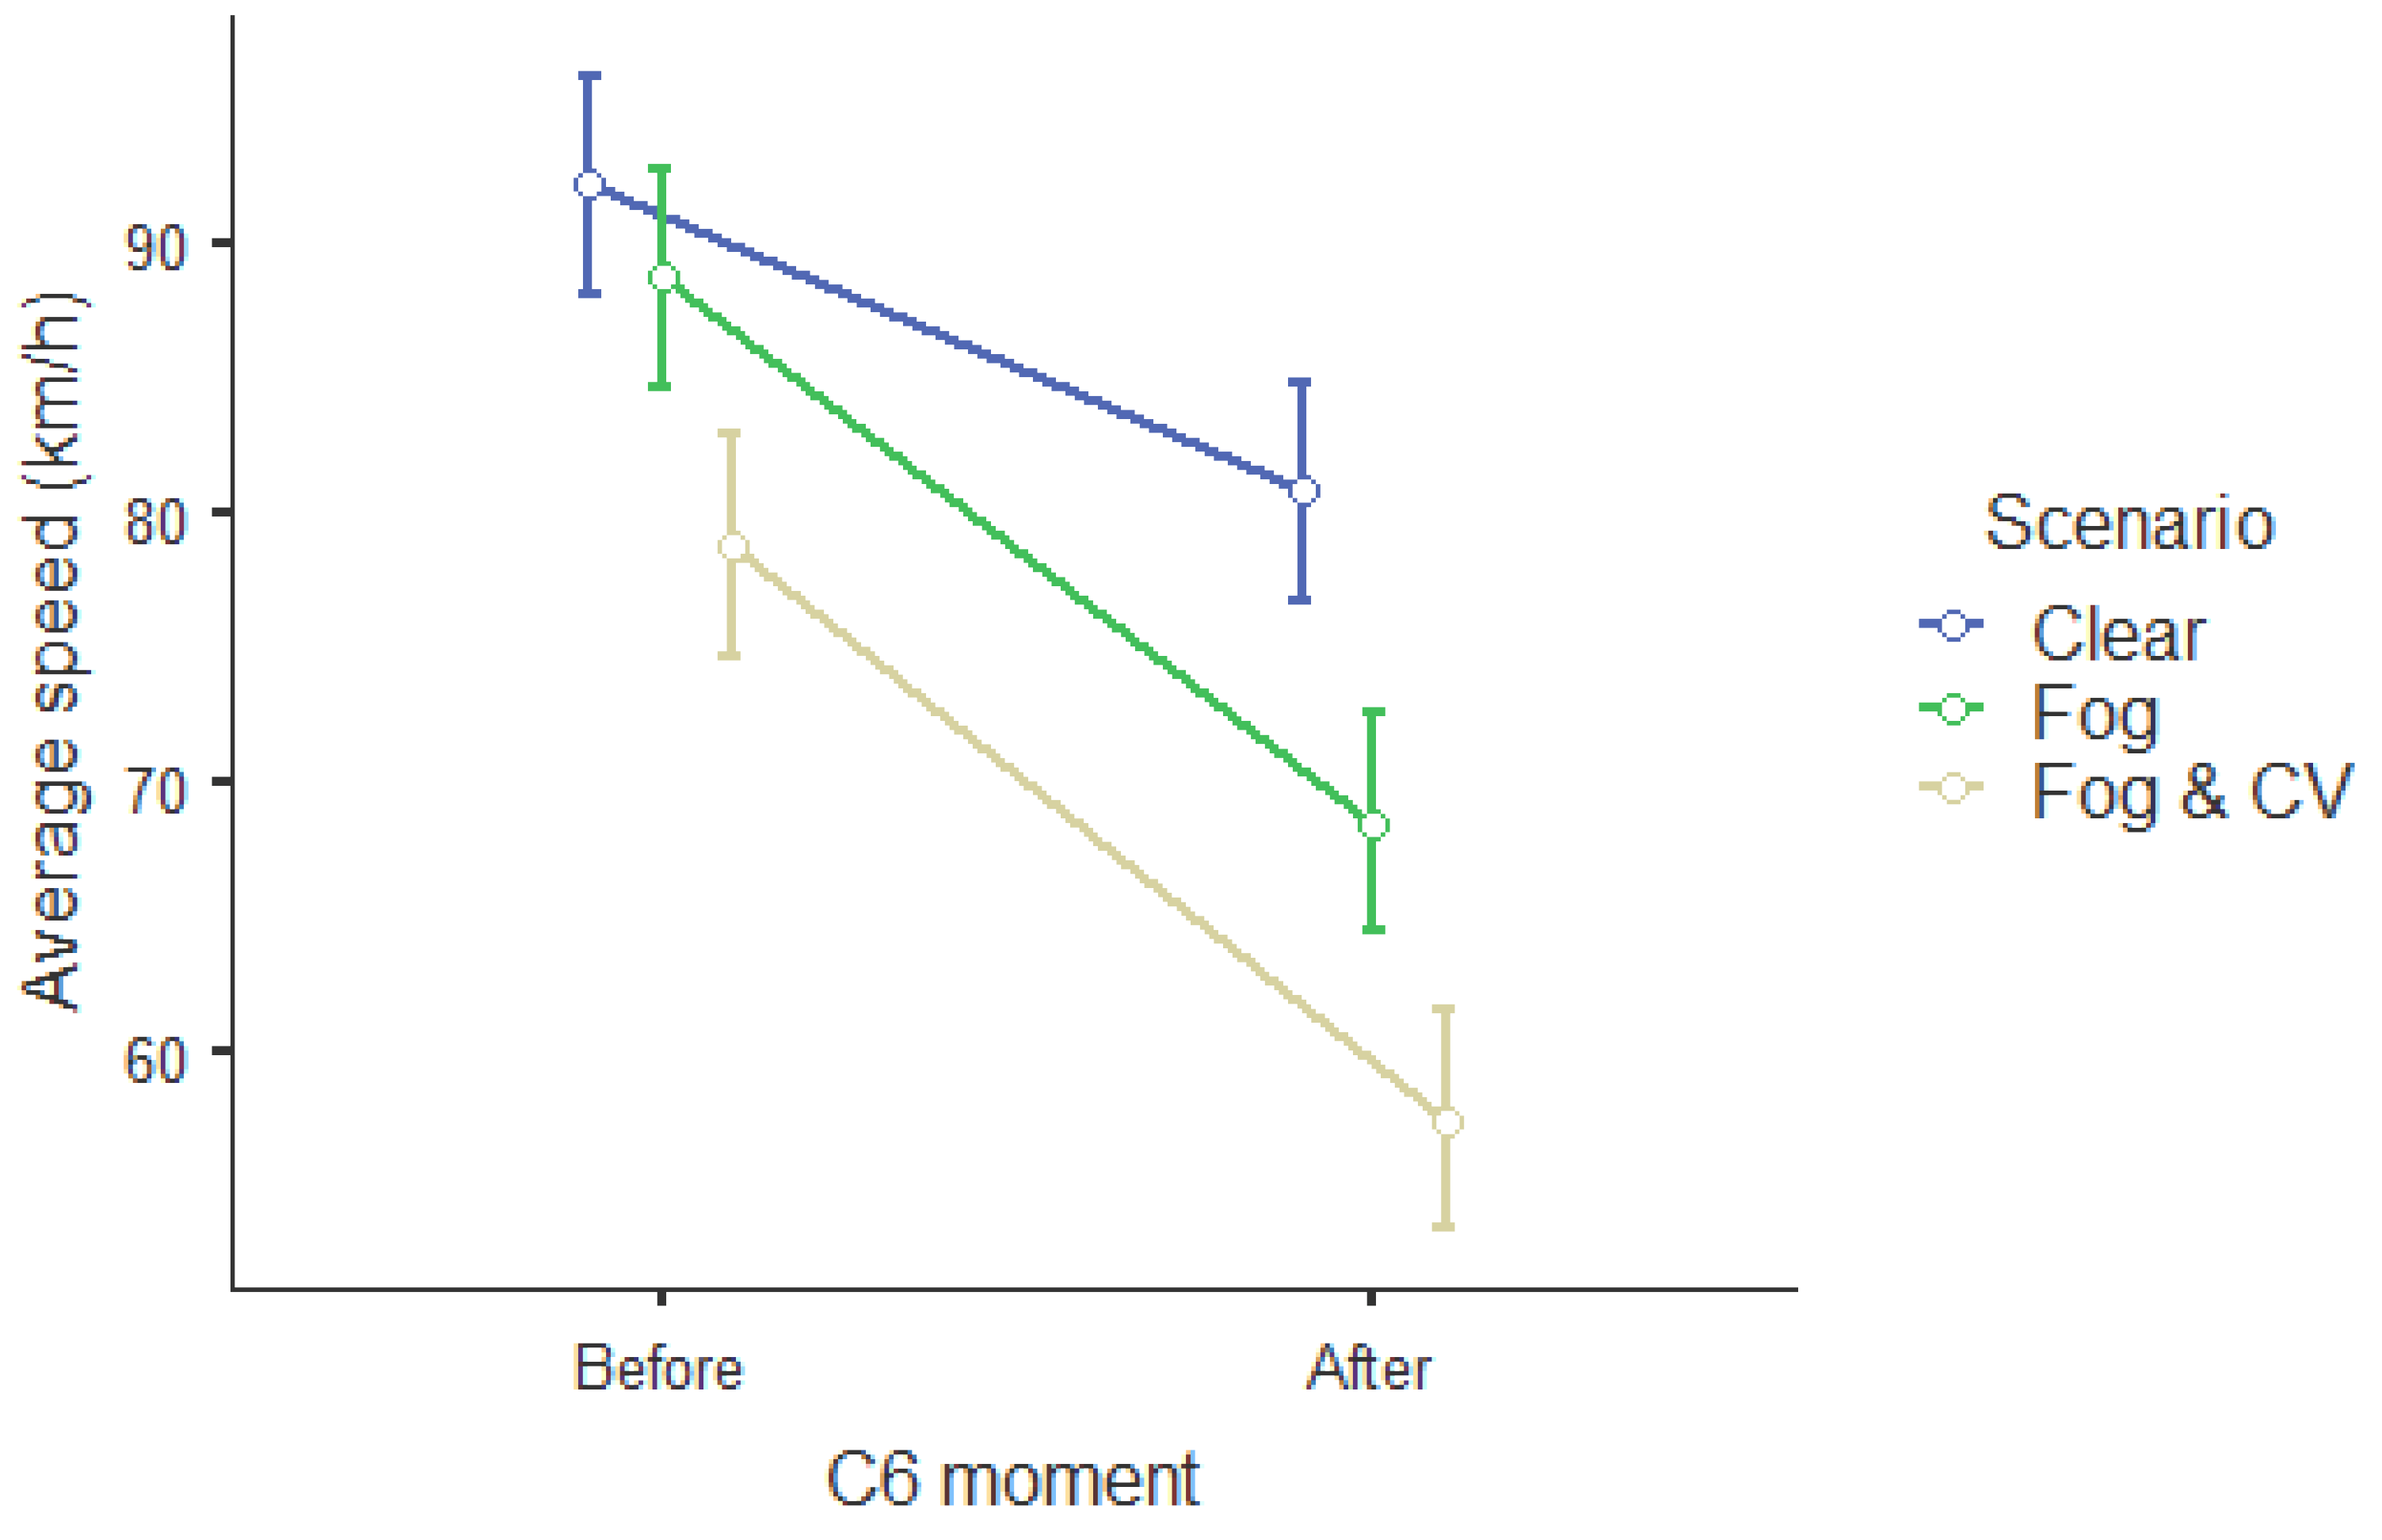
3.2. Summary Statistics
3.3. Two-Way Repeated Measures ANOVA
4. Conclusions and Future Research
Author Contributions
Funding
Institutional Review Board Statement
Informed Consent Statement
Data Availability Statement
Acknowledgments
Conflicts of Interest
References
- Hassan, H.M.; Abdel-Aty, M. Analysis of drivers’ behavior under reduced visibility conditions using a Structural Equation Modeling approach. Transp. Res. Part F Traffic Psychol. Behav. 2011, 14, 614–625. [Google Scholar] [CrossRef]
- Rosey, F.; Aillerie, I.; Espié, S.; Vienne, F. Driver behaviour in fog is not only a question of degraded visibility—A simulator study. Saf. Sci. 2017, 95, 50–61. [Google Scholar] [CrossRef]
- DPRF Dados Abertos das Rodovias Federais. Available online: https://www.prf.gov.br/portal/dados-abertos (accessed on 13 June 2021).
- Park, J.; Abdel-Aty, M.; Wu, Y.; Mattei, I. Enhancing In-Vehicle Driving Assistance Information Under Connected Vehicle Environment. IEEE Trans. Intell. Transp. Syst. 2019, 20, 3558–3567. [Google Scholar] [CrossRef]
- Wu, Y.; Abdel-Aty, M.; Cai, Q.; Lee, J.; Park, J. Developing an algorithm to assess the rear-end collision risk under fog conditions using real-time data. Transp. Res. Part C Emerg. Technol. 2018, 87, 11–25. [Google Scholar] [CrossRef]
- Mueller, A.S.; Trick, L.M. Driving in fog: The effects of driving experience and visibility on speed compensation and hazard avoidance. Accid. Anal. Prev. 2012, 48, 472–479. [Google Scholar] [CrossRef]
- Broughton, K.L.M.; Switzer, F.; Scott, D. Car following decisions under three visibility conditions and two speeds tested with a driving simulator. Accid. Anal. Prev. 2007, 39, 106–116. [Google Scholar] [CrossRef]
- Ni, R.; Kang, J.J.; Andersen, G.J. Age-related declines in car following performance under simulated fog conditions. Accid. Anal. Prev. 2010, 42, 818–826. [Google Scholar] [CrossRef] [PubMed] [Green Version]
- Yan, X.; Xue, Q.; Ma, L.; Xu, Y. Driving-simulator-based test on the effectiveness of auditory red-light running vehicle warning system based on time-to-collision sensor. Sensors 2014, 14, 3631–3651. [Google Scholar] [CrossRef] [PubMed]
- Wu, Y.; Abdel-Aty, M.; Park, J.; Selby, R.M. Effects of real-time warning systems on driving under fog conditions using an empirically supported speed choice modeling framework. Transp. Res. Part C Emerg. Technol. 2018, 86, 97–110. [Google Scholar] [CrossRef]
- Liu, J.; Khattak, A.J. Delivering improved alerts, warnings, and control assistance using basic safety messages transmitted between connected vehicles. Transp. Res. Part C Emerg. Technol. 2016, 68, 83–100. [Google Scholar] [CrossRef] [Green Version]
- Boyle, L.N.; Mannering, F. Impact of traveler advisory systems on driving speed: Some new evidence. Transp. Res. Part C Emerg. Technol. 2004, 12, 57–72. [Google Scholar] [CrossRef]
- Al-Ghamdi, A.S. Experimental evaluation of fog warning system. Accid. Anal. Prev. 2007, 39, 1065–1072. [Google Scholar] [CrossRef]
- Zhao, X.; Xu, W.; Ma, J.; Li, H.; Chen, Y.; Rong, J. Effects of connected vehicle-based variable speed limit under different foggy conditions based on simulated driving. Accid. Anal. Prev. 2019, 128, 206–216. [Google Scholar] [CrossRef]
- Chang, X.; Li, H.; Qin, L.; Rong, J.; Lu, Y.; Chen, X. Evaluation of cooperative systems on driver behavior in heavy fog condition based on a driving simulator. Accid. Anal. Prev. 2019, 128, 197–205. [Google Scholar] [CrossRef]
- Wu, Y.; Abdel-Aty, M.; Park, J.; Zhu, J. Effects of crash warning systems on rear-end crash avoidance behavior under fog conditions. Transp. Res. Part C Emerg. Technol. 2018, 95, 481–492. [Google Scholar] [CrossRef]
- Li, X.; Yan, X.; Wong, S.C. Effects of fog, driver experience and gender on driving behavior on S-curved road segments. Accid. Anal. Prev. 2015, 77, 91–104. [Google Scholar] [CrossRef] [PubMed] [Green Version]
- Milosević, S.; Milić, J. Speed perception in road curves. J. Safety Res. 1990, 21, 19–23. [Google Scholar] [CrossRef]
- Lucas, F.R.; Russo, L.E.A.; Kawashima, R.S.; Figueira, A.C.; Larocca, A.P.C.; Kabbach, F.I., Jr. Use of driving simulators Applied to road safety project. Bol. Ciencias Geod. 2013, 19, 341–352. [Google Scholar] [CrossRef] [Green Version]
- Santos, M.I.d.; Oliveira, P.T.M.e.S.d.; Ribeiro, R.L.; Larocca, A.P.C.; Kabbach Junior, F.I. Conceito, configuração e aplicação de um simulador de direção no Brasil—Estudo de caso. Transportes 2017, 25. [Google Scholar] [CrossRef]
- Vieira, F.S.; Larocca, A.P.C. Drivers’ speed profile at curves under distraction task. Transp. Res. Part F Traffic Psychol. Behav. 2017, 44, 12–19. [Google Scholar] [CrossRef]
- Larocca, A.P.C.; Ribeiro, R.L.; da Cruz Figueira, A.; Lulio, L.C.; Rangel, M.A.C. Analysis of perception of vertical signaling of highways by drivers in a simulated driving environment. Transp. Res. Part F Traffic Psychol. Behav. 2018, 58, 471–487. [Google Scholar] [CrossRef]
- Figueira, A.C.; Larocca, A.P.C. Analysis of the factors influencing overtaking in two-lane highways: A driving simulator study. Transp. Res. Part F Traffic Psychol. Behav. 2020, 69, 38–48. [Google Scholar] [CrossRef]
- Figueira, A.C.; Larocca, A.P.C. Proposal of a driver profile classification in relation to risk level in overtaking maneuvers. Transp. Res. Part F Traffic Psychol. Behav. 2020, 74, 375–385. [Google Scholar] [CrossRef]
- de Campos, C.I.; Marcomini, L.A.; Panice, N.R.; Piva, F.J.; Larocca, A.P.C. Perception analysis of highway quality of service using a driving simulator and eye tracking system. Transportes 2020, 28, 165–179. [Google Scholar] [CrossRef]
- Calsavara, F.; Kabbach Junior, F.I.; Larocca, A.P.C. Effects of Fog in a Brazilian Road Segment Analyzed by a Driving Simulator for Sustainable Transport: Drivers’ Visual Profile. Sustainability 2021, 13, 9448. [Google Scholar] [CrossRef]
- Abdel-Aty, M.; Ekram, A.A.; Huang, H.; Choi, K. A study on crashes related to visibility obstruction due to fog and smoke. Accid. Anal. Prev. 2011, 43, 1730–1737. [Google Scholar] [CrossRef] [PubMed]
- Denatran—Departamento Nacional de Trânsito Manual de Identificação, Análise e Tratamento dos Pontos Negros. Dep. Nac. Trânsito 1987, 2, 127.
- DNIT—Departamento Nacional de Infraestrutura de Transportes PNCT—Plano Nacional de Contagem de Tráfego. Available online: http://servicos.dnit.gov.br/dadospnct/ContagemContinua (accessed on 15 January 2021).


| Scenario | Speed (km/h) | |||
|---|---|---|---|---|
| Before C6 | After C6 | |||
| Mean | SD * | Mean | SD * | |
| Clear | 92.1 | 6.3 | 77.8 | 10.4 |
| Fog | 88.7 | 10.1 | 68.6 | 8.8 |
| Fog & CV | 78.8 | 16.1 | 57.5 | 10.9 |
| Source | Sum of Squares | df | Mean Square | F | p | |
|---|---|---|---|---|---|---|
| C6 moment | * | 12,984 | 1 | 12,984 | 217.63 | <0.001 |
| C6 moment × Scenario | 830 | 2 | 415 | 6.96 | 0.002 | |
| Residual | 4833 | 81 | 59.7 | - | - | |
| Source | Sum of Squares | df | Mean Square | F | p |
|---|---|---|---|---|---|
| Scenario | 9452 | 2 | 4726 | 27.1 | <0 .001 |
| Residual | 14,146 | 81 | 175 | - | - |
| Comparison | M * | SE | df | t | ptukey | |||
|---|---|---|---|---|---|---|---|---|
| C6 Moment | Scenario | C6 Moment | Scenario | |||||
| Before | Clear | Before | Fog | 3.41 | 2.89 | 130.6 | 1.178 | 0.847 |
| - | - | Before | Fog & CV | 13.35 | 2.89 | 130.6 | 4.614 | < 0.001 |
| - | - | After | Clear | 11.33 | 2.06 | 81.0 | 5.487 | <0 .001 |
| - | - | After | Fog | 23.57 | 2.89 | 130.6 | 8.149 | < 0.001 |
| - | - | After | Fog & CV | 34.60 | 2.89 | 130.6 | 11.960 | <0.001 |
| - | Fog | Before | Fog & CV | 9.94 | 2.89 | 130.6 | 3.436 | 0.010 |
| - | - | After | Clear | 7.92 | 2.89 | 130.6 | 2.738 | 0.075 |
| - | - | After | Fog | 20.17 | 2.06 | 81.0 | 9.769 | <0.001 |
| - | - | After | Fog & CV | 31.19 | 2.89 | 130.6 | 10.783 | <0.001 |
| - | Fog & CV | After | Clear | −2.02 | 2.89 | 130.6 | −0.698 | 0.982 |
| - | - | After | Fog | 10.23 | 2.89 | 130.6 | 3.536 | 0.007 |
| - | - | After | Fog & CV | 21.25 | 2.06 | 81.0 | 10.295 | <0.001 |
| After | Clear | After | Fog | 12.25 | 2.89 | 130.6 | 4.234 | <0.001 |
| - | - | After | Fog & CV | 23.27 | 2.89 | 130.6 | 8.045 | <0.001 |
| - | Fog | After | Fog & CV | 11.02 | 2.89 | 130.6 | 3.811 | 0.003 |
Publisher’s Note: MDPI stays neutral with regard to jurisdictional claims in published maps and institutional affiliations. |
© 2021 by the authors. Licensee MDPI, Basel, Switzerland. This article is an open access article distributed under the terms and conditions of the Creative Commons Attribution (CC BY) license (https://creativecommons.org/licenses/by/4.0/).
Share and Cite
Calsavara, F.; Kabbach, F.I., Jr.; Larocca, A.P.C. Effects of Fog in a Brazilian Road Segment Analyzed by a Driving Simulator for Sustainable Transport: Drivers’ Speed Profile under In-Vehicle Warning Systems. Sustainability 2021, 13, 10501. https://doi.org/10.3390/su131910501
Calsavara F, Kabbach FI Jr., Larocca APC. Effects of Fog in a Brazilian Road Segment Analyzed by a Driving Simulator for Sustainable Transport: Drivers’ Speed Profile under In-Vehicle Warning Systems. Sustainability. 2021; 13(19):10501. https://doi.org/10.3390/su131910501
Chicago/Turabian StyleCalsavara, Felipe, Felipe Issa Kabbach, Jr., and Ana Paula C. Larocca. 2021. "Effects of Fog in a Brazilian Road Segment Analyzed by a Driving Simulator for Sustainable Transport: Drivers’ Speed Profile under In-Vehicle Warning Systems" Sustainability 13, no. 19: 10501. https://doi.org/10.3390/su131910501
APA StyleCalsavara, F., Kabbach, F. I., Jr., & Larocca, A. P. C. (2021). Effects of Fog in a Brazilian Road Segment Analyzed by a Driving Simulator for Sustainable Transport: Drivers’ Speed Profile under In-Vehicle Warning Systems. Sustainability, 13(19), 10501. https://doi.org/10.3390/su131910501