1. Introduction
Intelligent Transport Systems (ITS), based on connected vehicles communication, help drivers take actions from externally acquired information by, for example warning them of a potentially dangerous situation to be avoided by automatic braking or automatic steering. The development of information technology promotes traffic efficiency and safety through real-time information interaction between vehicles (V2V) and vehicles and infrastructure (V2I).
External factors like weather conditions impact roadway situations and traffic safety [
1], and adverse phenomena, such as fog reduce visibility, contributing to traffic crashes. Fog increases the risk of accidents since it hides long-range visual information and hampers the prediction of the path to be taken and events (e.g., pileups or vehicle decelerations) [
2].
In Brazil, according to the annual traffic statistics of road traffic crashes issued by the federal highway patrol, fog was a probable cause for 11,753 accidents between 2011 and 2020, which represent 5% of the total number of crashes occurred under adverse weather conditions (rain, fog, snow, strong wind, etc.) [
3]. Although the percentage of accidents under fog is smaller than those under normal visibility conditions, they tend to be more severe and involve multiple vehicles [
1,
4,
5].
According to Mueller and Trick [
6], reduced visibility increases the risk of collision. However, not all drivers are affected in the same way—some are more likely to make safety-related adaptations, which can be measured primarily by speed compensation and ability to follow a car or stay in the lane. Speed compensation is the most typical adjustment to driving behavior under fog conditions. Previous studies have confirmed drivers tend to make safety-related adaptations, such as slowing down, to compensate for insecurity due to the limited visual field [
7,
8].
However, a study with a driving simulator conducted by Yan et al. [
9] confirmed driver’s reduction in speed under low-visibility conditions is not enough to respond in time to impending changes in road geometries, speed variation of vehicles ahead, and an emergency event. Although some drivers would keep longer headway distances, rear-end crashes may still occur, since they may not be able to see the breaking lights of the front vehicle [
10].
Efforts have been devoted to solving the traffic safety problems in a fog area. The warning system that alerts drivers about a fog location helps them improve their speed adjustment before entering the fog zone. The most typical warning systems that provide drivers with real-time traffic alerts are located in the highway infrastructure Dynamic Message Sign (DMS), and inside Connected Vehicles (CV), called in-vehicle information systems. Liu and Khattak [
11] claim vehicles sharing their status information with other vehicles or with the infrastructure leads to better-planned actions during driving, earlier identification of hazards, and safer responses.
Several studies on DMSs in fog situations have been conducted. Using a driving simulator, Boyle and Mannering [
12] analyzed drivers’ speed adjustments under four different scenarios of advisory information under foggy conditions. According to the findings, although warning messages lead to significant speed reductions in the low-visibility area, drivers tend to increase speed downstream, when such adverse conditions no longer exist. Al-Ghamdi [
13] studied traffic crashes caused by fog and concluded although the DMS warning system was ineffective in reducing speed variability, the mean speed was reduced by approximately 6.5 kph in fog sections. Wu et al. [
10] conducted an empirical driving simulator study to assess the effectiveness of real-time fog warning systems, and the results showed drivers are more likely to reduce their speed or brake harder under thicker fog.
In recent years, due to the significant development of CV technology, investigations into the effectiveness of V2V systems have increased. Zhao et al. [
14] used a connected vehicle test platform to analyze the speed adjustment of drivers after receiving warning information at different fog concentrations. The results indicated the warning system effectively led to speed reductions in all fog scenarios. Chang et al. [
15] used a fixed-based driving simulator to investigate the effectiveness of fog warning systems in driving performance. According to the results, scenarios with fog warning systems significantly improved safety due to speed reduction prior to a fog area over the no warning system scenario. Wu et al. [
16] conducted a driving simulator study to evaluate the effectiveness of the Head-Up Display (HUD) warning system in drivers’ braking behaviors. The results indicated the system can help decrease drivers’ reaction time and reduce the probability of accidents.
The information exchange between the CV technology and the driver is critical content to be studied, especially due to the benefits it can offer to highway management, reducing investments for the elimination of stretches with high accident indexes like s-curves (i.e., complex curves with a generally small radius and short tangent) [
17].
The road geometry of curves is complex, thus hampering driving and often violating a driver’s expectations. Milosevic and Milic [
18] investigated drivers’ perception of vehicle speed in curves and reported drivers tend to underestimate their speed. Speed underestimation on curved roads can significantly contribute to sudden speed variations, hence, accidents. Good accident-prevention measures must, therefore, be selected according to the characteristics of the curves for preventing drivers from misperceiving their speed.
Although previous studies have analyzed the effects of fog warning systems on drivers’ speed maneuvers, few have compared drivers’ behaviors while driving in curved segments in different weather scenarios.
Multiple ADAS implementation positively impacts drivers’ behavior but still lacks the ability to address some issues when there is foggy weather condition by assessing the relationship between human behavior and a single ADAS (fog warning system). This research analyzes the effects of an in-vehicle fog warning on a driver’s speed profile on a stretch of road with critical geometric (s-curves) and weather (fog) conditions. An experiment conducted in a driving simulator considered the benefits of its use since it helps evaluations of the effectiveness of inclement weather warning technologies due to their capacity to provide real-world scenarios at a relatively low cost (compared to real-world experiments) and no risks to the driver’s life [
19].
Countries have different climates, traffic compositions, and road geometries, and these different characteristics may influence driving behavior. A broad understanding of low visibility driving behavior in different countries can help researchers and designers improve road safety through more effective safety measures. The scenarios employed were in a simulated rural Brazilian road known for its several s-curves and frequent incidence of fog. A Weighted Severity Index (WSI) methodology defined the critical segment.
2. Methods
2.1. Apparatus
The simulator is part of the Sustainable Road Safety Project of the Department of Transportation Engineering from the São Carlos School of Engineering, University of São Paulo—Brazil. It can support driving simulations in several rural traffic environments under laboratory control according to different experimental purposes and was used in previous studies [
20,
21,
22,
23,
24,
25,
26]. It is comprised of a driving cockpit with a car seat, a steering wheel with paddle shift and force feedback, accelerator, brake, clutch pedals, and speakers to reproduce sounds like vehicle engines and wind (
Figure 1a). A flat panel projected the simulated environment, lateral mirrors, rear mirrors, and a HUD (for speed and fog warning information).
Two computers process the real-time simulation—one is responsible for environment rendering and simulation running, and the other models the vehicle’s dynamics, including a road-vehicle interaction and mechanical responses to the driver’s actions.
In addition to the components described above, appropriate equipment—model Pro 5.10® Smart Eye—was attached to the simulator to record eye movements. Pro 5.10 is comprised of three front cameras that perform the driver’s eye-tracking, and an additional rear camera, which records the scenes seen by the driver. The equipment provides raw data reliability and 3D filtered data, and remotely tracks the direction of the gaze calculated automatically based on X and Y coordinates.
MAPPS 3.3 software, developed by EyesDX (Coralville, IA), analyzed data on the eyes’ movement. A frame-by-frame analysis was conducted on a video with the eye’s position overlaid on the field of view to identify participants’ attention allocation on HUD when the fog warning was displayed. In order to investigate how often and when the participants inspected the HUD, the fog warning region in HUD was defined as one region of interest (ROI), and only the participants whose fixation in the warning moment fell within this area were part of the sample of this research.
Figure 1b shows an example of the software interface, which detects the intersection of the driver’s gaze with objects created in the environment for better determining the response time and maps the areas on the screen most viewed by the driver on a heat map.
2.2. Simulated Location
The rural road simulated is a 5 km stretch of an important Brazilian highway that connects Sao Paulo to Curitiba and is the primary connection between the south and southeast regions (
Figure 2). The stretch is in a mountainous region with high fog incidence and a large number of s-curves in its geometry. The highway administrator provided the stretch geometric design necessary for virtual modeling, the AADT (Average Annual Daily Traffic), as well as the location, type, and severity of accidents that have occurred in recent years.
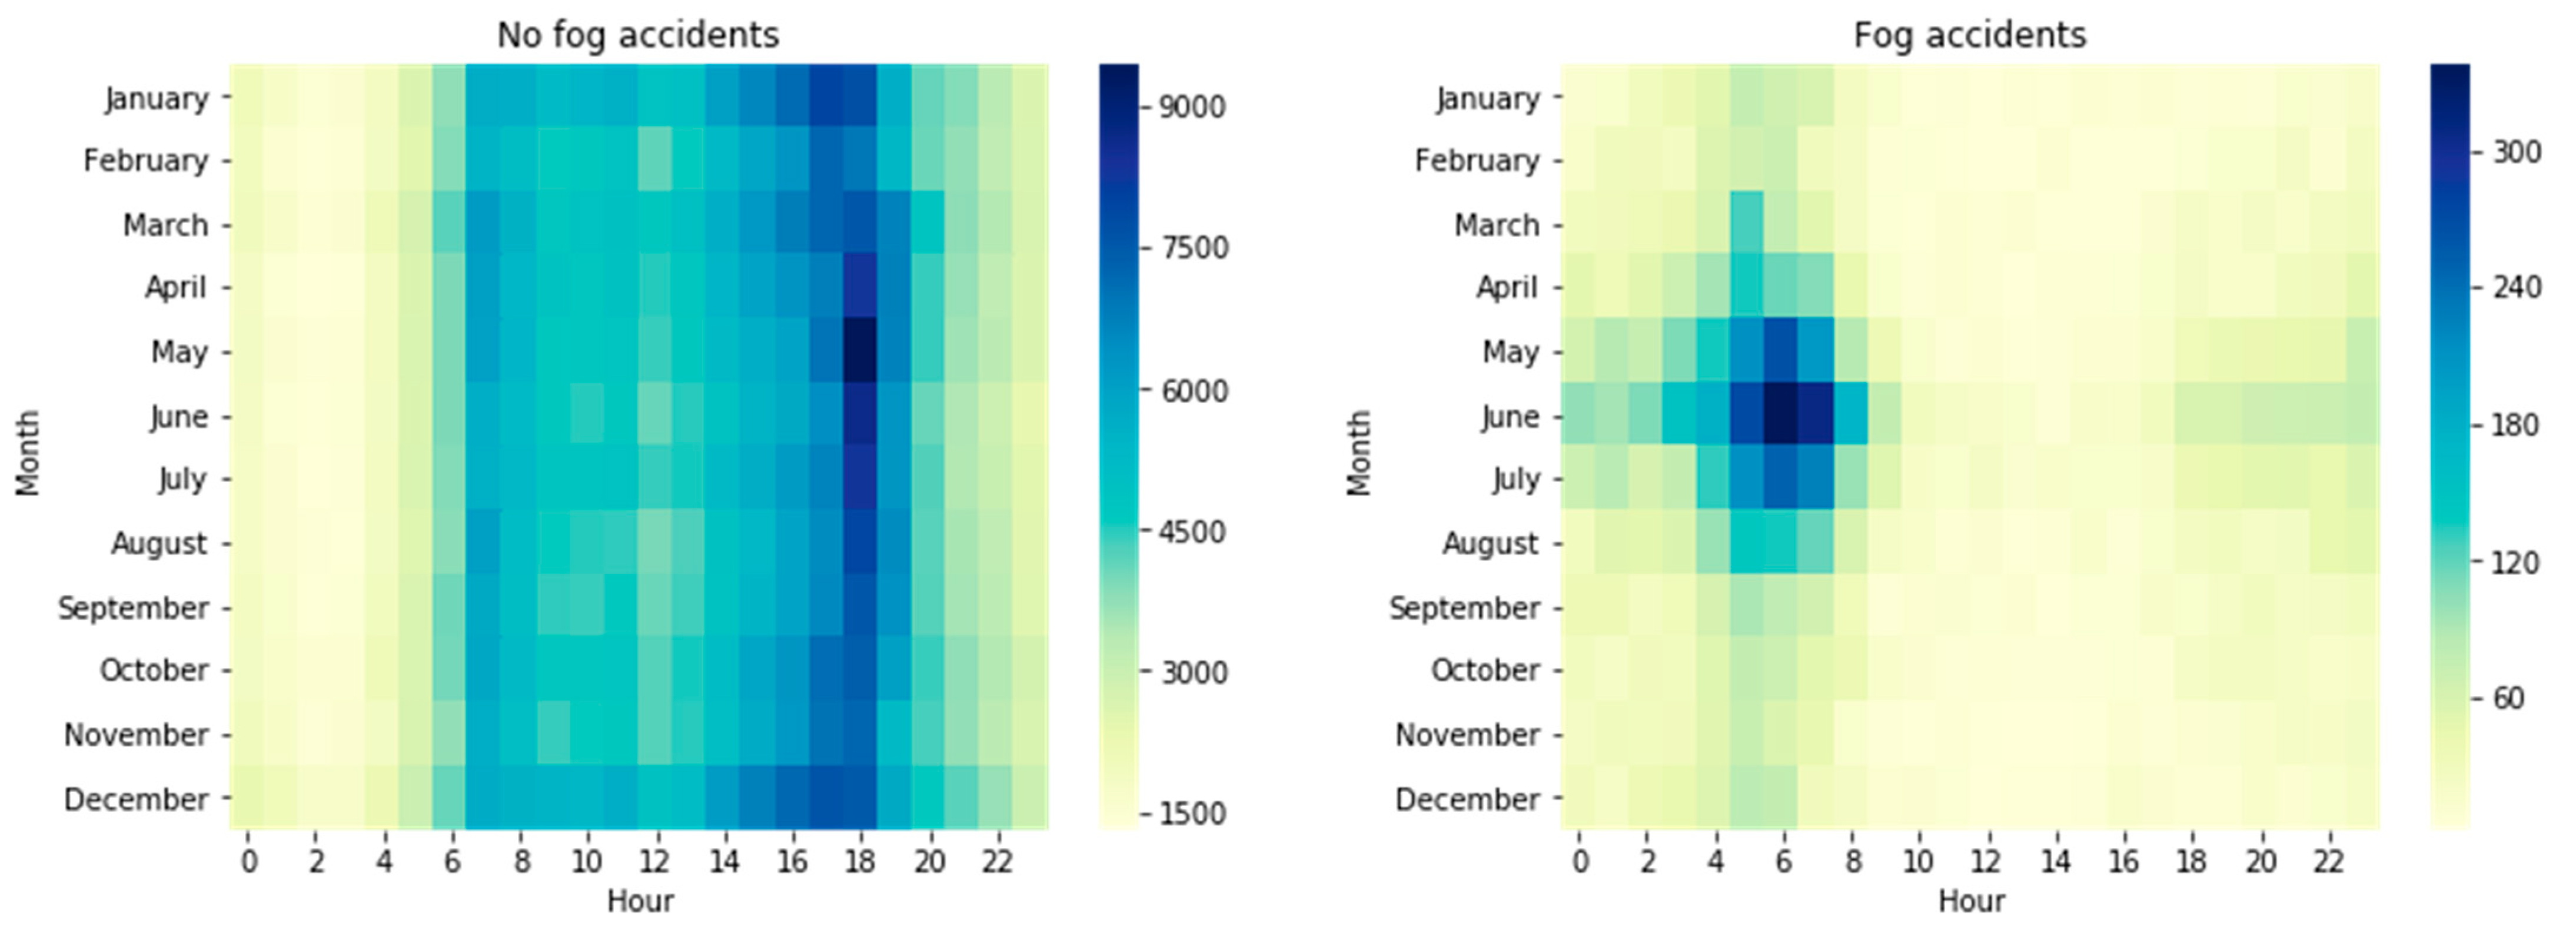
The period for the simulation was the month of June, and the time was set to 6 am, which, according to data from DPRF [
3], is the most frequent period for accidents under fog weather (
Figure 3). Such findings are in line with the results of Abdel-Aty et al. [
27] who, in a detailed study of traffic accidents in the state of Florida (US), observed fog was the main cause of collisions in rural areas, during the winter months and in the early hours of the morning.
2.3. Analyses of Curve
The 5 km stretch comprises 13 curves, and the fog analysis was performed in a segment selected according to the fog car crash statistics of the stretch from 2011 to 2020. The high number of traffic accidents is usually associated with inadequate driving maneuvers of the driver induced by the road geometry [
17]—in this case, by the s-curves of the analyzed section.
Apart from the absolute indices of victims and/or traffic accidents, a Weighted Severity Index (WSI) methodology identified the most critical curves in the segment. WSI is a numerical method of the Brazilian National Traffic Department (Denatran) that attributes weight to the types of accidents according to the severity of the damage caused. In Brazil, Denatran [
28] recommends the following weights and respective expression (Equation (1)) for determining the severity index (S), measured in UPS (Standard Severity Unit), where D, V, and F represent the number of accidents with no victims (with only material damage), with non-fatal victims, and with fatal victims, respectively.
WSI was determined for each curve of the stretch (see
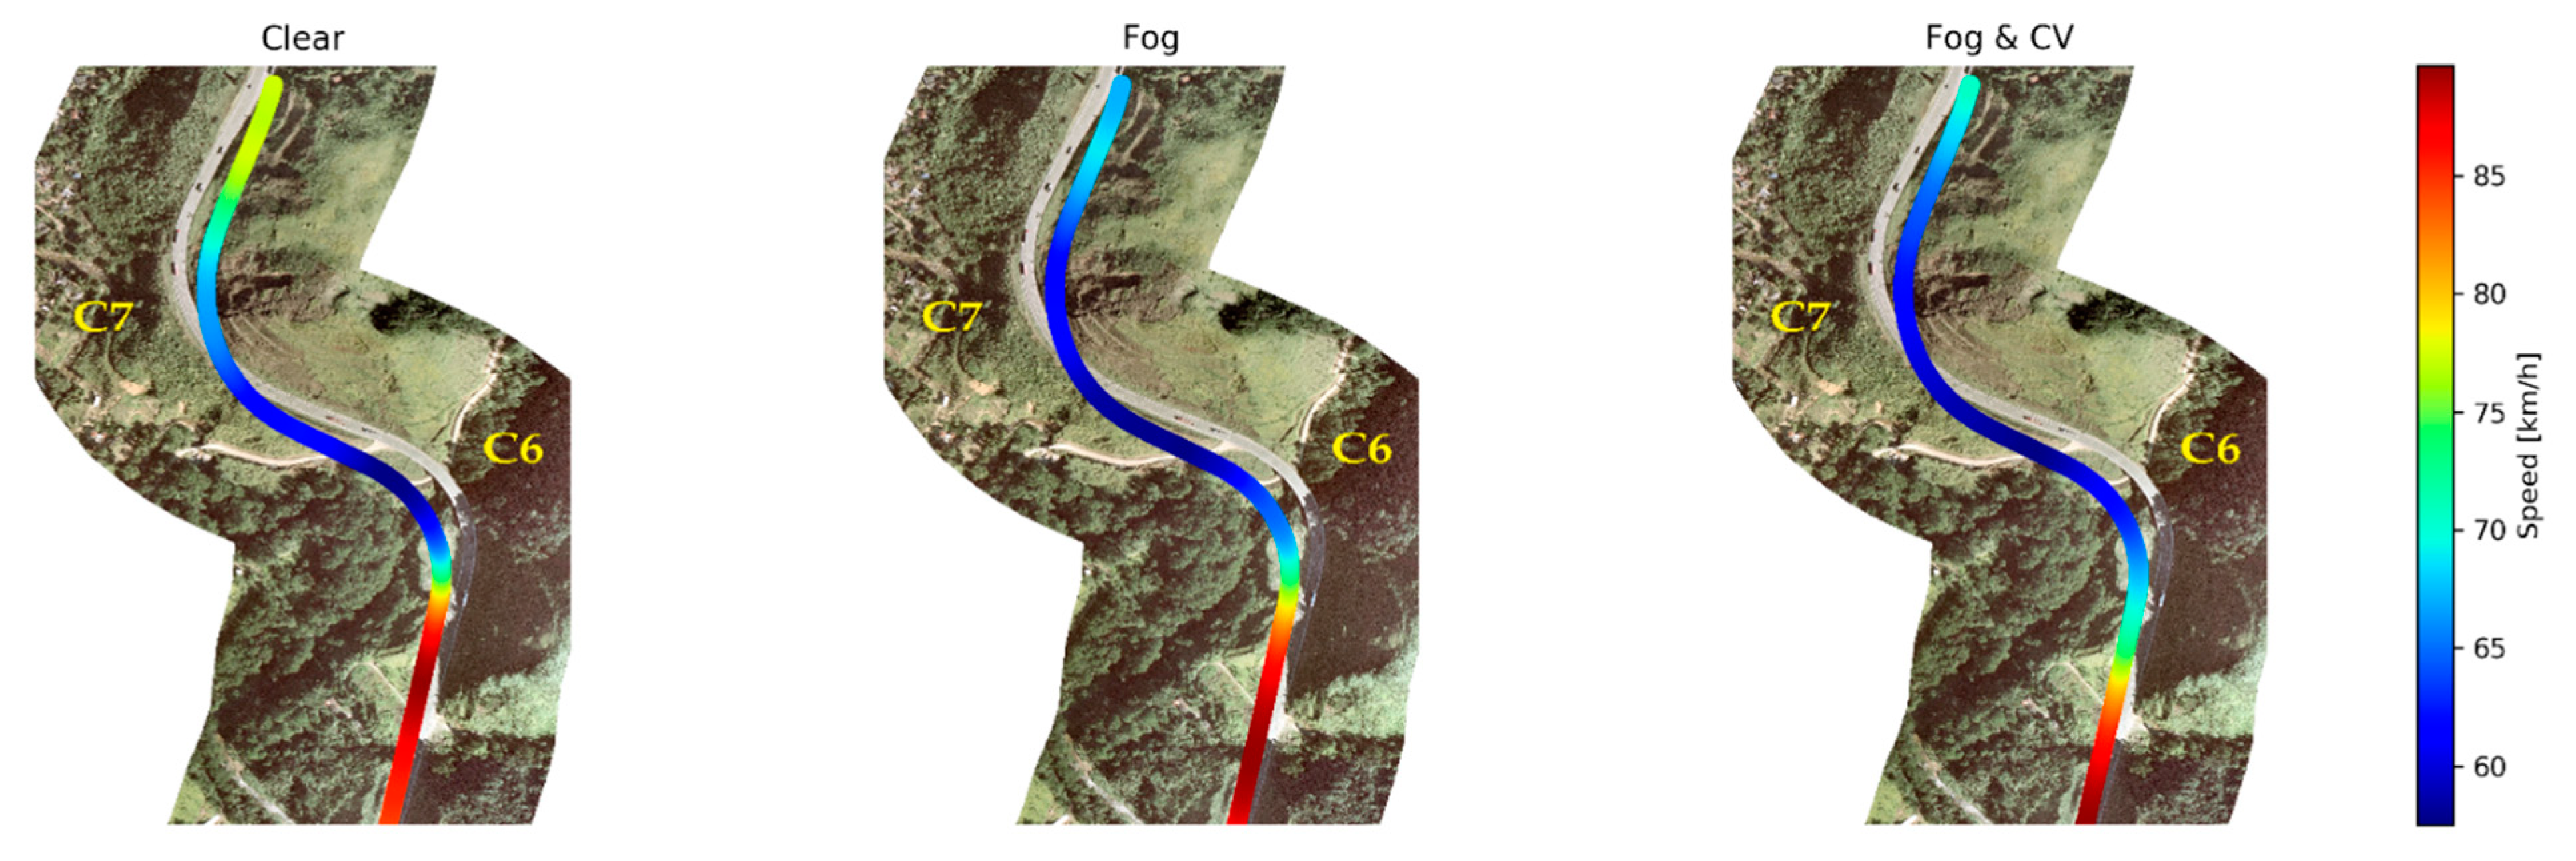
Figure 4) with the accidents reported over the last ten years. The 6th curve (C6) showed a higher number of accidents and severity index. Both the curve and the posterior one (C7) are complex curves with a small radius and short tangents (previous C6 tangent length: 275 m; C6 curve sector: 245 m length and 130 m radius; afterward C6 tangent length: 50 m; C7 curve sector: 340 m length and 180 m radius), classified as s-curves.
The hypothesis is that accidents are related to drivers’ inability to react properly under fog conditions at those spots. According to geometry and crash statistics, the analyses of fog were performed between C6 and C7.
2.4. Scenarios
The scenarios were modeled and simulated by Virtual Test Drive (VTD) package developed and marketed by Vires
®(Bad Aibling, Germany), according to the data collected. The data sets obtained were then analyzed by Python 3.6 programming codes. All scenarios were designed for analyses in the selected stretch, with a heavy x passenger car proportion of the traffic flow respecting the results from National Traffic Counting Plan (PNCT) [
29], at 6:00 am under a cloudy sky. Traffic was deactivated prior to the driver’s entering the fog study area for avoiding the influence of nearby cars.
The only changes between the scenarios were the presence or absence of fog and fog warning for ensuring differences would not be confused with other factors. Fog position (settled in the tangent between C6 and C7) and fog intensity based on visibility (50 m) were fixed in all foggy trials. Fog warning was settled 400 m prior to the driver´s entering fog position.
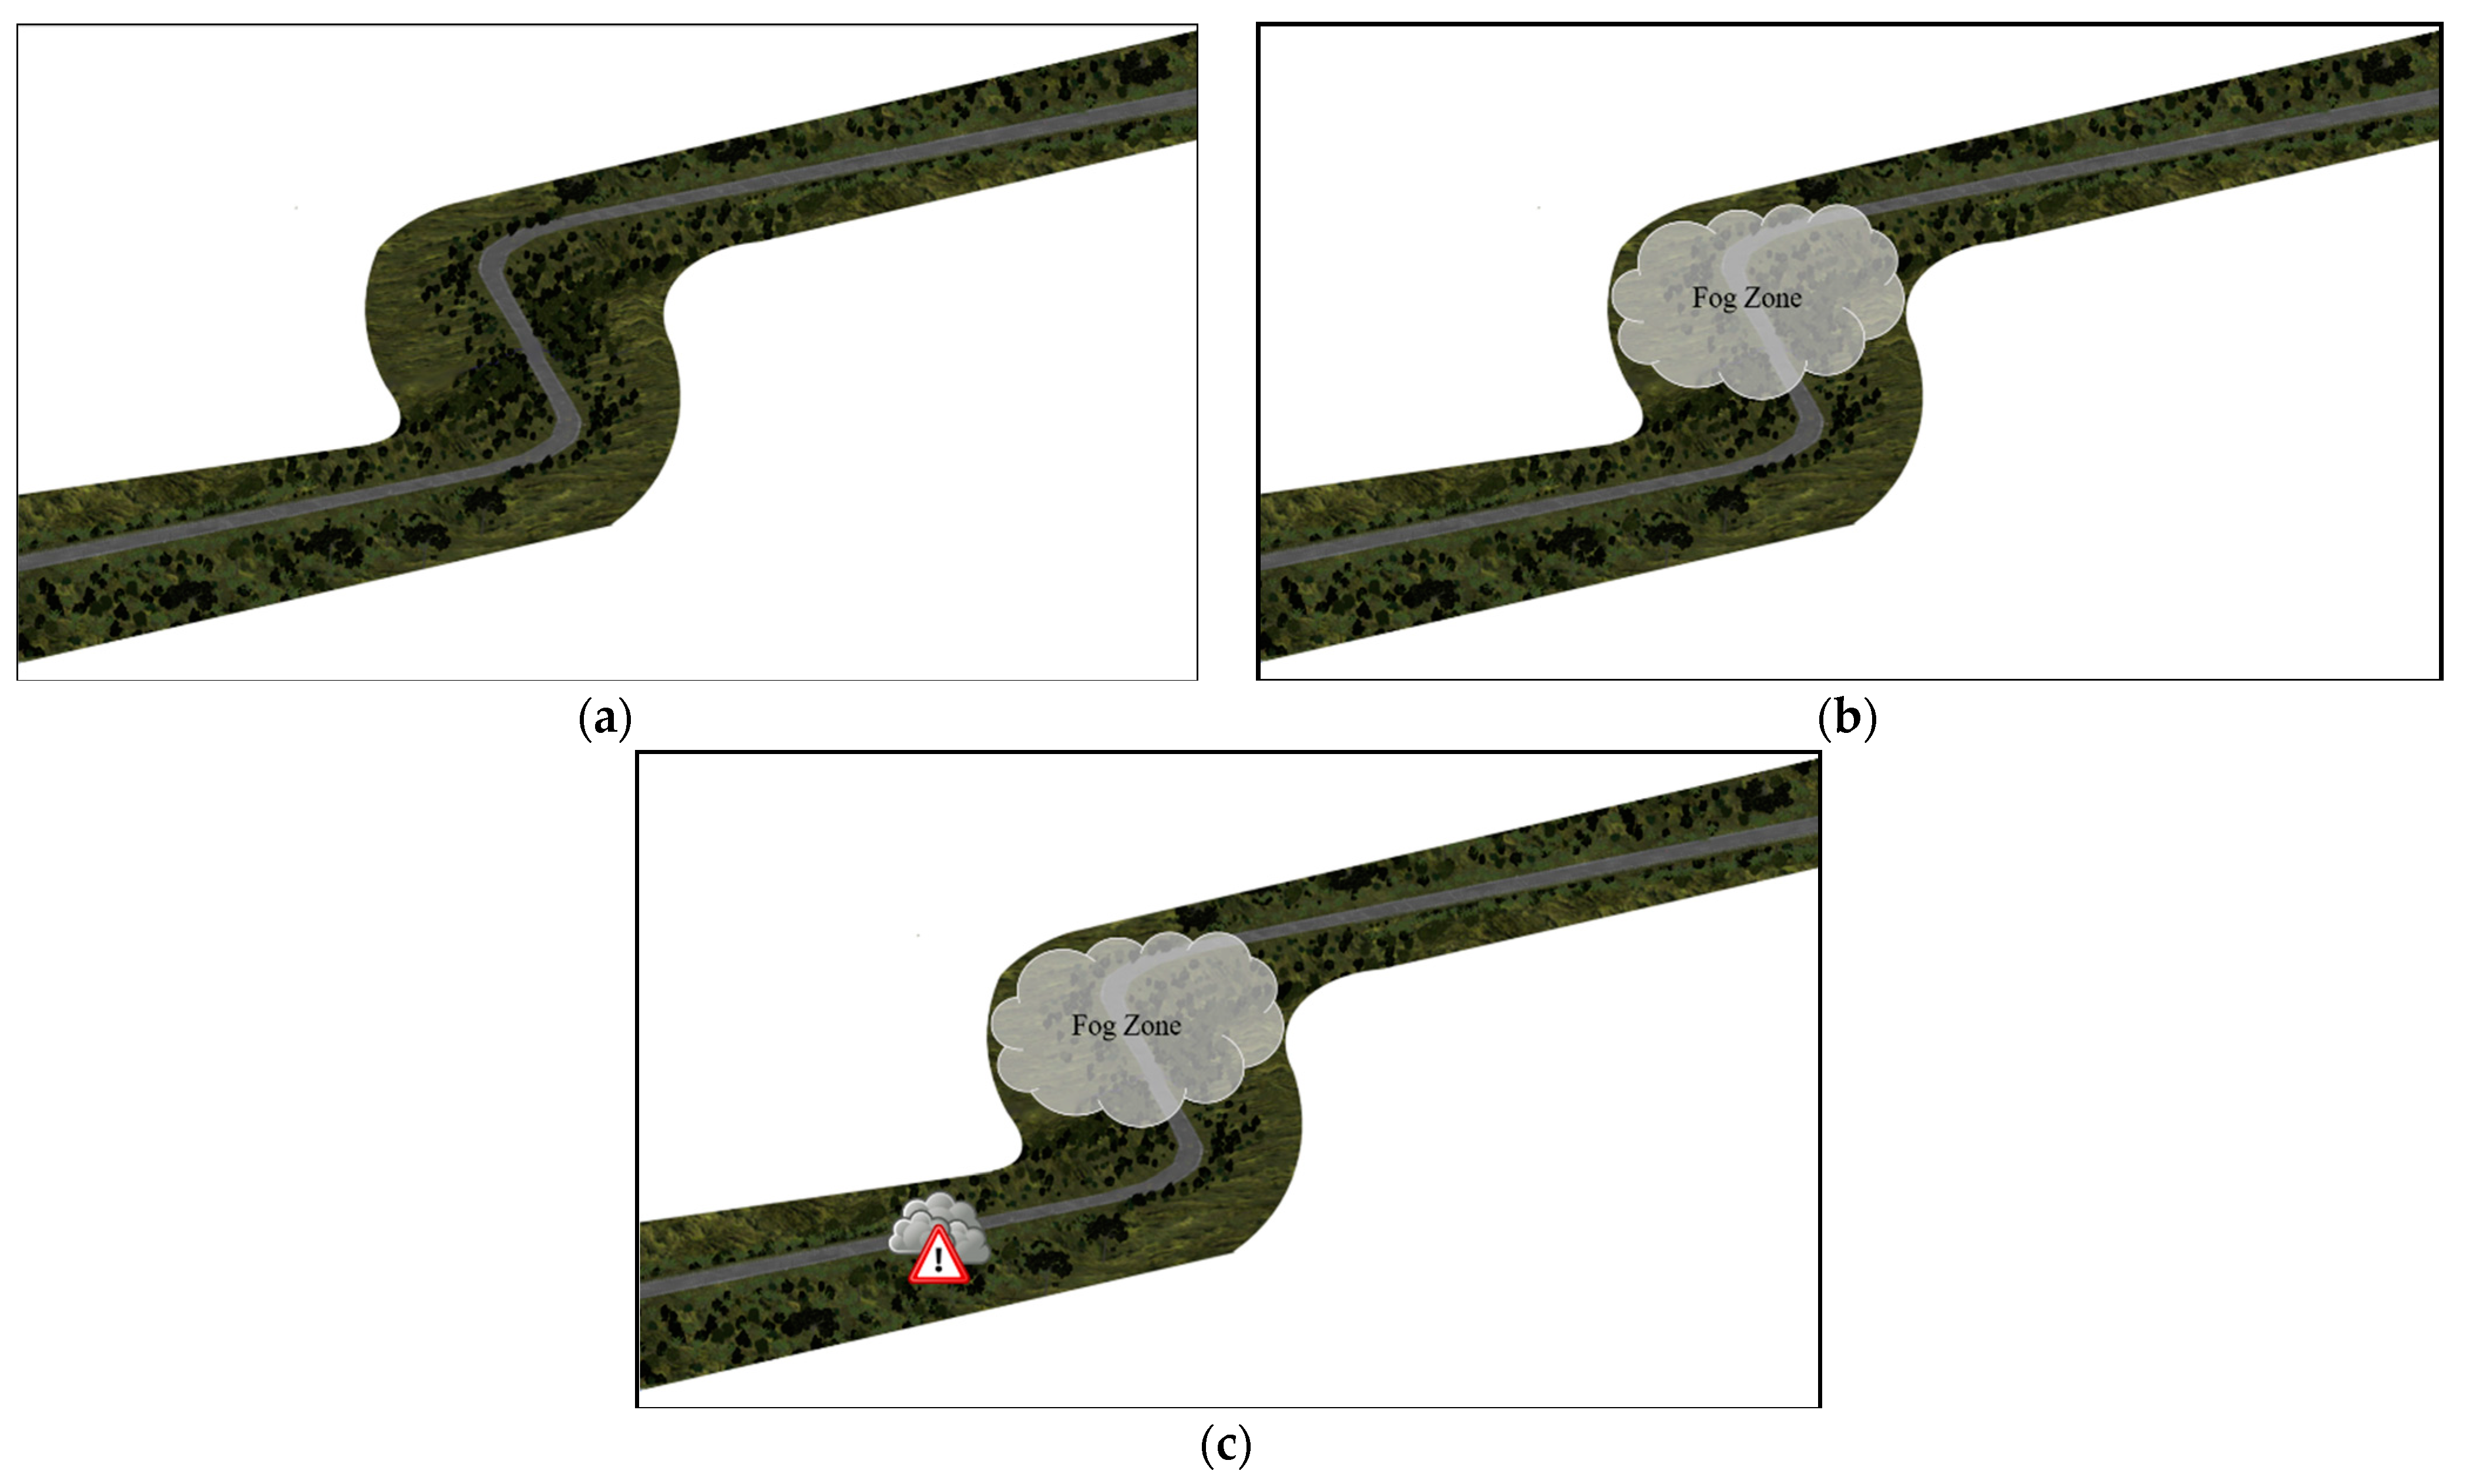
Figure 5 illustrates the three scenarios analyzed, i.e., clear weather (
Figure 5a), fog weather (
Figure 5b), and fog weather with an in-vehicle fog warning system, referred to as “Fog&CV” (
Figure 5c).
2.5. Experimental Design and Procedure
Trials were conducted with twenty-eight participants, who were required to have had a driver’s license for at least one year and normal or corrected-to-normal vision. The group of volunteers was formed by 18 men and 10 women, aged between 21 and 33 years old (M = 25.4, SE = 4.0).
A repeated-measures ANOVA design was employed, and each participant experienced clear weather, fog weather, and fog weather with fog warning, thus totalizing three trials/scenarios for each one. The clear weather scenario (
Figure 5a) represents the baseline group and will be useful for analyses of drivers’ default behavior. The other two scenarios (
Figure 5b,c) are expected to enable analyses of the way both fog and CV technologies inside the car change the drivers’ behavior. The order of the scenarios was randomly sorted for each participant towards avoiding bias, as well as accommodating the limited time each participant would spend in the simulator and minimizing possible simulator sickness.
A Protection of Human Subjects in Research approval (number 2.611.849) was obtained from the Brazilian National Health Council prior to the experiments. Upon arrival at the laboratory, each participant signed informed consent and filled out a personal information questionnaire. They were also instructed on procedures and mechanical operations of the driving simulator. The instructions did not include any detailed information on the experiments that might potentially influence the driving behavior. The participants were asked to drive as normally as they usually do in a real car. Subsequently, they drove an adaptation scenario until they had felt adapted to the simulator and comfortable with the simulation. The adaptation simulation lasted at least 5 min for each participant and could be repeated as many times as necessary. After the adaptation scenario, the participants drove for approximately 5 min in each of the three experimental scenarios, with a 2-min interval between them. They were instructed to pull over and stop after they had driven through the data collection segments. The experiment lasted approximately 30 min.
2.6. Data Analysis
A two-way repeated-measures ANOVA is often used to compare two or more groups evaluated at different moments. In this research, 3 groups (scenarios) were compared at 2 different moments (before and after the 6th curve). The ANOVA test was applied by Jamovi (version 1.1) software for the analysis of the effect of different scenarios conditions on speed. All follow-up analyses used Tukey test correction for multiple comparisons. Normality was fulfilled with the Shapiro-Wilk test for all scenarios, and descriptive statistics (mean and standard deviation) for speed are shown in
Table 1.
4. Conclusions and Future Research
This study aims at spurring safety improvements in regions of visibility problems caused by fog, reducing their environmental impact, and preserving drivers’ lives. This is one of the first studies that use driving simulators to understand the driving infrastructure’s environment under fog in the Brazilian scenario
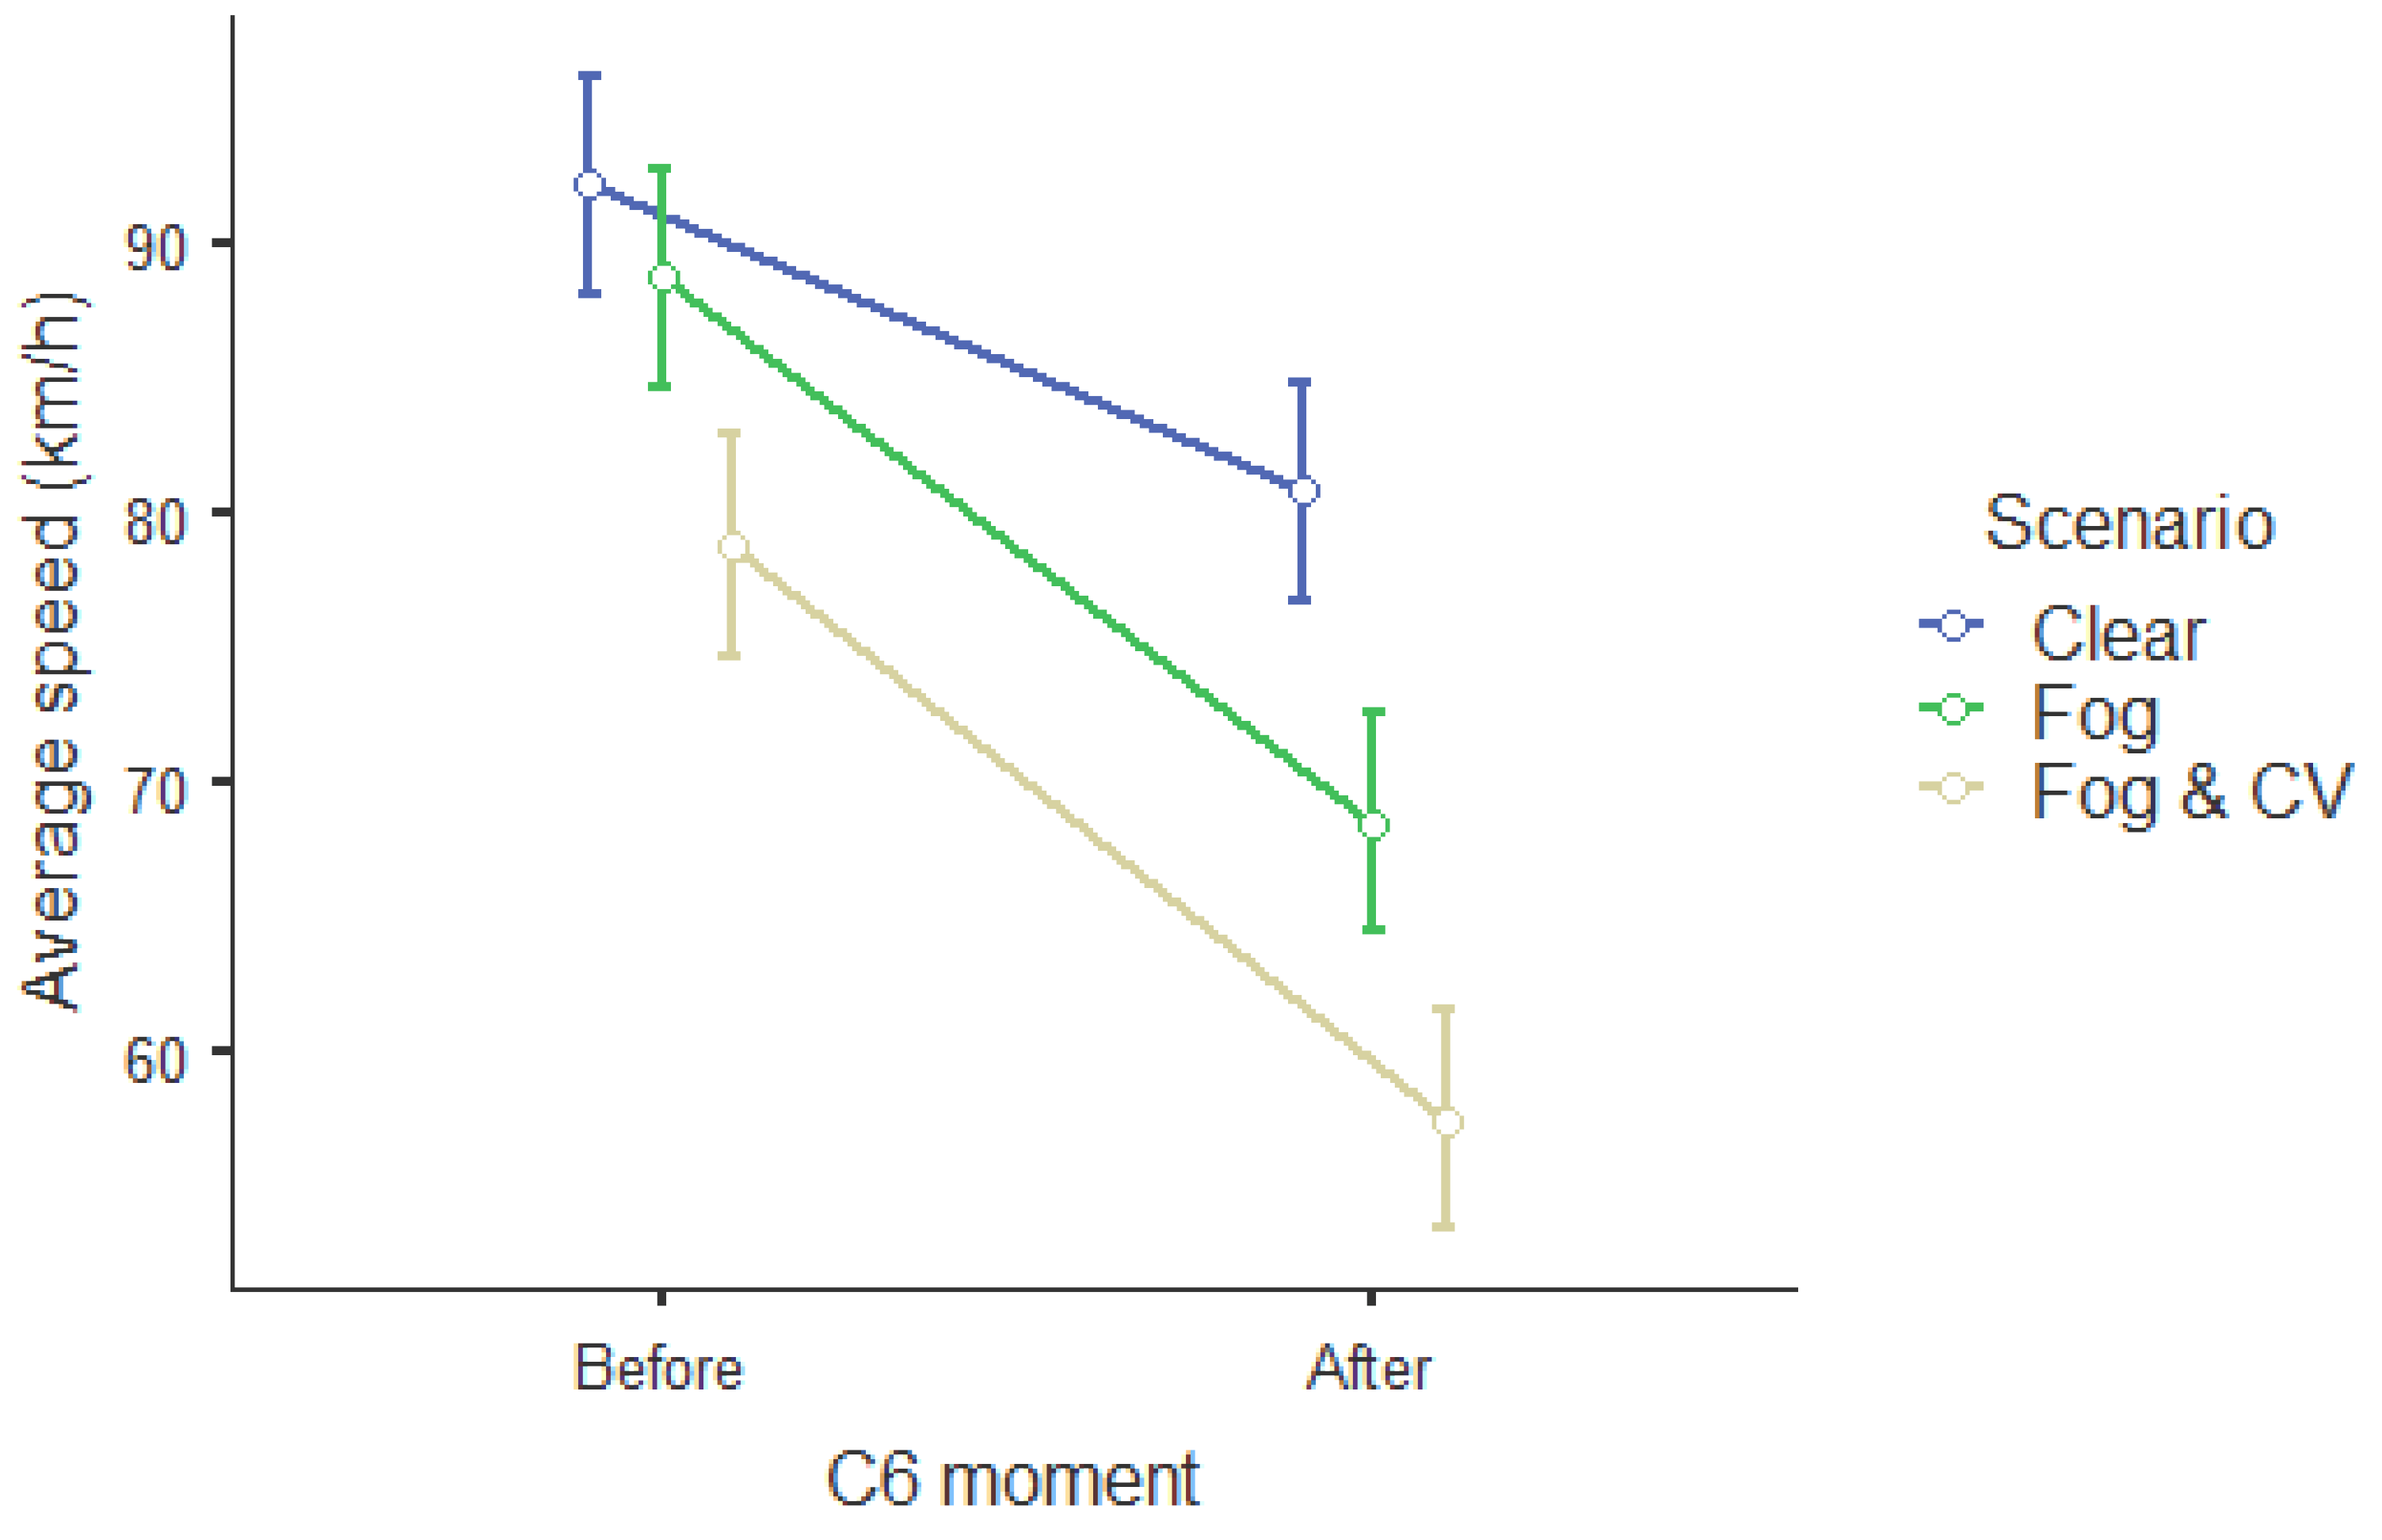
A two-way ANOVA with repeated measures revealed both fog and in-vehicle fog warning systems can effectively reduce drivers´ driving speed. According to a paired comparison with Tukey’s correction, the warning shown on the HUD led to an earlier speed reduction in the Fog&CV scenario. The average driving speeds reduced from 78.8 km/h before C6 to 57.5 km/h after C6, which represents a reduction of approximately 27%. This reduction before and after the curve is more significant than the reductions of 15.5% and 22.7% observed in the clear and fog scenarios, respectively. Therefore, a vehicle with an in-vehicle warning system enables drivers to drive at lower speeds in a fog region.
Although in fog weather drivers tend to drive more cautiously and at lower speeds, this is not sufficient to compensate for the hazards imposed by adverse weather. A CV technology would substantially improve road safety since drivers would better adjust speed to enter a fog zone and proceed to a successive curve.
An in-vehicle warning system can improve the speed profile of drivers performing s-curves. Efficient CV technologies would lead to lower-cost changes in road safety in comparison to those in the highway infrastructure.
Connected vehicles technologies can potentially transform our way to drive. However, prior to their broad implementation, several technical challenges must be overcome.
Countries and regions must harmonize their research, standards, policies, and technology; the use of different communications standards, for instance, will hamper the application of connected vehicle technology, since the one used in a certain region may not work in another.
Such technology can also decrease crash risk through the incorporation of drivers’ personal characteristics in warning systems, and improve traffic safety under fog conditions. This study was limited to analyzing the drivers’ speed profile to detect differences due to the use of a single ADAS. Future research should investigate the effects of different delivery times of warning messages under fog conditions, different designs of the head-up display, and the implementation of multiple ADAS combined.


