Article

PLM Solutions in the Process of Supporting the Implementation and Maintenance of the Circular Economy Concept in Manufacturing Companies

by
Mariusz Cholewa
1,* and
Luan Huynh Ba Minh
2
1
Department of Mechanical Engineering, Wroclaw University of Science and Technology, 50-370 Wrocław, Poland
2
Project Management Department, Green Electric Investment JSC, Ho Chi Minh City 721260, Vietnam
*
Author to whom correspondence should be addressed.
Sustainability 2021, 13(19), 10589; https://doi.org/10.3390/su131910589
Submission received: 20 July 2021 / Revised: 15 September 2021 / Accepted: 16 September 2021 / Published: 24 September 2021

Abstract

:
The Circular Economy (CE) is a priority topic for various stakeholders such as politicians, scientists, and industry. However, despite the significant interest in CE, there is still a lack of a framework explaining how manufacturing companies willing to become circular adapt their existing business model. The concept of this work is based on the use of Information Technologies such as the well-known and long-proven Product Lifecycle Management (PLM) solutions in the implementation and maintenance of the CE concept to reduce the consumption of primary raw materials, increase employment rates, and reduce environmental damage. This paper aims to assess the feasibility and effectiveness of using the PLM approach to implement the CE concept. The authors selected the most common and effective PLM functionalities and then assessed them to support selected components of the CE concept using qualitative and quantitative methods. The performed assessment and the inter-relation matrix of benefits developed on its basis allowed for pointing out the feature combinations that would bring the best outcome. The conducted study proved that the implemented and properly working PLM solution could simultaneously support CE concepts. PLM functionalities such as (1) product development, (2) transparency, and (3) value-maximizing with the combination of CE functional areas of (1) personalization, (2) made to order, and support turned out to be particularly effective. This study contributes to ensuring an effective and quick process of implementing CE concept in manufacturing companies and moreover opens further research ideas in bringing the Circular Economy to life.

1. Introduction

As the world’s population grows, the demand for raw materials increases. However, the supply of critical raw materials is limited. The extraction and use of raw materials have a significant impact on the environment. At the same time, it also increases energy consumption and CO2 emissions. Through the immoderate consumption of resources by industry, recent decades have led to an uncontrolled increase in CO2 emissions, which, if not stopped, could lead to the destruction of our environment production, society, and population. This issue is severe, as noted by the European Commission, which in March 2020 was presented as part of the European Green Deal, and is in line with the proposed new industrial strategy a new Circular Economy action plan, which includes proposals for more sustainable product design, waste, and empowering consumers [1].
The “Circular Economy” concept, which often coincides with “sustainable development,” is a remedy for this state of affairs. CE is defined as “the set of organizational planning processes for creating, delivering products, components, and materials at their highest utility for customers and society through effective and efficient utilization of ecosystem, economic, and product cycles by closing loops for all the related resource flows” [2]. The main goal of CE is to extend the product lifecycle by “slowing, narrowing and closing the resource loops through biological, technical and information cycles” [3]. It can be achieved by extending the traditional perception of manufacturing processes in a production plant towards Product Lifecycle Management, including preparation for reuse, remanufacturing, recycling, or final safe disposal already at the production stage [4]. Lifecycle design and management are becoming a strategic element of implementing the “circular” approach [5].
These activities should lead to the regeneration and recovery of resources and environmental protection. Even though the benefits are still theoretical, mostly big companies have started to invest in this approach.
However, there is still a lack of a framework explaining how companies willing to become circular should adapt their existing business model despite their significant interest in the Circular Economy [6]. The methodologies and frameworks for CE are still under development [7]. Moreover, small and medium-sized companies still hesitate to take a step towards a new concept. Hence, in a broader sense, little effort and practical applications have been made to make this idea a reality and to make it be perceived as a critical factor in business. The last but not most minor barrier is the lack of appropriate technology to adopt CE practices in the company, which is particularly visible in activities related to the development of new products [8].
Digitization seems to be an essential element on the way to change this state. The implementation of Product Lifecycle Management allows for companies to set up a digital backbone of processes during their products’ lives, starting with conceptualization through manufacturing, support, and withdrawal from the market. As a result, it allows for collecting complete data about products, processes, and resources at every stage of the product life for all actors involved. It can collect and integrate any information, including environmental information, such as the material composition of products, to stimulate high-quality recycling or better reuse of components or products. In this way, PLM can digitize and generate new business value for entities along the entire value chain [4]. The combination of Product Lifecycle Management functionalities appears to be a step towards smoothing the change as PLM can provide certain combinations of functions that demonstrate CE benefits for companies. The concept of work is based on the use of well-known and long-established Product Lifecycle Management solutions in the implementation and maintenance of the Circular Economy concept to ensure the efficient use of natural resources, clean production, and environmental protection, not to mention the economic benefits.

2. Literature Review

Since this paper focuses on the implementation and maintenance of CE concepts in manufacturing companies, it seems appropriate to define and find the links between CE and Industrial Ecology (IE) to place this study in the broad background of both concepts. IE is an advanced holistic approach to redesigning industrial operations by shifting from “end-of-pipe” pollution control methods to prevention and planning for more environmentally friendly industrial development: “Industrial Ecology is industrial in that it focuses on product design and manufacturing processes. It views firms as agents for environmental improvement because they possess the technical expertise that is critical to the successful execution of environmentally informed design of products and processes” [9]. In the Handbook of Industrial Ecology [10], IE aims to create a closed-loop of resources within production processes in a linear industrial economy to reduce environmental impact and increase economic efficiency.
IE was first introduced in the late 1980s and has remained the subject of definitional debates, particularly concerning CE. In many publications, the thesis is that IE is a transitional object for shifting from a linear economy to a Circular Economy (CE). According to Walter Stahel in his book [11], the goal of CE is to maximize the use of physical resources. Thus, the goal of CE is different from IE in the sense that CE does not ultimately focus on producing more products by cascading resources as IE does but tries to preserve product values as much as possible by optimizing loops. Another observation is that CE promotes sufficiency instead of efficiency [12]. In the context of this study, CE has some similar functions to IE, such as industrial metabolism, dematerialization, and decarbonization, lifecycle planning, eco-design, product stewardship, industrial symbiosis, and eco-efficiency. CE has a broader meaning and impact, extending to other areas outside the manufacturing sector, particularly to humans’ perception and awareness of environmental responsibility, doing the right things instead of doing things right. There is a connection between these two concepts, and IE has research and applications that can foster CE because of its long tradition.
The concept of CE also has great potential in supporting and implementing the Sustainable Development Goals (SDGs) [13]. These goals were established in 2016 by the United Nations, and its “2030 Agenda for Sustainable Development” includes 17 goals ranked in 3 categories: economic growth, social inclusion, and environmental protection. These goals are also known as the global sustainability challenges for sustainable consumption and production. Based on the principles of eliminating waste and pollution, keeping products and materials in use, and regenerating natural systems, CE tools and practices can be used to address the challenges of climate change, living with limited water resources, industry, innovation and infrastructure, sustainable cities and communities, responsible consumption and production, decent work and economic growth, and affordable and clean energy. Properly applied, CE methods and principles can directly or indirectly bring many positive impacts to SGDs.
There is no one-size-fits-all approach to implementing CE in organizations [14]. This process always requires overcoming specific barriers resulting from the specificity of the company’s business model, technological level, and employees’ competencies.
Attempts were made to build a knowledge base to facilitate the CE implementation process in the company. For example, one study [15] developed two tools to support implementing the CE concept. These are two databases containing deployment strategies and deployment use cases. These tools are advisory and allow companies to choose the most appropriate way to implement the elements of the CE business model.
Another proposal is to use known and practiced simulation techniques to implement the circular approach in enterprises [16]. IIOT, the Industry 4.0 component, has ensured that the data is up-to-date, which for many companies means a financial investment and the need to improve employee competencies. There are various quantitative tools, indicators, and matrices that can be used to apply CE principles. However, these methods are often limited by data unavailability, data inconsistencies, lack of information on the lifecycle of their products, lack of technological expertise in product design and integration with production processes. Chauhan et al., suggested that the technologies included in Industry 4.0 can overcome these barriers [17]. In the study on digitization and CE, the authors defined several challenges related to CE and digitization, such as business models, data ownership, data sharing, data integration, collaboration, and competency requirements. [18]. The most crucial element seems to be cooperation. According to the author, digitization enables transparent access to data on resource consumption and product lifecycles, and thus enables the transition to CE. It is widely believed that only by using new digital technologies that constitute the backbone of the fourth industrial revolution (such as the Internet of Things (IoT), 3D printing, big data, and related analytics, virtual and augmented reality, etc.) can CE be successfully implemented in manufacturing companies [19].
However, we believe that, contrary to this statement, it is possible to successfully use existing, well-known IT solutions to implement CE in a manufacturing company successfully. In this way, it is possible to eliminate implementing advanced components of Industry 4.0, which requires organizational, technological, and financial efforts.
PLM solutions are a tool that has long been effective in eliminating all of the above barriers in manufacturing companies and their supply chains. The capabilities of PLM systems in CE implementation have been recognized in the research of Lieder et al. [20]. There, it was found that the use of PLM systems in implementing the CE concept can directly support the bottom-up approach proposed in this article.
PLM systems, particularly their selected functionalities, enable the practical implementation and support of the CE business model in a manufacturing company, which will be proven in this study.
So far, researchers have tried to answer how PLM solutions can be extended to support CE concepts (how to upgrade existing PLM to provide functionality that is in line with the CE concept) [21,22]. Others were tackling technical aspects of CE implementation, e.g., by analyzing the role of ICT enabling CE based on PLM systems to identify challenges and opportunities [23].
Due to being a more generic tool, PLM has been the least discussed practice in developing new products focused on CE. It is not easy to find information or studies assessing all or the main functionalities of PLM systems and their impact or suitability for implementing CE in a company. It has become a research challenge addressed in this article.
In this context, this paper aims to assess whether PLM systems can be used to implement and support the CE approach in product manufacturing processes. The specific objectives are:
1.
Assessment of different aspects: business, environment, individuals, and their value in PLM and CE.
2.
Determination of scopes of operation in the company of both concepts PLM and CE: Which domain can be supported by PLM and CE?
3.
Find functionalities, actors, and domains that can be supported both by PLM and CE components.
4.
Analyse the functionality of PLM and components of the CE model and their combination to increase company performance and benefits.
5.
The assessment of whether PLM can facilitate the CE implementation process in the company.
The main contribution of this work is the proposal to use PLM solutions, particularly their functionality, to implement and maintain the CE model in the company. Section 3 proposes a research method to analyze and compare the PLM and CE concepts to confirm the above assumption. Based on the literature sources, an overview of both concepts’ functionality, components, application goals, and benefits will be carried out. Then, the identification and assessment of the degree of their compatibility and limitations will be made. The individual elements of both concepts will also be assessed. As a result, six key PLM functionalities and six components of the CE concept will be selected. In Section 4, selected functionalities and components will be assessed regarding the benefits offered and their impacts in three domains: Environment, Business, and Individuals. This assessment will be made using qualitative and quantitative methods. In the next step, the obtained results will be used to build the interrelation of potential benefits matrix, which will determine the most effective combinations of PLM functionalities and CE components. The PLM functionalities obtained in this way will be proposed as elements of the implementation and maintenance strategy of the CE concept in a manufacturing company using the existing PLM system in the company. Section 5 contains conclusions and recommendations and indicates other potential activities and research areas to continue the presented research.

3. Method and Material Analysis

To verify the assumed thesis and to answer the main objectives of the paper, research will be carried out, the course of which is presented in Figure 1. The description of the research procedure is as follows:
1.
Based on the literature analysis, the following will be compared: scopes, main objectives, and finally, benefits offered by the PLM and CE concepts in product manufacturing processes;
2.
An assessment of the impact of PLM and CE benefits upon three selected domains: environment, business, and individual;
3.
Analysis and selection of the PLM and CE functionalities and components that bring the best outcomes for the three domains: Environment, Business, and Individual;
4.
Identification of the combination of functions domains using the developed concept of the interrelation function matrix that bring the most significant benefits in 3 defined domains for users of PLM solutions and simultaneously support the most effective components of the CE concept from the production company point of view.
The data necessary to conduct the following research will be obtained from existing and well-established scientific studies and publicly available statistical research results. The result will be a list of PLM system functionalities that support the CE concept in a manufacturing company to the greatest extent. Thus, their implementation and use allow for shortening the process of implementing this concept in the company.

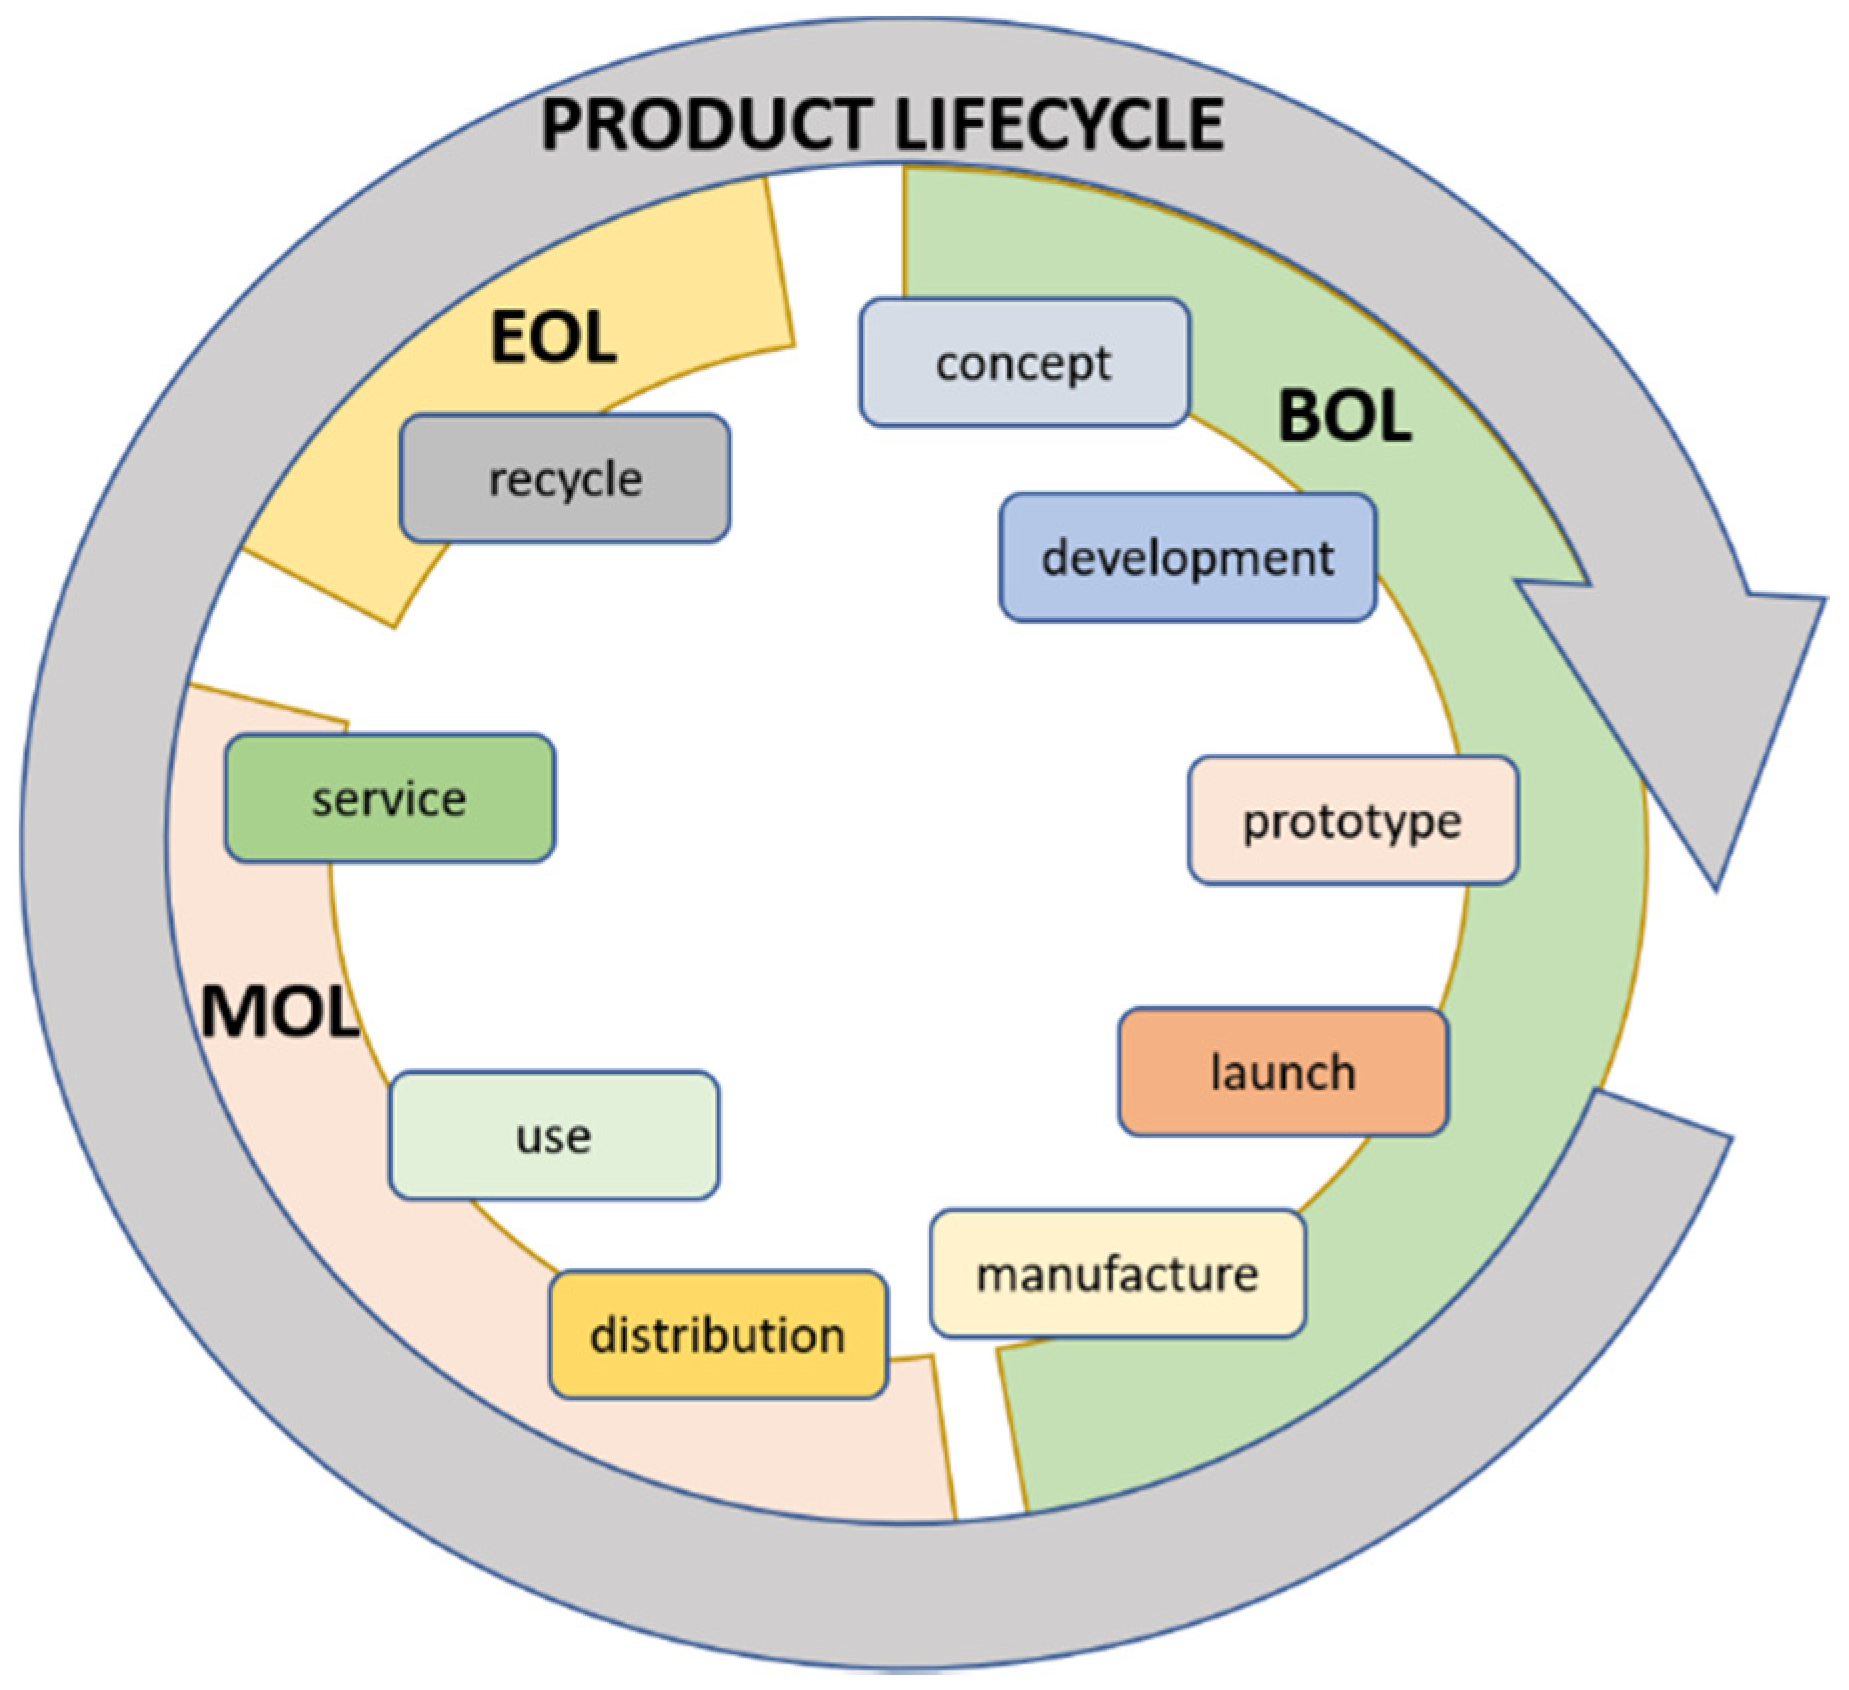
3.1. Product Lifecycle Management

The concept of Product Lifecycle Management was born to manage and develop products and product-related information systematically by offering management and control of the production process and the order–delivery process, as well as control of the product-related information throughout the product lifecycle. It is defined as a business strategy to build and maintain a product-oriented knowledge environment to integrate people, processes, resources, and information. The PLM environment enables collaboration between multiple product stakeholders throughout its lifecycle [21].
The scope of a PLM operation covers three main phases of the product life (Figure 2). Beginning of Life (BOL) is about the imagination of a product that comes from peoples’ ideas converted to detailed definitions and specifications. The phase ends by realization/manufacturing of the product. Middle of Life (MOF) starts after being delivered to the customer. The products are in the use/support phase. End of Life (EOL) is when products come to a phase in which it is no longer useful, during which they are retired, recycled, or trashed by consumers.
Product Lifecycle Management objectives are to create, preserve, and store information of the company’s products and activities to secure the fast, easy, and trouble-free finding, refining, distribution, and reutilization of the data needed for daily tasks. The idea is to convert data managed by the company’s staff, skilled persons, and specialists into company assets in a manageable and shareable form. Moreover, the aim also focuses on increasing product revenues, reducing product-related costs, maximizing the value of the product portfolio, and maximizing the value of current and future products for both customers and shareholders. Management of a product’s whole life allows companies to evaluate and control the environmental impact of products and technologies throughout the entire lifespan, from raw material extraction through to reuse, recycling, and disposal at the end of life [24].
Another objective to mention is the production process innovation fostered by PLM solutions. A PLM solution enabled by a product innovation platform could solve many problems in driving innovation with a suite of heterogeneous solutions.
The importance of PLM is to ensure that the products that at the heart of the company are clearly defined, well documented, and proactive throughout their lifecycle. The implementation of this primary goal generates tangible benefits for the company [26,27]:
1.
PLM improves product development activity by improving innovation, reducing time-to-market for new products, and providing excellent support and new services for existing products.
2.
PLM enables and maximizes collaboration across the design chain and supply chain. It also helps manage Intellectual Property and maximize the reuse of products and knowledge.
With the help of the product development function of PLM, the business can shorten time-to-market, which makes the negative cash flow minimized then increase the business revenue. When products come to the second stage, the collaboration between the supply chain and design chain helps shorten the time to volume.
3.
PLM enables a business to reduce product-related costs using tools and gathered knowledge to minimize product-related material and energy costs defined early in the product development process. In addition, costs of recall warranty or recycling that come later in the product’s life are reduced.
4.
PLM gives transparency about what is happening over all product lifecycles.
5.
PLM enables better support of customers’ use of products by direct access of all stakeholders to customer feedbacks during EOL.
6.
PLM enables the value of a product to be maximized over its lifecycle. PLM extends the lifetime of a product by adapting different approaches as it moves through the lifecycle based on precise information about products in their mature state.
Product-related costs are defined by the fixed cost of material and energy. PLM provides tools and knowledge to minimize these costs and cuts recall, warranty, and recycling costs later in a products’ life. The functionalities of transparency and maximizing value target the whole product lifecycle and service lifecycle. Transparency gives managers visibility about what is happening with products, product development, modification, and retirement projects. In the MOL, efforts are put into supporting customers properly with spare parts, repairs, and instructions. PLM brings the connection between CRM, ERP, and other related departments to speed up customer services.
Companies manage products from the cradle to the grave as part of their PLM strategy following a linear model where products are developed, manufactured, used, and disposed. However, environmental challenges such as loss of biodiversity, water, air, soil pollution, and particularly reducing natural resources, increasingly threaten Earth’s life support systems, necessitating a transformation to more sustainable paradigms, e.g., Circular Economy [21].

3.2. Circular Economy

According to Ellen Macarthur (Circular Economy foundation), the Circular Economy is based on the principles of designing out waste and pollution, keeping products and materials in use, and regenerating natural systems [1]. In other words, a Circular Economy is a systemic approach to economic development designed to benefit businesses, society, and the environment. Contrary to the “take-make-waste” linear model, a Circular Economy is generative by design and aims to gradually decouple growth from finite resources consumption. The well-know “butterfly diagram” captures the primary concept [28]. Several ideas have been put into it, but most the recognizable influence is from the Cradle to Cradle cycles.
The extent of the scope of CE can be defined as below:
  • Macro-economic impacts—a result of decoupling economic growth from primary resource inputs, encouraging innovation, increasing growth, and creating more robust jobs;
  • Environmental and system-wide benefits—by designing out waste and pollution, keeping products and materials in use, and regenerating natural systems rather than degrading them;
  • The opportunity for companies in creating new profit opportunities, cost reduction due to lower virgin material requirements, and stronger relationships with customers;
  • The opportunity for individuals—ranging from new job opportunities to better living conditions and the associated health effects.
Based on its scope, Circular Economy carries comprehensive lists of objectives to be achieved. Some of these include [29,30]:
Macro-economic domain: Economic growth; material cost savings; job creation potential; increase innovation;
Environmental domain: Lower carbon dioxide emissions; primary material consumption; land productivity and soil health;
Companies domain: Profit opportunities; reduced volatility and greater security of supply; new demand for business services; improved customer interaction and loyalty;
Individuals domain: Greater utility; reduced obsolescence.
At least six functional components of a Circular Economy model can be distinguished for a manufacturing company, which can be divided into three main group features [31].
Process model features:
1.
Circular value chain: Across the entire value chain, production cycles aim to close the loop. By using fully renewable, recycled, and/or recyclable or biodegradable materials, products are made efficiently, minimizing material use without harming performance.
2.
Recovery and collection, including industrial symbiosis: By recovering materials, waste, and by-products from the manufacturing process and return systems, all unused resources are retained for other uses by tracing and recovering products during EOL.
Lifecycle extension model features:
3.
Durability, modularity with repair services: With an improved design process with an emphasis on design for disassembly, material selection for durability, or design for repair, the life of products throughout the product lifecycle can be extended by maintaining and improving products through repair, upgrade, refurbishment, or remarketing.
4.
Personalization, made to order and support: The goal is to achieve a more personalized, long-term customer relationship to close the loops, minimize and recycle materials/products, and reduce resource consumption. It gives a better insight into the potential demand for the product itself and the new business needs of its users.
Service model features:
5.
Product service system and dematerialized services: The manufacturer or retailer takes over a “Total Cost of Ownership”, which forces a focus on product durability, longevity, and reliability, as well as usage and reusability.
6.
Collaborative/sharing economy: Digital technology is used to create new relationships and business opportunities for consumers, businesses, and micro-entrepreneurs to rent, share, exchange, or borrow unused goods and resources.
Several barriers limit the propagation of CE in the industry. The conducted research indicates that these barriers may be economic and financial in nature (due to limited financial possibilities and support for companies), social (due to the lack of consumer awareness), institutional (due to limited government support), technological and informational (caused by limited information and knowledge sharing and fear of change), and process-related, for example, in the supply chain (due to the lack of network support and the limited creation of appropriate partnerships) [3]. The last two barriers can be overcome or mitigate through intelligent implementation and the use of well-known PLM systems. This approach has been the subject of many studies [30,32,33].

3.3. PLM and CE Areas of Cooperation/Interactions

Analyzing the literature, we can find general statements that “PLM systems play an important role in supporting the transition to the Circular Economy, as they are of great help in integrating information across multiple life cycles and various stakeholders in the value chain” [34].
It can be noticed that PLM systems can facilitate the process of implementing Circular Economy/Circular Manufacturing strategies, especially in the area of data gathering and management [3]:
This choice can be facilitated with the collection of data, especially from end-of-life phases of the product lifecycle, with the aim of improving the product design of next product generations. Therefore, the sharing and usage of data, both internally and externally, will empower companies in enhancing their organizational and structural capabilities in extending the resource’s lifecycle”.
[3]
PLM systems support the transition to the Circular Economy, as they help integrate information across multiple lifecycles and various stakeholders in the value chain [35]. Well-designed from a PLM perspective, industrial chains can effectively support the CE sharing concept [36].
Works were carried out to evaluate certain aspects of the PLM system performance in the context of CE. For example, it has been proven that PLM can directly support CE by enabling a reverse supply chain [6] or by using a cascade methodology [37].
A different approach has dealt with the PLM-supported product development process so that newly developed products and services (product–service system—PSS) align with the PLM concept [22,38]. The intention was that the method is implemented as an add-on feature for commercial PLM (Product Lifecycle Management) software, with a lifecycle focus, including lifecycle cost calculation (LCC).
Another study confirming that PLM systems are an element that can support/facilitate the transformation to Circular Economy was presented by Pagoropoulos et al. The study, however, was oriented towards ICT techniques and data scopes—digital technologies—and was not oriented towards organizational and systemic issues [35].
The research presented above concerned important but limited aspects of the company’s operations, the product life stage, information technology, and cooperation with the business environment.
This paper concerns assessing the possibilities and the degree of use of the standard set of function domains available in the average PLM system to support the CE approach in product manufacturing processes. The research aims to identify the most efficient functionalities of PLM class solutions from the point of view of a production company and those that are part of the CE concept. The identified function domains and components will be assessed using an interrelationship matrix, creating the most efficient combinations from the company’s point of view. As a result, a solution will be proposed that fully exploits the potential of the PLM system and at the same time offers the highest CE-compliant solutions for the enterprise.

4. Research and Results

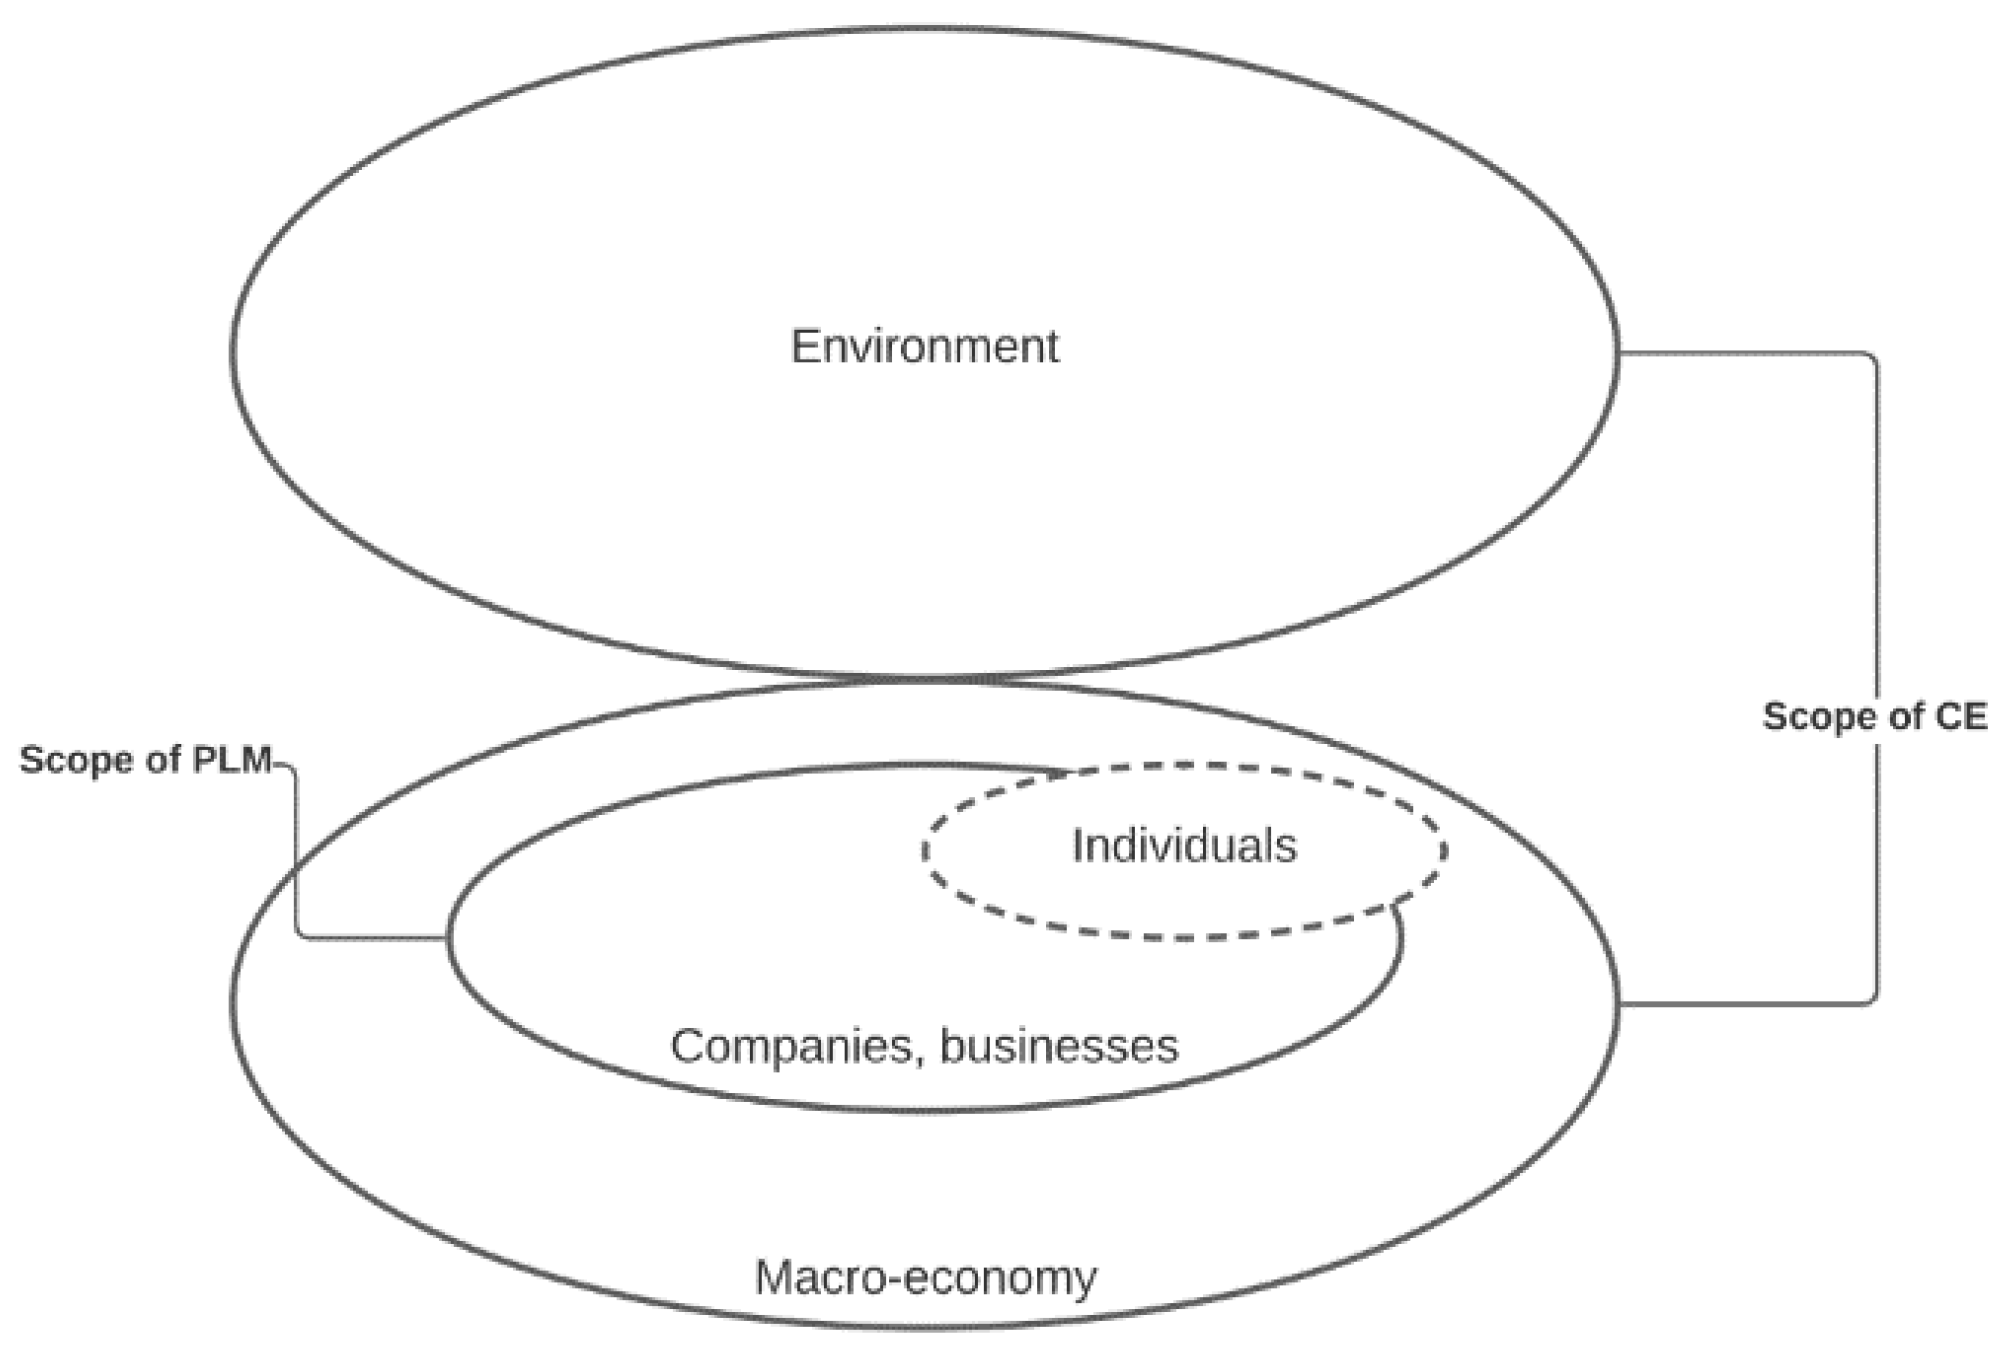
4.1. Recognition of the Boundaries of the Impact of Both Concepts and Their Interdependencies

Microeconomics is the economy of individuals, households, and firms and their behavior in making decisions and allocating resources. Macroeconomics is the economy as a whole, usually at the national level managed by the government to achieve specific outcomes based on indicators such as national income, total employment, or demand and supply [39,40]. Macroeconomics is broad in scope and includes microeconomics, which is represented by individuals, firms, and enterprises in this study. The scope of the environment remains independent of macroeconomics. However, it should be noted that a whole range of activities, phenomena, and events can cause interactions and influences between them.
As mentioned above, the PLM’s scope is five phases of the product lifecycle within the company’s business boundary. In comparison, the scope of Circular Economy covers two leading border circles of the environment and macroeconomics. In the area of macroeconomics, we can locate a subset of companies and businesses—Figure 3.
The scope of the Circular Economy concept also includes individuals, which is not presented in Figure 3. The individuals/people are a subset of companies and businesses but may also belong outside of the companies’ subset within the macroeconomy.
The aims of both concepts focus on the benefits within their boundaries. The scope of the Circular Economy covers four domains: macroeconomy, environment, business, and individual; hence, its boundary is considerably wider. The PLM concept focuses entirely on the business area, so at this stage of comparison, we could conclude that the PLM concept has fewer objectives than the Circular Economy concept. The scope of CE is much larger than PLM, but the impact of these concepts on various aspects of our lives and the world around us is not fully understood. Although PLM is mainly used in the business domain, its effects are undoubtedly positive or negative for other domains, such as the environment, people, and the economy.

4.2. Assessment of the Impact of PLM and CE on Business, Environment, Individual Domains

The first step of the research was a literature review to compare the impact of selected functionalities or components, both PLM and CE, on three domains: environment, business, and individual. The impact on the macroeconomy has been omitted because research is limited to only manufacturing processes in the manufacturing sector.

4.2.1. Assessment of the Value of Selected PLM Functionalities in the Analyzed Domains

PLM Value for Business Domain

It has been proven in many publications that the PLM system is necessary for a manufacturing company, and its functions mostly bring benefits to businesses and individuals. However, the question is, how positive are the effects? This paper decided that the benefits of PLM functionalities for enterprises will be assessed using a qualitative method. According to the authors of these publications, it was achieved by analyzing the content of selected publications and articles to identify the most significant benefits of PLM solutions, according to the authors of these publications—Table 1. In order to search for literature sources, the keyword “PLM benefits” was used in an open internet search engine. The selection of publications was based primarily on the current professional experience of their authors in the practical implementation, launch, and support of PLM solutions in manufacturing enterprises. Gained in this way, up-to-date users’ experience and opinions are the first and raw source of knowledge about PLM solutions’ characteristics.
Recurring or similar benefits were selected in these sources to reduce uncertainty and increase objectivity in arranging the leading indicators for assessing the positive impact of the PLM function on the business. Benefits with a repeatability rate of over 60% were selected.
Then value/impact level of PLM functionality for the Business domain was assessed based on nine selected indicators—benefit categories to businesses—Table 2.

PLM Value for Environment Domain

The impact of PLM on the Environment is not significant enough to obtain a concrete assessment. There is a lack of research in measuring leads to subjective judgment and difficulty in generating analyzing indicators [47]. Therefore the range of PLM benefits for the Environment has been set from −1 to 1, which means negative, neutral, or positive impact (Table 3).

PLM Value for Individuals Domain

For individuals, indicators were selected that relate to improving the efficiency of the everyday work of engineers in manufacturing companies using the PLM system. Only part of the engineers’ working time is used for creative work: planning and designing. About 30% of the time is spent acquiring, disseminating, and maintaining information; 20% redoing things that have already been done once; and 14% meeting to provide information to other sectors [41] (Figure 4).
According to the industry experience of PDXpert [48], the potential benefits of PLM software can be measured by five indicators. The first one is increasing employee data search and collaboration efficiency up to 25%, and the initial investment is around 3%. Reducing the processing of engineering changes can save up to 50% by only 5% initial investment. Up to 56% of development employees’ time is saved by increased part reuse and avoiding duplicate parts by 5% investment. The last benefit is preventing lost, misplaced, or unapproved documentation and records, saving up to 20% of the development employees’ time by 2% investment.
Table 4 shows the value/impact of PLM functionality for individuals. The potential improvement in labor productivity resulting from PLM use is multiplied by the engineer’s time utilization rate for specific operations.
Based on the above data analysis and research, it is possible to determine the impact factor and, at the same time, the values of selected PLM functionalities for the three main domains. A summary is presented in the table below (Table 5).

4.2.2. Assessment of the Value of Selected Components of CE Concept in the Analyzed Domains

In general, all of the CE components bring positive effects on three domains. It leads to the question: “How much positive are the components?”. Data from the Statistics of the European Union were used to answer this question. Each component was evaluated, and then the individual component values for the manufacturing company were compared.

CE Benefits for Environment Domain

Circular value chain: Focusing on the biological circle, renewable materials are the heart of this component. At least 11% of the currently used, reused, composted, or recycled materials are renewable.
Estimation of the improvement rate was done based on the analysis of the possibility of reducing derivative products of the manufacturing process, such as fossil energy materials/carriers and biomass, which are not directly related to the design of the new product. The annual potential positive impact (PPI) of the circular value chain was calculated based on the following formula:
P P I = i = 1 2 A E × T R E i + i = 1 2 A W × T R W i   A R × i = 1 2 T R R i
where AE—Annual Emission to air; AW—Annual Waste (solid, liquid); AR—Annual Recycling; TREi—material type rate for emission; TRWi—material type rate for waste; TRRi—material type rate for recycling; i—materials types: 1—fossil energy materials/carriers, 2—biomass. Data based on Figure 5. In TRE1, this ratio was reduced to 30%, corresponding to the annual natural gas production share in the category of fossil energy materials in Table 6.
Based on the above calculations, it was concluded that the potential positive impact (PPI) of the circular value chain on an annual basis means reducing 2266 million tons of waste.
Recovery and collection, including industrial symbiosis: This component focuses on process materials that could be brought back to manufacturing in upcycling, recycling, and downcycling processes but cannot be biodegradable. Both non-metallic minerals and metal ores are recyclable. The calculation is as follows:
P P I = i = 1 2 A W × T R W i   A R × i = 1 2 T R R i
where AW—Annual Waste (solid, liquid); AR—Annual Recycling; TRWi—material type rate for waste; TRRi—material type rate for recycling; i—materials types: 1—non-metallic minerals, 2—metal ores. Data based on Figure 5
Applying this component, the potential positive impact (PPI) is 882 million tons of waste reduction.
Durability, modularity with repair services: This component focuses on maintaining and improving products through repairs, upgrades, refurbishment, remanufacturing, or remarketing. The target is the products at EOL that are before the disposal stage. This component prolongs a product’s life and gives effects in the short term, but the amount of waste is more or less the same in a broad view. Moreover, with the fast development of technology, new products could consume less energy or be designed with more environmentally friendly materials. Keeping old products rotating in the system does not obviously reduce waste to the environment or raw materials utilization. The positive impact of this component is ambiguous due to only a slight reduction of waste to the environment.
Personalization, made to order and support: This function affects the BOL by supporting customers, producing enough upon demand. Through personalization, modularity, and design for reuse, the amount of raw material used can be reduced by 16% [50], which means that the amount of raw material introduced into the system and thus the amount of lost raw material can be reduced by precisely this value. According to Figure 5, this component aims to reduce the input raw material by about 1280 million tons and raw material lost (products and losses and discard of societal stock) by about 256 million tons:
Reduction   of   input   raw   material :   8000 × 0.16 = 1280   million   tons
Reduction   of   input   raw   material :   ( 700 + 900 ) × 0.16 = 256   million   tons
The potential positive impact (PPI) is a 1536 million ton reduction of wastes.
Product service system and dematerialized services: Shifting to a performance economy, businesses encourage consumers to buy the benefits instead of possessing the products. This action reduces overproduction and dematerializes services. Companies can easily recall products during the EOL phase and then upgrade, repair, disassemble, and remanufacture. Metal ores, non-metallic minerals, and fossil energy materials/carriers are recyclable, and companies could use this feature to increase recycling. The waste of these two materials each year is roughly 1386 million tons. The calculation is as follows:
2200 × ( 0.42 + 0.15 + 0.06 ) = 1386   million   tons
The recycling rate is 426 million tons. The calculation is as follows:
600 × ( 0.45 + 0.17 + 0.09 ) = 426   million   tons
The full potential for waste reduction benefits for this component is approximately 960 million tonnes each year. The calculations are as follows:
PPI = 1386 426 = 960   million   tons
Collaborative/sharing economy: this function maximizes return on surplus and idle assets by creating relationships and business opportunities for consumers, companies, and micro-entrepreneurs to rent, share, swap, or lend their idle goods. Research suggests that, on average, 5% [51] of a manufacturing company’s global asset base is idle, meaning it could be shared. By analyzing the automotive industry itself, more promising data can be obtained. In Europe, the utilization of cars is 8% [52]. There is a high potential for the reduction of input materials for production in the automotive sector. With the advancement of the sharing economy, one shared car could replace around three to eight personal cars until 2021 [53]. Ideally, the reduction of personal cars due to shared cars could be between 66% and 87.5%. If only the lower figure is taken into account, the reduction in the car fleet could be up to 66%. This industry uses one-sixth of the world’s metal resources, one-quarter of non-metallic minerals, and half of all fossil fuel materials [54]. Considering both forecasts, we can assume that the average reduction in metal consumption due to the Sharing Economy can be 15%. For non-metallic minerals and fossil fuels, an average 20% and 35% reduction can be achieved.
According to Figure 5, we could extract the number of materials by taking total material input minus the material going to waste. The amount of recycled material is re-entered into production and is therefore considered to be floating material on the market. The calculation is as follows:
metal   ores :   0.15 × [ ( 1500 × 0.14 ) + ( 5800 × 0.03 ) ( 1500 × 0.15 ) ] = 23.85   million   tons
non - metallic   minerals :   0.20 × [ ( 1500 × 0.05 ) + ( 5800 × 0.53 ) ( 1500 × 0.42 ) ] = 503.8   million   tons
fossil   fuel   materials :   0.35 × [ ( 1500 × 0.69 ) + ( 5800 × 0.12 ) ( 1500 × 0.06 ) ] = 574.35   million   tons
The total amount of materials that can be reduced within this functionality is 1102 million tons.

CE Benefits for Business Domain
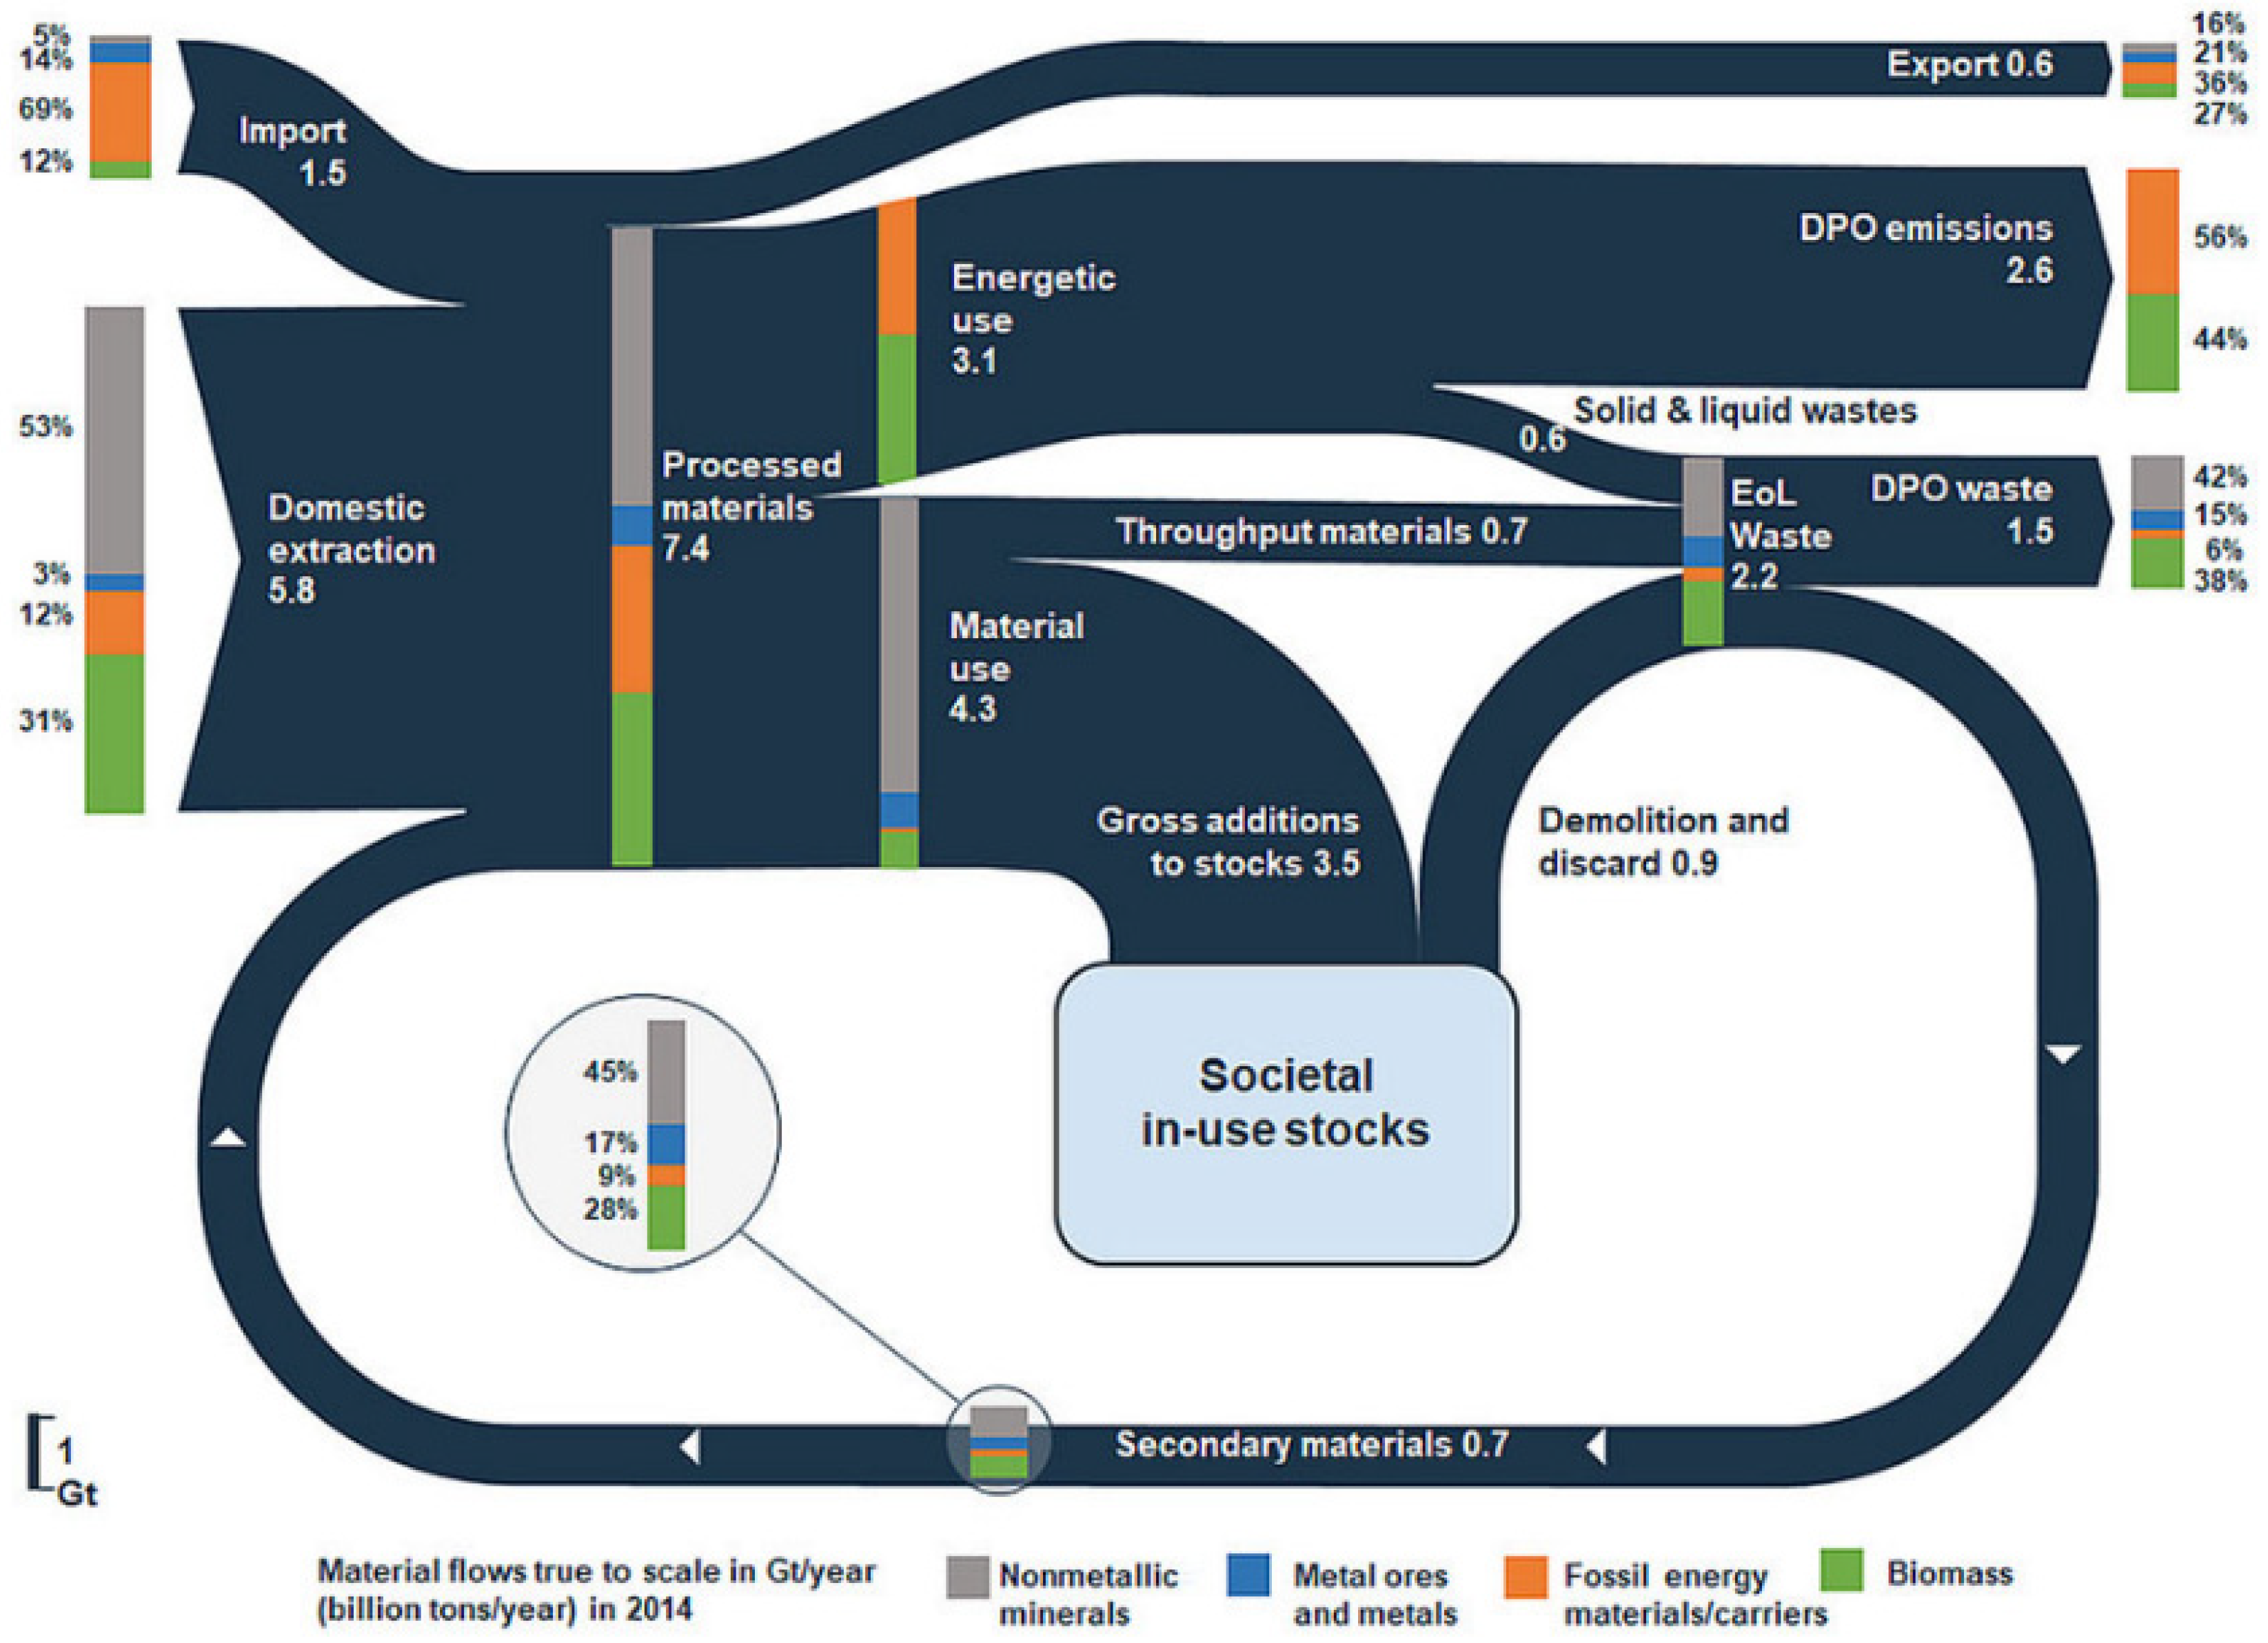
By applying CE components, companies can profit from recycling materials available at a lower cost and also through new services. The method used to evaluate profit opportunities is to find the price gap between primary raw material and recycled secondary, renewable material. The research is carried on the statistics of Europe in the period from 2015 to 2016.
In Table 7, raw materials are defined in four categories: non-metallic minerals, metal ores, fossil energy materials, and biomass.
In the case of non-metallic minerals, secondary materials return to the circle after demolition. They are used in down-cycling processes or secondary materials that are unnecessary after processing the primary raw materials. As for metal ores, recyclable materials are collected from waste, or secondary material is obtained after processing; the recyclability is high with lower purity than primary raw materials. Fossil energy materials are burned for energy storage or downstream processes. Most often, biomass is composted to obtain renewable natural gas (RNG), which is mixed with natural gas.
Circular value chain: Businesses could benefit from alternative energy sources, for example, RNG. The solid, liquid, and biomass waste, as well as fossil energy carrier emissions, could be exploited. The potential profit of this function to businesses is calculated by taking the summation of the price gap of fossil energy materials waste, biomass waste, fossil energy carrier emission, and biomass emissions.
The biomass waste and biomass emission are calculated as follows; note that recirculating to input is subtracted. All the below data are based on Figure 5 and Table 7.
The annual potential profit opportunity (PPO) of the circular value chain was calculated based on the following formula:
  • for biomass waste:
P P O = ( A E × T R E i + A W × T R W i   ) × ( R × P R i ) = EUR   412 , 657   million
where AE—Annual Emission to air; AW—Annual Waste (solid, liquid); TREi—material type rate for emission; TRWi—material type rate for waste; PRi—recycled material price; i—materials types: biomass; The overall efficiency of biomass-based plants for industry or district heating ranges from 70% to 90% [79]; for calculation, it was assumed R = 0.7.
  • for fossil energy material waste:
P P O = ( A E × T R E i × R g a s × P G g a s ) + ( A W × T R W i   ) × j = 1 n ( i ) ( R j × P G j ) = EUR   67 , 573.87   million  
where Rj—ratio; PGj—price gap; i—materials types: fossil energy materials/carriers; n(i)—raw materials in type/category: fossil energy materials: 1—coal, 2—Oil.
The total annual protentional profit opportunity of this component is EUR 484,816.65 million.
Recovery and collection, including industrial symbiosis: The profit opportunities of this feature are derived from the price gap in the event of increasing the amount of recycling. The calculations used non-metallic minerals and largely recyclable metal ores. The calculations were made based on the following formula:
P P P O = i = 1 2 ( ( A W × T R W i   ) ×   j = 1 n ( i ) ( R j × P G j ) ) = E U R   119 , 057.98   million  
where Rj—ratio; PGj—price gap; i—row materials types: 1—non-metallic minerals, 2—metal ores; n(i)—raw materials in type/category: non-metallic minerals, metal ores.
The annual potential profit opportunity of this component is EUR 119,057.98 million.
Durability, modularity with repair services: Businesses could benefit from this function by providing additional services to give consumers options for their EOL products. These services tackle the medium to long life span products, so the materials taken into account are non-metallic minerals, metal ores, and fossil energy materials. Assuming that 40% of waste will be processed [52], profit opportunities are calculated as follows:
P P O = 0.4 × i = 1 4 ( ( A W × T R W i   ) ×   j = 1 n ( i ) ( R j × P G j ) ) = E U R   47 , 623.19   million  
where Rj—ratio; PGj—price gap; i—row materials types: 1—non-metallic minerals, 2—metal ores; n(i)—raw materials in type/category: non-metallic minerals, metal ores.
The profit from the waste of fossil energy material (e.g., from plastic elements made from oil and coal) is evaluated as follows:
P P O = 0.4 × ( A W × T R W i   ) × j = 1 n ( R j × P G j ) = EUR   2334.63   million
where Rj—ratio; PGj—price gap; i—materials types: fossil energy materials/carriers; n(i)—raw materials in type/category: fossil energy materials: 1—coal, 2—oil.
The total annual protentional profit opportunity of this component is EUR 49,957.82 million.
Personalization, made to order and support: The benefit of this CE component for companies is inventory reduction. Inventories are unsold products consisting of storage costs, raw material, energy for production, labor, and real estate. The materials used are short, medium, and long-life materials such as non-metallic minerals, metal ores, fossil energy materials, and biomass. Through personalization, modularity, and design for reuse, the amount of raw material used can be reduced by 16% [50], which means that the amount of raw material entering the system can be reduced by precisely this value. Profit opportunities are obtained in MOL products and calculated as follows:
P P O = 0.16 × i = 1 4 ( ( A I × T R I i + A D E × T R I i ) ×   j = 1 n ( i ) ( R j × P j ) ) = E U R   635 , 710.7   million  
where AE—Annual Imports; ADE—Annual Domestic Extraction; TRIi—material type rate for imports; TRDi—material type rate for domestic extraction; Rj—ratio; Pj—material price; i—row materials types: 1—non-metallic minerals, 2—metal ores, 3—fossil energy materials/carriers, 4—biomass; n(i)—raw materials in type/category: non-metallic minerals, metal ores, fossil energy materials/carriers, biomass.
The total annual protentional profit opportunity of this component is EUR 635,710.7 million.
Product service system and dematerialized services: By prolonging the product lifetime and providing incentives for more intensive product use, the reuse of parts, and decoupling value from the delivered physical product, businesses benefit from the use of the raw material of both MOL and EOL of products. As a result, PPS can bring a measurable benefit of 22.5% on average [80]. Materials to be tackled are non-metallic minerals, metal ores, and fossil energy materials and are evaluated as follows:
P P P O = 0.225 × i = 1 3 ( ( A I × T R I i + A D E × T R I i ) ×   j = 1 n ( i ) ( R j × P j ) ) = E U R   175 , 637.18   million  
where AE—Annual Imports; ADE—Annual Domestic Extraction; TRIi—material type rate for imports; TRDi—material type rate for domestic extraction; Rj—ratio; Pj—material price; i—row materials types: 1—non-metallic minerals, 2—metal ores, 3—fossil energy materials/carriers; n(i)—raw materials in type/category: non-metallic minerals, metal ores, fossil energy materials/carriers.
The total annual protentional profit opportunity of this component is EUR 175,637.18 million.
Collaborative/sharing economy: Businesses could benefit from the reduction in the investment of equipment. Access to shared infrastructure and better use of unused equipment can reduce the materials required to produce them. The value of this savings was calculated based on the data obtained in the Environment section and Table 7 according to the following formulas:
  • Metal ores:
The possible amount of reduction is 23.85 million tons
P P O = 23.85 × j = 1 n ( i ) ( R j × P j ) = E U R   15 , 935.04   million  
  • Non-metallic minerals:
The possible amount of reduction is 503.8 million tons
P P O = 503.8 × j = 1 n ( i ) ( R j × P j ) = E U R   38 , 843.08   million  
  • Fossil fuel materials:
The possible amount of reduction is 574.35 million tons
P P O = 574.35 × j = 1 n ( i ) ( R j × P j ) = E U R   120 , 291.29   million
where Rj—ratio; Pj—material price; i—row materials types: 1—metal ores; n(i)—raw materials in type/category: metal ores. Data based on Table 7.
The annual profit opportunity of this action is as follows.
15 , 935.04 + 38 , 843.08 + 120 , 291.29 = E U R   175 , 069.41   million  
Potential profit opporturnity for business domain is summerized in Table 8.

CE Benefits for Individuals

A Circular Economy helps the individual increase disposable income, increase utility, reduce obsolescence, and improve health. Disposable income can be used to quantify the potential benefits of each component. One method of estimating the potential disposable income benefits is to consider reducing annual cash-out costs per household. Figure 6 shows the cost reduction potential in Europe based on the ReSOLVE framework, which is one of the leading tools for the implementation of the CE concept and at the same time is also one of the best described and documented, making it a valuable source of data.
In order to assess the benefits for individuals of implementing the CE concept, the estimated potential for cost reduction in three main spheres of everyday life (mobility, food, built environment) was used.
A circular mobility system would offer more choice and be shared, electrified, autonomous, multimodal, and looped. These changes would result in better use of cars, less congestion, and less air pollution. Food products are designed to be healthy and high quality in a Circular Economy, from production to nutrition. Organic resources derived from food by-products are uncontaminated and can safely fertilize the soil as organic fertilizers. Some of these by-products can provide added value by developing new food products or as a source of bioenergy [81]. An environment built based on the CE would reclaim downtown areas unlocked by the circular mobility system to create high-quality spaces where people could live, work, and play. A green infrastructure with a sustainable mixed-use building would be integrated modularly and built of looped and non-toxic materials.
The framework comprises six business actions: regenerate, share, optimize, loop, virtualize, and exchange. For consistency of the benefits assessment, these actions were converted with some accuracy to the CE components previously defined in this study [82] as follows:
  • Regenerate: The action aims at using renewable energy and materials; reclaim, retain, and regenerate the health of ecosystems and return recovered biological resources to the biosphere. The circular value chain is equivalent to this action.
  • Loop: Components and materials are stored in closed loops with priority in inner loops. In the case of finite materials, this action means remanufacturing products or components and ultimately recycling the material. Recovery and collection are equivalent to this action.
  • Share: Product loop speed is kept low, and users share products to maximize utilization. The collaboration, sharing economy are equivalent to this action. This action also includes reusing products throughout their technical lifetime and extending their life through maintenance, repair, and design for durability. This action is equivalent to durability qne modularity with repair services’ CE component.
  • Optimize: The action aims at increasing performance/efficiency of products, remove waste in production; leverage big data, automation, remote sensing, and steering. Personalization, made to order, and customer support are equivalent to this action.
  • Virtualize: Utilities such as books or music, online shopping, fleets of autonomous vehicles, and virtual offices are delivered virtually. This action is equivalent to the product–service system and dematerialized services’ CE component.
  • Exchange: The action aims to replace old materials with advanced non-renewable materials, apply new technologies, and choose new products and services. It is not equivalent to any CE functions in the research, so it is not considered.
The sum of the cost reduction potentials in all three categories for 2050 determines the impact factor of the CE function (Table 9).
Based on the above data analysis and studies (Table 6, Table 8 and Table 9), the impact factor of CE components and benefits for three main domains of CE can be defined. This summary is demonstrated in Table 10.

4.3. Determination of PLM Functionalities and Their Impact and Relationship with CE Components to Effectively Support Manufacturing Processes and Bring the Most Significant Benefits in All Areas

The goal of the next step was to select PLM function domains and their combination with CE components that bring the best outcomes for the three domains: environment, business, and individual. A qualitative and quantitative methodology was developed to evaluate the effectiveness of the functionalities combination of both concepts (PLM and CE) using an inter-relation function matrix.
The obtained results estimated the total degree of influence of individual functionalities on three domains. These domains represent the boundaries of the CE concept without macroeconomics. The analysis showed the degree of influence of selected PLM functionalities and CE components on these domains. The sum of these scores makes it possible to determine their overall impact on the Circular Economy, as shown in Table 11.
The obtained values were used to find combinations of PLM functions and CE components that offer the most significant benefit to the manufacturing company. The inter-relation matrix presents two dimensions: PLM functionality and CE components and their impact on CE—Table 12. The intersection of the individual dimension values—matrix element represents the expected benefit ratio value achievable by implementing the appropriate functionalities and components.
The analysis showed that the implemented and operating PLM system in a manufacturing company naturally and to the greatest extent supports two components of the CE concept, namely: “Personalization, made to order, and support” and “Circular value chain”.
On the PLM functionality level, the matrix analysis shows that for a manufacturing company with implemented PLM solutions, there are two PLM functionalities, “Product development” and “Transparency”, that, in combination with the CE component “Personalization, make to order, and support”, can offer the most significant benefits for the firm in all domains. A slightly lower rate is achievable using the PLM functionality of “Maximizing value” of a product over its lifecycle and with the same CE component.
In the scope of qualitative and quantitative methods in this research, it was assessed that the above implementation of CE component “personalization, made to order, and support” brings the highest benefits when combined with three selected PLM functionalities across the environment, businesses, and individuals domains. In PLM’s transparency functionality, customers are supported by the traceability of products, legalizations, expired dates, related data, and maintenance procedures. This functionality strengthens the trust in B2C and B2B business contacts and improves the customer relations of businesses and the potential profits. Reducing the time-to-market, increasing product variety, and customizing the product to user requirements are achieved through the product development functionality while maximizing value helps companies introduce low-cost ways to extend the lifecycle (EOL) of revenue-generating products while ensuring resource recovery and environmental protection.
It should be noticed that other PLM functionalities can bring significant benefits in the implementation process and cooperation within the CE concept. These functions show considerably high benefits, especially in combination with CE personalization, made to order, and support component. A good example is PLM’s collaboration functionality, which emphasizes the design chain and supply chain connection to manage Intellectual Property and maximize product and knowledge reuse. It also can influences the ecological aspect through, e.g., limiting travel through better use of communication methods and teleworking.

5. Conclusions

In the present study, the authors selected and assessed the functionalities, components, and objectives of both PLM and CE concepts and their benefits. Based on these results, the process of identifying and assessing the degree of their compatibility and their limitations were carried out, which allowed proposing (based on the interrelation matrix) the optimal combination of PLM functional domains to facilitate CE implantation.
This study confirmed that the PLM approach and systems could support the product manufacturing process according to the Circular Economic concept. There are PLM functions that, when combined with CE functions, provide the most significant benefits for the environment, business, and individual domains. This is mainly because the scope of Circular Economy is much larger than PLM. In other words, the scope of the PLM concept is a subset of the scope of the Circular Economy concept.
The conducted study proved that the implemented and properly working PLM solution could simultaneously support CE concepts. The selected main functionalities offered by PLM class systems can be used to maintain the CE concept in the enterprise. Functionalities such as product development, transparency, and value-maximizing turned out to be particularly effective. These functions offer the most significant support for CE in the functional area: personalization, made in order, support. They are almost as effective in supporting other CE components, particularly evident in the circular value chain component.
In addition, functions and benefits of PLM and CE can support the same actors/domains, and therefore they can also support each other’s implementations. Although PLM is used mainly in businesses, its effects are positive or negative to other aspects such as the environment, people, and the economy. We could also see that both concepts have similar aims to increasing the profit of companies and businesses. It would be the bridge that puts two concepts in cooperation in practice.
The use of Product Lifecycle Management systems in the process of implementation of the Circular Economy concept will eliminate many barriers to the spread of this idea. The most severe barriers that are eliminated in this way include the lack of knowledge and concepts for Circular Economy implementation in the enterprise, especially in SMEs; the fear of lack of competence of employees who would have to obtain new knowledge and skills; reducing financial costs by using the existing IT solutions; the lack of databases and knowledge about the product at the stages of its life; and the lack of cooperation and information exchange in the supply chain both at the initial stages of product life and at the final ones.
Confirming the concept of using Product Lifecycle Management class solutions in the process of the implementation and maintenance of the Circular Economy concept in manufacturing enterprises will allow for changing the approach to planning the process of implementation of this concept both in the organizational, financial, and technical areas. Another implication of this research is the possibility of using Product Lifecycle Management systems to assess the readiness of an enterprise, especially SMEs, to implement a Circular Economy.
In assessing the impact of individual PLM functionalities and CE components on each other, numerical data were used, mainly concerning the impact of both concepts on the environment in the possibility of recovering the introduced raw materials and generated waste and losses. The authors also see the possibility of using other indicators to assess the impacts, e.g., those based on energy efficiency.
It should be noted that the concept of implementing CE using PLM functionality also has its weaknesses. As a result of their use, the proposed approach cannot be universally applied. This is related to the widespread use and scope of PLM systems in manufacturing companies.
Analyses show that PLM systems are used in large enterprises with an established IT culture [83]. Small and medium-sized enterprises relatively rarely use these systems because their use requires some organizational and technological effort. In addition, they often cooperate in the supply chain as subcontractors, and they do not have their new product development phase—they work with provided documentation.
Another limitation of the presented concept may be the functional scope of the implemented PLM solutions. The vast majority of such implementations are limited to the area of new product development (PDM), not covering all stages of the product lifecycle [84]. In the presented concept, a significant role is played by activities in the area of cooperation in a distributed production company and a distributed supply chain and those related to the support of products and processes during the last phases of the product’s EOL. In most implementations, there is a lack of appropriate functionality to support the activities mentioned above, making it impossible to close the product life loop with the CE concept.
The presented research, containing the assessment of individual elements of the CE concept, was mainly based on assessing the impact of its components on the consumption of raw natural resources, generation, and recovery of waste and emitted gases. The choice of these indicators resulted from the concept of assessing selected boundary values, i.e., components entering and leaving the ecosystem. This assumption, which is also a limitation, can be expanded by using other indicators related to social or technological changes related to CE in the evaluation process, e.g., Sharing Economy or machines and energy efficiency.
Nevertheless, despite some limitations of the presented concept, it should be stated that the well-known and well-documented PLM solution can be used to improve the CE implementation process by reducing the risk of the entire project and speeding up the achievement of the assumed results. Moreover, it can be a perfect element of the strategy of sustaining CE in the company.
Future research studies may investigate the extent to which PLM can support the CE implementation process in a manufacturing company and what changes or modifications to existing PLM functionalities should be introduced to support the CE concept. An interesting development of the presented approach could be the extension of the indicators used with others related to social or technological changes related to CE, e.g., Sharing Economy or machines and energy efficiency. Another research topic may be assessing the effectiveness of the CE implementation process based on the analysis of the impact of organizational capabilities imposed by PLM solutions in all lifecycles on the identification of synergies and opportunities for cooperation and building alliances for the Circular Economy.

Author Contributions

Conceptualization, M.C. and L.H.B.M.; methodology, L.H.B.M.; validation, M.C. and L.H.B.M.; formal analysis, M.C.; investigation, M.C. and L.H.B.M.; resources, M.C. and L.H.B.M.; data curation, M.C.; writing—original draft preparation, M.C. and L.H.B.M.; writing—review and editing, M.C.; supervision, M.C.; funding acquisition, M.C. Both authors have read and agreed to the published version of the manuscript.

Funding

This research received no external funding.

Institutional Review Board Statement

Not applicable.

Informed Consent Statement

Not applicable.

Data Availability Statement

The data presented in this study are available on request from the corresponding author. All data sources have been indicated.

Conflicts of Interest

The authors declare no conflict of interest.

References

  1. European Commission. Circular Economy Action Plan; European Commission: Brussels, Belgium, 2020; 28p. [Google Scholar] [CrossRef]
  2. Alhawari, O.; Awan, U.; Bhutta, M.K.S.; Ülkü, M.A. Insights from Circular Economy literature: A review of extant definitions and unravelling paths to future research. Sustainability 2021, 13, 859. [Google Scholar] [CrossRef]
  3. Acerbi, F.; Sassanelli, C.; Terzi, S.; Taisch, M. A systematic literature review on data and information required for circular manufacturing strategies adoption. Sustainability 2021, 13, 2047. [Google Scholar] [CrossRef]
  4. Jensen, J.P.; Remmen, A. Enabling Circular Economy Through Product Stewardship. Procedia Manuf. 2017, 8, 377–384. [Google Scholar] [CrossRef]
  5. Mestre, A.; Cooper, T. Circular product design. A multiple loops life cycle design approach for the Circular Economy. Des. J. 2017, 20, S1620–S1635. [Google Scholar] [CrossRef] [Green Version]
  6. Urbinati, A.; Chiaroni, D.; Chiesa, V. Towards a new taxonomy of Circular Economy business models. J. Clean. Prod. 2017, 168, 487–498. [Google Scholar] [CrossRef]
  7. Peña, C.; Civit, B.; Schmid, A.G.; Druckman, A.; Pires, A.C.; Weidema, B.; Mieras, E.; Wang, F.; Fava, J.; Milà i Canals, L.; et al. Using life cycle assessment to achieve a Circular Economy. Int. J. Life Cycle Assess. 2021, 26, 215–220. [Google Scholar] [CrossRef]
  8. Antonio, M.; Pinheiro, P.; Michel, B.; Pais, R.; Fiorini, P.D.C.; Jugend, D. The role of new product development in underpinning the Circular Economy integrative framework. Manag. Decis. 2019, 57, 840–862. [Google Scholar] [CrossRef]
  9. O’Rourke, D.; Connelly, L.; Koshland, C.P. Industrial ecology: A critical review. Int. J. Environ. Pollut. 1996, 6, 89–112. [Google Scholar] [CrossRef]
  10. Ayres, R.; Ayres, L. A Handbook of Industrial Ecology; Edward Elgar Pub: Cheltenham, UK; Northampton, MA, USA, 2002. [Google Scholar]
  11. Stahel, W.R.; MacArthur, E. The Circular Economy: A User’s Guide; Routledge: London, UK, 2019. [Google Scholar] [CrossRef]
  12. Stahel, W.R. The Performance Economy: Business Models for the Functional Service Economy. In Handbook of Performability Engineering; Springer: London, UK, 2008; pp. 127–138. [Google Scholar] [CrossRef]
  13. UNDP; Sustainable Development Goals United Nations Development Programme. United Nations Development Programme. 2021. Available online: https://www.undp.org/sustainable-development-goals?utm_source=EN&utm_medium=GSR&utm_content=US_UNDP_PaidSearch_Brand_English&utm_campaign=CENTRAL&c_src=CENTRAL&c_src2=GSR&gclid=Cj0KCQjw4eaJBhDMARIsANhrQAAiI_TwU9q9QjFx6VN-3sdv9r-yZ9JtRn1Ylb2Cf3NYYof_32hS5S (accessed on 9 September 2021).
  14. Barreiro-Gen, M.; Lozano, R. How circular is the Circular Economy? Analysing the implementation of Circular Economy in organisations. Bus. Strateg. Environ. 2020, 29, 3484–3494. [Google Scholar] [CrossRef]
  15. Kalmykova, Y.; Sadagopan, M.; Rosado, L. Circular Economy—From review of theories and practices to development of implementation tools. Resour. Conserv. Recycl. 2018, 135, 190–201. [Google Scholar] [CrossRef]
  16. Charnley, F.; Tiwari, D.; Hutabarat, W.; Moreno, M.; Okorie, O.; Tiwari, A. Simulation to enable a data-driven Circular Economy. Sustainability 2019, 11, 3379. [Google Scholar] [CrossRef] [Green Version]
  17. Chauhan, C.; Sharma, A.; Singh, A. A SAP-LAP linkages framework for integrating Industry 4.0 and Circular Economy. Benchmarking 2019, 28, 1638–1664. [Google Scholar] [CrossRef]
  18. Antikainen, M.; Uusitalo, T.; Kivikytö-Reponen, P. Digitalisation as an Enabler of Circular Economy. Procedia CIRP 2018, 73, 45–49. [Google Scholar] [CrossRef]
  19. Bressanelli, G.; Adrodegari, F.; Perona, M.; Saccani, N. Exploring how usage-focused business models enable Circular Economy through digital technologies. Sustainability 2018, 10, 639. [Google Scholar] [CrossRef] [Green Version]
  20. Lieder, M.; Rashid, A. Towards Circular Economy implementation: A comprehensive review in context of manufacturing industry. J. Clean. Prod. 2016, 115, 36–51. [Google Scholar] [CrossRef]
  21. de Oliveira, S.F.; Soares, A.L. A PLM Vision for Circular Economy. In Proceedings of the Working Conference on Virtual Enterprises, Vicenza, Italy, 18–20 September 2017. [Google Scholar] [CrossRef] [Green Version]
  22. Popa, I.L.; Popa, N.V. PLM and eco-design of electronic products according with Circular Economy principles. Appl. Mech. Mater. 2014, 657, 1031–1035. [Google Scholar] [CrossRef]
  23. Velasquez, C.V.; Salehi, N.; Hallstedt, S.I. How Can Information and Communications Technology Support the Link Between Circular Economy and Product Life Cycle Management?—A Review. In Proceedings of the Design Society: DESIGN Conference; Cambridge University Press: Cambridge, UK, 2020; Volume 1, pp. 2187–2196. [Google Scholar] [CrossRef]
  24. Bey, N. Life Cycle Management; Springer: Cham, Switzerland, 2017. [Google Scholar] [CrossRef]
  25. Ultimate Product Life Cycle Management Guide Smartsheet. Available online: https://www.smartsheet.com/product-life-cycle-management (accessed on 8 July 2021).
  26. Gecevska, V.; Cus, F.; Lombardi, F.; Chiampo, F. Product Lifecycle Management Competitive Technology Solution; Faculty of Mechanical Engineering, University of Maribor: Maribor, Slovenia, 2019. [Google Scholar]
  27. Segal, T. Product Lifecycle Management (PLM) Definition. Investopedia 2019. Available online: https://www.investopedia.com/terms/p/product-life-cycle-management.asp (accessed on 12 August 2021).
  28. What is a Circular Economy? Ellen MacArthur Foundation. Available online: https://www.ellenmacarthurfoundation.org/circular-economy/concept (accessed on 8 July 2021).
  29. Velte, C.J.; Scheller, K.; Steinhilper, R. Circular Economy through Objectives—Development of a Proceeding to Understand and Shape a Circular Economy Using Value-focused Thinking. Procedia CIRP 2018, 69, 775–780. [Google Scholar] [CrossRef]
  30. Kumar, V.; Sezersan, I.; Garza-Reyes, J.A.; Gonzalez, E.D.R.S.; L-Shboul, M.A.A. Circular Economy in the manufacturing sector: Benefits, opportunities and barriers. Manag. Decis. 2019, 57, 1067–1086. [Google Scholar] [CrossRef] [Green Version]
  31. Brady, C. Six Simple Features of Circular Economy Business Models Explained. 2017. Available online: https://www.bioregional.com/six-features-circular-economy-business-models/ (accessed on 8 July 2021).
  32. Tura, N.; Hanski, J.; Ahola, T.; Ståhle, M.; Piiparinen, S.; Valkokari, P. Unlocking circular business: A framework of barriers and drivers. J. Clean. Prod. 2019, 212, 90–98. [Google Scholar] [CrossRef]
  33. Ritzén, S.; Sandström, G.Ö. Barriers to the Circular Economy—Integration of Perspectives and Domains. Procedia CIRP 2017, 64, 7–12. [Google Scholar] [CrossRef]
  34. Rizvi, S.W.H.; Agrawal, S.; Murtaza, Q. Circular Economy under the impact of IT tools: A content-based review. Int. J. Sustain. Eng. 2021, 14, 87–97. [Google Scholar] [CrossRef]
  35. Pagoropoulos, A.; Pigosso, D.C.A.; McAloone, T.C. The Emergent Role of Digital Technologies in the Circular Economy: A Review. Procedia CIRP 2017, 64, 19–24. [Google Scholar] [CrossRef] [Green Version]
  36. Shi, J.G.; Si, H.; Wu, G.; Su, Y.; Lan, J. Critical factors to achieve dockless bike-sharing sustainability in China: A stakeholder-oriented network perspective. Sustainability 2018, 10, 90. [Google Scholar] [CrossRef] [Green Version]
  37. Kalverkamp, M.; Pehlken, A.; Wuest, T. Cascade Use and the Management of Product Lifecycles. Sustainability 2017, 9, 1540. [Google Scholar] [CrossRef] [Green Version]
  38. Sakao, T.; Liu, Y.; Gustafsson, R.; Thörnblad, G. A Method for Lifecycle Design of Product/Service Systems Using PLM Software. In Proceedings of the IFIP International Conference on Product Lifecycle Management, Seville, Spain, 10–12 July 2017. [Google Scholar] [CrossRef] [Green Version]
  39. Dutta, S. Introductory Economics (Micro and Macro); New Age International Pvt. Ltd. Publishers: New Delhi, India, 2006. [Google Scholar]
  40. Tsai, F. An Overview on Macroeconomics: Ideas, Approaches and Importance. Int. J. Tax Econ. Manag. 2019, 2, 21–31. [Google Scholar] [CrossRef]
  41. Saaksvuori, A.; Immonen, A. Product Lifecycle Management; Springer: Berlin/Heidelberg, Germany, 2008. [Google Scholar]
  42. Stark, J. Product Lifecycle Management, 21st Century Paradigm for Product Realisation; Springer: London, UK, 2011. [Google Scholar]
  43. Restuccia, M.; de Brentani, U.; Legoux, R.; Ouellet, J.F. Product Life-Cycle Management and Distributor Contribution to New Product Development. J. Prod. Innov. Manag. 2016, 33, 69–89. [Google Scholar] [CrossRef] [Green Version]
  44. Re-Think Your PLM Consider a Modern Approach to Bringing Products to Market. Available online: https://www.propelplm.com/resources/rethink-your-plm (accessed on 13 August 2021).
  45. 7 PLM Business Benefits That Every Company Needs to Know. Available online: https://www.concurrent-engineering.co.uk/Blog/bid/89061/7-PLM-business-benefits-that-every-company-needs-to-know (accessed on 13 August 2021).
  46. Top 10 Benefits of a PLM Platform. Available online: https://www.designrule.co.uk/top-10-benefits-of-a-plm-platform (accessed on 13 August 2021).
  47. Vila, C.; Abellán-Nebot, J.V.; Albiñana, J.C.; Hernández, G. An Approach to Sustainable Product Lifecycle Management (Green PLM). Procedia Eng. 2015, 132, 585–592. [Google Scholar] [CrossRef] [Green Version]
  48. PDXpert PLM Software ROI Calculation. Available online: https://www.buyplm.com/general-info/pdxpert-plm-software-license-roi-calculation.aspx (accessed on 21 June 2021).
  49. Mayer, A.; Haas, W.; Wiedenhofer, D.; Krausmann, F.; Nuss, P.; Blengini, G.A. Measuring Progress towards a Circular Economy: A Monitoring Framework for Economy-wide Material Loop Closing in the EU28. J. Ind. Ecol. 2019, 23, 62–76. [Google Scholar] [CrossRef] [PubMed] [Green Version]
  50. Zhang, W.; Gu, F.; Guo, J. Can smart factories bring environmental benefits to their products?: A case study of household refrigerators. J. Ind. Ecol. 2019, 23, 1381–1395. [Google Scholar] [CrossRef]
  51. Maximum Return on Surplus and Idle Assets Chemanager. Available online: https://www.chemanager-online.com/en/topics/management/maximum-return-surplus-and-idle-assets (accessed on 21 June 2021).
  52. Macarthur, E. Growth within: A Circular Economy Vision for a Competitive Europe; Ellen MacArthur Foundation: Isle of Wight, UK, 2015; 97p. [Google Scholar]
  53. Skjelvik, J.M.; Erlandsen, A.M.; Haavardsholm, O. Environmental Impacts and Potential of the Sharing Economy; Nordic Council of Ministers: Rosendahls, Denmark, 2017. [Google Scholar]
  54. Saberi, B. The role of the automobile industry in the economy of developed countries. Int. Robot. Autom. J. 2018, 4, 179–180. [Google Scholar] [CrossRef] [Green Version]
  55. Commission, E. Critical raw materials Internal Market, Industry, Entrepreneurship and SMEs. Crit. Raw Mater. 2020. Available online: https://ec.europa.eu/growth/sectors/raw-materials/industries_en (accessed on 22 June 2021).
  56. Can Concrete Be Recycled? Recycling Concrete—The Concrete Network. Available online: https://www.concretenetwork.com/concrete/demolition/recycling_concrete.htm (accessed on 22 June 2021).
  57. Boulamanti, A.; Moya, J.A. Production costs of the non-ferrous metals in the EU and other countries: Copper and zinc. Resour. Policy 2016, 49, 112–118. [Google Scholar] [CrossRef]
  58. Scrapmonster. Copper Scrap Prices USA, UK, China, India, Current Scrap copper Price. 2021. Available online: https://www.scrapmonster.com/scrap-prices/category/Zinc-Scrap/148/1/1 (accessed on 22 June 2021).
  59. European Aluminium. Market Overview-Digital Activity Report 2018–2019—European Aluminium. 2019. Available online: https://www.european-aluminium.eu/activity-report-2018-2019/market-overview/ (accessed on 22 June 2021).
  60. Recycled vs. Virgin Aggregates Ozinga. Available online: http://ozinga.com/blog/recycled-vs-virgin-aggregates/ (accessed on 22 June 2021).
  61. Ceramics—Business Recycling. Available online: https://businessrecycling.com.au/recycle/ceramics (accessed on 22 June 2021).
  62. Egenhofer, C.; Schrefler, L. Final Report for a Study on Composition and Drivers of Energy Prices and Costs in Energy Intensive Industries: The Case of the Flat Glass Industry; Centre for European Policy Study: Brussels, Belgium, 2014; Available online: https://op.europa.eu/en/publication-detail/-/publication/b43ca37c-ae26-49f3-9341-7558a75d52da (accessed on 22 June 2021).
  63. Breaking down the Factors Behind Scrap Glass Prices Recycling Product News. Available online: https://www.recyclingproductnews.com/article/27088/breaking-down-the-factors-behind-scrap-glass-prices (accessed on 22 June 2021).
  64. Renda, A. Assessment of Cumulative Cost Impact for the Steel Industry. A Report for the European Commission; Centre for European Policy Study: Brussels, Belgium, 2013; Available online: https://op.europa.eu/en/publication-detail/-/publication/a2f56fcb-8d8d-4307-9a17-fcd1dea1fdec (accessed on 22 June 2021).
  65. iScrap Ap. National Scrap Metal Prices—Today’s Scrap Metal Prices. [Updated Daily]. Available online: https://iscrapapp.com/prices/ (accessed on 22 June 2021).
  66. Iron Ore Production_Clio Infra_Reconstructing Global Inequality. Available online: https://clio-infra.eu/Indicators/TinProduction.html (accessed on 22 June 2021).
  67. Scrap Metal Prices 2020 [Updated Daily]—Metalary. Available online: https://www.metalary.com/scrap-metal-prices/ (accessed on 22 June 2021).
  68. European Copper Institute. Europe’s Copper Industry—How Copper is Produced and Where It’s Used. 2018. Available online: https://copperalliance.eu/about-us/europes-copper-industry/ (accessed on 22 June 2021).
  69. Markets Business. Insider. Copper PRICE Today Copper Spot Price Chart Live Price of Copper Per kg Markets Insider. 2020. Available online: https://markets.businessinsider.com/commodities/copper-price (accessed on 22 June 2021).
  70. EOS/OES. Annual Report of the European Sawmill Industry 2018/2019. Available online: https://www.eos-oes.eu/downloads/EOS-annual-report-2018-2019.pdf (accessed on 22 June 2021).
  71. Euromines. Production by Mineral Euromines. 2019. Available online: http://www.euromines.org/mining-europe/production-mineral#Lead (accessed on 22 June 2021).
  72. World Bank. European Union Natural Gas Import Price. YCharts 2016. Available online: https://ycharts.com/indicators/europe_natural_gas_price (accessed on 22 June 2021).
  73. Fortis BC. Renewable Natural Gas Rates. 2021. Available online: https://www.fortisbc.com/services/sustainable-energy-options/renewable-natural-gas/renewable-natural-gas-rates (accessed on 22 June 2021).
  74. BP. Northwest Europe Coal Marker Price. Ycharts » Convindicators » Northwest » Europe » Coal » Market » Price, 2018. Available online: https://www.statista.com/statistics/383500/northwest-europe-coal-marker-price/ (accessed on 22 June 2021).
  75. Excavated Coal Ash Has 2nd Life as Recycled Product S&P Global Market Intelligence. Available online: https://www.spglobal.com/marketintelligence/en/news-insights/latest-news-headlines/52446894 (accessed on 22 June 2021).
  76. Oil History Markets Insider. Available online: https://markets.businessinsider.com/commodities/historical-prices/oil-price/eur/15.3.2016_15.4.2020?type=brent (accessed on 22 June 2021).
  77. Fortum Recycling & Waste Fortum. Available online: https://www.fortum.com/products-and-services/recycling-waste/fortum-recycling-waste (accessed on 22 June 2021).
  78. Eurostat. Agricultural Production—Livestock and Meat—Statistics Explained. Stat. Explain. 2018, 1–22. Available online: https://ec.europa.eu/eurostat/statistics-explained/index.php?title=Agricultural_production_-_livestock_and_meat#Meat_production (accessed on 22 June 2021).
  79. Brief, T. Biomass for Heat and Power; IEA-ETSAP; IRENA: Abu Dhabi, United Arab Emirates, 2015. [Google Scholar]
  80. Kaddoura, M.; Kambanou, M.L.; Tillman, A.M.; Sakao, T. Is prolonging the lifetime of passive durable products a low-hanging fruit of a Circular Economy? A multiple case study. Sustainability 2019, 11, 4819. [Google Scholar] [CrossRef] [Green Version]
  81. Laso, J.; Margallo, M.; Celaya, J.; Fullana-I-Palmer, P.; Bala, A.; Gazulla, C.; Irabien, A.; Aldaco, R. Waste management under a life cycle approach as a tool for a Circular Economy in the canned anchovy industry. Waste Manag. Res. 2016, 34, 724–733. [Google Scholar] [CrossRef] [PubMed]
  82. Mendoza, J.M.F.; Sharmina, M.; Gallego-Schmid, A.; Heyes, G.; Azapagic, A. Integrating Backcasting and Eco-Design for the Circular Economy: The BECE Framework. J. Ind. Ecol. 2017, 21, 526–544. [Google Scholar] [CrossRef] [Green Version]
  83. GVR. Product Lifecycle Management Market Size, Share & Trends Analysis Report By Software, By Service, By Deployment, By Enterprise Size, By End Use, By Region, and Segment Forecasts, 2020–2025. 2020. Available online: https://www.grandviewresearch.com/industry-analysis/product-lifecycle-management-market (accessed on 22 June 2021).
  84. CIMdata. 2017 Market Analysis Report Series PLM Market Industry Analysis Report. 2017, Volume 1. Available online: https://www.cimdata.com/en/news/item/8281-cimdata-publishes-executive-plm-market-report (accessed on 22 June 2021).
Figure 1. Research method.
Sustainability 13 10589 g001
Figure 2. Scope of Product Lifecycle Management—based on [25].
Sustainability 13 10589 g002
Figure 3. Comparison of scopes of PLM and CE.
Sustainability 13 10589 g003
Figure 4. The engineers’ use of time—based on [41].
Sustainability 13 10589 g004
Figure 5. Material flows in the the EU-28—source [49].
Sustainability 13 10589 g005
Figure 6. Cost reduction potential per household for 2050—source [52].
Sustainability 13 10589 g006
Table 1. Analysis of PLM benefits indicators for Businesses domain [24,25,26,41,42,43,44,45,46].
Saaksvuori [41]K ate Eby [25]Propel [44]Concurrent Engineering [45]Designrule [46]Similarity
Improve information securityReduce riskReduce riskReduce compliance riskReduce compliance risk100%
Reduce overlapping work Increase productivityIncrease productivityIncrease productivity80%
Reduce costCost managementDecrease costReduce cost80%
Less time to marketGet the product to market fasterReduce time to marketReduce time to marketReduce development cycle100%
Reduce tide-up capitalIncrease product revenueIncrease revenueAccelerate revenue 80%
Data available to everybodyProvide integrate viewData sharing Collaboration/integration80%
Centralization Single source of truth40%
Improve product qualityBring better products to marketBetter quality productEnhance product qualityEnhance product quality100%
Reduce customer complainsIncrease customer loyalty Improve customer loyalty60%
Scale-up business Business scalability40%
Increase innovation rate Drive innovationDrive innovation60%
Decrease product innovation costs 20%
Extend mature product life 20%
Retrieve information quicklyTraceability 40%
Table 2. Assessment of the value of PLM functionality for the Business domain.
PLM
Functionalities
Reduce RiskIncrease ProductivityReduce CostReduce Time to MarketIncrease RevenueData SharingEnhance Product QualityIncrease Customer LoyaltyDrive InnovationImpact (1–5)
Product development X X X X2
Collaboration XX 1
Reduced product-related costs X X 1
TransparencyXX XX 2
Customer support XX XX2
Maximizing valueX X X 2
Table 3. Assessment of the value of PLM functionality for the Environment domain.
PLM FunctionalityExplanationImpact (−1–1)
Product developmentIt could bring either negative or positive effects depending on the types of new raw materials. If the business invests more in researching renewable, recyclable, or biodegradable alternatives for raw materials, it will positively affect the environment. Conversely, if the business invents cheaper but more synthetic, non-biodegradable material, it would negatively impact the economy. 0
CollaborationCollaboration provides new greenways of communication and teleworking resulting in no travel, no physical meetings, and better reuse of know-how to incorporate all environmental aspects of a new product through the effective collaboration of all stakeholders throughout the product lifecycle [21].1
Reduced product-related costsThe analysis revealed a positive impact on businesses and individuals, but at the same time, a negative impact on the environment was found. Such an impact is because reduction product-related costs mean lower product prices or increasing add-in on product features. It means an increase in demand, more purchases, and more consumption of products, which usually generate additional waste after they have been consumed [6].−1
TransparencyFor the environment, this function does not bring any effect.0
Customer supportThis functionality has a positive effect, e.g., customers are supported during the use of the product, which extends its life; also, they can access knowledge on how to recover or reuse materials and properly dispose of products during EOL.1
Maximizing valueFor the environment, this function does not bring any effect.0
Table 4. Assessment of the value of PLM functionality for the Individuals domain.
PLM
Functionality
14% Eng. Timeshare for
Unnecessary
Meetings
21% Eng. Timeshare for Repeating Work24% Eng. Timeshare for Information
Retrieval and
Sharing
Overall Reduction of Employee Working Time (%)Impact (1–5)
Preventing Lost, Misplaced,
Unapproved
Documents:
20% Improvement
Engineering Change Process:
50% Improvement
Increased Part
Re-Use and
Avoiding the
Creation of
Duplicate Parts: 56% Improv.
Data Search and Collaboration Productivity:
25% Improvement
14 × 20% = 3%21 × 50% = 11%21 × 56% = 12%24 × 25% = 6%
Product development XXX295
CollaborationX X92
Reduced product-related costs X61
TransparencyXXX 265
Customer support X61
Maximizing value XX 234
Table 5. Summary of PLM functionalities for three affected domains.
PLM FunctionalitiesEnvironmentBusinessIndividuals
Product development025
Collaboration112
Reduced product-related costs−111
Transparency025
Customer support121
Maximizing value024
Table 6. Assessment of CE benefits for the environment.
CE ComponentEnvironment—The Reduced Weight of Input/Output Raw Material (Million Ton/Year)Impact (1–5)
Circular value chain22665
Recovery and collection, including industrial symbiosis8822
Durability, modularity with repair services01
Personalization, made to order and support15364
Product service system and dematerialized service9602
Collaborative/sharing economy11023
Table 7. Production, price, gross profit raw material, Europe 2015–2016 [49,55,56,57,58,59,60,61,62,63,64,65,66,67,68,69,70,71,72,73,74,75,76,77,78].
CategoryRaw
Material
Price (Euro/Ton)Gross Profit (Million Euro)Production
(Million Tons)
Ratio (%)Recycled/Renewable Material Price (Euro/Ton)Price Gap (Euro/Ton)
Cement122.720,000.11637.820102.7
Non-metalicLime233.35599.2241.216073.3
mineralsCeramics5028,00056026.91040
Glass80106,6641333.364.15030
Sum:160,263.32080.3100
Steel40070,80017793.077323
Copper452835,771.27.94.231401388
Nickel10,4527316.40.70.445835869
Metal oresAluminium135029702.21.2550800
Lead1537461.10.30.2733804
Tin13,8444153.20.30.2320810,636
Zinc17193352.11.951.01155564
Sum:124,823.95190.35100
Fossil energyNatural Gas20479,15238831.1353−149
materialsCoal5531,90058046.52035
Oil540150,12027822.3250290
Sum:261,1721246100
Crops336.8365,400108542.8353
BiomassWood465.4221,99847718.8353
Animal and by-products36003,510,00097538.4353
Sum:4,097,3982537100
Table 8. Assessment of CE benefits for the Bussiness domain.
CE ComponentEnvironment—The Reduced Weight of Input/Output Raw Material (Million Ton/Year)Impact
(1–5)
Circular value chain484,816.653
Recovery and collection, including industrial symbiosis119,057.981
Durability, modularity with repair services49,957.821
Personalization, made to order and support635,710.7 5
Product service system and dematerialized service175,637.18 2
Collaborative/sharing economy175,069.412
Table 9. Assessment of CE Benefits in Individuals.
CE ComponentEquivalent ActionMobility [%]Food [%]Build
Environment [%]
Individual Benefit Eval.Impact (1–5)
Circular value chainRegenerate6210182
Recovery and collection including industrial symbiosisLoop5<2<291
Durability, modularity with repair servicesShare40215575
Personalization, made to order, and supportOptimize<53515545
Product service system and dematerialized serviceVirtualize256<2333
Collaborative/sharing economyShare40215575
Table 10. Summary of CE Benefits for all three affected domains.
CE ComponentEnvironmentBusinessIndividuals
Circular value chain532
Recovery and collection, including industrial symbiosis211
Durability, modularity with repair services115
Personalization, made to order, and support455
Product service system and dematerialized service223
Collaborative/sharing economy225
Table 11. Summary PLM’s and CE’s effect on domains evaluation.
EnvironmentBusinessIndividualsTotal Impact
PLM FunctionalityProduct development0257
Collaboration1124
Reduced product-related costs−1111
Transparency0257
Customer support1214
Maximizing value0246
CE ComponentsCircular value chain53210
Recovery and collection, including industrial symbiosis2114
Durability, modularity with repair services1157
Personalization, made to order and support45514
Product service system and dematerialized service2237
Collaborative/sharing economy2259
Table 12. Interrelation of potential benefits matrix.
PLM Functionality
Product Develop-mentCollabo-rationReduced Product-Related CostsTranspa-rencyCustomer SupportMaximizing Value
CE componentsCircular value chain171411171416
Recovery and collection including industrial symbiosis118511810
Durability, modularity with repair services14118141113
Personalization, made to order and support211815211820
Product service system and dematerialized service14118141113
Collaborative/sharing economy161310161315
Marked color highlights results that bring the optimal combination.
Publisher’s Note: MDPI stays neutral with regard to jurisdictional claims in published maps and institutional affiliations.

