1. Introduction
One condition for the development of regional tourism is the presence of a transport infrastructure suited to the needs of tourists, and which is complemented by the satisfactory provision of transport that fulfils the demands of tourist mobility. If the supply of public transport is insufficient to cover tourist needs, then private vehicles will become a determining factor in guaranteeing such mobility. It has been estimated that over 90% of the European Union’s environmental costs are caused by private automobiles [
1].
The basis for sustainable mobility lies in the use of cleaner alternatives to the private car, and options such as bicycles, trains, and walking do not satisfy the current levels of mobility and cannot be viable; however, they may constitute a complementary factor in minimizing the use of cars. For this reason, it is vitally important to maximize clean means of transport, as they permit greater versatility, in terms of their configuration (i.e., frequency and route) and their nature (clean energy for locomotion); while at the same time meeting a part of the island’s current mobility needs.
Current public transport supply on the island of Lanzarote is clearly insufficient, and opportunities to substitute private automobiles are extremely limited, for residents and tourists alike. Therefore, this paper analyzes the possibility of introducing a tourist bus service to connect Lanzarote’s main tourist attractions, and it also focuses on a move towards public transport by tourists to reduce the CO2 emitted by excessive private car usage. This new service will expand the possibilities of mobility for the island’s population, promote integration, and increase access to places of tourist interest. Lanzarote Island is the most easterly island of the Canary Islands’ archipelago, situated a little over 130 km west of the African coast.
The remainder of this article is organized as follows. The second section provides a review of the literature. The third section establishes the problem to address and describes the methodology used. The fourth section presents the empirical results and a related discussion. Finally, the fifth section provides the conclusions of this work and future research directions.
2. Literature Review
2.1. Tourism Transport Energy Use
Overall, transport consumes 94% of tourism-related energy use, compared to accommodation at 4%, and other activities at 2% [
2]. Almost 80% of tourism’s contribution to global warming is associated with leisure travel [
2]. In the near future, tourism will grow fast, and it seems necessary to introduce mechanisms to internalize leisure-travel-related CO
2 emission costs, if climate change is to be managed. Drastic reductions in leisure travel would be needed to mitigate emissions worldwide. Excessive transport usage has led to high social costs and has caused a variety of negative externalities, such as traffic congestion; land consumption; accidents; air and noise pollution; destruction of the visual landscape; and waste in the use of resources such as raw materials, energy, and so on. However, tourism transport has become a crucial part of the tourism industry that generates substantial economic benefits worldwide. Therefore, the target should be to control the growth of tourism transport usage in order to make it environmentally sustainable, without compromising the ability of people to meet their need for mobility.
Road transport accounts for 81% of the total energy used by the transport sector [
3]. The tourism road traffic segment is increasing rapidly without any sign of saturation. In addition, leisure traffic is highly correlated to private motorized vehicles [
4]. In that sense, transport planning at tourist destinations should be focused on reducing private car usage for leisure purposes. However, the environmental impact of road transport related to tourism has been a neglected area of tourism transport research. Becken and Simmons [
5] estimated that the contribution of private cars to tourism transport energy use at a West Coast tourist resort in New Zealand was about 79%. Dickinson et al. [
6] found in Purbeck’s study that the car dominates (82%) as the modal choice in most European destinations; and that the bus was seen as the main alternative to the car, if improvements in the services had taken place in order to promote use.
Road transport is one of the most important factors responsible for air quality. In 2017, 23 out of 28 EU Member States’ air quality standards were still being exceeded—in more than 130 cities across Europe, in total—with NO
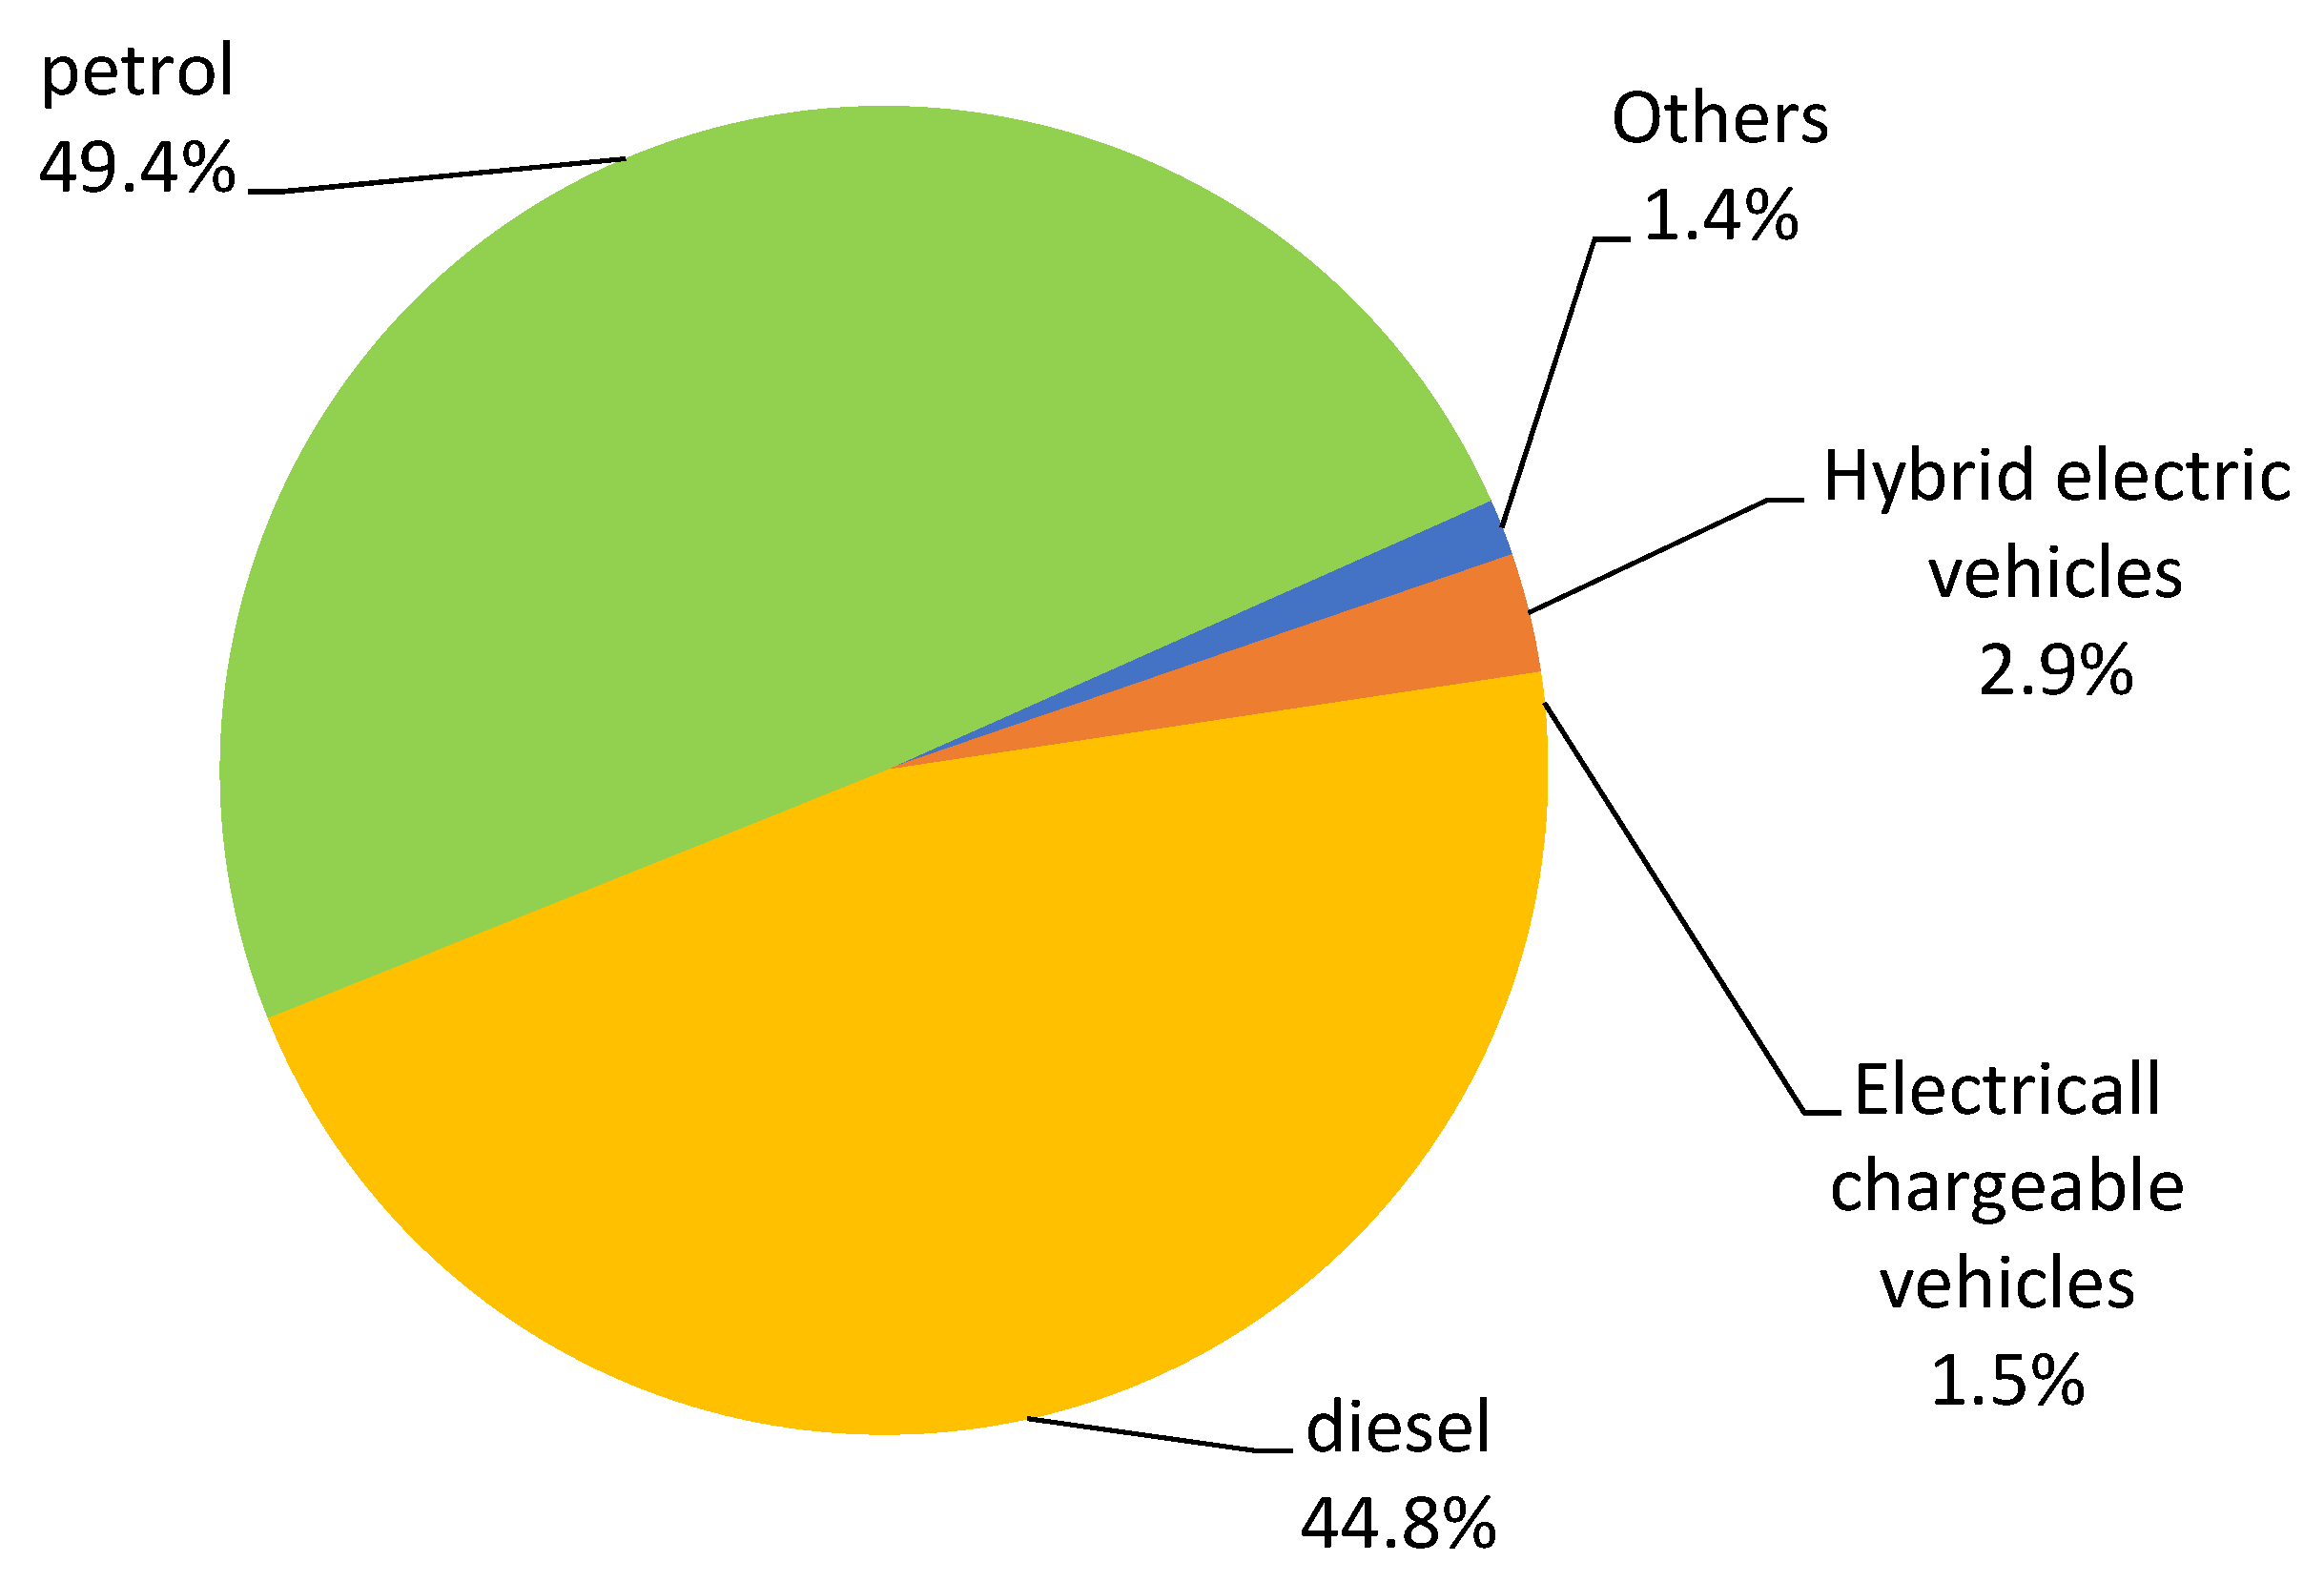
2 (nitrogen dioxide) and PM10 (particulate matter) the most problematic pollutants. Different policies have been adopted to regulate the situation, creating in some cases perverse effects due to the complexity of this issue. For this reason, the effect of the public policies on the sector are very important in economic and social terms. The economic valorization of emissions is outdated given the introduction of the electric vehicle; however, the widespread implementation of this type of vehicles will not be as widespread as may be believed, given the difficulties in logistics, facilities, price, etc. The pie chart (
Figure 1) shows the new passenger cars (new registrations) in the EU15 countries by fuel type in percentage of categories in 2017. Some considerations in the pie chart become necessary. In the category Electrically Chargeable Vehicles are included battery electric vehicles (BEV), extended-range electric vehicles (EREV), plug-in hybrid electric vehicles (PHEV), and fuel cell electric vehicles (FCEV). In the category Hybrid are included full and mild hybrids. In the category Others are included natural gas vehicles (NGV), LPG-fueled vehicles and ethanol (E85) vehicles [
7].
Considering also the average age of the EU vehicle fleet, combustion vehicles will continue to have an important presence in the coming years, and the appearance of new technologies makes it necessary to review and improve the environmental policies in the sector to avoid possible perverse effects and optimize the transition to new and future technologies. As we can see, nowadays, we are still in a transition stage before new technologies can be applied in a general way. So, traditional public transport remains a good strategy for mitigation policy. This is clearer in the case of island destinations. The improvement of public transport services becomes more useful in terms of to mitigate pollutants and to facilitate tourist mobility at destinations. However, to foster more sustainable forms of tourist mobility, in the transition stage, some study becomes necessary to establish determinant variables of choosing transport mode at the destination. Gutiérrez and Miravet [
8] point out that tourist mobility patterns at destinations depend on the socioeconomic and demographic characteristics of the tourist. Age, education level, social class, and country of origin affect their use of public transport.
2.2. Road Transport Emissions Mitigations Policy
Chapman (2007) [
3] argues that fuel tax is a useful policy to curb road transport emissions. A fuel tax could be a more accurate approach, because a direct incentive on fuel efficiency arises that could encourage a modal shift. Storchmann [
9] estimated the price elasticities for each mode of transport, and by motive for the trip. He found a high fuel price elasticity for leisure car travel (−0.120) compared to other reasons for traveling. He pointed out that travelers perceive car use as essential for work and business trips, but as unessential in the leisure segment. This means that if gasoline prices increase, using cars for leisure purpose tends to decrease. However, the implementation of a fuel tax for environmental purposes can be a hard task. According to the fuel price elasticity for leisure travel, there is a margin to try and shift from leisure car travel to a more sustainable mode of transport. Despite this, there are insurmountable difficulties. There are technical obstacles to implementing a leisure-related fuel tax. One is the fuel tax discrimination for the tourism segment. This means that a fuel tax applied to road usage for tourism-related activities would probably be impossible to apply, or it would incur high administrative costs.
Alternatively, the use of private cars to access tourism activities can be rationed by increasing passenger load factors (car sharing) or decreasing travel distance [
2]. Forbidding the access of private cars with less than four travellers to National Parks could be a more reliable policy. Dickinson et al. (2009) [
6] found there is some support for car restrictions and some willingness by visitors to use alternatives modes in rural tourist destinations. Thus, the focus is on minimizing the use of one particular mode of transport in favor of a more environmentally friendly one [
10]. The latter study provides arguments for implementing new and attractive public transport supplies related to the leisure travel segment. Guiver et al [
11] suggest that the rural tourism bus network needs to be reappraised by taking into account several attributes, such as social inclusion, traffic, and mileage reduction. The authors also point out that there are clear economic benefits associated with the development of an attractive bus network, which facilitates access opportunities for residents and visitors without cars. Moreover, there is evidence that identifies barriers to a modal shift from the private car to public transport alternatives. For instance, local residents do not want their car use restricted, and policies to achieve this modal shift have not succeeded [
12]. Nevertheless, efforts must be made to allow for a more balanced use of the private car and public transport.
Following to Lumsdon [
13] the provision of public transport in rural destinations is not usually sufficiently attractive to encourage any significant level of modal shift. The author emphasizes that it is necessary to find a new social construction for the bus travel model, where a multifaceted bus network plays an important role in encouraging people to enjoy their destination without a car. The case here is to choose between two design approaches. The former places the emphasis on the need to design a bus network to include tourism activities. The latter is a conventional approach that meets the needs of all users, but may be modified to accommodate the desires of tourists. A public transport service that provides a multifaceted service for residents without private cars and tourists, based on social inclusion, may improve social welfare; however, this approach shows also a trade-off between the need to serve a wide range of users and the reliability of services.
Alternatively, the introduction of the electric car could be a solution to mitigate emissions impacts on environment. However, the implementation of an electric car rental for tourism purposes requires high costs because an electric car has a short range (145–175 km) and this includes the cost of building a charging station in a rural zone. On the one hand, the cost of investment in the charging station depends on the cost of the station terminal and the length of the power cable. On the other hand, the sociodemographic features of the rural zone (e.g., population density and poor urbanization) could not justify such investment. Also, the optimal locations of such a docking station with charging system in areas with a low population density and high dispersion of habitats could be a serious difficulty to solve. In that sense, research about the assumption that the electric car could be an alternative to traditional transport for tourism in rural areas is not clear, despite technological advances [
14].
2.3. Post-COVID-19 Stage
The post-COVID-19 pandemic stage perhaps provides an opportunity to adapt sustainability principles to transport for tourism [
15]. Moreover, in the case of tourist destination mobility, there are two opposing forces in this process. On the one hand, the door-to-door feature of car transport helps us to avoid overcrowding. It creates a sense of safety in terms of limiting the spread of the virus, in contrast to collective transport. On the other hand, a sustainable mode of transport such as public road (collective) transport has been hit by the crisis and its offer reduced. Therefore, it seems that a change in tourist behavior to adopt a more sustainable transport mode is not clear-cut. However, in the post-COVID stage, the planning element is crucial to improve sustainability of transport for tourism at destinations. Local authorities can influence changes in tourist behavior through regulations that promote the development of sustainable tourism mobility at destination in consonance with COVID-restrictions. In that sense, the PASS study (Prepare-Protect-Provide-Avoid-Adjust Shift-Share Substitute-Stop) allows policymaking take into account for COVID-restrictions and, at the same time, to approach best practices in sustainable mobility [
15].
As it was pointed out above, a multifaceted bus service can encourage tourists to use public transport at destinations more than private cars and, at the same time, serve a wide range of users, including rural area inhabitants. In addition, this transport model can also approach some of the environmental and social benefits of the sustainability requirements. Marek [
15] emphasized that under post-COVID circumstances, the destination development model can point the way to adapt tourism transport policy to this new reality. He believes that more emphasis has to be placed on the possibility that the consequences of the COVID-19 pandemic may transform tourist travel behavior in general and at destinations in particular. In that sense, the development of sustainable public transport policy at local level, generally well-developed in urban areas, has to be improved in rural areas to achieve social justice in terms of improving access to job opportunities, health care, and education. Therefore, it seems that the multifaceted bus service can offer more social and spatial justice. The challenge is to meet the requirements of COVID-19 and, at the same time, to promote the use of public transport. There is a need to research the adaptation elements.
3. The Problem to Address and the Methodology
3.1. Lanzarote Current Mobility Model and Tourism
Lanzarote Island is the most easterly island of the Canary Islands’ archipelago, situated a little over 130 km west of the African coast, and has a total surface area of nearly 862 km2. Its orography is flat but it does have moderately elevated areas, with its highest point being 670 m. Around 42% of the island’s surface is denominated a protected area. It is paradoxical that the local government is generally very active in conserving the environment, but at the same time allows continual tourism development in coastal areas. In the last 10 years, the supply of beds for tourists has increased by nearly 43%.
Today, Lanzarote’s economy depends almost exclusively on tourism. About 78% of jobs are directly related to this sector. Most than two million tourists visited the island in 2014, with this figure being almost seventeen times larger than Lanzarote’s population [
16]. This constant flow of tourists increases the need for mobility and substantially impacts on the environment.
The number of motorized vehicles per inhabitant measures the level of saturation for the Lanzarote automobile fleet. Empirical evidence suggests that a saturation level of 0.5 (one vehicle per two persons) is an “acceptable” benchmark [
17].
Table 1 shows that Lanzarote’s ratio has a higher value than this benchmark. When vehicles other than private cars are excluded, the ratio value is still above the benchmark. This automobile fleet is related to tourist trips on the island. The daily activities generated by tourism also include new journeys, principally due to the provision of goods to develop tourist activities, leisure, and shopping. This has a profound impact on transport because these activities were not performed at the same level of intensity before tourism became such a significant economic activity on the Island.
Figure 2 shows the total carbon dioxide emissions and emissions per capita from road transport from 2000 to 2017. Because the emissions per capita and total emissions are expressed in different units, the graph presents two different vertical axes. The line graph shows also the population of the island. We can observe, in
Figure 2, how the total emissions have the same trend as the fuel consumption (there is a stoichiometric ratio between fuel and carbon dioxide). The total emissions depend on the population and their consumption; in the graph we can observe how from 2000 to 2006 the growth in total emissions has been due to the population increase, but in this period per capita emissions have also been decreasing. From 2006 to 2017 there is a parallel trend in total emissions and per capita emissions. This phenomenon shows the importance of policies to improve the environmental efficiency in the economic model of Lanzarote Island.
Furthermore, ten years ago, the road transport ecological footprint related to tourism activity in Lanzarote accounted for almost 37% of the total road transport footprint [
18]. According to Gössling [
2] this means that the energy used in road travel per tourist in Lanzarote represents 2.8 times the energy intensity that they use in other activities. In sum, tourists intensively use road transport during their holidays in Lanzarote. It should be stressed that if either Lanzarote’s public transport or collective tourism transport supply is not improved in the near future, the road transport ecological footprint will probably represent a higher proportion of the total tourist ecological footprint [
18].
3.2. Background
The increase in car usage has coincided with a decline in the use of public transport for tourist and recreational trips on Lanzarote Island. This has resulted in a loss of public transport services in many areas and has increased automobile dependency. The car offers a more flexible transport option at the moment—both allowing travelers to establish individual itineraries to explore areas and providing a door-to-door service. However, car users tend to misperceive the true cost of driving by discounting or minimizing fixed costs. Frequently, they exclude external costs such as, for instance, the production of greenhouse gases. On Lanzarote Island, private cars are used in an automatic and routine way without any active consideration of alternatives.
On the one hand, in Spain, the registration vehicle tax is related to CO
2 emissions but company cars are actually excluded. On the other hand, the impact of this measure would be very difficult to perceive in a few days of car rental. The subsidies for efficient vehicles are still more complicated in the case of electric cars, because tourists do not have garages with charge points. In the case of plug-in hybrid electric vehicles (PHEVs) the situation will generate an even more polluting scenario [
19].
In Europe the environmental policies have been focused on CO
2 mitigation—this is the main reason for the growing diesel fleet in the continent. Now, the biggest problems in urban areas are NOx and PM. We can summarise that the actual policy is generating a “pendulum shift effect”. For this reason, it would be necessary to consider the emissions like a whole and not pollutants individually. According to EU legislation on ambient air quality and cleaner air for Europe (Directive 2008/50/EC) [
7] this sets air quality limits that cannot be exceeded anywhere in the EU, and obliges Member States to limit the exposure of citizens to harmful air pollutants.
Although this article focuses on CO
2 mitigation, one of the main advantages of the emission tax is that it allows consideration of different pollutants. Because there are technical obstacles to implementing an emission tax related to the use of the car for leisure time (one that would incur high administrative costs), the emission tax must be implemented regardless of the use of the car. In these circumstances this measure would be effective also in the other sectors involved (private demand, freight transport, etc.). According some authors, under current technology, direct charging for emissions is not feasible due to the lack of cost effectiveness and the impracticability of monitoring techniques [
20]. Subsequently, after estimating the emissions it would be necessary to estimate the “shadow price” (the monetary value assigned to currently unknowable or difficult-to-calculate costs) of the emissions. There are several studies on average and marginal air pollution costs: the Extern E project, and the CAFE CBA (Clean Air For Europe Cost–Benefit Analysis) developed in Europe are examples of this. Probably, it will be necessary to access different studies and harmonize a global methodology [
20].
3.3. Alternative Ways to Address the Problem
As we have seen above, a tax mechanism to encourage a modal change to cleaner transport modes is very difficult to implement and may have unacceptable economic and social consequences. In this context, a softer policy might be more appropriate. Hence, this paper explores a new bus line design that integrates two main objectives: to facilitate tourism mobility at a particularly fragile island destination and, at the same time, to minimize CO
2 emissions. While the main focus of this paper is on tourism mobility, if the new bus line design can contribute to, for example, individual mobility so that residents can connect with jobs, services, and the facilities that they need to fully participate in society, it will be of greater value [
21].
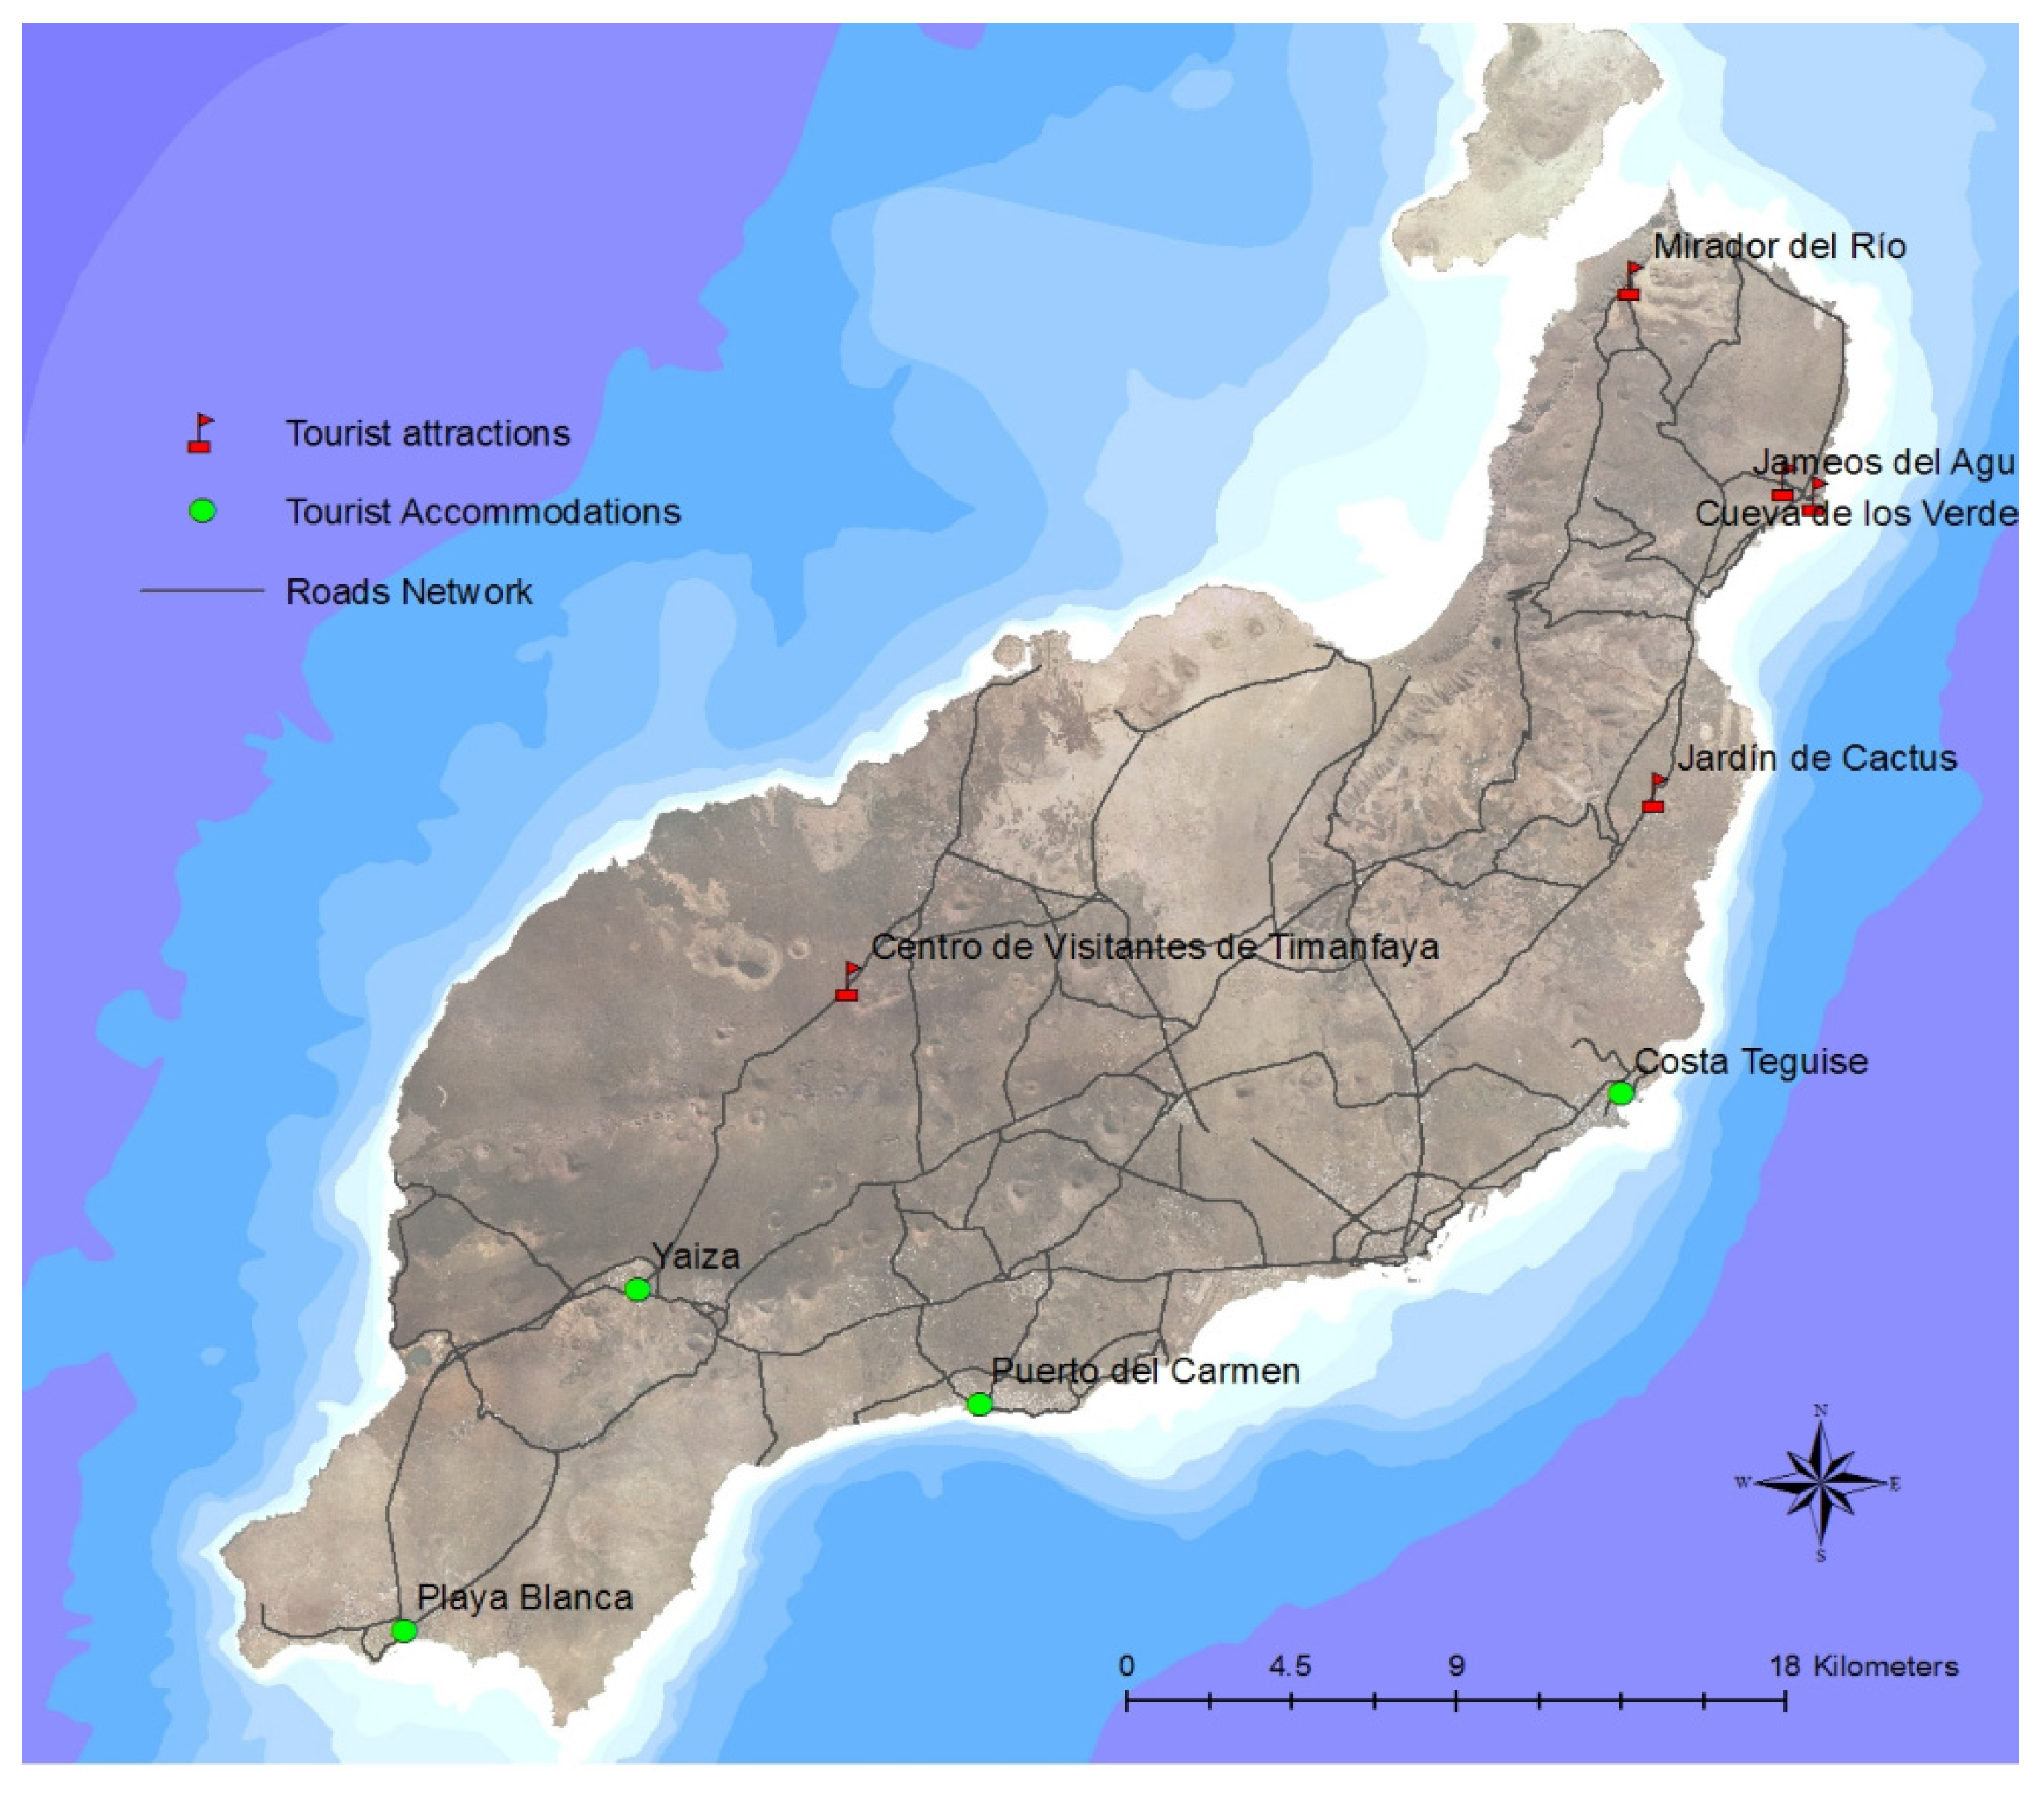
The challenge consists in analyzing the pollution caused by tourists visiting Lanzarote’s most important tourist attractions, which are Timanfaya National Park, the Cactus Garden, Jameos del Agua, Cueva de los Verdes, and Mirador del Río. In order to achieve this, we have taken into account that the starting points for the journeys are the centers with the most tourist accommodation on the island, namely: Playa Blanca, Yaiza, Puerto del Carmen, and Costa Teguise.
Figure 3 summarizes the problem that is analyzed in the paper. This study seeks to evaluate the design of a new bus to deliver tourists to key tourist activities on Lanzarote Island.
3.4. Methodology
A GIS-T algorithm is used to compare the level of CO
2 emissions from the current tourist mobility model versus the implementation of a new touristic bus. Recent developments in GIS mean that certain problems related to transport networks can be approached from a perspective that combines the traditional algorithms of network analysis with geographical information; this fusion has created the branch of studies known as geographical information system for transportation (GIS-T). The main objective of GIS-T is the use of GIS tools to manage, plan, evaluate, and maintain transport systems. An introduction to the use of GIS tools in transport-network-based problems can be found in [
22].
GIS tools are very often used for accessibility studies in transportation planning and to evaluate mobility policies. Transportation plays a crucial role in shaping human interactions and sustainable mobility. In that sense, mobility to tourist destinations has become a difficult problem to solve for local administrations. Therefore, the use of an appropriate methodology that allows tourist mobility to be evaluated, in a sustainable way, becomes valuable. Several studies have used GIS approach to evaluate sustainable mobility. Määttä-Juntunen et al. in [
23], for example, used GIS tools to estimate CO
2 emissions related to the accessibility of retail stores in Finland. The aim was to utilize GIS tools to assess store locations in terms of CO
2 emissions from private cars. GIS tools were also employed to analyze accessibility and to encourage modal shifts to reduce car reliance. This approach helped to identify areas where it was feasible to substitute cars and to maintain a reasonable level of accessibility [
24]. Wang and Chen in [
25] used a GIS-based statistical approach for modeling job accessibility. They found direct and indirect spillover effects due to an investment change in public transportation facilities in metropolitan areas. Scott and He [
26] used a GIS-based algorithm to analyze shopping destination choice. The innovation of this research, compared to previous studies, was to introduce a GIS-based constrained choice set to incorporate an individual’s space–time constraints. They also concluded that this kind of model is of particular importance to transportation planners.
In order to calculate the levels of pollution produced by tourists traveling to tourist activity locations, Kelly et al. in [
27] proposed a model that consists of various stages. First, the kilometres travelled by the tourists (
TKT—tourist kilometres travelled) for each of the tourist routes are calculated, and then depending on the mode of transport employed:
where
i represents the tourist route,
k the mode of transport,
Vj the number of visitors to the tourist attraction
j,
Dj the average distance of the return trip from the tourists’ starting points, and
Mijk the proportion of visitors from the center
j on the route
i using the mode of transport
k. The kilometres traveled per vehicle are then estimated using
, where
Ck is the capacity of the mode of transport
k. Finally, the levels of pollution from
VKT are calculated using the conversion factor
Fk (Km—mT CO
2). As such, the system’s total level of pollution (
TCL) is given by:
However, the formula proposed by Kelly et al. in [
27] to calculate the
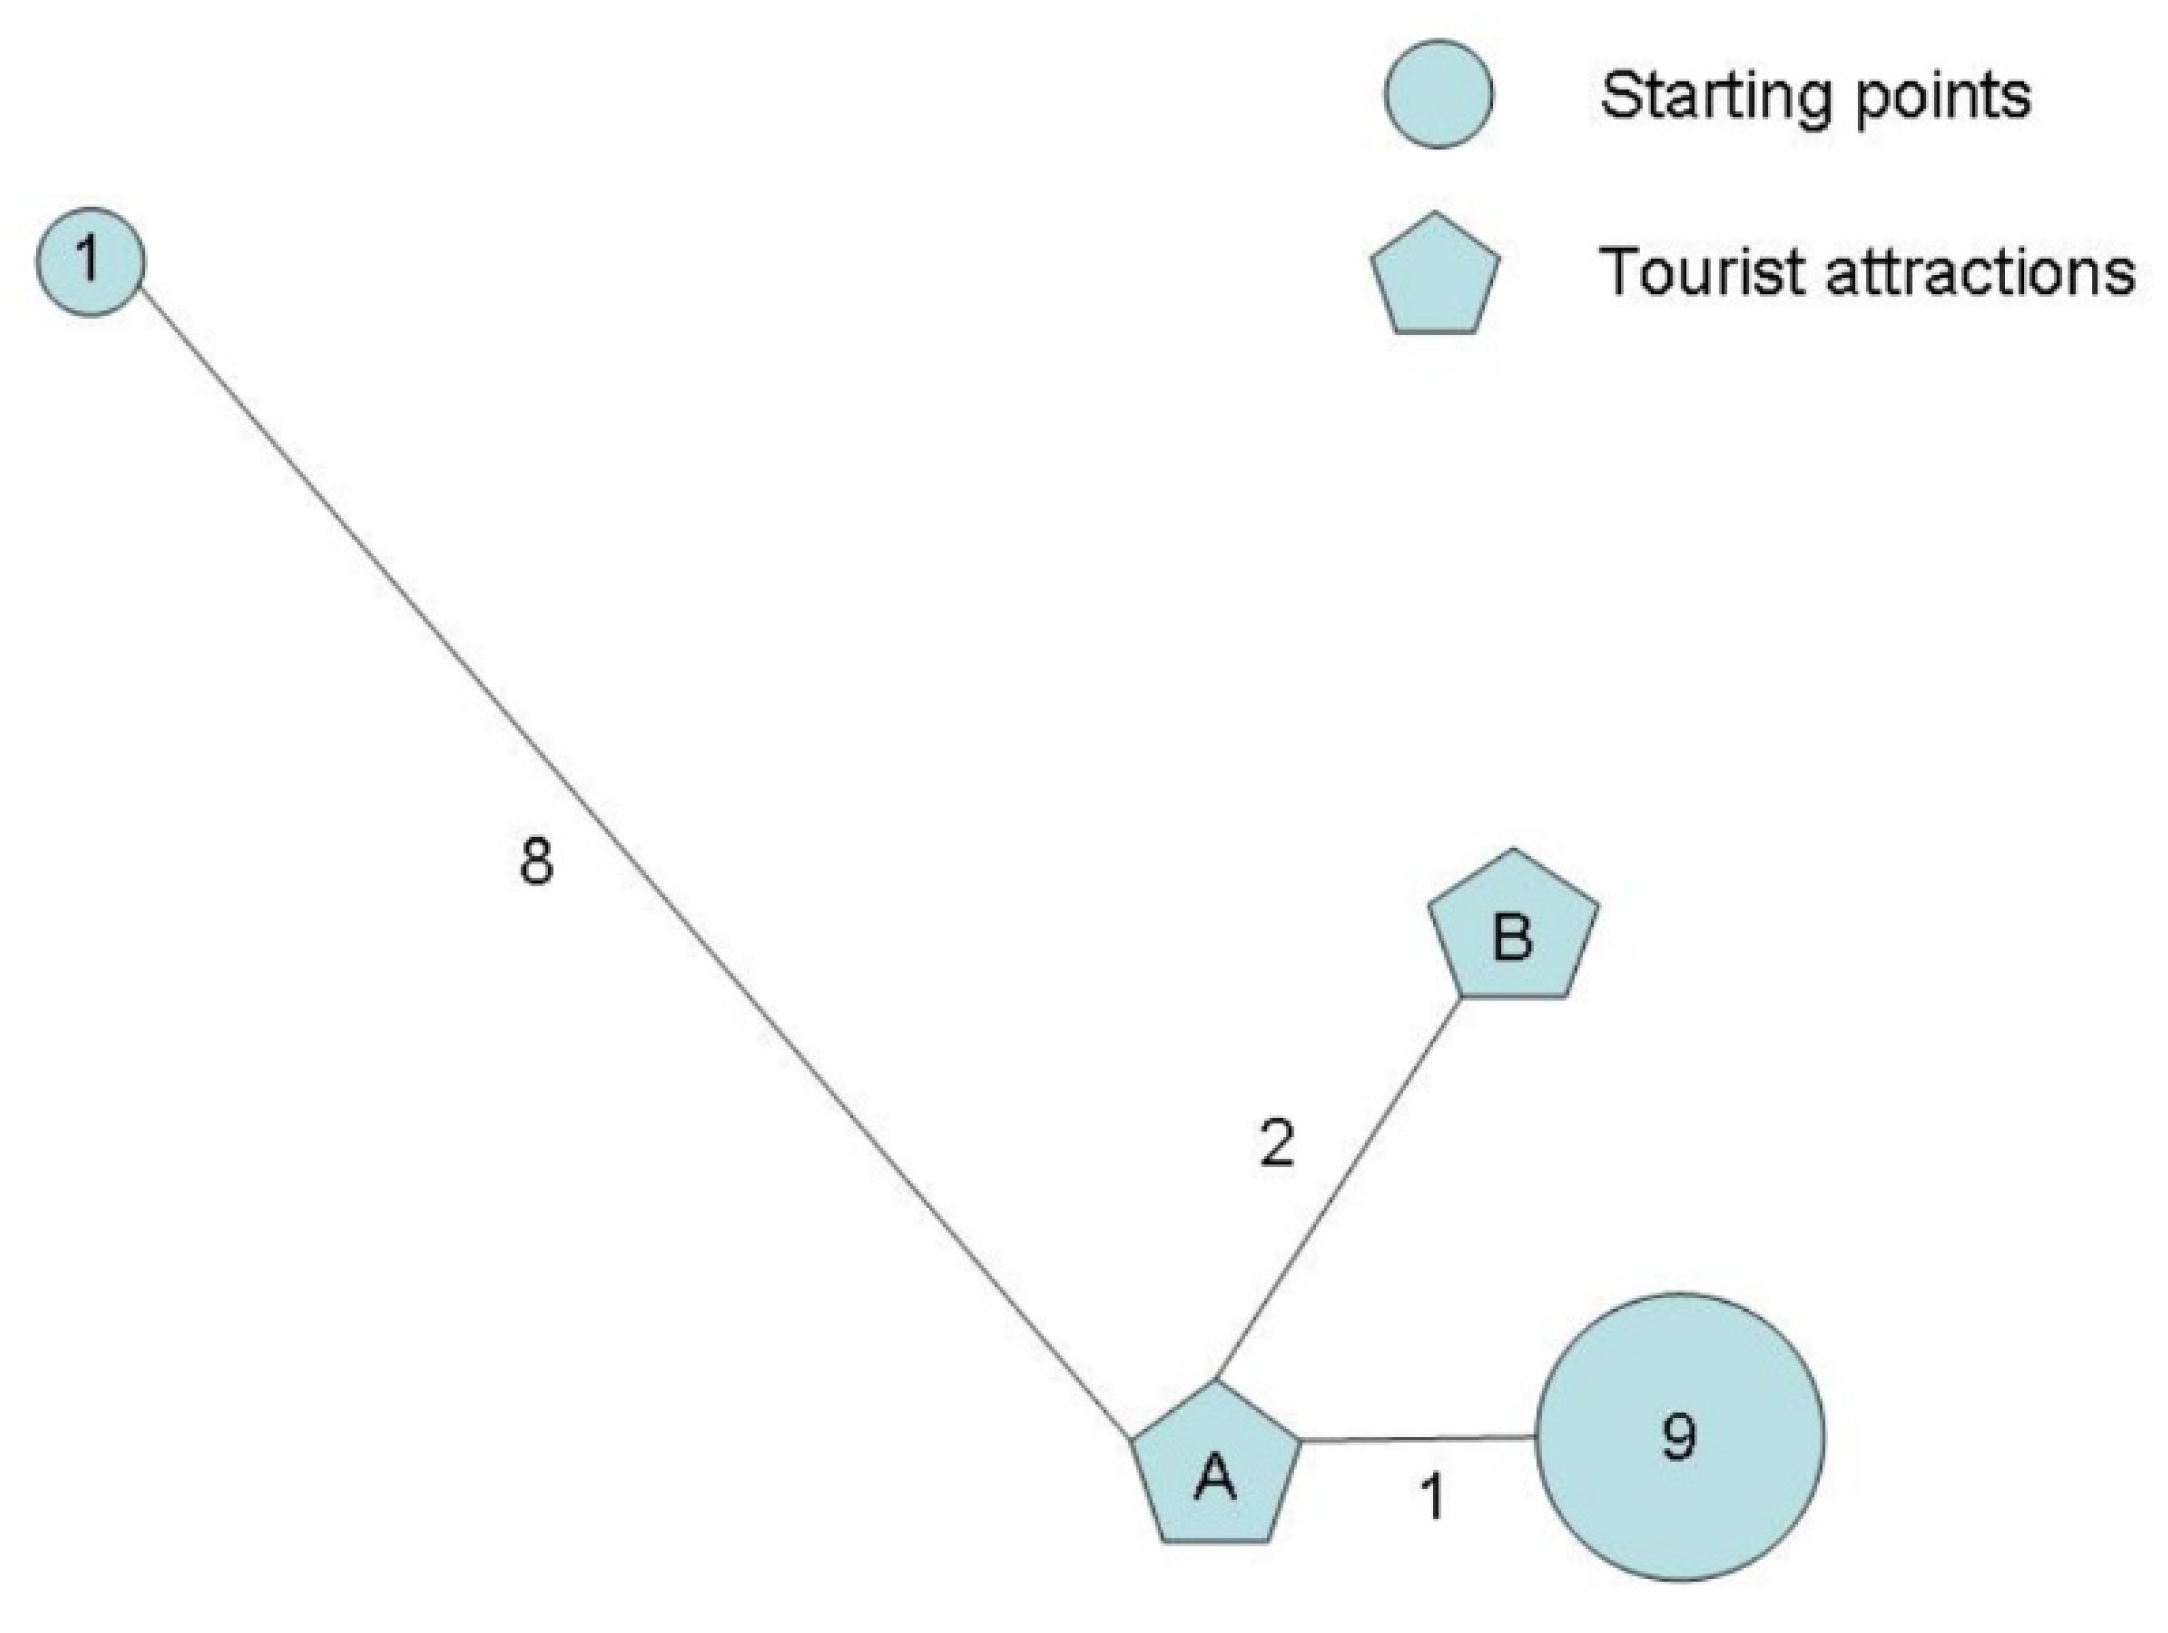
TKT has, in our opinion, various problems that concern us. Firstly, it does not take into account the volume of tourists that correspond to each of the starting points, and it treats them all equally. We analyze the example in
Figure 2, which has two starting points and two destinations of interest. The numbers of visitors to both attractions are shown inside the starting points, and the distances in kilometres are shown beside the lines. If the route were only formed by attraction A, and we were speaking of a single mode of transport with
Mijk = 1, then the
TKT in the Kelly formula would be 10 × 2 × 4.5 = 90 km; that is to say, the assumption is that the ten visitors would travel 90 km. However, this is an overestimate because they would only have to travel 1 × 2 × 8 + 9 × 2 × 1 = 34 km. This is because the Kelly formula uses average distance. Thus, if the number of visitors is known at the starting point, there are significant differences in these quantities; therefore the Kelly formula may produce significant errors.
Another problem arises when attractions are found along the shortest route that links the starting point to the various points of interest. In order to arrive at attraction B from both starting points it is necessary to pass by A; this is the example in
Figure 4. If we are dealing with short visits, then it would be feasible to do both, thus taking advantage of one single journey. Using the Kelly formula, the distance travelled would be 200 km (visiting A + visiting B = (10 × 2 × 4.5) + (10 × 2 × 5.5) = 200 km), whereas in fact the most likely option is that only 74 km (visiting A + visiting B = (9 × 3 × 2) + (1 × 10 × 2) = 74 km) would be covered by visiting A and B.
For the aforementioned reasons we propose an alternative definition for the
TKT:
where
l represents the visitors’ starting point. As with the previous case, the definition is
and:
In the next section, through the GIS algorithm, we will compare both formulations to estimate CO2 emissions from the current tourist mobility system on Lanzarote Island and after. Furthermore, we will estimate the proportion of emissions reductions due to the modal change from rental car use to a new tourist bus route implemented on Lanzarote Island.
4. Hypothesis, Results and Discussions
4.1. Preliminary Hypothesis and Data
In order to carry out the associated calculations for the pollution, we have had to take into account the number of visitors in 2014 to each of the places of interest, the means of transport used, and the tourists’ starting points. 22.5% of tourists arrived using buses while 77.5% used private vehicles, according to surveys carried out at the tourist attractions [
28]. This data is common to all of the island’s routes and starting points, and as such
Mij1 =
M1 = 0.225 and
Mij2 =
M2 = 0.775. It should be stated that the buses used, rather than being regular public services, are programmed excursions that set off from various tourist resorts.
Table 2 shows the total number of visitors to each of the places of interest, as well as the distribution according to the mode of transport chosen to arrive at each destination.
On the other hand, according to data provided by “Anuario Estadístico de Canarias” [
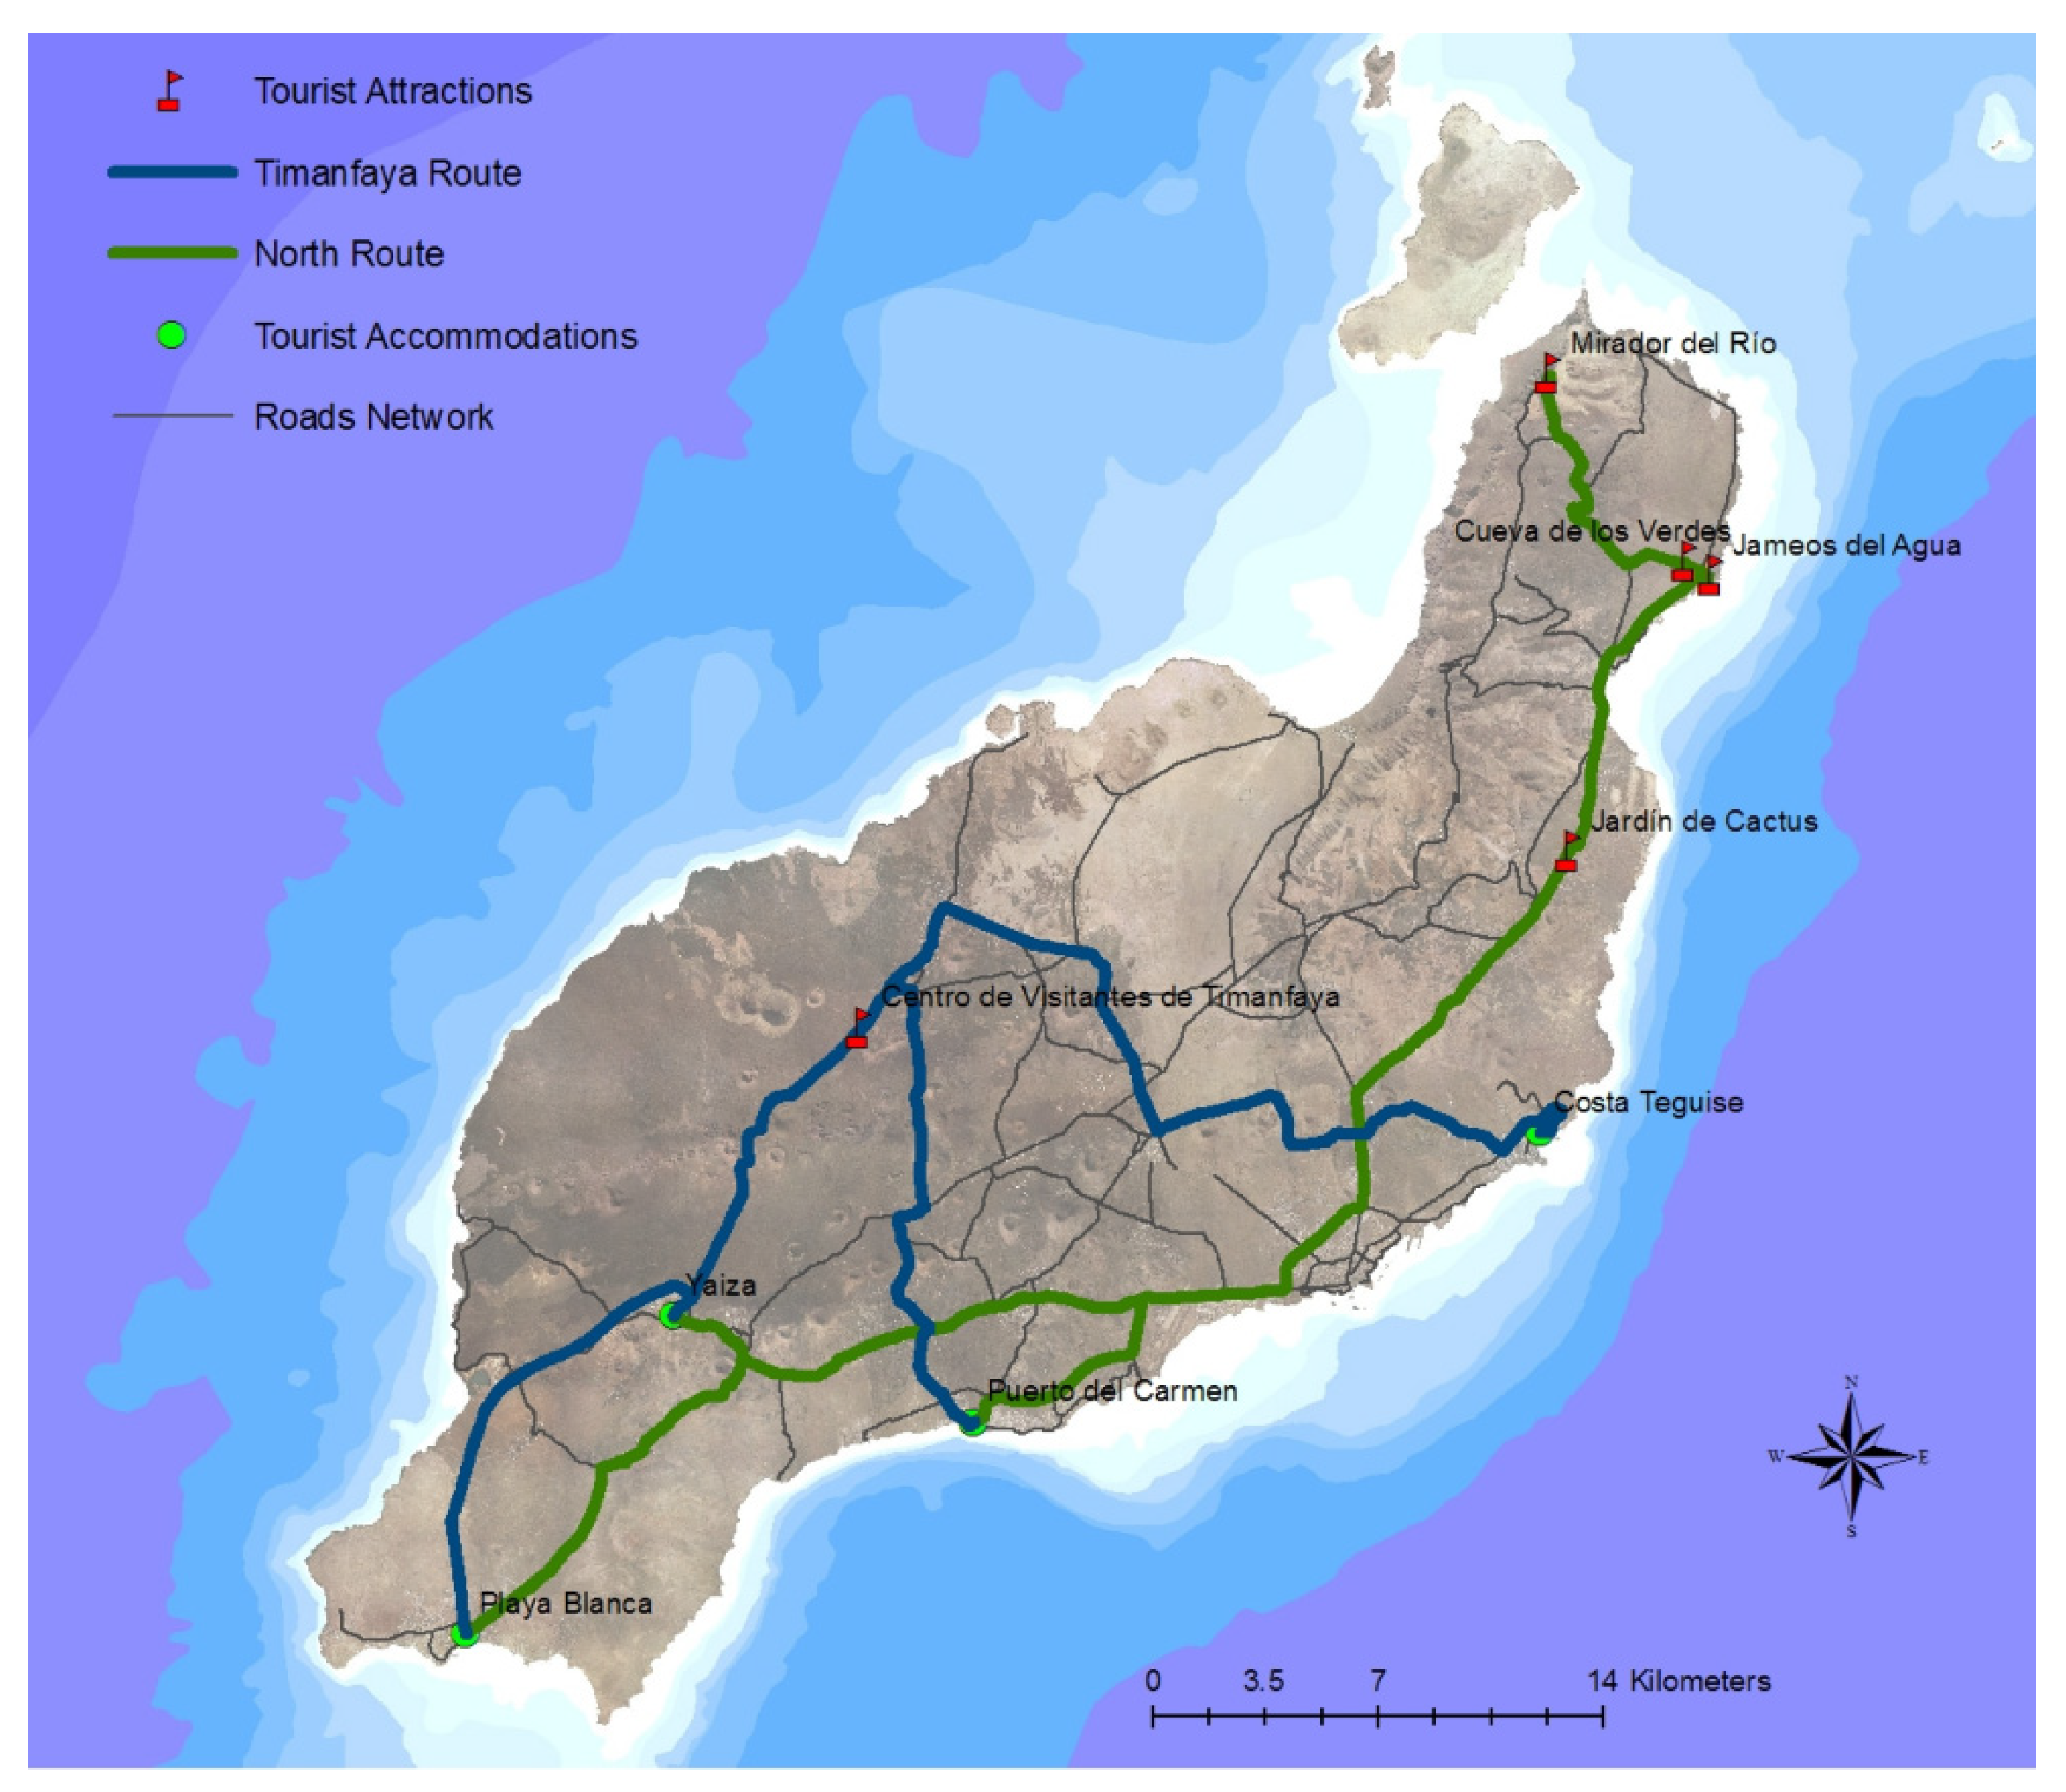
16] for Lanzarote in 2014, the distribution of the tourists according to their places of residence are 25.8% in Costa Teguise, 14.53% in Playa Blanca, 36.4% in Puerto del Carmen, and 19.37% in Yaiza. Two routes have been proposed in order to calculate the journeys that the tourists made to arrive at the different attractions. Firstly, we have considered the Timanfaya Route, which is marked in blue in
Figure 5. Secondly, we have the North Route indicated in green, which includes all other places of interest on the isle. It may seem illogical that all the points of interest are visited in a single day, but it is quite probable that those are relatively close to one another.
After analyzing the sequence of tourist attractions and the number of visitors to each site, it was decided to simplify the North Route and consider it to comprise two stretches; one that begins from all starting points and ends at Jameos del Agua, and the other from Jameos del Agua to Mirador del Río. On the first stretch, we have skipped the Cactus Garden as it is en route to Jameos del Agua, which has a greater number of visitors, and we also presume that all those visiting the gardens travel to Jameos del Agua too. Given these conditions we have assumed that the number of visitors on this first stretch, regardless of their starting point, is the same as the number of visitors to Jameos de Agua; this is because Cueva de los Verdes and Jameos del Agua are less than one kilometre apart, and it seems reasonable to visit both on the same trip. Fewer tourists go on the second stretch, so we have used the number of tourists that visit Mirador del Río, which is second after Jameos del Agua, as an indicator of those using this route.
Table 3 shows the number of travellers (
Vjl) that use each of the stretches, in the context of their starting points.
The optimum routes and the matrices of distances between the various starting points and destinations were obtained using the ArcGis program. For this reason, it was necessary to use the Network Analyst extension, and to include a layer that represents the road network that also verifies certain conditions of connectivity. From the very start, the road network has been run by GRAFCAN [
29], which is the official source of geographical information on the Canary Islands. The program can calculate the length of the stretches of road, but it was felt that, at the time when the decision was taken, the optimum criterion for any route was to reduce the journey time. In order to obtain the transport time, the roads were classified by type (main, secondary, local, and urban) each of which corresponds to the respective average speeds of 70, 60, 50, and 40 kph. Finally, we estimated the traveling time using the length and average velocity of each stretch.
In order to determine the distance that the tourists travelled by the Timanfaya Route, it was sufficient to calculate the quickest route that unites each tourist starting point with the Timanfaya National Park, and then measure the distances. The shortest route, in terms of time, from each starting point has been calculated, in order to find the distance traveled along the Northern Route. It can be seen in
Figure 5 that all routes, regardless of the starting point, coincide in the final stretch, which is where the area’s attractions are found. This route is in turn divided into two stretches, starting point—Jameos del Agua and Jameos del Agua–Mirador del Rio.
Table 4 shows the distances (
Djl), counts the return trajectories of the different stretches that make up the shortest routes.
In order to estimate the number of cars and buses that travel on each of these two routes from each starting point, we have assumed an average occupancy of 50 passengers per bus (
C1 = 50) and two occupants per car (
C2 = 2) [
28]. Finally, we have considered the following coefficients to convert the kilometres into metric tonnes of CO
2; they are 0.00092 for buses and 0.00017 for cars [
28]. Using the aforementioned data, the total level of pollution (
TCL) produced by visits to the tourist attractions analyzed can be calculated. The criterion that the tourists have supposedly minimized traveling time must be borne in mind when calculating the journeys. This means that the calculations provide us with minimum levels of contamination.
4.2. Results
The current system of visits to the attractions studied in the paper produce a minimum of 7626.801 mT de CO
2 (see
Table 5)
. You will notice that for level
TCL2 the result is lower than that calculated using the Kelly formula (
TCL1), which was 9506.10 mT of CO
2.
Vehicle Routing Problem is an extension of the Network Analyst of ArcGis9.3, and was used to design the tourist bus route; it is a rather sophisticated tool that, due to its multiple options, enables complex problems to be tackled. Among the basic issues to be addressed are the stops, the areas where routes are restricted, departure and/or arrival points, costs associated with the times and distances, etc. The two alternatives presented in
Figure 6 are among the options that have been put forward. The alternative on the left (Alt1) is made up of three circuits, one of which includes the tourist attractions on the way to Yaiza, and two that collect the tourists from the other areas where they are staying and take them to the circuit. The alternative on the right (Alt2) differs in that the circuit only includes the points of interest between Timanfaya and Mirador del Río, and the centers where the tourists are lodged are connected to the closest point of the attractions’ circuit. The improvement in Alt2 is that the tourists accommodated in Puerto del Carmen may access the tourist circuit at an intermediary point, which allows them to decide whether to go towards Timanfaya or to the north. With the other alternative they would always have to pass by Yaiza and Timanfaya.
In order to evaluate the effect of the introduction of the new tourist route upon pollution, various scenarios whereby 5%, 15%, 25% and, in the most optimistic case, 50% of the visitors use the service.
Table 5 shows a comparison of the pollution produced by the current system versus the proposed alternatives for the proposed tourist route with different scenarios. The first column shows the estimated percentages of visitors using the new route, and in brackets the percentage that we presume would use a car before the new bus route starts. The second column shows the tonnes of CO
2 produced by buses on the new route to transport the tourists using Alt1. The third and fourth columns show the percentage reduction in pollution, compared to the current system; it is used as a measure of total pollution and contrasted with those calculated by the formulae
TCL1 and
TCL2 respectively. The final three columns show the same analysis, but for Alt2.
The data in
Table 6 demonstrates that the percentage reductions are greater if they are calculated using the
TCL1 formula, since it has given us a superior level than
TCL2. The data is better for Alt2—the reductions range between 3.037 and 2.554 percentage points for both formulas and for each 5% increase in the number of visitors on the new route. It can be seen that to obtain a reduction of around 15.186% compared to current levels, then 25% of visitors to these attractions must use the new tourist bus service. This means that 19.375 % of the visitors that previously used cars as a means of transport would have to opt for the new service.
4.3. Discussion
On the one hand, the results indicate that the current mobility model on Lanzarote Island can be improved, in terms of the reduction in transport emissions, through the implementation of a tourist bus service. On the other hand, the implementation of this multifaceted bus line would offer welfare gains for rural inhabitants and tourists whenever there are a high number of rural inhabitants near a bus stop. Additionally, tourists could access Timanfaya Park at a low economic and environmental cost. The new tourist bus route would connect several high population areas, thereby increasing access to one bus stop per inhabitant in those areas. In 2014, the peripheral municipalities, with very deficient public transport, such as Yaiza, Tinajo, and Haria jointly accounted for a population of 25,612 inhabitants [
1]. The households in those municipalities could potentially benefit from a new bus line that would connect them with key employment or tourist hubs on the island within a reasonable travel time. If a new bus stop is established this could improve the proportion of households that are within 400 m of this bus route. The Vehicle Routing Problem of the Network Analyst for ArcGis9.3 estimated a number of 16,143 and 23,785 inhabitants within 300 and 500 m respectively from the new bus route. This could improve access to the surrounding facilities by optimizing the problematic organization of household commitments leading to time-based inclusion [
28].
As Preston [
30] pointed out, the most common response to transport-related social exclusion is to improve the collective bus service. The new tourist bus lines proposed here have several advantages for rural populations. They would improve accessibility to leisure facilities for residents in terms of decreased travel time. Those populations would also have two options to travel: at peak time or off-peak time. Most tourism workers would save a lot of travel time in accessing their place of work at one of the tourist centers on the Island. This suggests that time-based exclusion would be improved because this new service provides an incentive to mobility for rural residents (or poorly connected areas) to participate in the labor market and access other facilities such as hospitals, childcare, schools, etc. [
21].
Finally, it is worth emphasizing the fact that this mixed approach has to be customer orientated, and in this framework one major variable that needs to be taken into account is information technology. Successful public transport services in leisure mobility nowadays require new ways of marketing. The target groups must be identified at their destination, as must the transmission of information to these groups via various channels. These means of communication include web pages, telephone information, and the co-operation of institutions involved in the tourism market. All this could be crucial in improving the status of public transport in the leisure market segment [
4].
5. Conclusions
One condition for the development of regional tourism is the presence of a transport infrastructure suited to tourist needs, which is complemented by the satisfactory provision of transport that meets the demands of tourist mobility. If the supply of public transport is insufficient for tourism, then private vehicle usage will become a determining factor in guaranteeing such mobility. Some authors have estimated that the use of the private automobile is the main contributor to the European Union’s environmental costs ([15, 2, 6]). In that context, this paper analyzes the possibility of introducing a tourist bus service to connect Lanzarote’s main tourist attractions in order to make the current mobility model more sustainable. From a theoretical point of view, if tourism on Lanzarote Island is to contribute to a low-carbon economy, any reasonable policy to reduce private vehicle usage should be implemented.
The rapid growth in tourism and collateral services on Lanzarote Island (e.g., surface transport) means that the current mobility model is unsustainable from an environmental and social perspective. Excessive private car usage produces two unwanted effects: it makes public transport inefficient and produces high levels of emissions that are bad for the environment. The number of motorized vehicles per inhabitant on Lanzarote Island exceeds the “acceptable” international benchmark. This produces excessive car hire for tourist mobility. Furthermore, the current Lanzarote bus network is clearly insufficient to satisfy tourist travel demands while, at the same time, prevents rural residents taking full advantage of social opportunities on the island.
In order to change this scenario, policymakers must introduce a wide range of measures and intervene in the transport market to create a more sustainable situation. For instance, the government may introduce subsidies for cleaner modes of transport and any restrictions to the use of private vehicle. This could be a way to encourage public transport and discourage private car usage. This, at least in theory, would make public transport economically more sustainable. At the same time, the government may be able to approach a “socially optimum situation” by trading off the economic gains from tourism with the enhancement of mobility for rural residents and a reduction in carbon dioxide emissions. Small territories that are highly dependent on tourism may not be able to survive the consequences of a heavy market intervention. Hence, this paper has explored a soft policy to make tourist mobility more sustainable on Lanzarote Island and at the same time to mitigate negative economic effects.
Despite UNESCO declaring Lanzarote a Biosphere Reserve, there is still a much higher density of private car on Lanzarote Island than recommended by the European Union. One reason for this high figure is the inadequate public transport service, especially regarding its frequency. In order to improve these deficiencies, the creation of a tourist bus route that travels to the island’s key places of tourist interest has been proposed. Using the data for 2014, a minimum quota for emissions produced by tourists has been estimated; this includes visits to five of the island’s most important tourist attractions, the distribution of tourist accommodation, and the proportions of the modes of transport used by the visitors. According to our calculations the total CO2 emissions are at least 7626.801 tonnes. Different alternatives, consisting of a bus circuit for the places of tourist interest along with various subcircuits that take tourists from their resorts to the main circuit, have subsequently been designed.
The levels of pollution produced for the present system, and the combination of this and the tourist route are compared, and different levels of demand for the new circuit are considered. We conclude that in order to reduce the current levels of emissions by around 15%, some 19.4% of the tourists that currently use hire cars would have to switch to the new tourist bus service. However, we to keep in mind that the challenger is to meet the requirements of COVID-19 and, at the same time, to promote the use of public transport. There is a need to research on adaptations elements.
Possible follow-up work to this paper might include an assessment of the introduction of the new tourist bus service upon other socioeconomic aspects, such as rural residents being able to access opportunities and services provided by the two large urban centers. Better-remunerated jobs and more employment options, as well as potentially more rapid and high-quality medical attention, are positive aspects in any cost–benefit analysis of the introduction of a multifunctional tourist bus service.
Author Contributions
Conceptualization, R.R.M.-C. and P.P.R.S.; methodology, R.S.V. and R.R.M.-C.; software, R.S.V.; validations, R.R.M.-C., R.S.V. and P.P.R.S.; formal analysis, R.R.M.-C., R.S.V. and P.P.R.S.; investigation, R.R.M.-C., R.S.V. and P.P.R.S.; writing-original draft preparation, R.R.M.-C., R.S.V. and P.P.R.S.; writing-review and editing, R.R.M.-C. All authors have read and agreed to the published version of the manuscript.
Funding
This research received no external funding.
Institutional Review Board Statement
The study was conducted according to the guidelines of the Declaration of Helsink, and approved by the Institutional Review Board.
Informed Consent Statement
Not applicable.
Data Availability Statement
Acknowledgments
We want to give thanks to the Las Palmas University to use their infrastructure for this research.
Conflicts of Interest
The authors declare no conflict of interest.
References
- Hall, D.R. Conceptualising tourism transport: Inequality and externality issues. J. Transp. Geogr. 1999, 7, 181–188. [Google Scholar] [CrossRef]
- Gössling, S. Global environmental consequences of tourism. Glob. Environ. Chang. 2002, 12, 283–302. [Google Scholar] [CrossRef]
- Chapman, L. Transport and climate change: A review. J. Transp. Geogr. 2007, 15, 354–367. [Google Scholar] [CrossRef]
- Gronau, W.; Kagermeier, A. Key factors for successful leisure and tourism public transport provision. J. Transp. Geogr. 2007, 15, 127–135. [Google Scholar] [CrossRef] [Green Version]
- Becken, S.; Simmons, D.G.; Frampton, C. Energy use associated with different travel choices. Tour. Manag. 2003, 24, 267–277. [Google Scholar] [CrossRef]
- Dickinson, J.; Robbin, D.; Fletcher, J. Representation of transport: A rural destination analysis. Ann. Tour. Res. 2009, 36, 103–123. [Google Scholar] [CrossRef]
- Directive 2008/50/EC. Policy Document: Ambient Air Quality and Cleaner Air for Europa 2008. 2019. Available online: http://eur-lex.europa.eu/legal-content/en/ALL/?uri=CELEX:32008L0050 (accessed on 17 September 2021).
- Gutiérrez, A.; Miravet, D. The determinants of tourist use of public transport at the destination. Sustainability 2016, 8, 908. [Google Scholar] [CrossRef]
- Storchmann, K.-H. The impact of fuel taxes on public transport—An empirical assessment for Germany. Transp. Policy 2001, 8, 19–28. [Google Scholar] [CrossRef]
- Verbeek, D.; Mommaas, H. Transitions to sustainable mobility: The social practices approach. J. Sustain. Tour. 2008, 16, 629–644. [Google Scholar] [CrossRef]
- Guiver, J.; Lumsdon, L.; Weston, R.; Ferguson, M. Do buses help meet tourism objectives? The contribution and potential of scheduled buses in rural destination areas. Transp. Policy 2007, 14, 275–282. [Google Scholar] [CrossRef]
- Robbins, D.; Dickinson, J. Can domestic tourism growth and reduced car dependency be achieved simultaneously in the UK? In Tourism and Climate Change Mitigation: Methods, Greenhouse. Gas Reductions and Policies; Peeters, P., Ed.; Stichting NHTV Breda: Breda, The Netherlands, 2007; pp. 169–188. [Google Scholar]
- Lumsdon, L.M. Factors affecting the design of tourism bus services. Ann. Tour. Res. 2006, 33, 748–766. [Google Scholar] [CrossRef]
- Szymańska, E.; Panfiluk, E.; Kiryluk, H. Innovative solutions for the development of sustainable transport and improvement of the tourist accessibility of peripheral areas: The case of the Białowieża forest region. Sustainability 2021, 13, 2381. [Google Scholar] [CrossRef]
- Marek, W. Will the consequences of COVID-19 trigger a redefining of the role of transport in the development of sustainable tourism? Sustainability 2021, 13, 1887. [Google Scholar] [CrossRef]
- Gobierno de Canarias. Anuario Estadístico de Canarias; Gobierno de Canarias: Las Palmas, Spain, 2014. [Google Scholar]
- Department of Transport. Traffic Appraisal Manual; Department of Transport: London, UK, 1991.
- Rendeiro Martín-Cejas, R.R.; Ramírez Sánchez, P.P. Ecological footprint analysis of road transport related to tourism activity: The case for Lanzarote Island. Tour. Manag. 2010, 31, 98–103. [Google Scholar] [CrossRef]
- Ramírez Sánchez, P.P.R.; Ndiaye, A.B.; Rendeiro Martín-Cejas, R.R. Plug-in hybrid electric vehicles (PHEVS): A possible perverse effect generated by environmental policies. Int. J. Transp. Dev. Integr. 2019, 3, 259–270. [Google Scholar] [CrossRef]
- Fullerton, D.; West, S. Tax and subsidy combinations for the control of car pollution. Tax Subsid. Comb. Control Car Pollut. 2000, 2000, 1–33. [Google Scholar] [CrossRef]
- Church, A.; Frost, M.; Sullivan, K. Transport and social exclusion in London. Transp. Policy 2000, 7, 195–205. [Google Scholar] [CrossRef]
- Smith, M.J.; Goodchild, M.F.; Longley, P.A. Geospatial Analysis. A Comprehensive Guide to Principles, Techniques and Software Tools; Troubador: Leicester, UK, 2007. [Google Scholar]
- Määttä-Juntunen, H.; Antikainen, H.; Kotavaara, O.; Rusanen, J. Using GIS tools to estimate CO2 emissions related to the accessibility of large retail stores in the Oulu region, Finland. J. Transp. Geogr. 2011, 19, 346–354. [Google Scholar] [CrossRef]
- Mavoa, S.; Witten, K.; Mccreanor, T.; O’Sullivan, D. GIS based destination accessibility via public transit and walking in Auckland, New Zealand. J. Transp. Geogr. 2012, 20, 15–22. [Google Scholar] [CrossRef]
- Wang, C.; Chen, N. A GIS-based spatial statistical approach to modelling job accessibility by transportation mode: Case study of Colombus, Ohio. J. Transp. Geogr. 2015, 45, 1–11. [Google Scholar] [CrossRef]
- Scott, D.; He, S. Modeling constrained destination choice for shopping: A GIS-based, time-geographic approach. J. Transp. Geogr. 2012, 23, 60–71. [Google Scholar] [CrossRef]
- Kelly, J.; Haider, W.; Williams, P.W. A behavioural assessment of tourism transportation options for reducing energy consumption and greenhouse gases. J. Travel Res. 2007, 45, 297–309. [Google Scholar] [CrossRef]
- Rendeiro Martín-Cejas, R.R. The environmental impact caused by road access to Timanfaya Natural Park on Lanzarote Island. Transp. Res. Part D Transp. Environ. 2015, 41, 457–466. [Google Scholar] [CrossRef]
- GRAFCAN. Cartografía de Canarias. Available online: http://www.grafcan.com/ (accessed on 17 September 2021).
- Preston, J. Epilogue: Transport policy and social exclusion—Some reflections. Transp. Policy 2009, 16, 140–142. [Google Scholar] [CrossRef]
| Publisher’s Note: MDPI stays neutral with regard to jurisdictional claims in published maps and institutional affiliations. |
© 2021 by the authors. Licensee MDPI, Basel, Switzerland. This article is an open access article distributed under the terms and conditions of the Creative Commons Attribution (CC BY) license (https://creativecommons.org/licenses/by/4.0/).


