Article

Smart and Sustainable Aquaculture Farms

1
Novaton, Sperletweg 59, 8052 Zürich, Switzerland
2
Civil and Geo-Environmental Laboratory (LGCgE), Lille University, 59000 Lille, France
*
Author to whom correspondence should be addressed.
Sustainability 2021, 13(19), 10685; https://doi.org/10.3390/su131910685
Submission received: 29 June 2021 / Revised: 19 September 2021 / Accepted: 23 September 2021 / Published: 26 September 2021

Abstract

:
This paper presents the design and construction of a smart and sustainable fish farm. The farm is based on the hybrid aquaculture concept that combines the advantages of the recirculation aquaculture system (RAS), the zero-water discharge (ZWD), and smart technology. The system’s smartness consists of using the latest technology, including monitoring and automation, ensuring zero water discharge, good water quality, reduced energy consumption, and high biosecurity. In addition, the system does not use chemicals in the aquaculture process. The paper describes the design of this system, including the hydraulic system, the smart monitoring system, the feeding regime, and the control of the biological parameters. Tests conducted in Tabuk, Saudi Arabia, showed high performance of this system with around 90% survival rate. In addition, observations showed the system’s capacity to maintain the water quality parameters within the optimal water quality ranges, reduce energy consumption, and sustain efficient shrimp waste recycling.

1. Introduction

Fish and seafood proteins are essential for human wellbeing and health. An adult consumes about 20.5 kg of fish per year. Up to recent years, the majority of fish was caught from the seas and oceans. According to the World Wildlife Fund (WWF), in the last 40 years, global marine life has been reduced by half [1]. Nadarajah and Flaaten [2] reported that, since 1950, 90% of the commonly captured fish have disappeared from the ocean. However, recent effective fishery management tools have improved fish stock status in specific regions, indicating the success of regulations and reduced fishing pressure strategies in regions that have implemented them [3].
Meanwhile, as wild stocks improve, wild caught fish are increasingly becoming polluted by plastics, metals, chemicals, and waste dumped in the sea. This pollution constitutes a menace for all marine resources [4]. Aquaculture includes a valuable alternative to seafood protein supply, producing fish under controlled conditions without the risk of pollutants affecting the stock, as is the case with wild fisheries [5].
The aquaculture industry has experienced exceptional growth. With the improvements in RAS and ZWD technologies, the amount of aquaculture farms is on the rise. According to the most recent FAO report [6], aquaculture has been vital in meeting seafood demands for human consumption. It has produced over 52% of the seafood consumed by humans, making wild caught fish only 48% of our diet. Nonetheless, wild caught fish still make up 54% of the total seafood production, with aquaculture steadily growing behind with 46% of the total global seafood production. The global aquaculture of farmed aquatic animals grew on average by 5.3% per year in the period 2001 to 2018. Total fish production is expected to expand from 179 million tonnes in 2018 to 204 million tonnes in 2030. Aquaculture production is projected to reach nearly 109 million tonnes in 2030, an increase of 32% from 2018. The majority, 62%, of the global aquaculture production in 2030 will be composed of freshwater species such as carp and catfish. In addition, the production of higher-value species such as shrimp, salmon, and trout are also expected to grow.
Despite the significant development in the aquaculture industry, it still faces significant challenges, including (i) excessive new water use, (ii) extensive use of chemicals, which have harmful effects on the environment and ecosystem, and (iii) poor management of fish farms, which causes significant losses in aquaculture [7]. According to a report published by the Sustainable Fisheries Partnership (SFP) Foundation, 42% of fish farms are poorly managed as they produce unhealthy food infected with viruses [7], which could mutate and leap from fish to humans [8]. Often, fish are kept in high concentrations, which results in a low growth rate and increased feed conversion ratio (FCR), i.e., higher cost and increased risks for disease transfer.
Recent research has been conducted to improve the quality and performance of the aquaculture industry. Genetics research resulted in a genetically engineered species of fish with higher reproductive and breeding abilities. However, they suffer from low nutrition and are less likely to survive than wild fish [9]. Improved feeding systems were designed with automatic fish feeders and Machine Learning to optimize the feeding regime [10]. Alternative technologies were also developed to enhance disease control without using chemicals or antibiotics [11]. Ullah and Kim [12] used the Internet of Things (IoT) in aquaculture farms for real-time monitoring and efficient management of the water level and pumping functions, but their system did not integrate automation. Previous research has allowed progress in aquaculture practices. However, according to [13], the aquaculture industry still needs a comprehensive solution to achieve an environmentally friendly solution for fish, humans, and the planet. This paper is aimed at filling this gap by the design and implementation of a smart aquaculture farm that ensures high-quality products in an eco-friendly environment because of the efficient shrimp waste recycling carried out. The farm is based on smart monitoring of the farm components and fish environment, and farm automation. The system being used combines RAS and ZWD technologies, combining the best parts of the two standalone systems. The paper presents the research methodology, the aquaculture farm design, and the feedback of its implementation.

2. Methodology

The research presented in this paper is based on (i) a state-of-the-art in aquaculture biology, mechanical engineering, and intelligent technology; (ii) discussion with companies and experts working in the field of aquaculture; and (iii) integration of smart technology, including the use of smart monitoring and automation in the aquaculture farms.
This investigation resulted in the determination of technical specifications for a new generation of aquaculture farms that use the latest technology and innovation to build efficient and sustainable farms focusing on the quality of fish, efficiency, and respect for the environment. These specifications are in line with FAO recommendations for modernized farms [14]. The specifications of concern are: (1) the water recycling process, (2) bio-loop technology, (3) optimal water parameters, (4) fish waste management, (5) biosecurity level, (6) reduced energy consumption, (7) use of the latest digital technology. The following sections will present this new generation of aquaculture farms and the first step of its construction.

3. Aquaculture Farm Concept and Design

3.1. General Concept

The aquaculture industry uses two types of closed systems: (i) the recirculation aquaculture system (RAS) and (ii) the zero-water discharge (ZWD) or biofloc system [15]. The principle of RAS is the treatment of effluent culture water through a series of continuous processes: (i) filtration, including physical and mechanical filtration (using protein skimmers for fine particulate organic/protein matter removal and activated carbon filters for the absorption of possibly toxic substances) and biofiltration units (using biofilters for toxic ammonia and nitrite removal); (ii) disinfection; and (iii) oxygenation before being reinjected into the rearing basin. Even though the RAS can maintain stable water quality for long periods, its operational cost, specifically electricity consumption, makes this system less attractive for farm use. On the other hand, in ZWD or biofloc systems, the culture water is maintained using the addition of microbial management cycles in the shrimp basin. Therefore, the microbial consortium can be functional in the nutrient cycle for water purification, bacterial control, and feed supplementation [16].
In the ZWD system, the water quality is maintained through microbial activity, including (i) Bacillus megaterium to enhance the rate of ammonification from accumulated organic matter; (ii) nitrification bacteria to convert toxic ammonia into less toxic nitrate; and (iii) the microalgae Chaetoceros muelleri to uptake nitrate, improve the dissolved oxygen (DO) level, provide shading, and act as a source of live feed for shrimp culture. However, even though the operational cost to maintain water quality in a ZWD system is relatively low, the system’s capacity is insufficient to support a long period of super-intensive shrimp/fish culture [17]. Therefore, there is a need for a hybrid farm system that combines the advantages of both the RAS and the ZWD system.
The proposed farm concept is based on the hybrid system. Figure 1 and Figure 2 show the architecture of this system. It is composed of the following components: (1) Reservoir basin to reserve and prepare the culturing water from the water source; (2) Fish culture basins, each equipped with an aeration system; (3) Biofilter basin aerated and inoculated with a bacterial nitrification consortium to degrade ammonia and nitrite in the effluent water [17]; (4) Heat exchange basin to heat and maintain the temperature of the culturing water if needed; (5) Sedimentation basin equipped with a filter carpet for the physical filtration of effluent water; (6) Protein skimmer to remove delicate organic particulate matter; (7) Activated carbon basin to remove metal contaminants and impurities; (8) Water recycling basin to recycle the overload water and reserve the water while harvesting; (9) Sludge basin to gather sludge and prepare it for the treatment process.

3.2. Farm Management

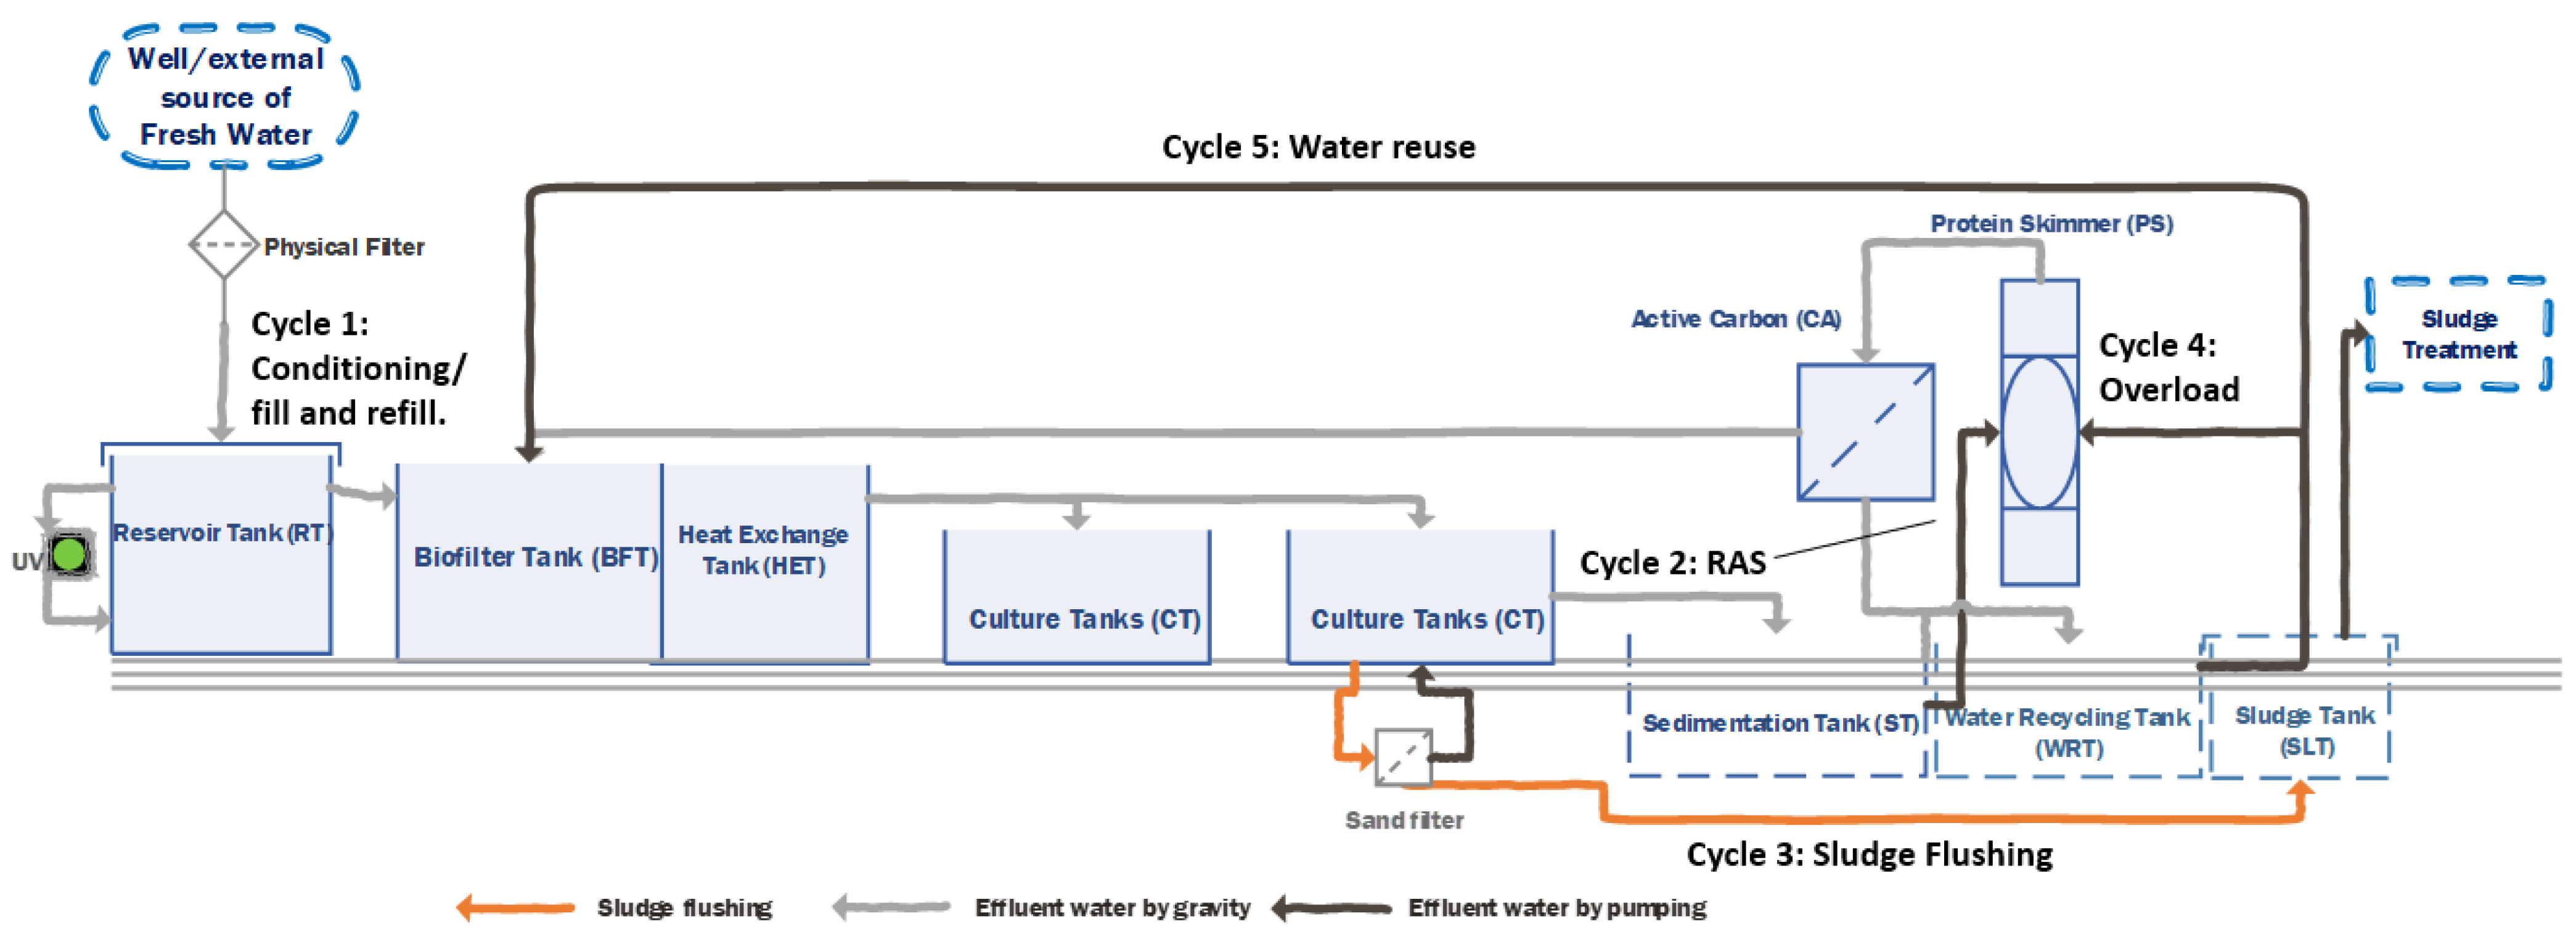
Hydraulic System and Water Flow

The hydraulic system is illustrated in Figure 2. It is composed of: (1) Physical filter to clean the water from particles coming from the source of water; (2) UV light for the disinfection of the water before entering the system; (3) Pipe network to connect the different kinds of basins and filters; (4) Sand filter to trap the sludge particles and send it to the sludge basin; (5) Two pumps, to pump the water from sedimentation basin and water recycling basin to the protein skimmer and biofilter basin; (6) Heat exchanger to heat the water to the optimum degree before it goes to the culture basins.
Each basin’s specifications meet the aquaculture biology requirements (non-toxic, regulated containers). The biofilter basin is divided into three chambers. Forty tons of limestone (calcium carbonate, 3–4 cm in diameter) were used in the biofilter for the nitrification bacteria to become established as a biofilm. Limestone gravel has an acid buffering capacity due to acidification from organic acid released during decomposition [17]. In addition, spherical black plastic 32mm bio-balls were added to cover the biofilter surface area to improve the nitrifying bacteria’s performance by reducing light in the biofilter and enlarging the surface area for the entrapment of fine suspended particulate entering the biofilter. The heat exchange basin is equipped with an electric heat exchanger to maintain the water temperature at 28 ± 2 °C.
Several water cycles are used to optimize the function of the proposed hybrid system. A hydraulic pipe network is used to serve the daily culture water recycling ratio of 200%. It can be automated by adding connected accessories. Starting from Cycle 1, gravity transfers filtered and UV disinfected seawater from the reservoir basin to the biofilter basin. In the lab of Novaton, Tabuk, Saudi Arabia, microbial components were prepared and sent to be added to the water of the biofilter. It consisted of (1) a chemoautotroph nitrifying bacterial consortium of ammonia oxidizing bacteria (AOB) and nitrifying oxidizing bacteria (NOB), (2) the heterotroph B. megaterium, and (3) the photoautotrophic marine diatom C. muelleri [18]. After conditioning the biofilter and activating the nitrifying bacteria, the biofilter was considered ready to transfer the water to the culture basins by gravity. Ten-day-old post larvae (PL10) Litopenaeus vannamei shrimp were added to the culture basins at a density of 400 Pl/m3 [18]. The shrimp basin was used as a ZWD system for 20 days.
Water was added weekly from the reservoir basin at 10% of the total culture volume to compensate for water losses due to evaporation. Based on weekly bacterial plate counts, it is possible to deduce the amounts of inoculums (microbial components 1–3) needed to compensate for the dilution due to the addition of new water into the system. When the ammonia and nitrite levels in the culture water have reached above 0.5 ppm, the water quality was improved through the hybrid system that is Cycle 2. Cycle 2: In the hybrid ZWD–RAS system, the effluent water was transferred from the shrimp basin into the sedimentation basin by gravity before being pumped into the protein skimmer and then the activated carbon filter basin for the removal of organic particulates. Subsequently, the water is then treated using a biofilter for ammonia and nitrite removal before being transferred back into the shrimp culture basin [18]. The schematic overview of the hybrid ZWD–RAS system is presented in Figure 2 (found above). The recirculation rate increased from 85% to 200% of the daily water renewal rate during the 120-day culture period. Cycle 1 is run weekly, Cycle 2 is run when the shrimp begin to increase in size, releasing more waste, and the ZWD system becomes insufficient in cleaning the system (20-day mark). As of then, Cycle 2 is run daily with an increased recirculation rate as the shrimp size increases. Cycle 2 may be stopped, and the system may return to pure ZWD when the ammonia and nitrite levels in the culture basin have returned to below 0.5 ppm. The ZWD system can then maintain the system for a short amount of time before the RAS system must be applied again. This reduces the amount of energy the RAS system would use if it was run 24 h a day. Cycle 3: A network consisting of pipes and sand filters has been prepared to flush the sludge daily from the culture basin to the sludge basin where it was being treated. Cycle 4: Overloaded water can be recycled through the protein skimmer and active carbon filter many times if the system is overloaded. Cycle 5: during the harvesting process, culture water flows to the water recycling basin until harvesting is finished. It is then pumped back to the culture basins after being examined and deemed reusable for culturing.

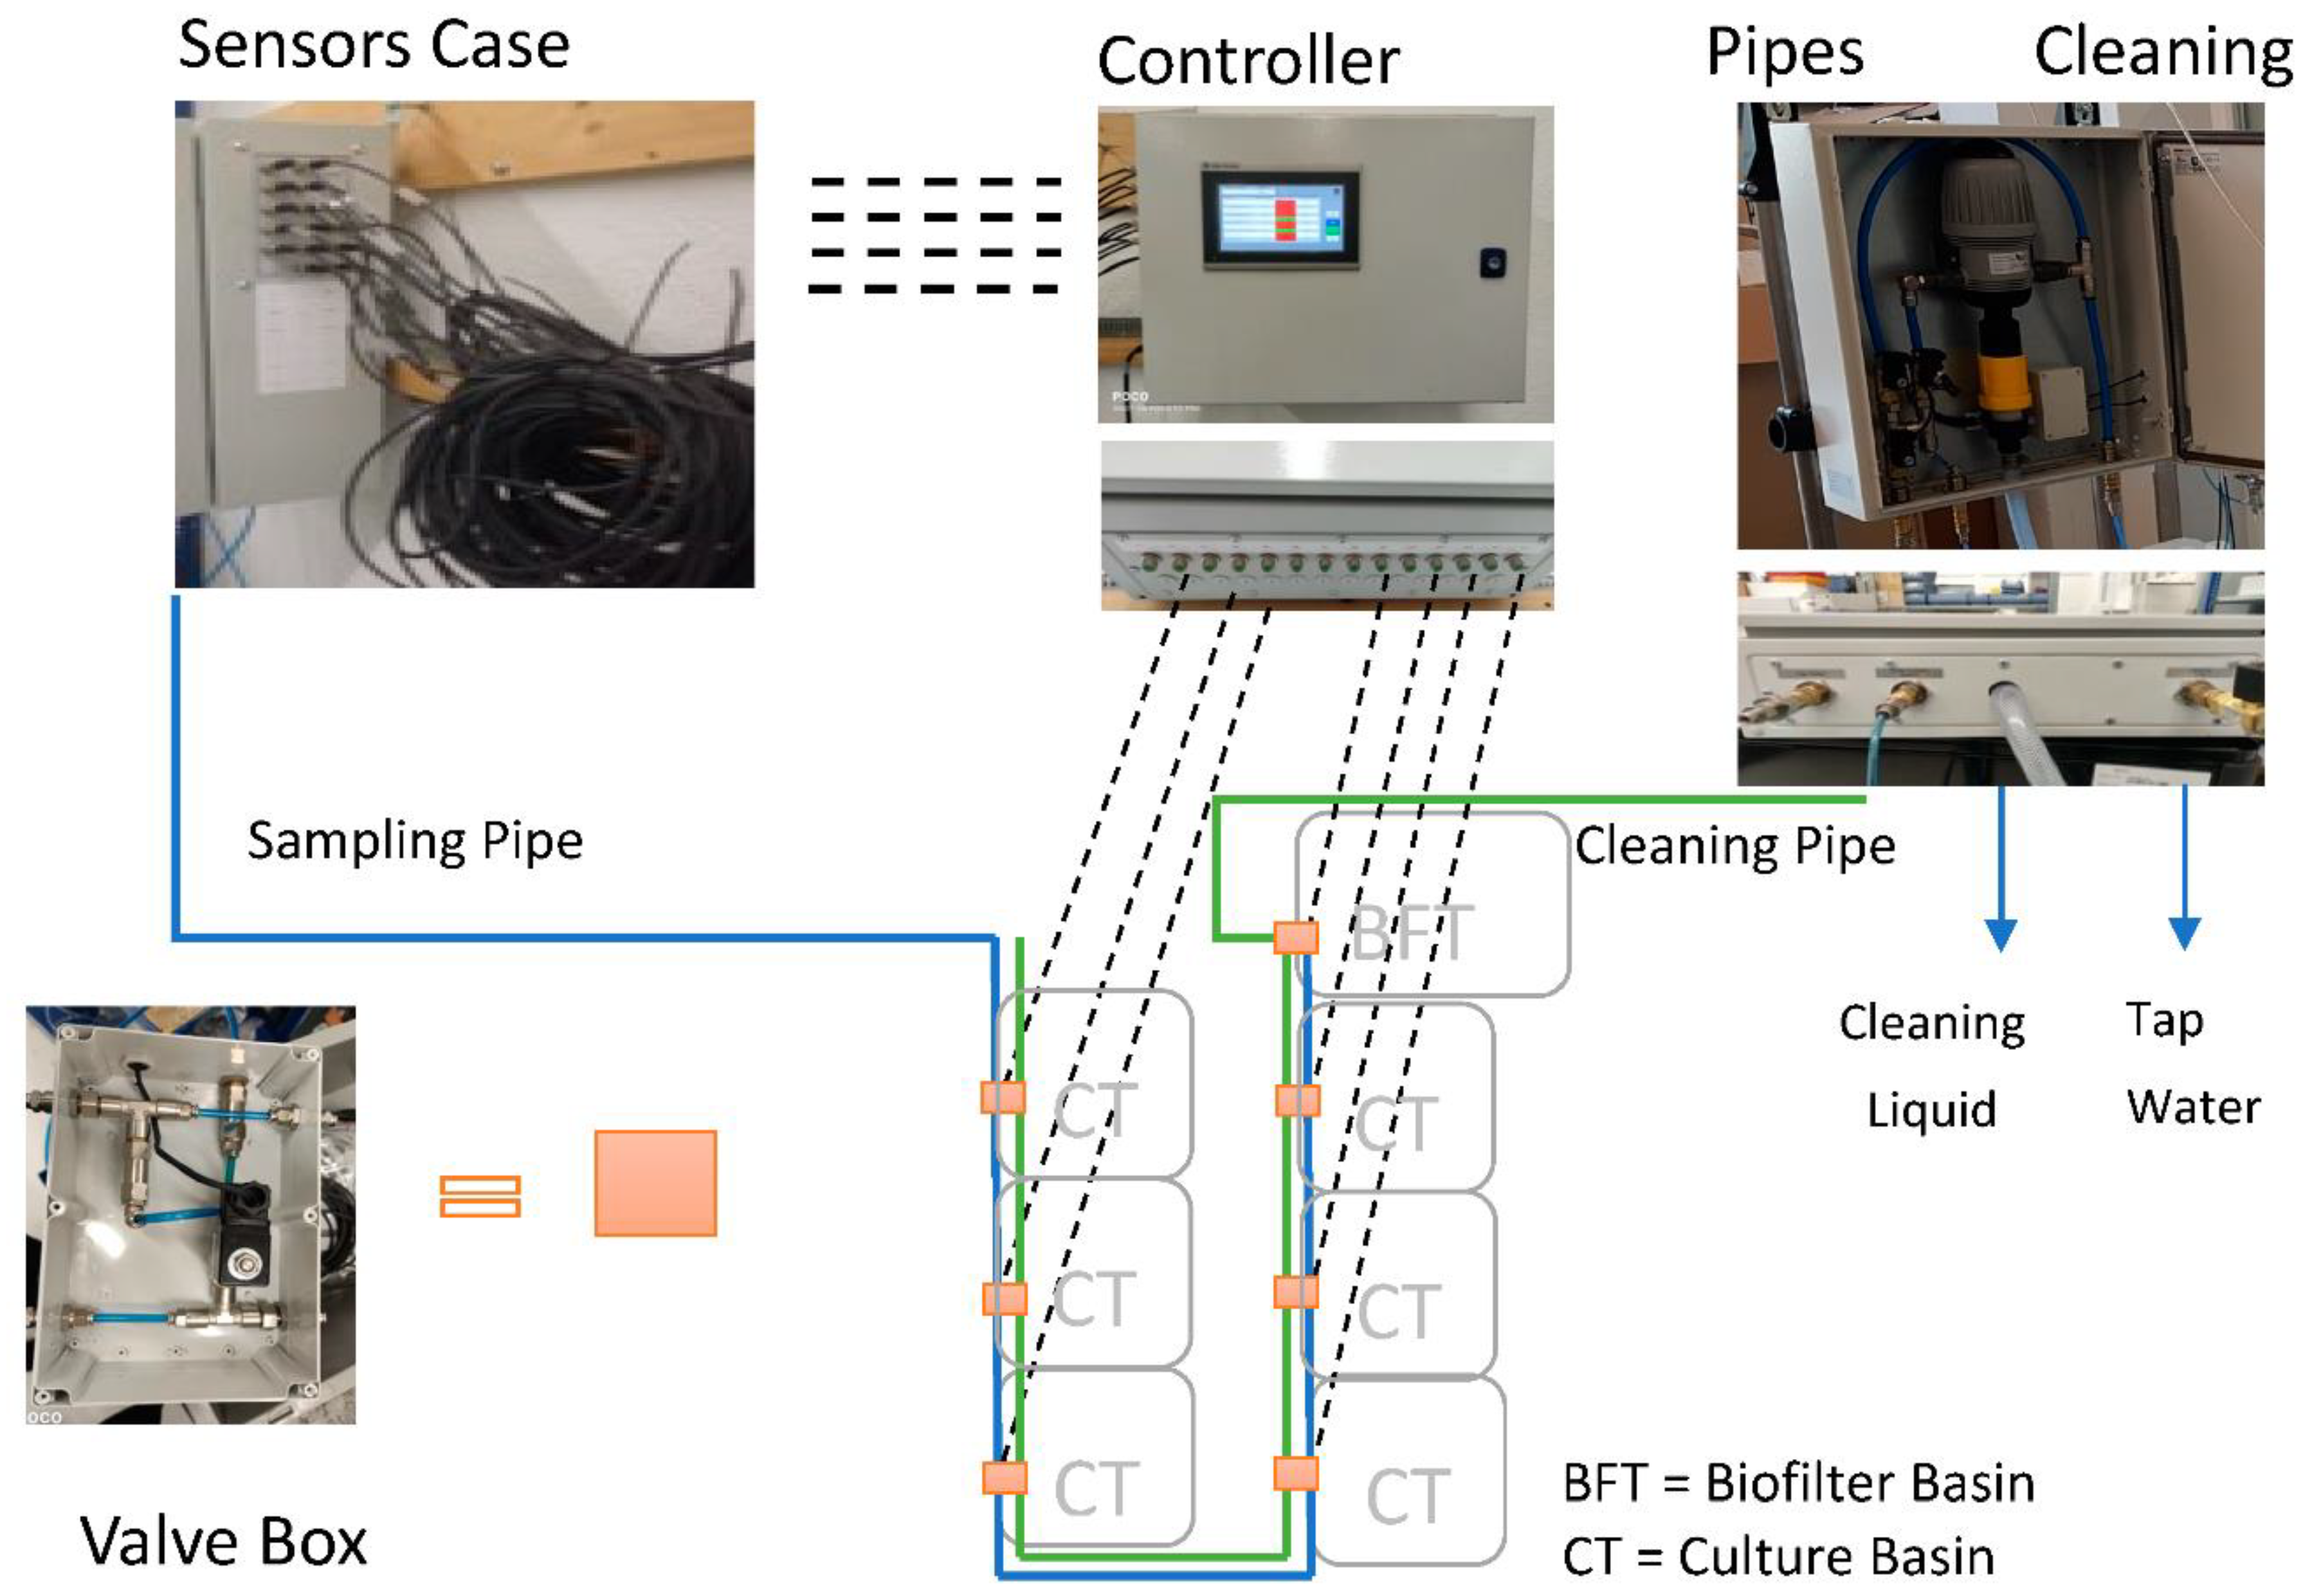
3.3. Monitoring System

Architecture

Figure 3 shows the architecture of the monitoring system. It is composed of three components. The first component is aimed at monitoring the vital water parameters. The second component concerns monitoring the water sampling inlets from the sampling water pipes connected to different basins (controlled independently by valve boxes at each basin). The third component corresponds to the pipes’ cleaning case. It includes an outlet of cleaning liquid (citric acid) and tap water connected to the sampling pipes. The role of the pipes’ cleaning is to ensure the accuracy of each new sample, so cleaning liquid and tap water are flushed through the sampling pipe after each water sample is taken. This takes place in each pipe; the system is automated to clean the pipe’s valve so that no tap water or cleaning fluid is let into the culture basins. The sensors’ case also holds a separate cleaning mechanism, which flushes the sensors with fresh water and recalibrates them. The specific sensors used are not listed in order to not cause unwanted replication of the monitoring system sold by Novaton.
The water and aeration pipes networks were designed for the optimal flow using pumps and valves, as seen in Figure 4. In addition, aeration was uniformly placed in the culture basins to ensure good aeration, which is crucial to achieving high survivability rates.
The monitoring system monitors the water quality parameters, including ammonia and nitrite levels. It includes an internal and external cleaning mechanism to ensure accuracy and promote the longevity and durability of the sensors/pipes. The total run time of the system for one sample depends on the distance traveled by the water sample in the sampling pipe to reach the controller and sensors’ case. For an average distance of 25 m, the entire run of the system is about 2 h, including cleaning.
Compared to the commercial monitoring system, the proposed monitoring system provides the following advantages: (1) the use of a centralized monitoring system allowed substantial cost reduction by replacing sensors used for each basin with a centralized system; (2) high accuracy, due to the automated sampling and cleaning of the monitoring system; the system may be run non-stop to ensure multiple samplings per basin per day, increasing the reliability of collected data; (3) lower labor, due to the automation aspect of our monitoring system, after the initial set-up labor, little to no labor is needed to run the system; (4) large parameter coverage; the proposed system ensures monitoring of all water quality parameters needed to ensure the shrimp’s environment stays healthy; other commercially available water monitoring systems lack critical sensors such as an ammonia sensor.

3.4. Monitoring Process

The system monitors the fluid through sampling at defined intervals and measures the water quality parameters such as Ammonia, Nitrite, pH, Total Vibrio, Alkalinity level, Diatom, Temperature, Salinity, and Dissolved Oxygen. Each water quality parameter must be in the optimum range to ensure a good quality of the white shrimp culture. Table 1 shows the optimum range for each water quality parameter and the actions to be taken when a parameter violates the optimum range.

3.5. Feeding Regime

The daily feed is based on the following equation [19]:
Daily Feed(g) = SD × MBW × FR × SR
where SD is the initial stocking density, MBW is the average mean body weight of shrimp (gram), SR is the estimated survival rate (%), and FR is the feeding rate (%).
Table 2 shows the feeding regime according to the shrimp mean body weight (MBW). It includes feeding at 07.00 a.m., 10.00 a.m., 01.00 p.m., 04.00 p.m., and 08.00 p.m. The feeding regime has been controlled and managed based on a feeding tray monitoring evaluation. We added feed based on over-residual feed on the feeding tray to monitor shrimp feeding, as described in Table 3.
Shrimp sampling was conducted every two weeks to evaluate the biological parameters, including shrimp growth and survival. At the end of the grow-out period, the final total shrimp biomass was measured. In addition, the shrimp specific growth rate (SGR) and survival, as well as feeding efficiency in terms of Feed Convention Ratio (FCR), were also calculated using the following formulas [19]:
Mean Body Weight (gr) = W/ΔN
where W is the weight of shrimp and total shrimps.
Survival (%) = Nt/N0 × 100%
N0 is the initial shrimp number, Nt is the final shrimp number, and t is the culture period (day).
Specific growth rate (%) = [Ln(W2 − W1)/(T2 − T1) × 100%]
where W1 is initial body weight (g) at time T1 (day), and W2 is final body weight (g) at the time T2 (day).
Feed Convention Ratio (FCR) = ΣWfeed/ΔW × 100%
where ΣWfeed is the total feed given during culture (g) and ΔW is the total weight of shrimp in each basin (g).
Biomass (gr) = Density × Average ΔW
where ΔW is total weight of shrimps.

4. Implementation, Results, and Discussion

The system was set up and tested for one year at Novaton’s Aquaculture Farm in Tabuk, Saudi Arabia. The farm consisted of 6 culturing basins with a total volume of 360 m3 and an additional 25–30% (100 m3) of the culturing volume being found in the biofilter. Important security measurements were taken to ensure the facility’s biosecurity. It included creating restricted access culture areas and applying strict protocols such as hair nets, gloves, and masks to ensure the biosafety of the shrimp and reduce the risk of transferable diseases.

4.1. Water Quality

Figure 5 shows the water quality parameters as measured in the culture basins and the biofilter basin. The green area refers to the optimum range, while the yellow site refers to the tolerance range. The red area indicates the danger range. It could be observed that the totality of the water quality parameters was at the optimal level during the shrimp culture. However, an increase in ammonia, NH3, and nitrite, NO2, is observed on the 22nd day. This increase was used as a signal for the recycling treatment because the ZWD system could not ensure the water treatment without the recycling system’s assistance. Another increase in nitrite, NO2, was observed on the 48th day in the biofilter basin. This is due to the dissolving of settled particles in the pipes in the absence of water flow. This problem has been solved by reducing the pipe diameter and increasing the percent of the nitrifying bacteria in the water, as advised by Suantika et al. in [17,18,19]. Despite these two issues, all water quality values remained in the tolerance range. After modifying the pipe’s diameter and the flow correction, the farm maintained the water quality in the optimal range.

4.2. Shrimp Growth Rate

Shrimp sampling was carried out on all 6 culture basins operating the ZWD–RAS hybrid system; 30 samples were taken from each basin from Week 4 to Week 13. An example of the samples taken on Week 9 showing specific growth rates (SGR) is shown in Table 4. The average growth rate from Week 4 to Week 13, and statistical analysis, can be found in Table 5 and Figure 6.

4.3. Feed and Post-Larval Shrimp (PLs) Used

The feed and PLs were supplied locally from KSA. Details of the composition can be found in Table 6. To our knowledge, using feed with high crude protein percentages is theoretically supposed to increase the overall quality of the shrimp. PLs 15 vannamei (15 days since hatched) were also provided by the local authorities hatcheries; 118,000 PLs were delivered to the location. The PLs were observed to be non-uniform, which can be a factor in causing cannibalism at a later stage of growth and affecting economic yields and survival rates.

4.4. Energy Consumption and Global Cultivation

The farm design uses gravity for the water flow to save energy consumption. Consequently, the energy consumption is mainly related to water heating and hangar air, as well as air blowers, pumps, the protein skimmer, and lighting. The measured energy saving was 27%. This energy-saving can further be increased when seasonal cultivation takes place, reducing the amount of thermal energy needed to heat the system. The proposed smart hybrid system allowed energy saving because water recycling does not operate over the culturing period. In addition, the system avoids the use of heavy filtration machines. The use of PV panels on the hangar roof will result in an additional reduction in the electrical demand. When the RAS cycle (Cycle 2) is active in the design proposed, only one pump is working. This increases the system’s simplicity, lowers the risk of failure from multiple components, and reduces energy consumption. Figure 7 sums up the reduction of energy consumed and how sustainable energy can be implemented to reach minimal costs and the lowest environmental impact.

4.5. Shrimp Quality

Figure 8 shows harvested shrimps. The transparent color of the shrimps indicates healthy and high-quality shrimp. The cultivation and recycling system produced shrimps without using chemicals or antibiotics. The shrimp waste was transferred outside the farm to be dried under the sun and used for chicken feed. Chickens show an excellent reaction to the food as a supplement feed that contains protein and minerals. Thanks to the treatment system, the cultivation system has minimal water discharge. It showed the ability to reuse the water in the second cycle with perfect conditions. This cultivation system proved to be an environmentally friendly system. The change from the traditional waste system managed to reduce wastewater from 3000 L to just 30 L per day, as explained in Figure 9.

4.6. Initial Costs of Investments and Operational Costs

In this section of the article, the authors would like to elaborate on the initial costs of investments and operational costs of this novel prototype farm. The financial model presented is based on pricing in the Kingdom of Saudi Arabia, although the currency is converted into USD for global comparison.
Table 7 lists the costs per kilo as a result of our experimental farm. The initial costs of investments would be lower as the project is scaled up to produce more. The results shown in Table 7 are based on the 17 ton-per-year prototype farm built in Tabuk, KSA.
Total cost of production per kilo of shrimp is drastically affected by the harvesting technique used; in this experiment, a three-steps harvesting scenario was adopted. The 1st harvest is at 90 days at 25% of the capacity at an average weight of 13 g. The 2nd would be at 105 days at another 25% of the overall capacity at 18 g. The remaining 3rd harvest at 120 days would be for the remaining 50% of the overall capacity at 23 g per shrimp.
The initial cost of investment includes the following: (i) Hangar and Admin Building, (ii) Plumping and Heating System, (iii) Smart Systems, (iv) Culture System, and (v) Project Management and Installations. The percentage of each initial cost of investment is shown in the pie chart in Figure 10.
Total fixed costs include the fixed variables pricing such as electricity and transportation costs. Detailed percentages in relation to the total fixed costs can be found in Table 7. Fixed costs are contrasted with variable operational costs such as fish feed and larvae seeds. The details and percentages of the variable operational costs are also depicted in Table 7 below.
Based on the selling price of USD 16.00 per kilogram of shrimp in Saudi Arabia, we estimate an ROI (Return on Investment) of 28.15%, with a PBP (Pay Back Period) of 2.9 years.
Based on these estimates, the authors can deduce that countries with similar or higher selling prices may use the technologies presented in this article for their financial advantage. Countries with a lower selling price may find it difficult to persuade potential stakeholders to invest heavily in a slow returning business.

5. Conclusions

This paper presented the design and construction of a smart and sustainable fish farm based on the hybrid aquaculture concept that combines the advantages of the recirculation aquaculture system (RAS) and zero-water discharge (ZWD). Sustainability concerns include protecting water quality, reducing energy consumption, biosecurity, and quality of the cultivated fishes. Smart technology was used to achieve farm sustainability through: (i) real-time monitoring of the water quality parameter and the cultivation process; (ii) the use of automation to ensure, without human intervention, an optimal cultivation process. The disadvantage of combining these two systems into one would be the loss of independence of the culture basins provided by a traditional ZWD (biofloc system). Furthermore, by connecting all the tanks, there is a higher risk of disease spreading to other tanks. This is mitigated by high biosecurity.
The performances of the system were investigated through its implementation in Tabuk, Saudi Arabia. Results showed (i) a high rate of shrimp survival rate (about 90%) without using chemicals, (ii) an efficient waste recycling, (iii) an excellent control of the water quality parameters, and (iv) reduced energy consumption.

Author Contributions

Conceptualization, T.K. and I.S.; data curation, T.K.; formal analysis, investigation, T.K.; methodology, T.K. and I.S.; project administration, T.K. and A.R.; supervision, I.S. and J.E.K.; validation, T.K. and I.S.; visualization, T.K.; writing—original draft, T.K.; writing—review and editing, I.S. and A.R. All authors have read and agreed to the published version of the manuscript.

Funding

This research received no external funding.

Institutional Review Board Statement

Not applicable.

Informed Consent Statement

No humans were involved as subjects in this study.

Data Availability Statement

Data from this research has been reported in this paper in the form of tables and figures. No external data library is used by the authors for this research.

Conflicts of Interest

The authors declare no conflict of interest.

References

  1. FAO. FAO Yearbook. Fishery and Aquaculture Statistics, 2017. Available online: http://www.fao.org/3/ca5495t/ca5495t.pdf (accessed on 27 June 2021).
  2. Nadarajah, S.; Flaaten, O. Global aquaculture growth and institutional quality. Mar. Policy 2017, 84, 142–151. [Google Scholar] [CrossRef] [Green Version]
  3. Hilborn, R.; Amoroso, R.O.; Anderson, C.M.; Baum, J.K.; Branch, T.A.; Costello, C.; De Moor, C.L.; Faraj, A.; Hively, D.; Jensen, O.P.; et al. Effective fisheries management instrumental in improving fish stock status. Proc. Natl. Acad. Sci. USA 2020, 117, 2218–2224. [Google Scholar] [CrossRef] [PubMed] [Green Version]
  4. Law, K.L.; Thompson, R.C. Microplastics in the seas. Science 2014, 345, 144–145. [Google Scholar] [CrossRef] [PubMed]
  5. Jiang, S. Aquaculture, capture fisheries, and wild fish stocks. Resour. Energy Econ. 2010, 32, 65–77. [Google Scholar] [CrossRef]
  6. FAO. The 2020 edition of The State of World Fisheries and Aquaculture. Nat. Resour. 2020, 35, 4–13. [Google Scholar]
  7. Veiga, P.; Mendes, M.; Lee-Harwood, B. Reduction Fisheries: SFP Fisheries Sustainability Overview 2018. Sustainability Fisheries Partnership. Available online: https://www.sustainablefish.org/Media/Files/Reduction-Fisheries-Reports/2018-Reduction-Fisheries-Report (accessed on 27 June 2021).
  8. Gauthier, D.T. Bacterial zoonoses of fishes: A review and appraisal of evidence for linkages between fish and human infections. Vet. J. 2015, 203, 27–35. [Google Scholar] [CrossRef] [PubMed]
  9. Glebova, I.A.; Larionova, A.A.; Zaitseva, N.A.; Grunina, A.A.; Chvyakin, V.A.; Takhumova, O.V.; Glagoleva, L.E. Organic Aquaculture as a Promising Direction for the Production of Organic Food. Ekoloji 2019, 28, 537–543. [Google Scholar]
  10. Farheen, U. Automatic Controlling of Fish Feeding System. Int. J. Res. Appl. Sci. Eng. Technol. 2018, 6, 362–366. [Google Scholar] [CrossRef]
  11. Suantika, G.; Pratiwi, M.I.; Situmorang, M.L.; Djohan, Y.A.; Muhammad, H.; Astuti, D.I. Ammonium Removal by Nitrifying Bacteria Biofilm on Limestone and Bioball Substrate Established in Freshwater Trickling Biofilter. Poultry Fish. Wild. Sci. 2016, 4, 1000157. [Google Scholar] [CrossRef] [Green Version]
  12. Ullah, I.; Kim, D.H. An optimization scheme for water pump control in smart fish farm with efficient energy consumption. Processes 2018, 6, 65. [Google Scholar] [CrossRef] [Green Version]
  13. Garlock, T.; Asche, F.; Anderson, J.; Bjørndal, T.; Kumar, G.; Lorenzen, K.; Ropicki, A.; Smith, M.D.; Tveterås, R. A Global Blue Revolution: Aquaculture Growth Across Regions, Species, and Countries. Rev. Fish. Sci. Aquac. 2020, 28, 1–10. [Google Scholar] [CrossRef]
  14. FAO. Aquaculture Newsletter, 2018. Available online: http://www.fao.org/3/i9200en/I9200EN.pdf (accessed on 27 June 2021).
  15. Avnimelech, Y. Control of microbial activity in aquaculture systems: Active suspension ponds. World Aquac.-Baton Rouge 2003, 34, 19–21. Available online: https://www.was.org/Magazine/Vol/34/4#.X4zuM9BKjIU (accessed on 1 August 2021).
  16. Muhammad, H.; Situmorang, M.L.; Djohan, Y.A.; Aditiawati, P.; Suantika, G. Biological, Technical, and Financial Feasibilities Study of Zero Water Discharge (ZWD) System Application in Low Salinity White Shrimp (Litopenaeus vannamei Boone) Urban Aquaculture, Study Case: Gresik District, East Java, Indonesia. J. Fish. Livest. Prod. 2016, 4, 1–11. [Google Scholar] [CrossRef] [Green Version]
  17. Suantika, G.; Situmorang, M.L.; Kurniawan, J.B.; Pratiwi, S.A.; Aditiawati, P.; Astuti, D.I.; Azizah, F.F.N.; Djohan, Y.A.; Zuhri, U.; Simatupang, T.M. Development of a zero water discharge (ZWD)—Recirculating aquaculture system (RAS) hybrid system for super intensive white shrimp (Litopenaeus vannamei) culture under low salinity conditions and its industrial trial in commercial shrimp urban farming in Gresik, East Java, Indonesia. Aquac. Eng. 2018, 82, 12–24. [Google Scholar] [CrossRef]
  18. Suantika, G.; Situmorang, M.L.; Nurfathurahmi, A.; Taufik, I.; Aditiawati, P.; Yusuf, N.; Aulia, R. Application of Indoor Recirculation Aquaculture System for White Shrimp (Litopenaeus vannamei) Growout Super-Intensive Culture at Low Salinity Condition. J. Aquac. Res. Dev. 2018, 9, 1–6. [Google Scholar] [CrossRef]
  19. Suantika, G.; Turendro, O.R.; Situmorang, M.L. Use of Nitrifying Bacteria for Promoting Giant Freshwater Prawn (Macrobrachium rosenbergii de Man) Nursery Phase in Indoor System. J. Fish. Livest. Prod. 2017, 5, 228. [Google Scholar] [CrossRef] [Green Version]
Figure 1. Scheme of the proposed hybrid ZWD–RAS system showing the components of each compartment in the proposed system.
Sustainability 13 10685 g001
Figure 2. Schematic overview of the hybrid ZWD–RAS system installed in Tabuk (Saudi Arabia).
Sustainability 13 10685 g002
Figure 3. Smart monitoring system.
Sustainability 13 10685 g003
Figure 4. Basins and pipe network (water and aeration).
Sustainability 13 10685 g004
Figure 5. Water quality parameters during the culture period.
Sustainability 13 10685 g005
Figure 6. Statistical analysis showing the growth in Week 14 and Week 15 at 13.16 grams and 14.43 grams respectively.
Sustainability 13 10685 g006
Figure 7. Energy consumption and reduction.
Sustainability 13 10685 g007
Figure 8. Harvested Shrimps from Cycle 1.
Sustainability 13 10685 g008
Figure 9. Shows the reduction of wastewater due to filtering and reusing effluent water, Cycles 3 and 4, explained earlier.
Sustainability 13 10685 g009
Figure 10. Initial Investment Cost Breakdown by Percentage of Cost.
Sustainability 13 10685 g010
Table 1. Water quality parameters monitoring and control.
ParameterOptimum RangeAction, If Water Quality Doesn’t Fall in the Optimum Range
Ammonia (ppm)<1Circulation through RAS
Nitrite (ppm)<1Circulation through RAS
pH7–8.5Addition of CaCO3 5–10 ppm (if pH < 7)
Addition of Bacillus 2–5 ppm (if pH > 8.5)
∆pH (day-night)0–0.5Addition of NaHCO3 2–5 ppm
Total Vibrio (CFU/mL)<104Addition of Bacillus, 0.5–1.5 ppm with fermented molasses enrichment
Alkalinity level (ppm)120–150Addition of NaHCO3 2–5 ppm
Diatom/Green Algae Dominance (%)50–90Addition of Kaolin Clay powder 2–5 ppm
Temperature (°C)27–30Set up water heater (for increasing the temperature)
or chiller (for decreasing the temperature)
Salinity (ppt)25–30Addition of seawater to increase salinity and freshwater.
to reduce salinity
Dissolved Oxygen/DO (ppm)4–9Aeration set up
Table 2. Feeding regime based on shrimp mean body weight (MBW).
MBW (g)FR (%)MBW (g)FR (%)
1.0–1.911–811.0–11.93.5–3.25
2.0–2.98–712.0–12.93.25–3.0
3.0–3.97–613.0–13.93.0–2.75
4.0–4.96–5.514.0–14.92.75–2.5
5.0–5.95.5–5.015.0–15.92.5–2.3
6.0–6.95.0–4.516.0–16.92.3–2.1
7.0–7.94.5–4.2517.0–17.92.1–2.0
8.0–8.94.25–4.018.0–18.92.0–1.9
9.0–9.94.0–3.7519.0–19.91.9–1.8
10.0–10.93.75–3.520.0–20.91.8–1.7
Table 3. Feeding tray monitoring system for the feeding program.
The Residual Feed—In Feeding TrayScoringAction
1234
00004/4Add 5–10%
000+3/4Add 0–5%
+0+02/4Decrease 0–5%
++0+1/4Decrease 10–15%
++++0/4Decrease 20–30%
‘0’ indicates no residual feed and ‘+’ indicates presence of residual feed.
Table 4. Sampling example of Week 9 (SGR). Values are of weight, and the unit used is grams.
Basin 1Basin 2Basin 3Basin 4Basin 5Basin 6
12.293.563.773.764.644.32
23.913.732.553.712.683.66
32.683.543.893.852.873.44
43.363.934.082.972.543.65
52.952.811.134.312.954.38
64.724.872.784.022.523.11
73.354.993.432.934.512.71
823724.633.683.44.13.27
92.794.242.073.153.063.39
103.152.343.753.853.773.14
113.712.783.634.075.645.75
123.543.193.324.865.343.9
133.114.333.923.344.983.79
143.462.513.994.254.143.94
152.123.783.053.855.345.76
163.073.024.011.94.034.89
173.035.064.485.744.554.76
183.215.694.242.33.916.23
192.232.173.684.863.463.66
202.233.364.062.614.133.69
218.354.893.73.53.865.51
2253.174.183.434.69
233.34.592.783.673.875.61
245.143.583.773.742.745.48
255.443.823.633.854.131.76
264.763.174.794.23.794.34
274.72.844.343.734.894.33
283.262.565.153.533.965.78
293.012.914.135.154.233.35
305.572.54.743.934.464.44
Table 5. Overall Average weight, Daily Growth, and Max recorded weight. Units are in grams.
SamplingAv. WeightDaily GrowthMax Record
Week 40.810.031.15
Week 51.550.112.83
Week 62.420.124.38
Week 73.680.186.32
Week 84.860.178.35
Week 96.390.229.14
Week 107.960.2210.84
Week 119.000.1511.17
Week 1210.000.1412.21
Week 1311.940.2715.64
Table 6. Composition and details of feed used.
Feeding Suggestion: Shrimp Age–SizeFeed TypeFormSize (mm)Crude Protein (Min)Crude Fat (Min)Ash (Max)Fiber (Max)Moisture (Max)
1–10 daysStarter 1Crumbles0.6–1.234%7%15%4%11%
11–30 daysStarter 2Crumbles1.2–2.034%7%15%4%11%
3–5 grStarter 3Crumbles1.4–2.534%7%15%4%11%
5–15 grGrower 1Pellet2.2 × 3.0–5.034%7%15%4%11%
>15 grGrower 2Pellet2.2 × 3.0–6.034%7%15%4%11%
Table 7. Total Cost of Investment, Total Fixed Costs, Total Variable Costs, and Total Cost of Production. Including Percentage breakdown for each category.
Total Cost of InvestmentUSD 26.43 per
Kilogram
Isolated Hangar (1564 m2) and Administration Building (482 m2)76%
Plumping and Heating System6%
Smart System6%
Culture System10%
Project Management and Installation3%
Total Fixed CostsUSD 4.87 per Kilogram
Depreciation34%
Maintenance17%
Farm Keeper Salary4%
Electricity41%
Preparation Labor Costs1%
Harvesting Labor Cost1%
Cleaning Labor Costs1%
Transportation1%
Total Variable CostsUSD 2.87 per Kilogram
Shrimp Feed68%
Prebiotic and Probiotics4%
Shrimp Larvae25%
Shrimp Larvae Transportation1%
Harvesting Package Costs2%
Total Cost of ProductionUSD 7.73
Publisher’s Note: MDPI stays neutral with regard to jurisdictional claims in published maps and institutional affiliations.

