Abstract
The ever-increasing demand for transport is sustained by fossil fuel-based internal combustion (IC) engines fitted with catalytic converters (CCs) while alternative options and fuels are still emerging. Biodiesel seems to be a potential alternate to diesel, but the formation of NOx and smoke are major issues. This study aimed to explore the effect of B100 Pongamia biodiesel on the performance of CCs and to assist the designers of compression ignition engines. This study included a comparison of deposits on the catalytic converter (CC) in the cases of diesel fuel and biodiesel. Forensic examination of the spent CCs after 250 h was performed by characterization using SEM/EDS. The amount and composition of the deposits were compared for the diesel and biodiesel, and the effectiveness of the CC. The study revealed that the efficiency of the CC increased in biodiesel. The amount of soot and deposits was greater at the engine side of the spent CC with diesel, including the atomic percentage (At. %) of C, while the minimum deposits and C At. % in the spent CC were at the exhaust side with biodiesel. Oxygen content in the deposits was greater in biodiesel. The efficiency and effectiveness of the CC increased with the biodiesel.
1. Introduction
Internal combustion (IC) engines rule the automotive sector due to their favorable energy efficiency, reliability, and durability. Their demand is large across the globe and is continuously increasing [1]. It has been reported that 95% of the transport energy comes from liquid fuels which are derived from fossil fuels and further transportation fuels make around 60% of the total oil produced [2,3,4,5]. Presently, the world needs nearly 4.8 billion liters of diesel as well as gasoline each day. These fuels will continue to grow at an average growth of around 1% annually even though gas and renewable fuels are the fastest growing sources of energy [2]. The fast exhaustion of fossil fuels through IC engines has led to an increase in environmental pollution. Most of the pollutants, such as carbon monoxide (CO), hydrocarbons (HC), oxides of nitrogen (NOx), particulate matter (PM), and soot formation are the result of combustion of fossil fuels originating from gasoline and diesel engines [6]. Though formation of CO and HC are less in diesel engines, particulate matter (PM) and NOx formations are greater. Diesel engines have been developed successfully for efficient combustion and to thus reduce CO2 emissions, but as far as harmful emissions are concerned, marginal progress has been made [7]. Therefore, there are two major challenges before engine researchers and manufacturers. First, to investigate alternate sources of energy to fossil fuels, and subsequently develop an engine which fulfills the strict emission norms prescribed by legislation. In this scenario, biofuels such as biodiesel have proven potential to replace them for the operation of IC engines. However, pure biodiesel, if used in an unmodified engine, may affect the engine performance and combustion due to its unfavorable fuel properties [8,9,10]. Biodiesel has many advantages such as being non-toxic, biodegradable, suitable for sensitive environments, high flash point, etc. However, if used in pure form or highly concentrated biodiesel–diesel blends, then it may cause incomplete combustion leading to more carbon depositions and so on [11,12,13]. Banapurmath et al. [14] conducted performance and emission tests on a diesel engine by using diesel and biodiesel of sesame, honge, and Jatropha oils. The brake thermal efficiency of diesel, sesame, honge, and jatropha biodiesel (pure form) was found to be 31.25%, 30.4%, 29.51%, and 29%, respectively. All biodiesel fuels resulted in higher HC, CO, and smoke emissions compared with diesel [14]. The same authors used honge, biodiesel, and producer gas in a dual-fuel supply system. In dual-fuel operation, NOx and smoke reduced significantly, but CO and HC increased substantially [15,16]. Gumus et al. [17] fueled a diesel engine with high percentage biodiesel–diesel blends at different fuel injection pressures. They reported a decrease in brake-specific fuel consumption, smoke, CO, and unburned hydrocarbon (UHC), with an increase in NOx and CO2. They concluded that 99.63% combustion efficiency was obtained with pure biodiesel at an injection pressure of 24 MPa [17]. The formation of NOx was reduced by 24.4% in 100% jatropha biodiesel compared to diesel when the engine exhaust was fitted with a three-way catalytic converter (CC) [18]. There is vast literature available on emissions from biodiesel engines which shows that formation of NOx is greater in biodiesel engines compared to diesel engines. NOx reacts with water molecules in the atmosphere forming nitric acid, a potential reason for acid rains. The exhaust system typically consisting of a CC is one of the best methods available for minimizing emissions after combustion [19,20]. Vallinayagam et al. [21] used pine oil blended with diesel (50% pine oil + 50% diesel) as a substitute in a diesel engine. They conducted performance and emissions tests at different engine loads. It was reported that NOx and CO were reduced by 15.2% and 67.5%, respectively, compared to the diesel engine by implementing selective catalyst reduction (SCR) along with a CC in the exhaust manifold. The brake thermal efficiency was increased by 7.5% [21]. Durairajan et al. [22] developed a nano CC by using cerium oxide instead of using costly metals to minimize the emissions. They concluded that NOx, CO, and HC were reduced by 84.3%, 69%, and 78%, respectively, at full engine load [22]. CCs with exhaust gas recycle (EGR) have been proven effective in reducing emissions besides improved performance. Subramaniam et al. [23] ran a diesel engine using B40 biodiesel–diesel blend as fuel. The engine was equipped with an Ni-coated CC with 15% EGR combination. The combined system resulted in better performance with reduced emissions [23]. The present work was focused on the forensic study of the spent catalytic converter working on diesel and B100 Pongamia biodiesel. The spent CC was dissected at the engine as well as the exhaust side and examined under Scanning Electron Microscope (SEM) to reveal the amount and nature of deposits. Energy Dispersive Spectroscopy (EDS) was employed for characterization of the nature of deposits and its composition. The amount and composition of the deposits were compared for the diesel and B100 Pongamia biodiesel fuels and the effectiveness of the CC in emission control is discussed. The characterization of the spent CC is a unique study and limited literature is available on this aspect. The findings of this study are expected to encourage qualitative research on the CC using alternative fuels. The results are also intended to assist the designers of compression ignition engines to modify existing engines for biofuels.
2. Experimental Methodology
2.1. Preparation of Biodiesel
The biodiesel was prepared from transesterification of crude Pongamia Pinnata (Karanja) oil. Pongamia Pinnata is a deciduous, salt-tolerant, drought-resistant, nitrogen-fixing leguminous tree. It is an oil seed-bearing tree, native to humid and subtropical environments, and can grow in a wide variety of soil types. The presence of toxic flavonoids such as karanjin, pongapin, and pongaglabrin in the oil, makes it non-edible with only 6% being utilized out of 200 million tons produced per year. Crude Pongamia oil was collected locally and used. Chemicals such as methanol, potassium hydroxide (KOH) were obtained and used without any further purification. Pongamia oil was preheated prior to its use in transesterification process to remove the moisture contents. The fuel properties of pure (B100) Pongamia Pinnata biodiesel are shown in Table 1.

Table 1.
Fuel properties of diesel and biodiesel (B100).
2.2. Engine with Catalytic Converter (CC)
All the tests were carried out on a 3.5 kW diesel engine, brand Kirloskar, make Kirloskar Oil Engines Limited (KOEL), India. The specifications of the engine are as shown in Table 2.

Table 2.
Engine specifications.
Initially, the engine was made to run on biodiesel by replacing a new fuel filter and changing the lubricating oil of the diesel engine. A new catalytic converter was assembled in the exhaust path of the engine. After completing the tests for the biodiesel engine, the CC was replaced with a new one for the diesel-fueled engine. Vibration level, noise level, and fuel consumption are shown in Table 3. Two brand-new CCs were used in this study, one examined before being used and then after being spent with B100 Pongamia biodiesel, and the other one after being spent with the diesel fuel.

Table 3.
Noise, vibration level, and fuel consumption for diesel and biodiesel engines.
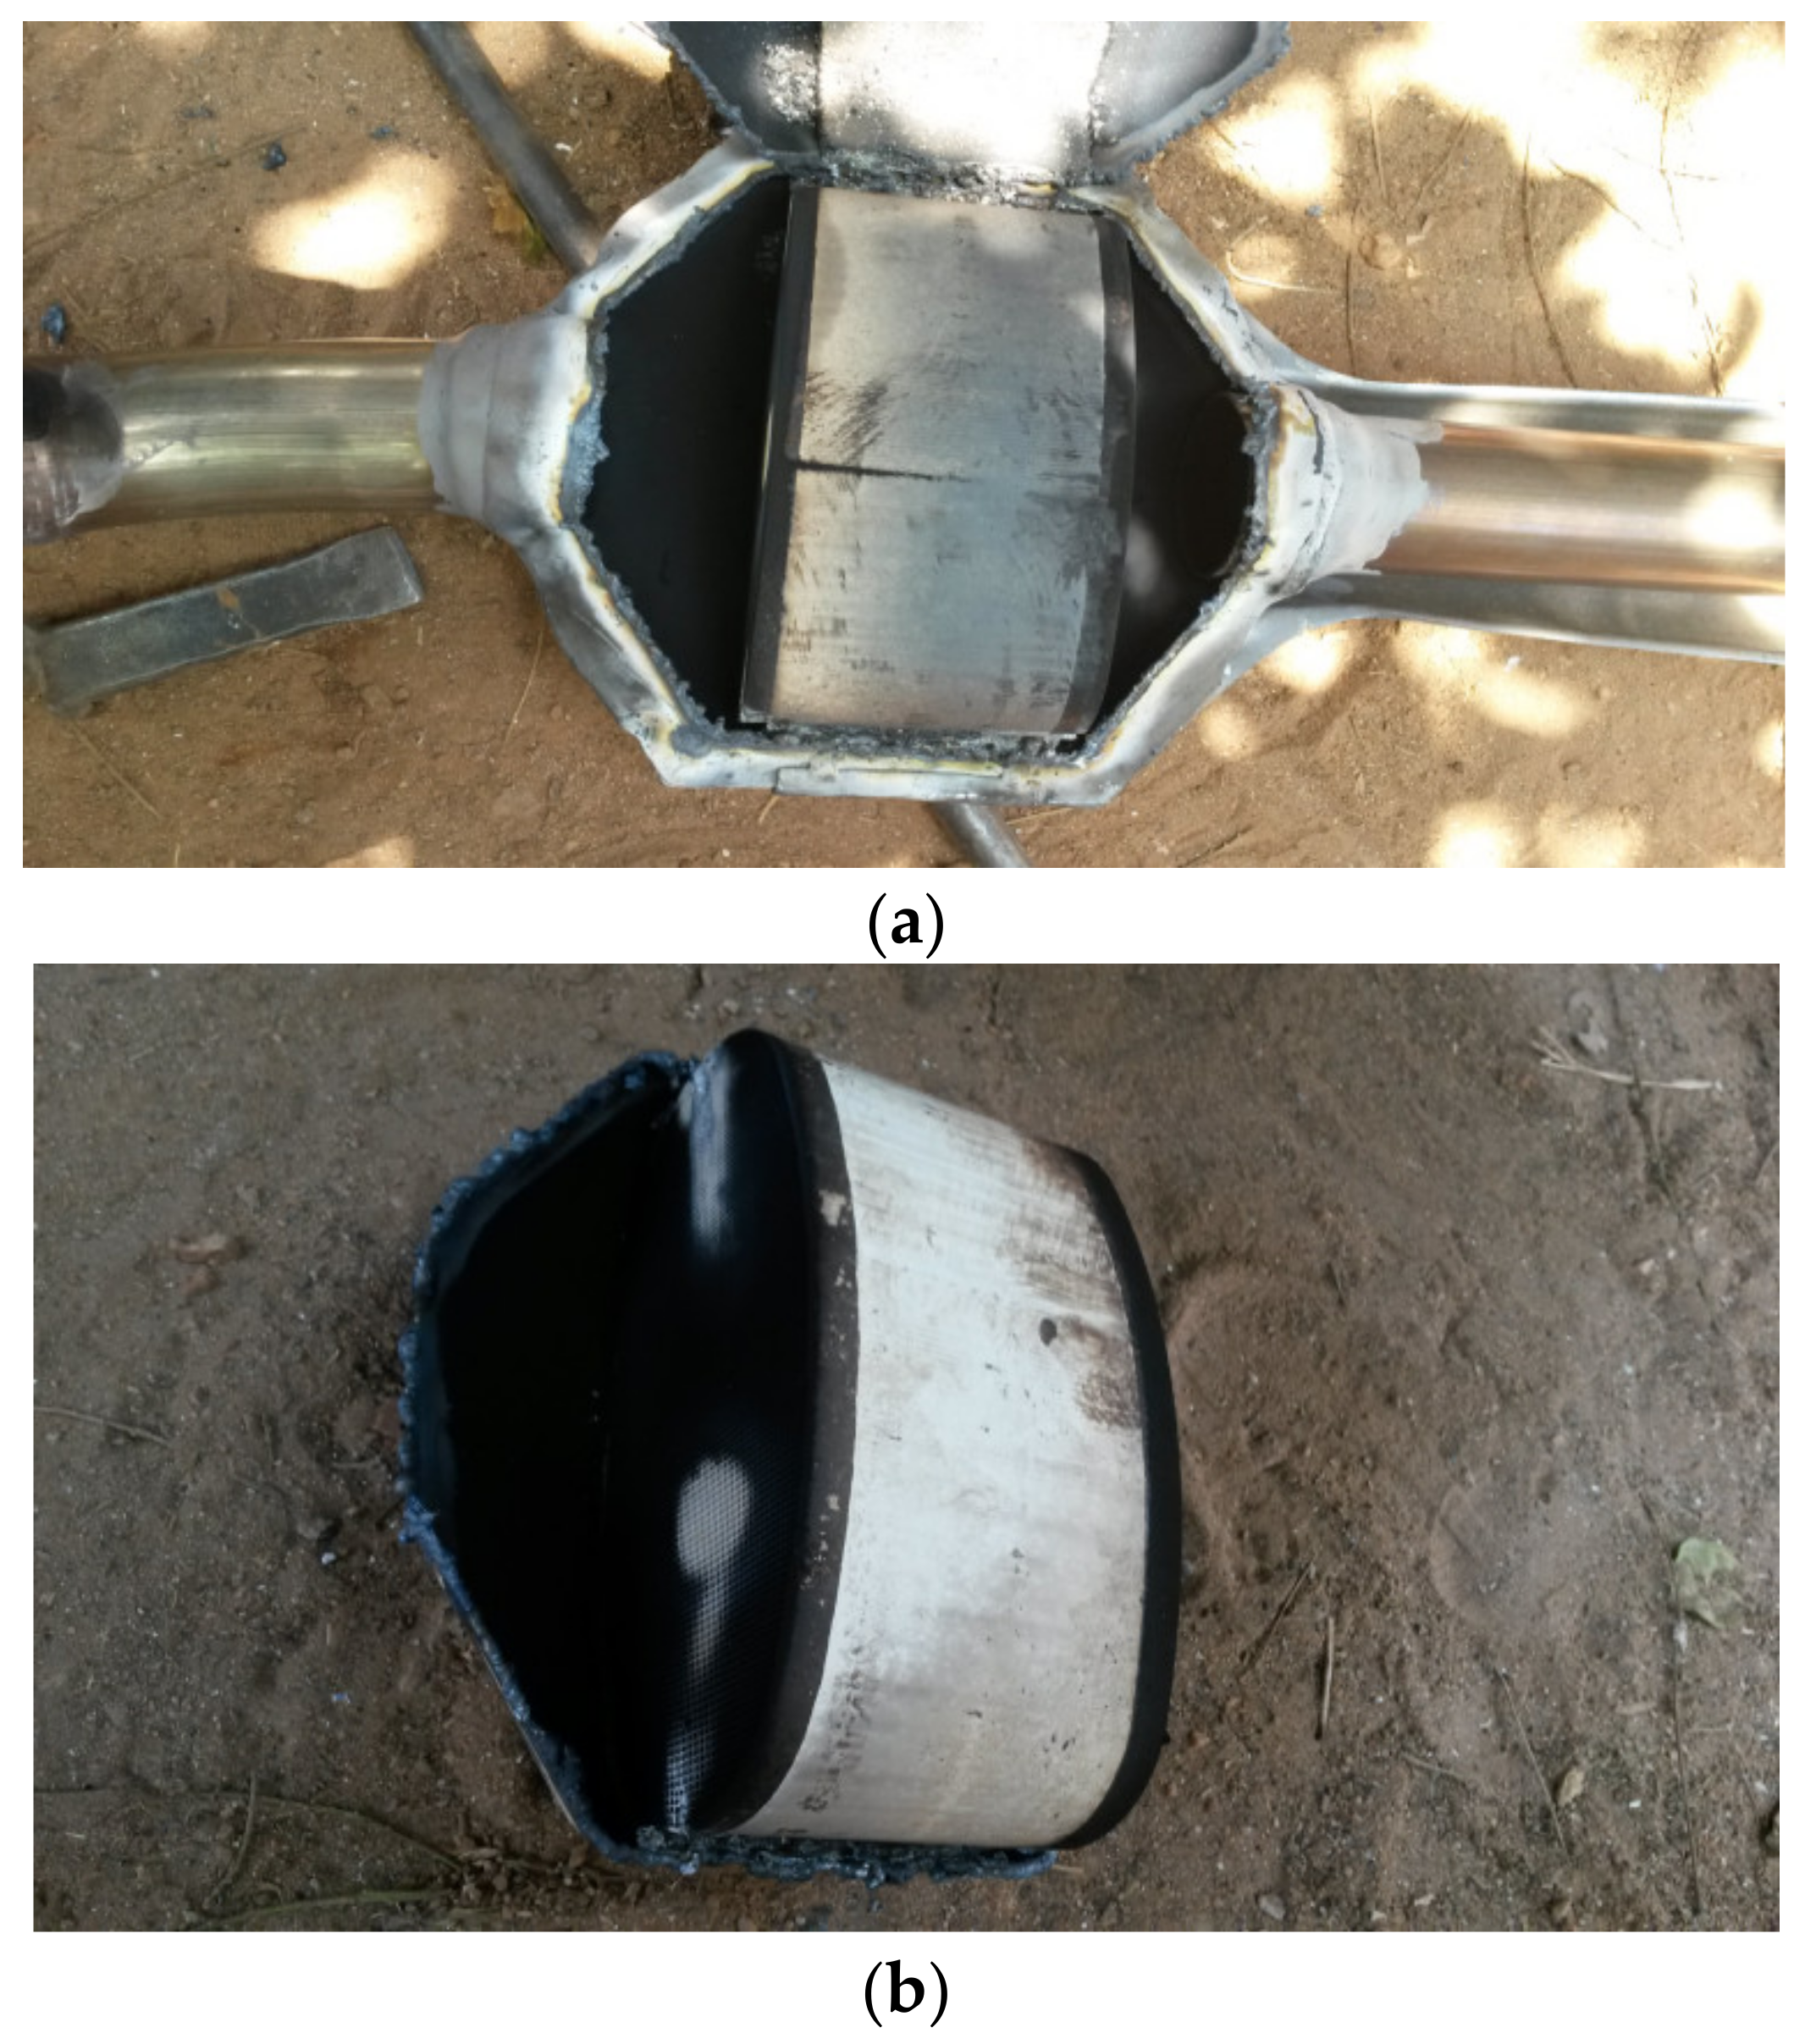
After running the engine for a period of 250 h, the catalytic converters (CCs) were dismantled carefully by using a gas cutter. The ceramic bed from the CC was separated carefully as shown in Figure 1a,b.
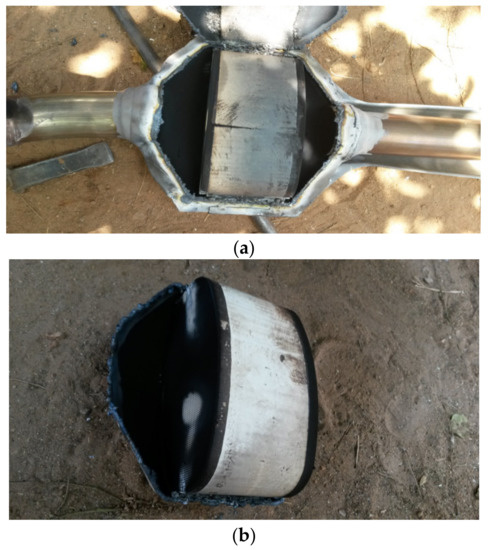
Figure 1.
(a,b) Dismantled catalytic converter.
The CCs were upgraded so that both oxidation and reduction occurred in a single chamber. Using a laser cutter, the inlet and outlet chambers of both ceramic beds were cut as per the required standards for SEM examination.
2.3. Scanning Electron Microscope (SEM)
The new and spent CC were dissected for forensic examination from the engine as well as the exhaust side, for both the diesel and Pongamia biodiesel fuels. The sections of the samples of the CCs were carefully examined under the Scanning Electron Microscope (SEM) make Jeol, Japan at the same magnification of 50× to determine the extent of soot deposit. The SEM images were compared with the new CC and the deposits in the case of both the fuels at the engine and the exhaust sides were measured using Smile ViewTM Map software along the length, width, and diagonal of the square ceramic channels. The composition of the soot was analyzed using EDS, coupled with the SEM (refer to Table 4 for specifications).

Table 4.
Specifications of samples prepared for SEM examination.
The atomic percentage (At. %) of C was extracted from the EDS results and plotted. The At. % was estimated by multiplying the ratio of the number of atoms of the element at that weight percentage and the total number of atoms in the sample, by 100. The composition of the element in a sample may be reported in both the At. % and wt. %. However, the latter is more commonly used.
3. Results and Discussion
Five samples of catalytic converters (CCs) were examined under SEM and characterized using EDS. The description of the samples is given in Table 5. A new ceramic bed structure and the engine and exhaust side of spent CCs on biodiesel and diesel fuels constituted the samples.

Table 5.
Description of CC samples.
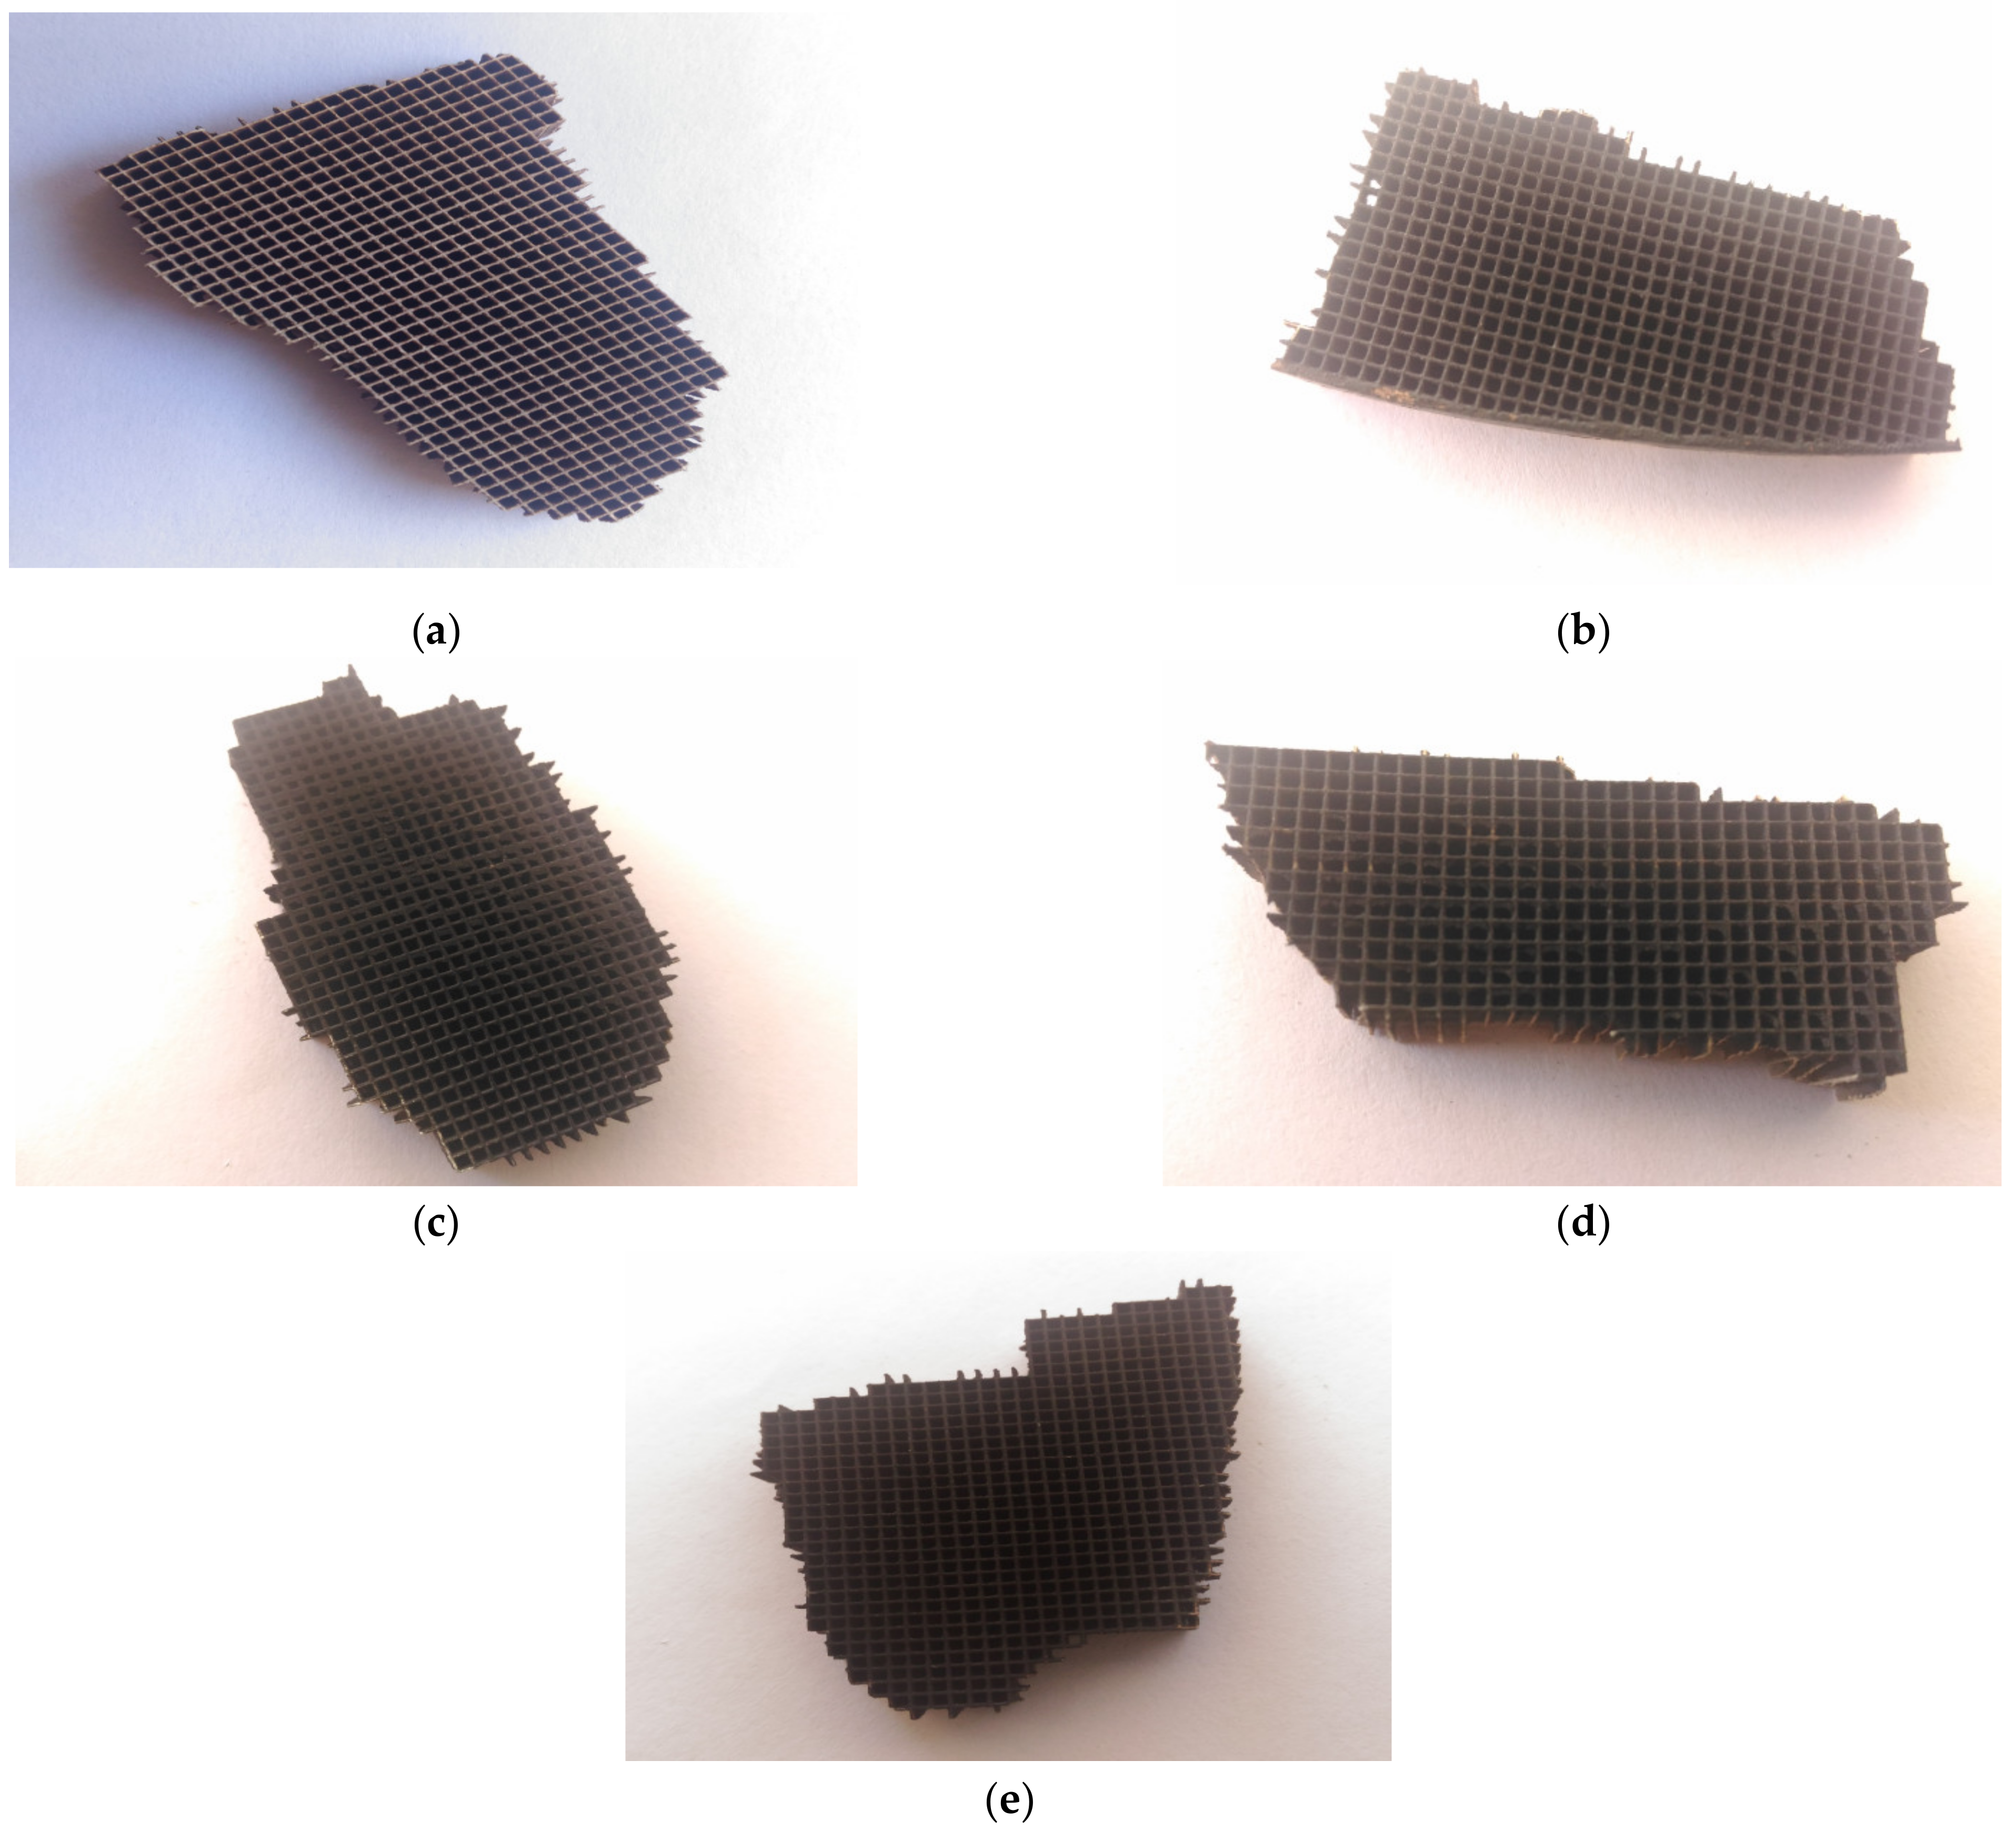
The CC used in the present study was an upgraded one, which executed both oxidation and reduction in single chamber. The spent CCs were cut from the engine and exhaust side after operating on diesel and Pongamia biodiesel fuels, respectively, using a laser cutter, and the pictures of the dissected CC are given in Figure 2a–e. Figure 2a shows the ceramic monolith of the new CC while Figure 2b–e show the engine side and exhaust sides of the spent CC after operating on diesel and biodiesel fuels. The spent CC, from the exhaust side, appeared more clogged, as in Figure 2c compared with the engine side, in Figure 2b. In biodiesel fuel, the engine side appeared to be more clogged, as in Figure 2d with absorbed pollutants compared to the exhaust side, in Figure 2e. Further information derived from the SEM images is reported and discussed in the subsequent sections.
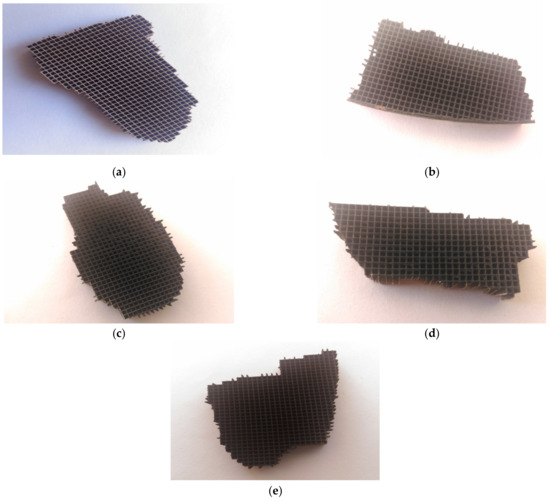
Figure 2.
(a) Ceramic monolith of new CC. (b) Spent CC, engine side with diesel fuel. (c) Spent CC, exhaust side with diesel fuel. (d) Spent CC, engine side with biodiesel fuel. (e) Spent CC, exhaust side with biodiesel fuel.
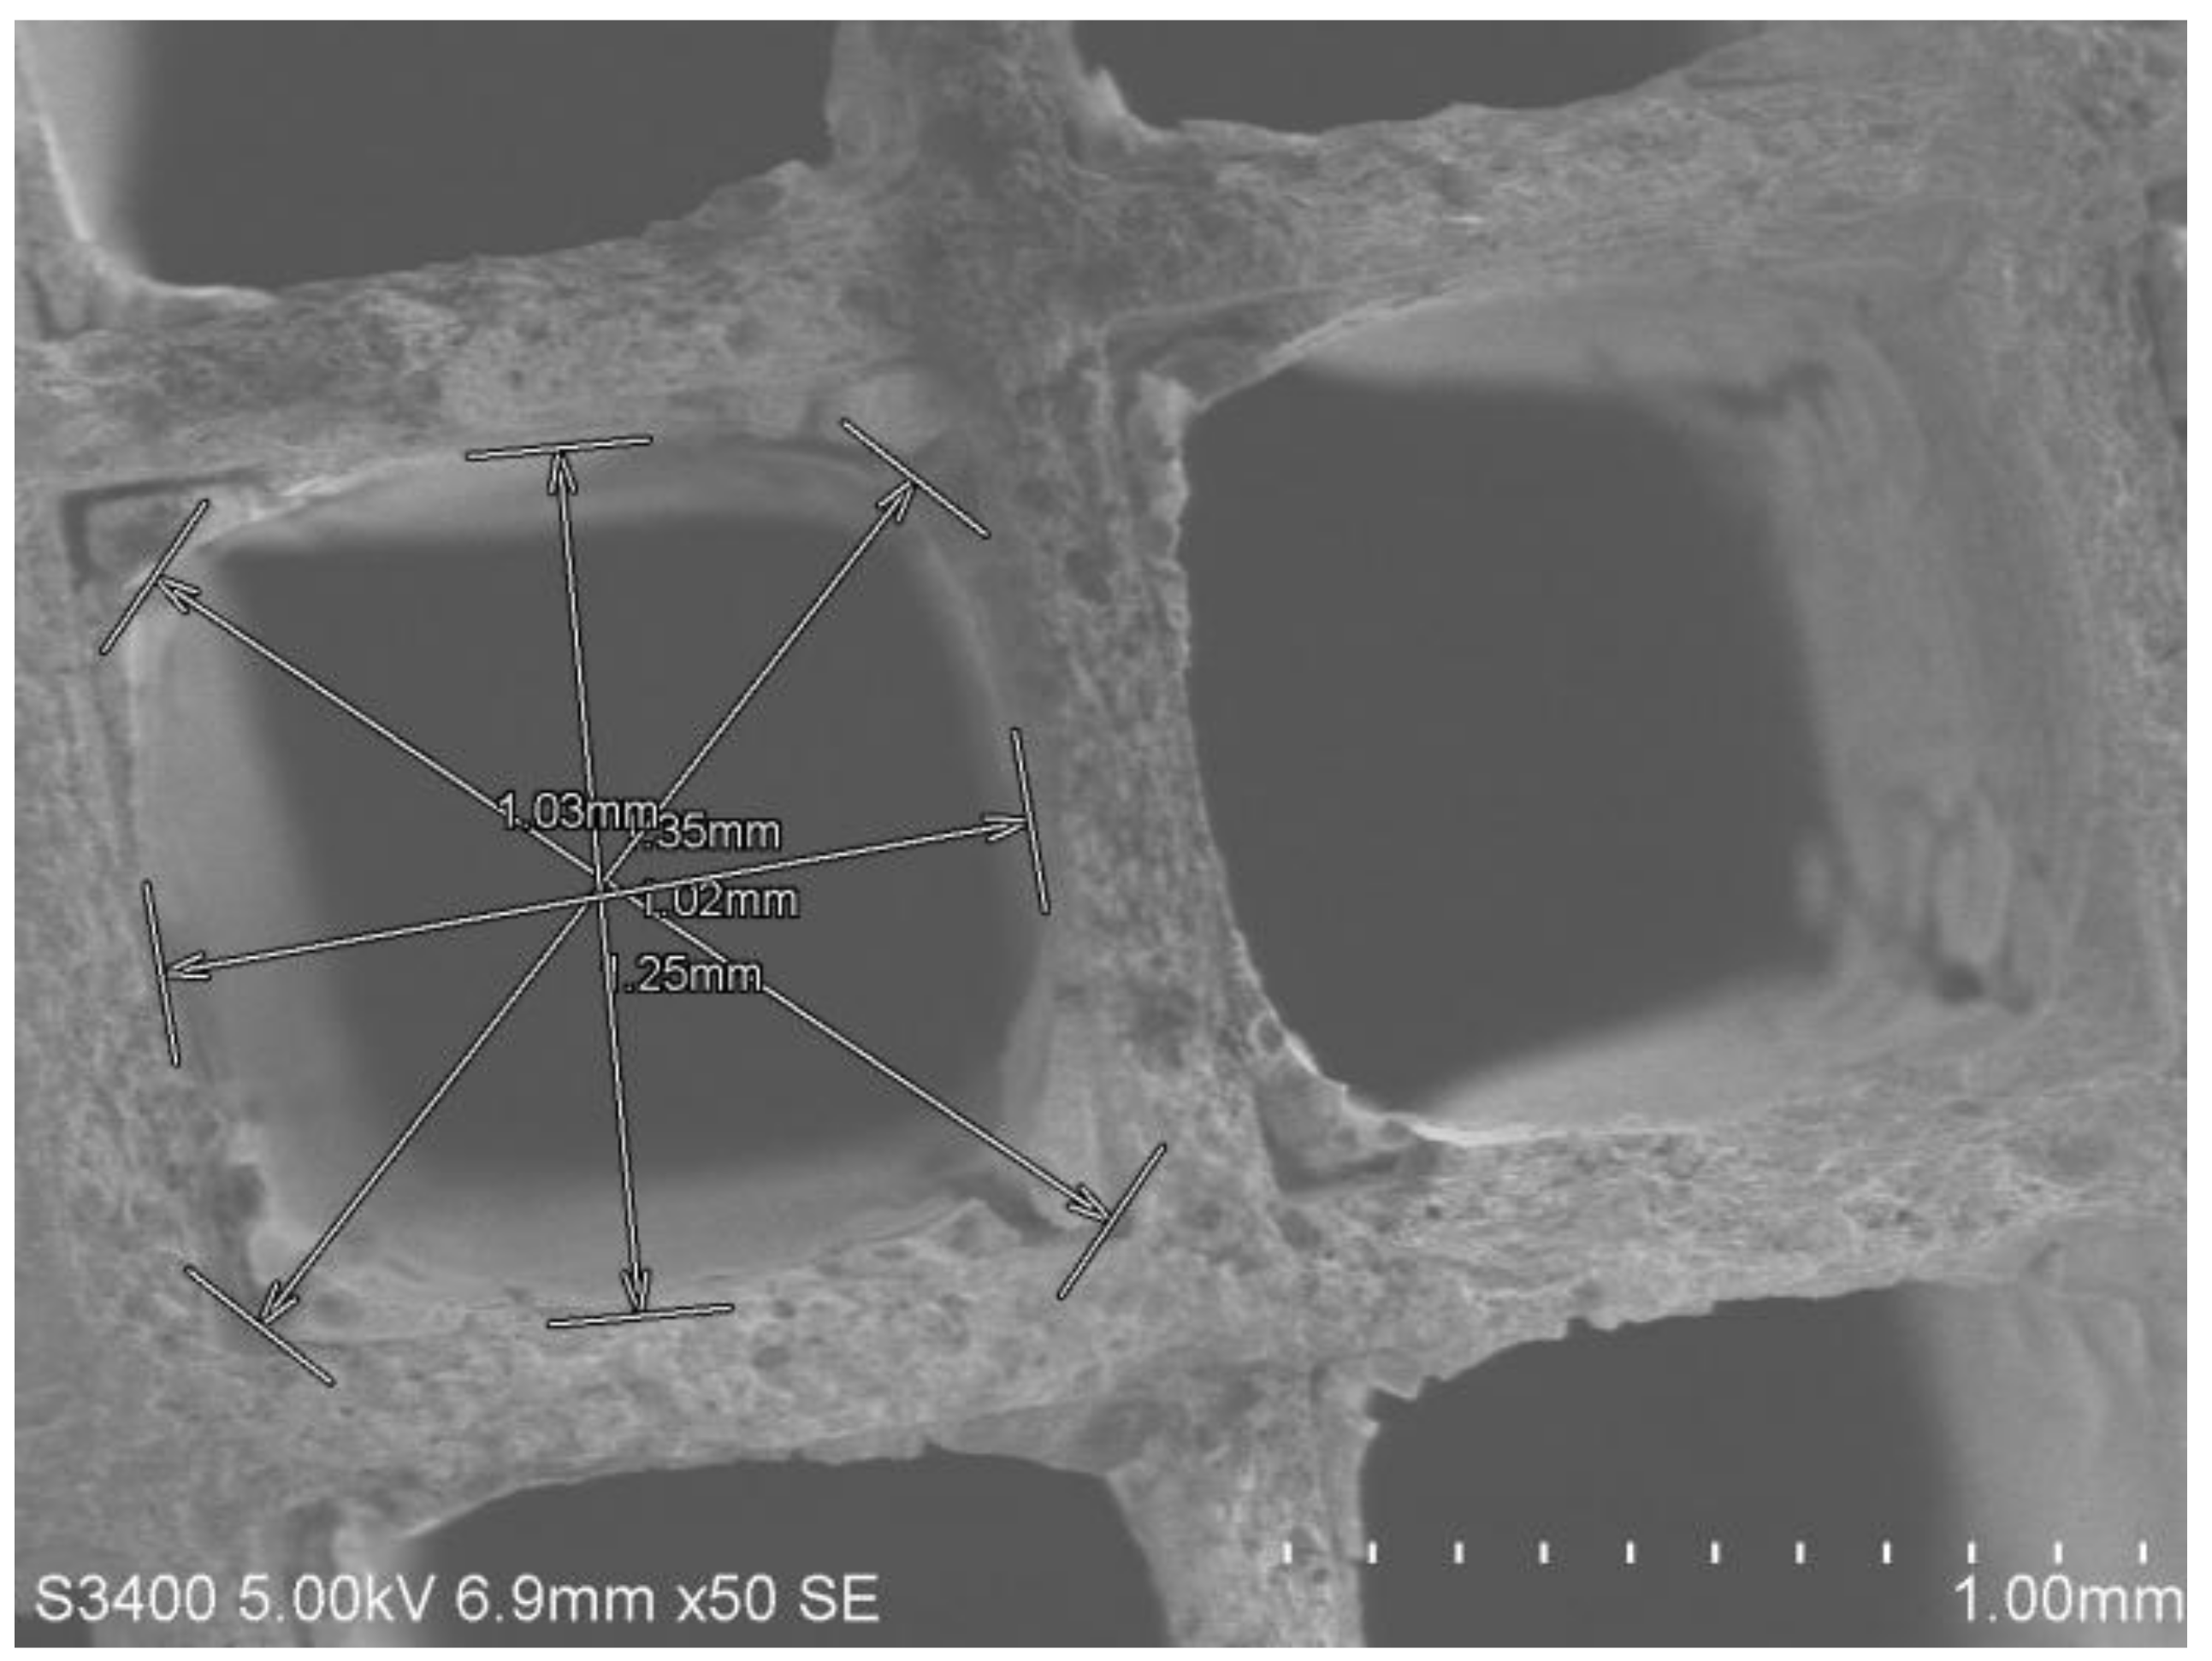
For in-depth characterization, a small section of the ceramic monolith of each sample was cut as per the dimensions given in Table 3, observed under SEM, and characterized using EDS. The size of the sample was: thickness, 0.6 mm, length up to 3 cm, and width up to 2 cm, governed by the size of sample mount of the SEM. The SEM pictures were taken at the same magnification of 50× for all the samples. The EDS results also gave the atomic percent of the elements present and their relative intensity count. The EDS detected a wide range of elements with the exception of a few low-atomic -number elements such as H, He, etc. The elemental composition at the point of focus was determined by EDS, and the EDS peaks are given in the Supplementary Materials. Figure 3 shows the SEM image of the new CC ceramic monolith. The outer shield of the CC was a squared ceramic bed with numerous pores of the same geometry. When the exhaust gases passed through these pores, the pollutants were absorbed and filtered from the flue gases and deposited along the walls of the pores. The slots in the ceramic bed had a square cross-section, having length and breadth of the order of 1 mm and diagonal ~1.35 mm. The purpose of measurement of the dimensions of the slot was to compare the deposits in the spent CC with the new CC. The EDS results revealed that the primary elements present in the ceramic bed were O, Al, Si, Mg, Na, C, Pt, Pd, Rh, and C. The results are in accordance with the standard composition of an oxidation–reduction CC [24]. In theoretical scenarios, combustion of hydrocarbon fuel should produce CO2 and H2O, but in actual conditions, the combustion process is oxygen deficient, resulting in the production of harmful pollutants such as carbon monoxide (CO), unburned hydrocarbons, and oxides of nitrogen and sulfur [25]. The peak of O was most prominent, with a relative intensity count of 246 due to the presence of oxides in the ceramic monolith of the virgin CC. Other elements were metals which constituted the CC material in the form of oxides. A minor trace of C was detected, which may be due to the carbide of one of the metals.
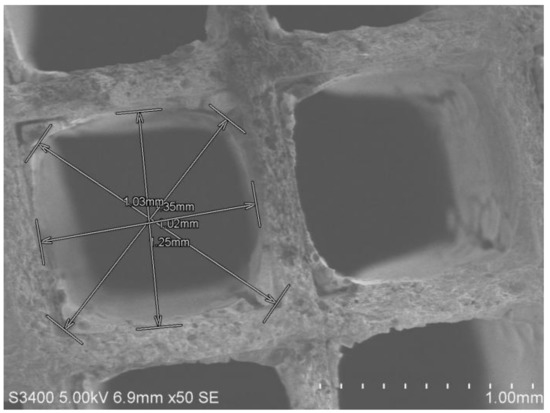
Figure 3.
SEM images of the new CC (sample 1) at 50×. The dimensions of the ceramic monolith are marked by arrows.
Typical dimensions of a square slot of a ceramic monolith bed measured from the SEM image (Figure 3) are given in Table 6.

Table 6.
Actual dimension of square cannel of a monolith ceramic bed of the new CC.
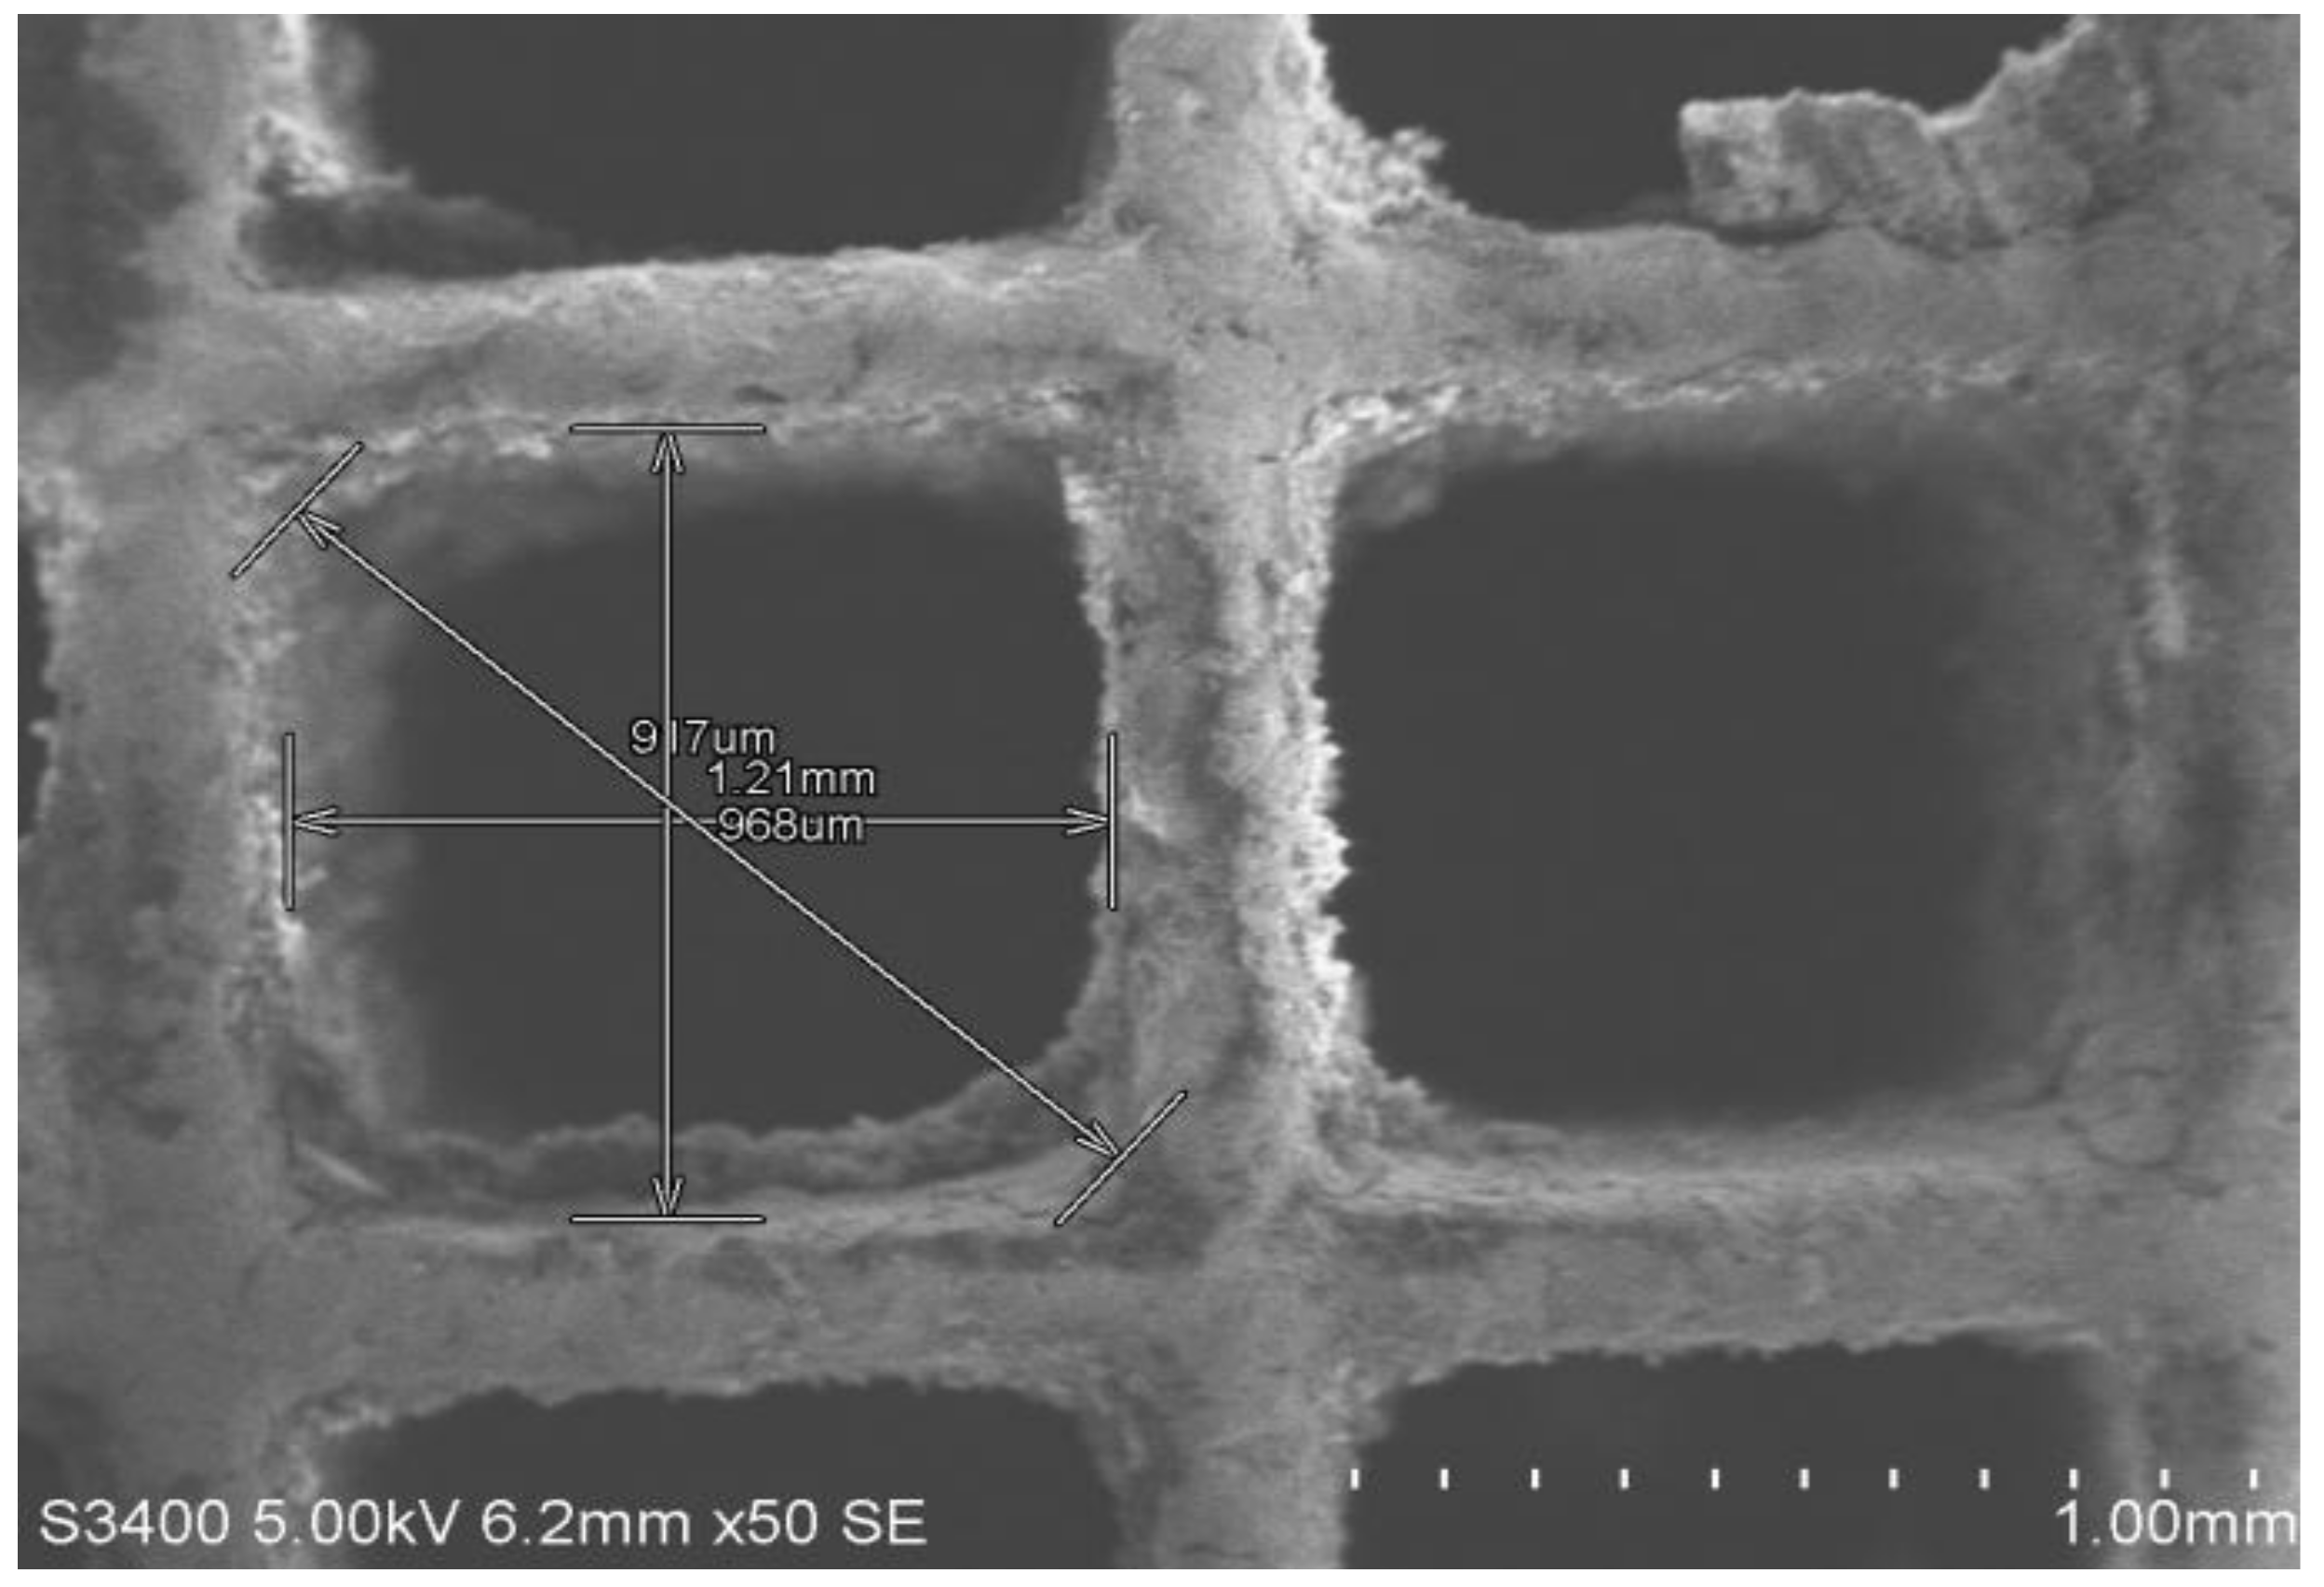
The typical SEM image of the spent CC facing the engine side, used on diesel fuel, is given in Figure 4, while the EDS peaks are given in the Supplementary Materials. The measured dimensions of the ceramic monolith included deposits, given in Table 7, from which the amount of deposits could be estimated by comparing the dimensions of the virgin ceramic monolith, given in Table 6. Diesel emissions were rich with carbon contents and particulate matter, so in Figure 4 these depositions are clearly visible. In comparison to the new CC, the intensity of C increased from 5 to 955, indicating that the deposits were dominated by C-compounds while Ca and Cr appeared in small intensity probably due to contamination from the handling of the spent CC before examination. C was the most prominent element appearing in the EDS results, followed by O and others. Since the ceramic monolith was covered by soot and deposits, the intensity of metallic elements reduced as compared to the virgin monolith.
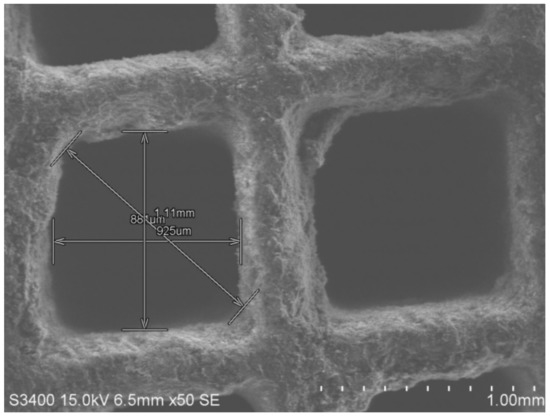
Figure 4.
SEM images of the spent CC, engine side, with diesel fuel (sample 2) at 50×. The dimensions of the ceramic monolith are marked by arrows.

Table 7.
Dimensions of square cannel of a monolith ceramic bed of the engine side of the spent CC used on diesel fuel (sample 2) and deposits along the length, width, and diagonal compared with the virgin CC.
Table 7 gives the dimensions of the square channel of the ceramic bed with the deposits along the length, width, and the diagonal in the engine side of the spent CC used on diesel fuel. The magnitude of the deposits was estimated by difference from the dimensions of the virgin CC, shown in Table 6.
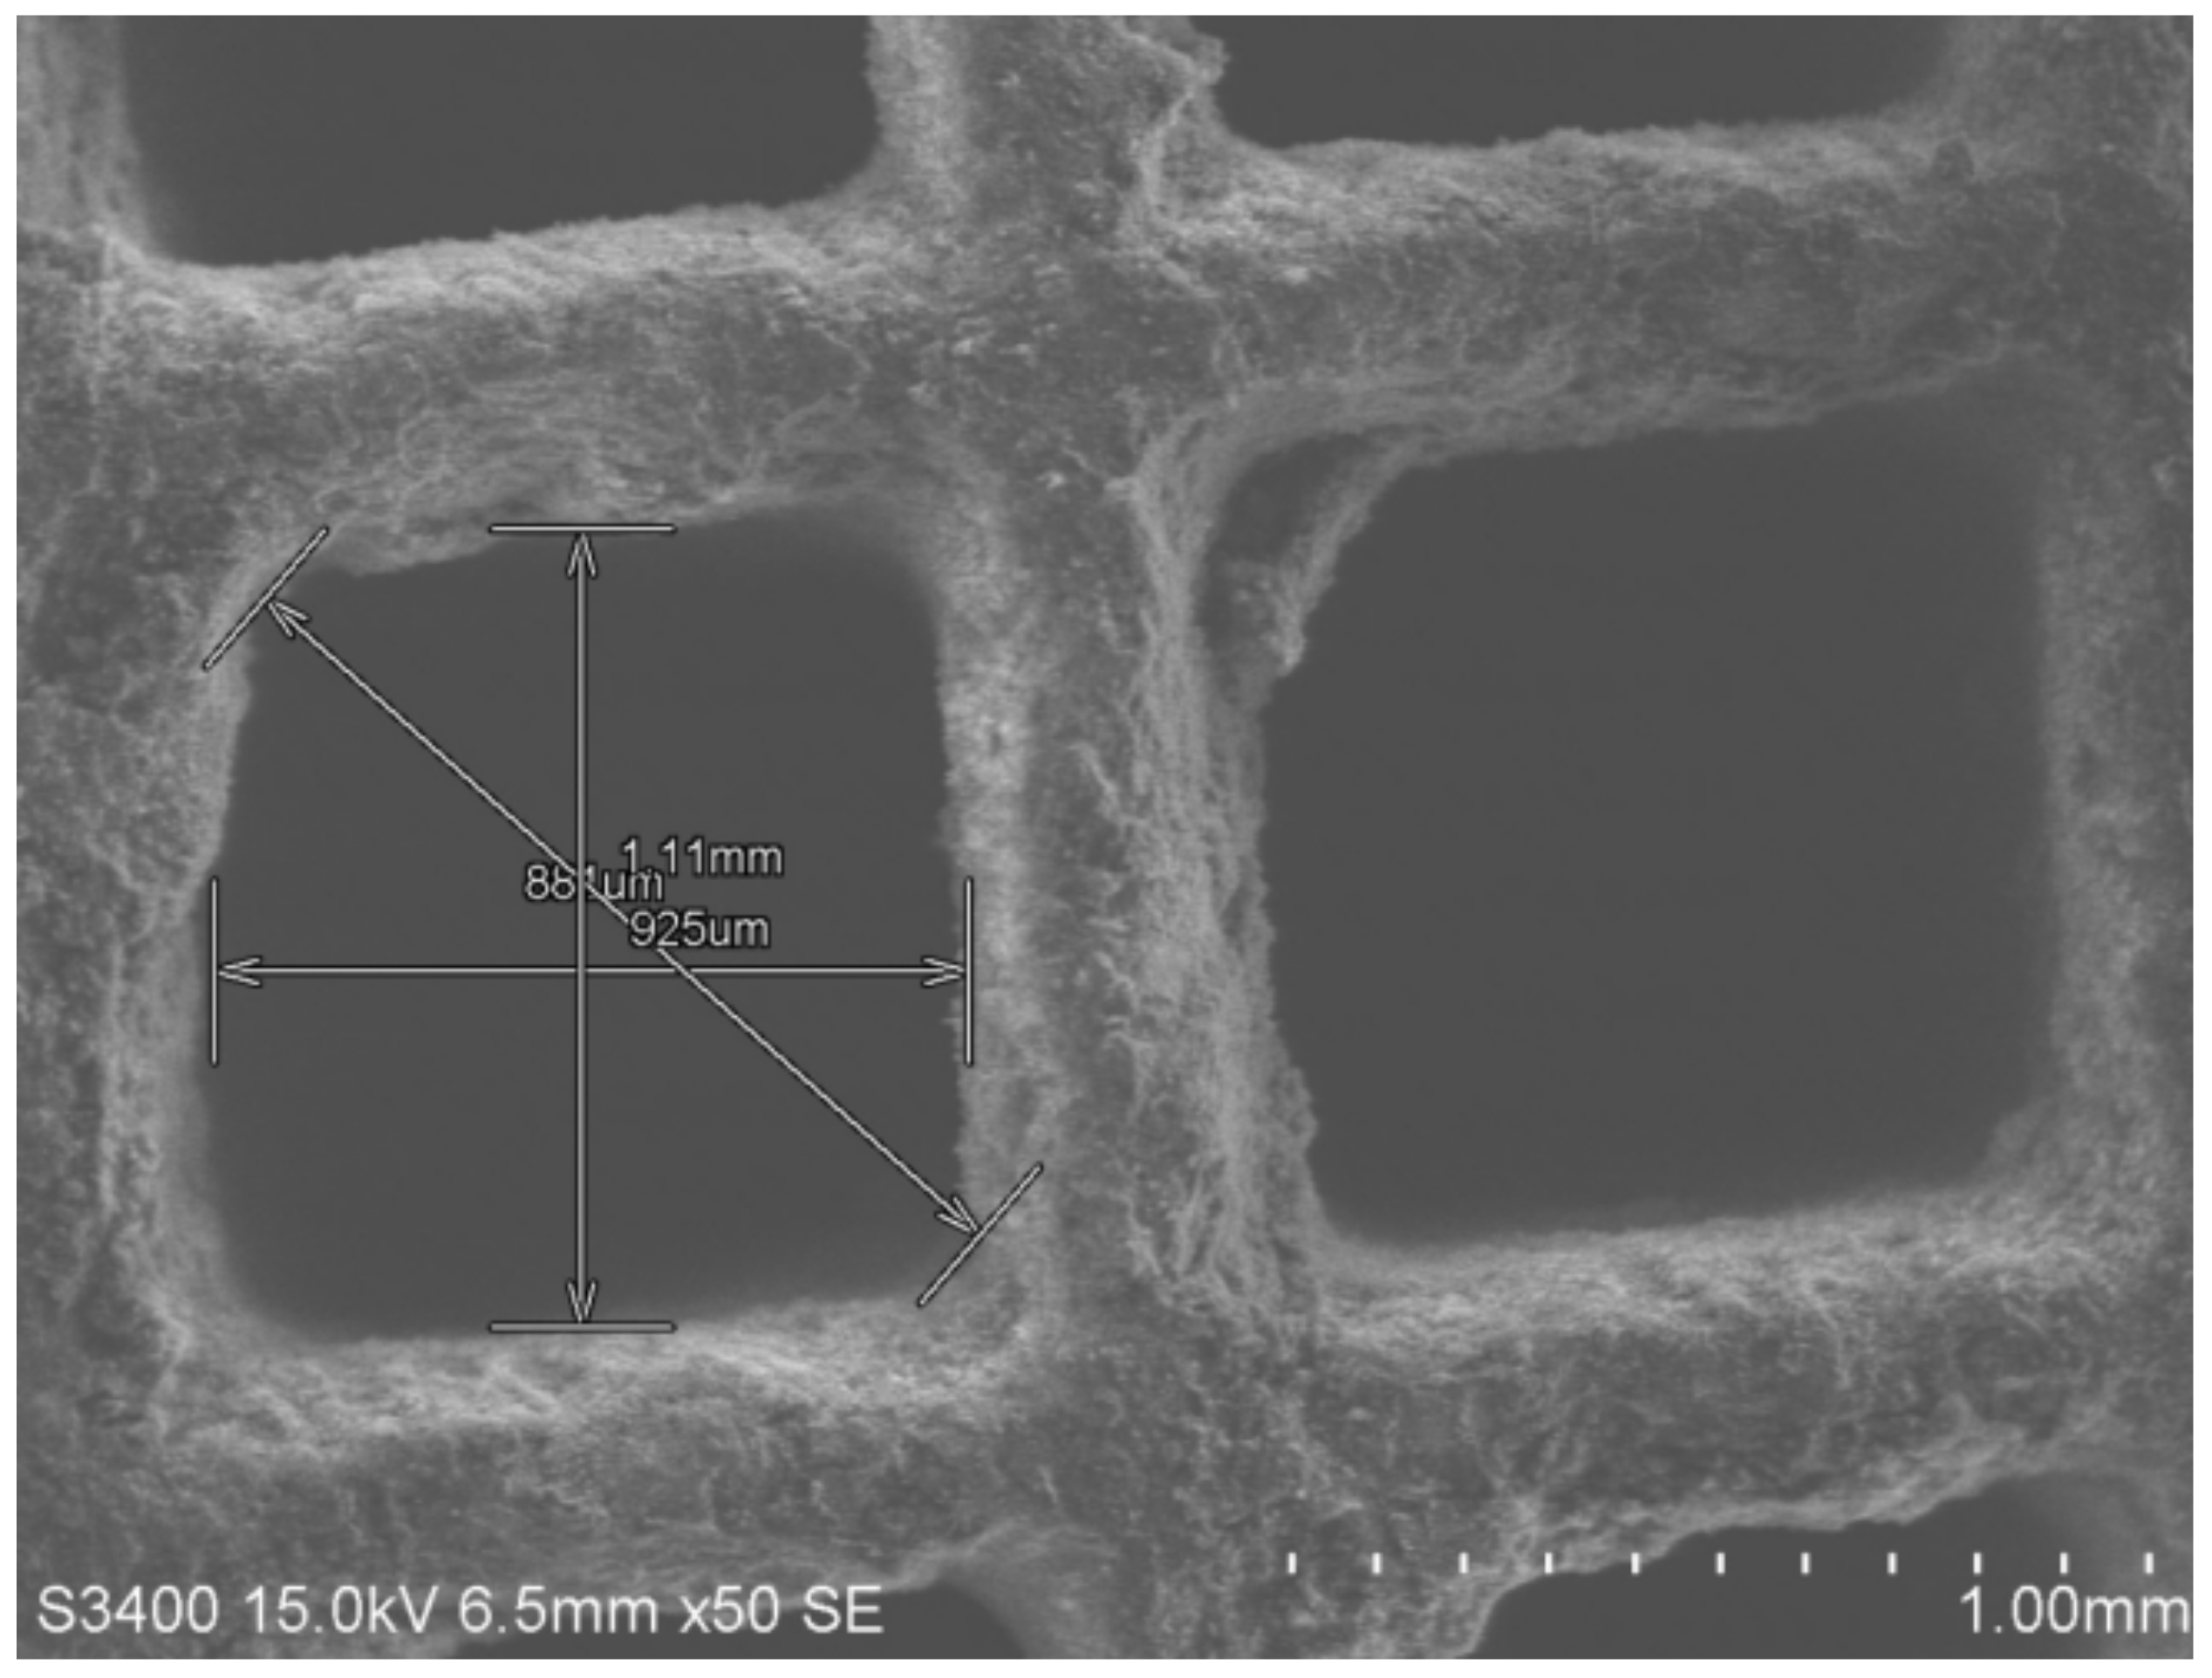
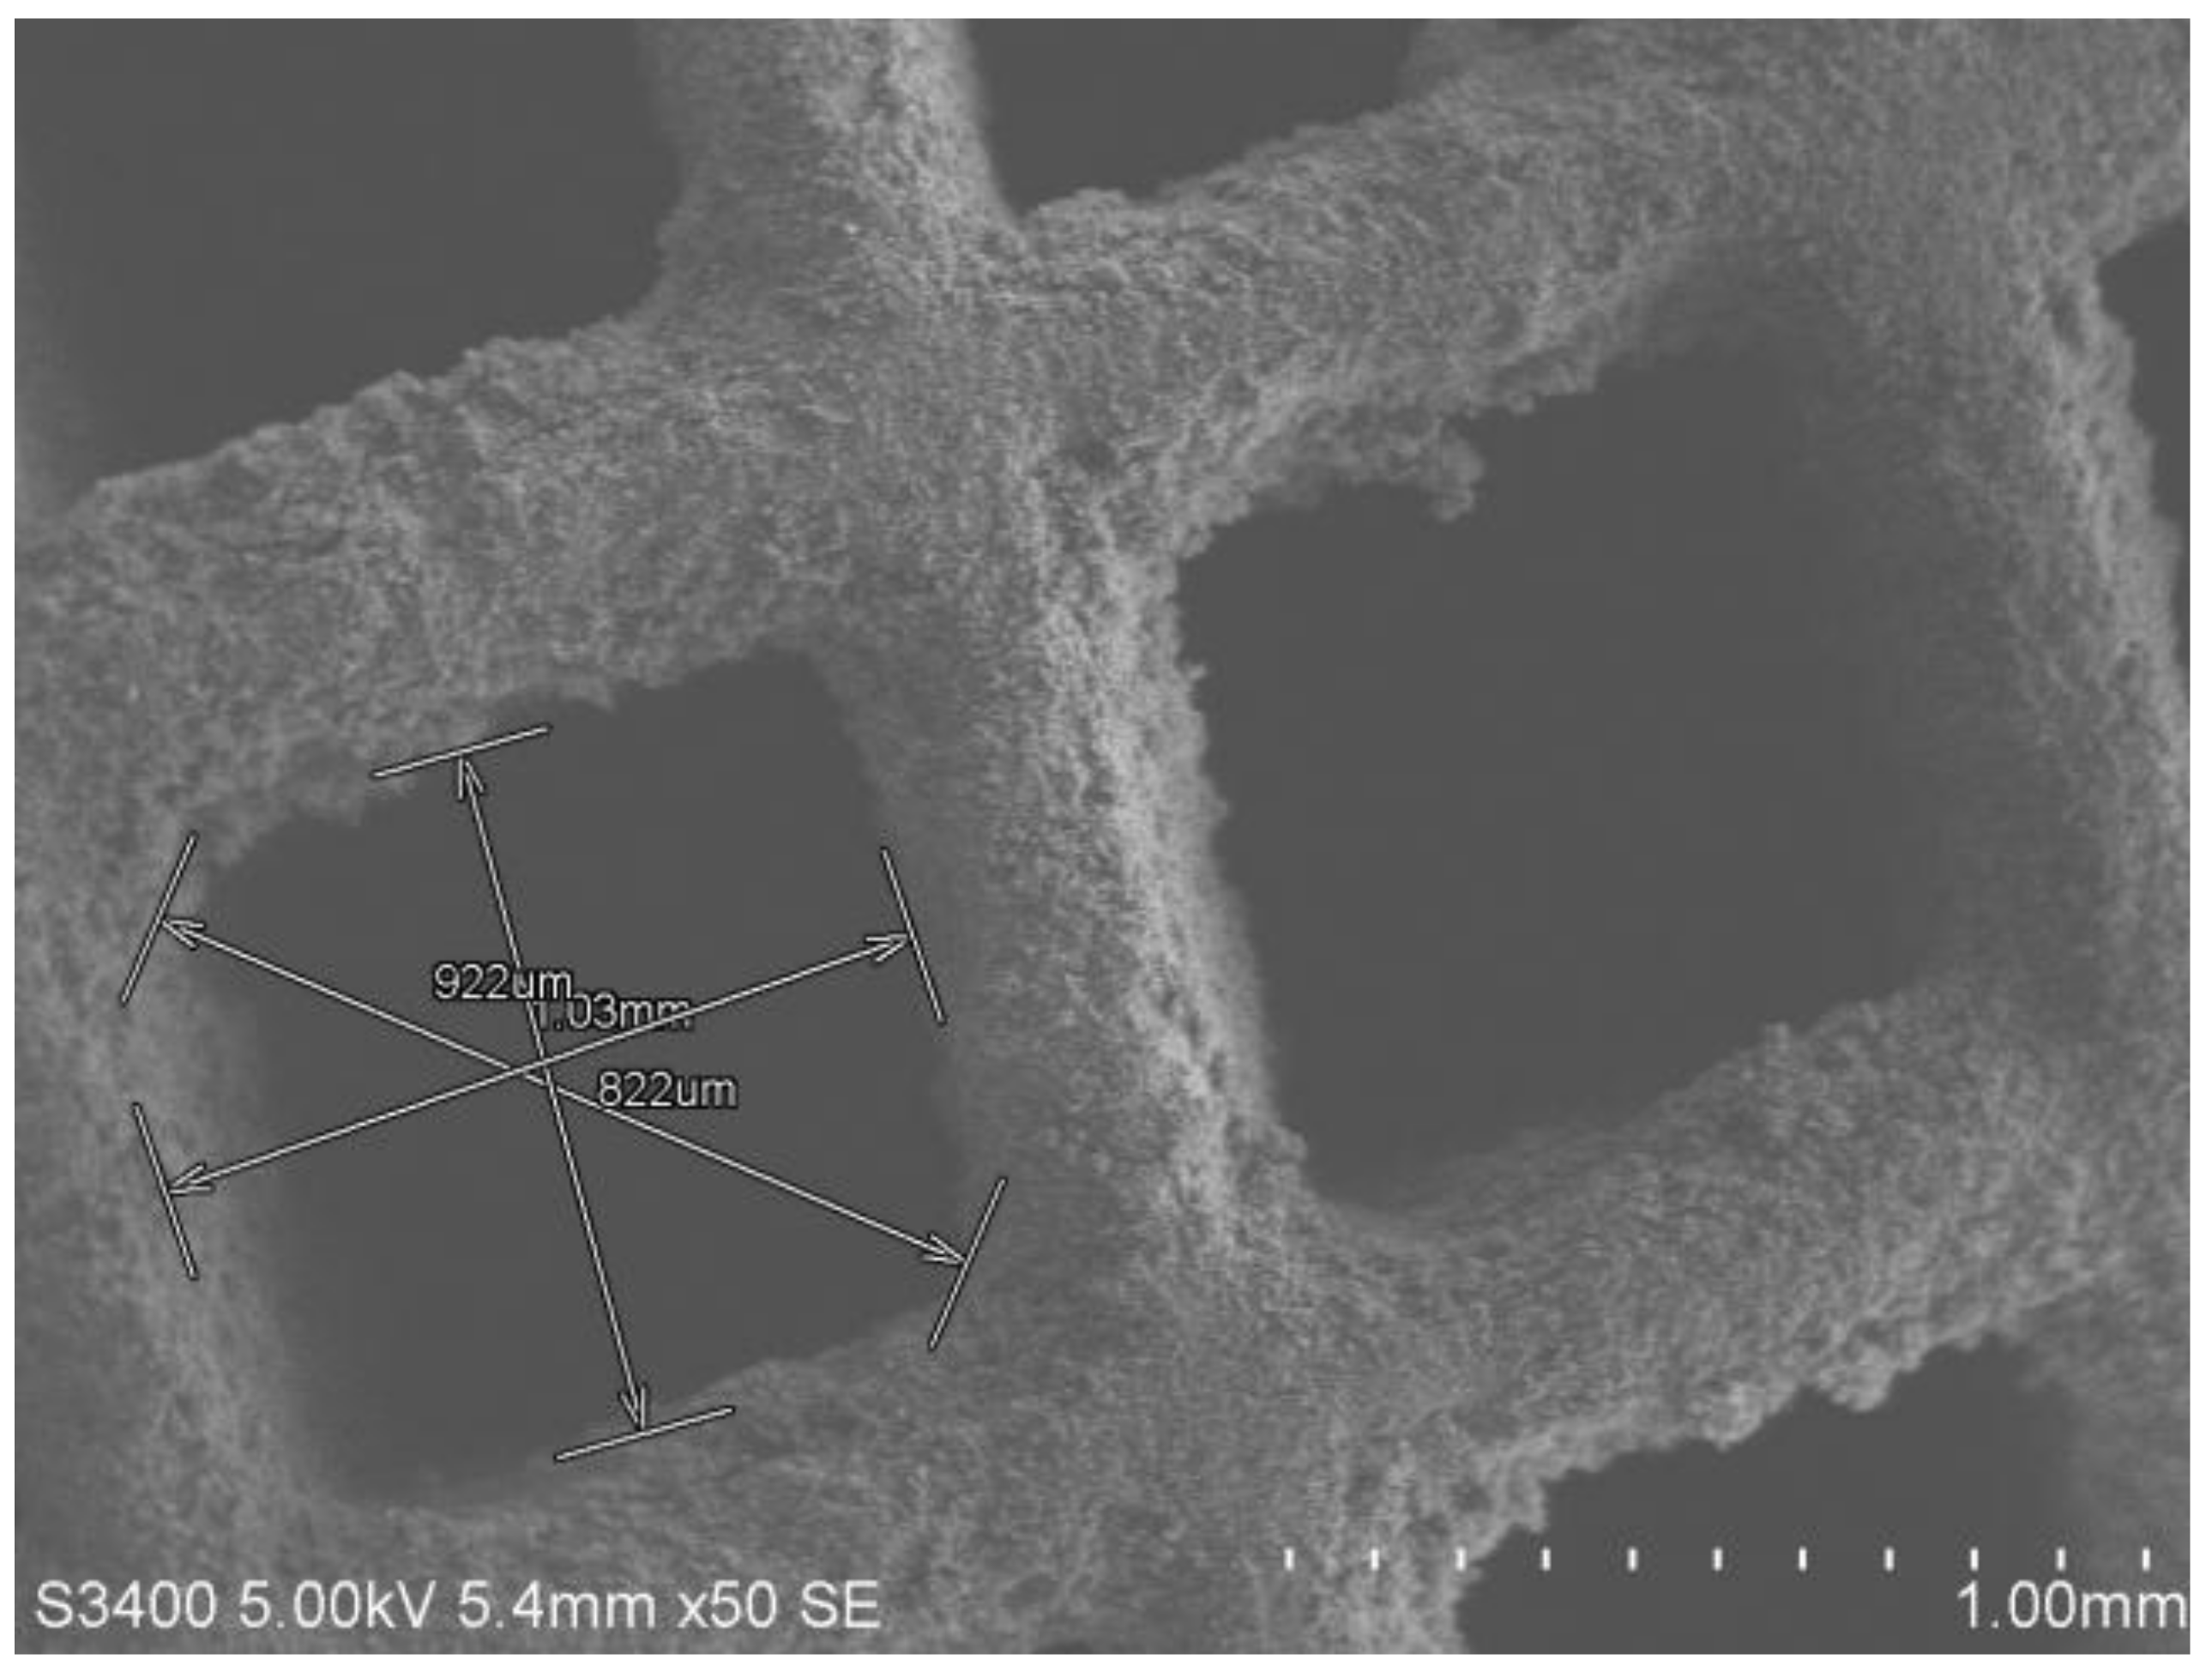
The typical SEM image of the spent CC facing the exhaust side (sample 3), used on diesel fuel, is given in Figure 5 and the EDS results are included in the Supplementary Materials. The measured dimensions of the ceramic monolith, which included the deposits, are given in Table 8. As compared with sample 2 in Figure 4, the deposits were less in thickness along the length, width, and diagonal but the intensity of C, O, and Al appeared to be greater than for the engine side. The ceramic bed consisted of oxidation and reduction catalysts, which reduced the toxicants from the emission. The toxicants filtered from catalysts were deposited in the pores, and compared to the engine side, the amount of deposition was reduced in the rear side of the ceramic bed. The combustion of diesel left some unburned hydrocarbons in the exhaust gases, leading to an increase in C content in the spent CC. The temperature and pressure of the exhaust gases were high near the engine and gradually decreased towards the exhaust side. Hence, as the gases passed through the CC, their temperature decreased, lowering the saturation temperature and pressure required to retain the C-rich particulate matter. As the gases passed the CC, the C precipitated in the channel along with the particulate matter. The presence of Al may be as a result of erosion of the CC. In comparison to the new CC, the intensity of C increased to a very high value (1052), indicating that the deposits were dominated by the C-compounds. Some large chunks of deposits were also noticed in the channels. These may be aggregates of the particulate matter picked up by the CC.
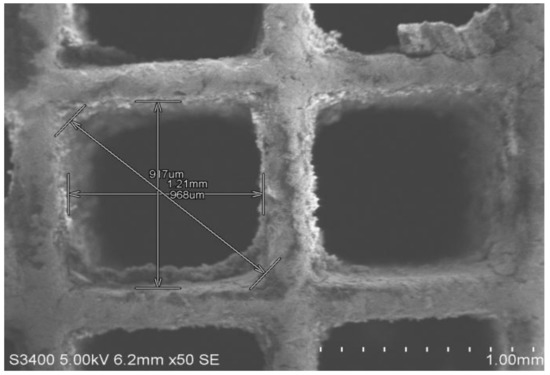
Figure 5.
SEM images of the spent CC, exhaust side, with diesel fuel (sample 3) at 50×. The dimensions of the ceramic monolith are marked by arrows.

Table 8.
Dimensions of square cannel of a monolith ceramic bed of the exhaust side of the spent CC used on diesel fuel (sample 3) and deposits along the length, width, and diagonal compared with the virgin CC.
The amount of deposits in sample 3 is given in Table 8 in comparison with the new CC.
The typical SEM picture of the engine side of the spent CC used on biodiesel fuel (sample 4) is shown in Figure 6, and the EDS results are included in the Supplementary Materials. The deposits were uniformly spread all along the surface of the channels, and their thickness was also higher compared to sample 2. The comparison of SEM images of sample 2 and sample 4 indicates that more matter was absorbed by the CC in biodiesel fuel, which is a good indicator of the efficiency of CCs in reducing the pollutants in the exhaust gases. Furthermore, the consistency of the deposits was better than with the diesel fuel, which confirms the better performance of the CC with biodiesel. B100 Pongamia is enriched with the oxygen. Due to this reason, the amount of water molecules present in the emission of biodiesel may be greater, which may have resulted in more deposition in the pores of the ceramic bed. Although the moisture content could not be determined due to the inevitable delay in the cooling of the engine, time required for dismantling, dissection, sample preparation, and transportation for forensic examination. The forensic examination was conducted after all the CCs were spent and, on average, the time between the completion of the tests and SEM examination was around three months. The peak of C was most prominent in the EDS results in sample 4 (intensity count 981), even higher than in the spent-CC engine side in the diesel fuel (intensity 955) due to efficient absorption of C from the exhaust flue gases.
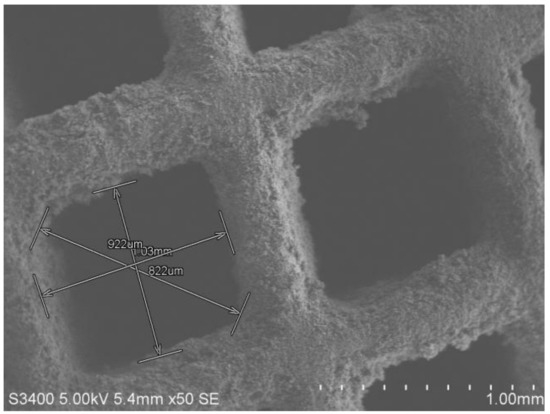
Figure 6.
SEM images of spent CC, engine side, with biodiesel fuel (sample 4) at 50×. The dimensions of the ceramic monolith are marked by arrows.
The thickness and percent of deposits in sample 4 were measured in contrast with the virgin CC and the results are given in Table 9. The deposits along the length, width, and diagonal were more than for the spent-CC engine side with diesel fuel (sample 2).

Table 9.
Dimensions of square cannel of a monolith ceramic bed of the engine side of the spent CC used on biodiesel fuel (sample 4) and deposits along the length, width, and diagonal compared with the virgin CC.
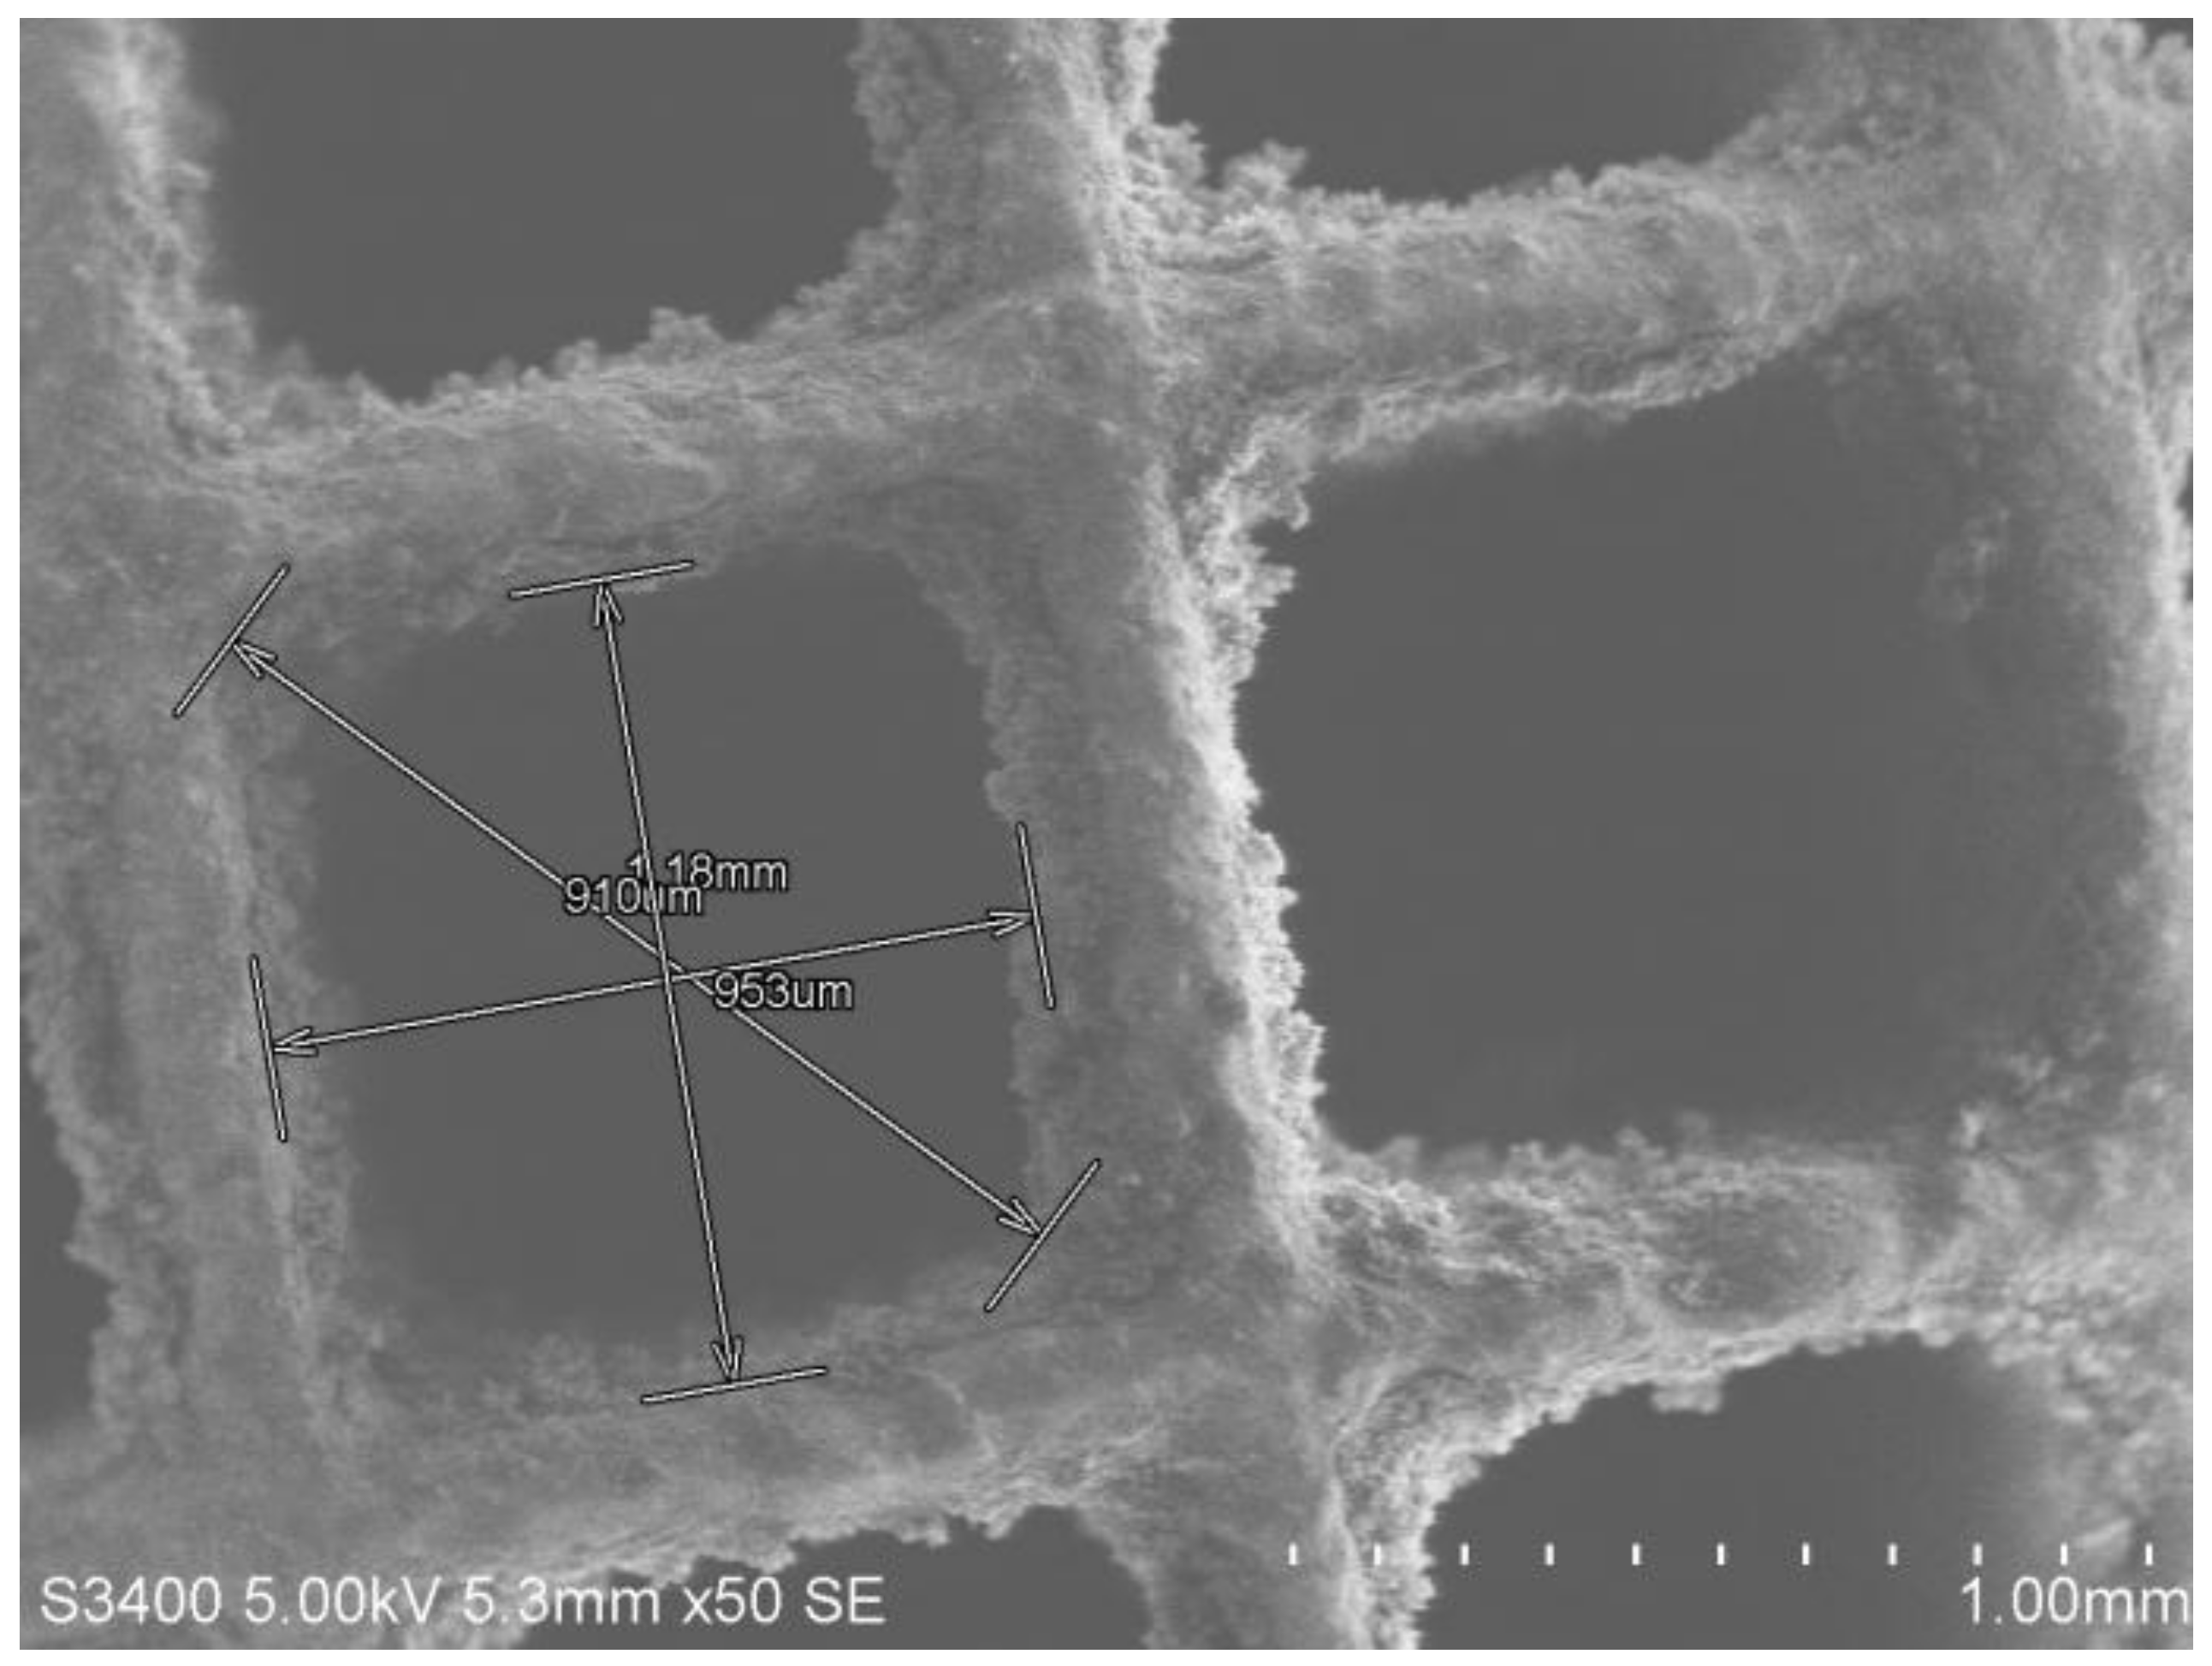
The typical SEM picture of the exhaust side of the spent CC used on biodiesel fuel (sample 5) is shown in Figure 7, and EDS results are included in Supplementary Materials. The deposits were higher than for the exhaust side of the spent CC compared with diesel, but less than for the engine side of the CC used with biodiesel. Since a large amount of the pollutants already deposited at the engine side, the deposits at the exhaust side were reduced. In comparison to diesel fuel, the deposits were higher in biodiesel fuel, indicating better efficiency and performance. The EDS results of the exhaust side of the spent CC in B100 Pongamia show that the deposits on the ceramic structure consisted of carbon, oxygen, sodium, phosphorus, and calcium. The emission compositions were similar to diesel, except phosphorous, sodium, and magnesium as these were present in the ceramic structure. The amount of C reduced in comparison with the diesel due to reduction in overall deposits, while the amount of O was greater due to moisture pickup from the atmosphere or due to its presence as metallic oxide in the CC material. The emission, after catalyzing, was converted into intoxicant gases. Compared to diesel, the toxicant present in the biodiesel was less, but due to moisture present in the biodiesel, the amount of deposition was comparatively greater. The EDS results indicate Al as the most prominent element, which may be due to wear of the CC on the exhaust side after 250 h of operation. As the deposits reduced at the rear side in biodiesel, the fresh surface of the spent CC exposed and elemental Al may have been detected with prominence due to its presence as alumina, a constituent CC material. Increased intensity of O may well be due to the same reason.
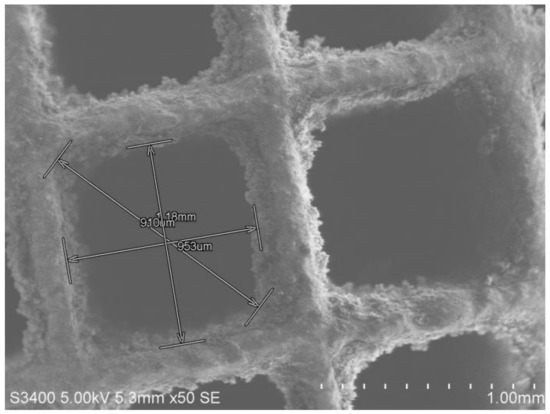
Figure 7.
SEM images of spent CC, exhaust side, with biodiesel fuel (sample 5) at 50×. The dimensions of the ceramic monolith are marked by arrows.
The deposit thickness in sample 5 is given in Table 10. Deposits were more than for the diesel fuel while they were less than for the engine side of the biodiesel fuel.

Table 10.
Dimensions of square cannel of a monolith ceramic bed of the exhaust side of the spent CC used on biodiesel fuel (sample 5) and deposits along the length, width, and diagonal compared with the virgin CC.
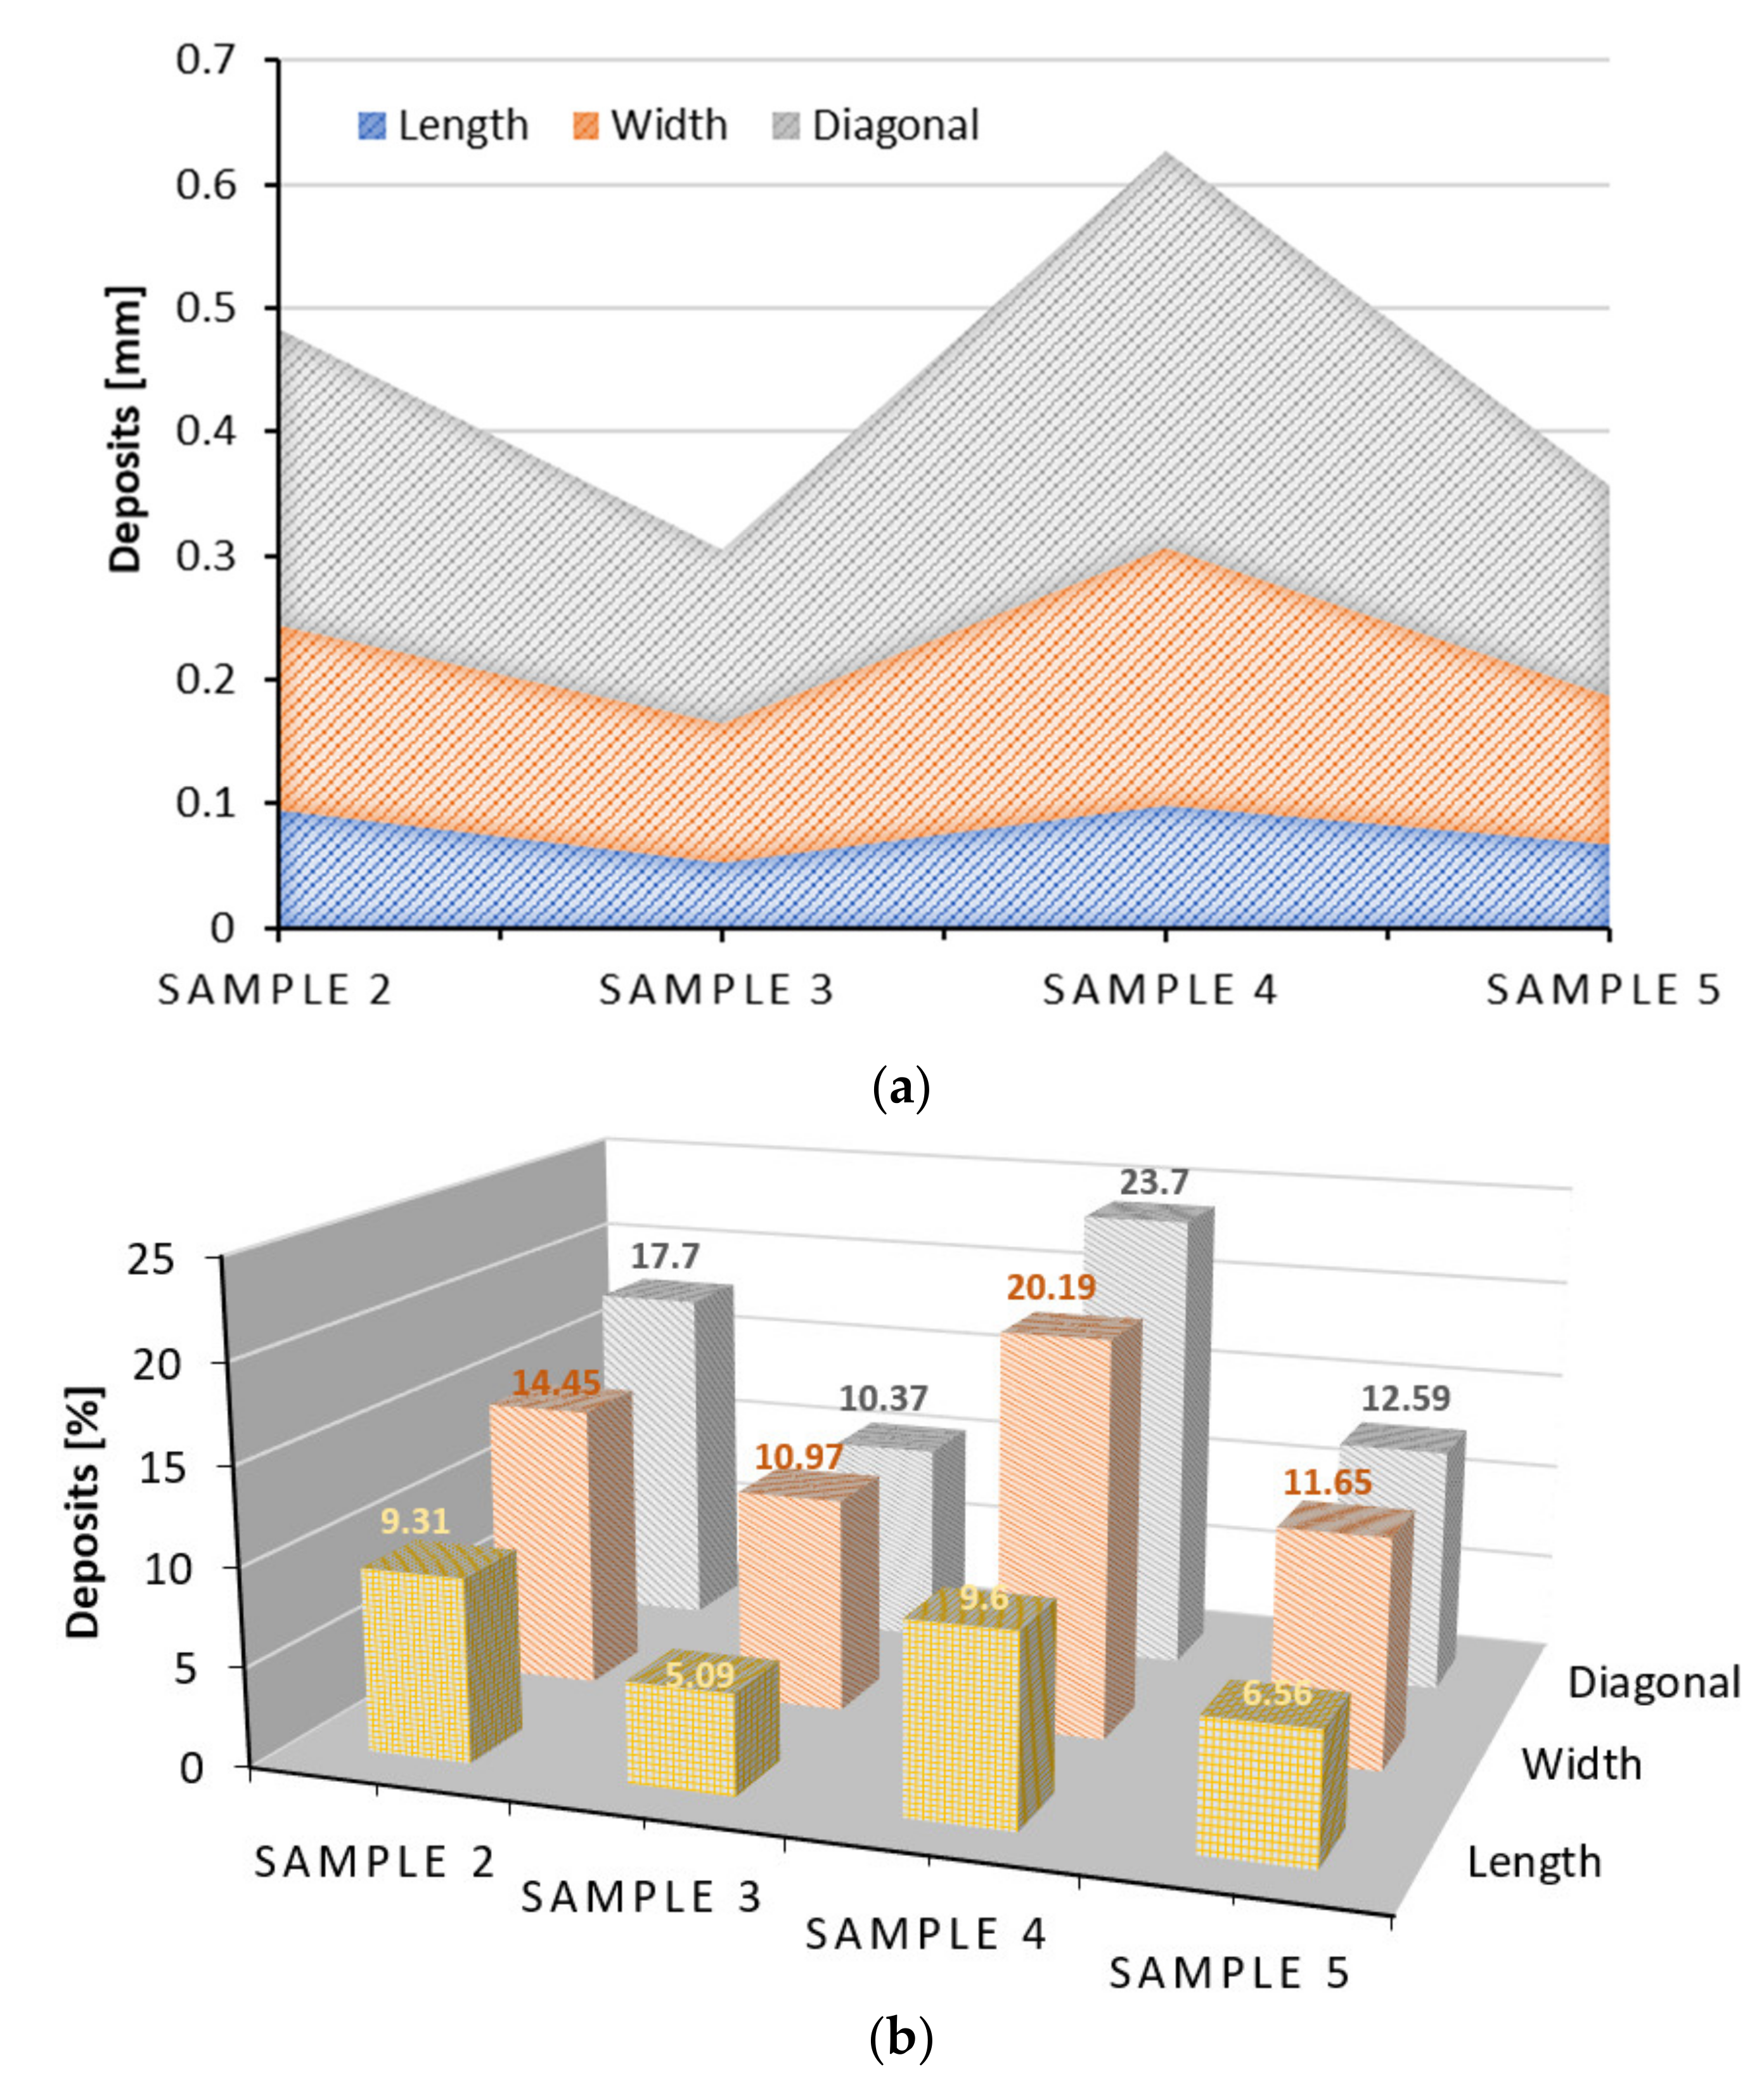
The dimensions obtained from all the SEM sample pictures were tabulated, and comparison made between the diesel mode samples and biodiesel mode samples. The thickness of depositions was obtained by comparing with the new CC and the results are plotted in Figure 8. The thickness of the deposits along the length, width, and diagonal are shown in Figure 8a and the percentages of the deposits are shown in Figure 8b. Maximum deposits were detected at the engine side of the spent CC with biodiesel fuel, followed by the samples 2, 5, and 3. The efficiency of the CC was better in the case of biodiesel fuel. The SEM images show that the deposits were uniform all along the ceramic bed.
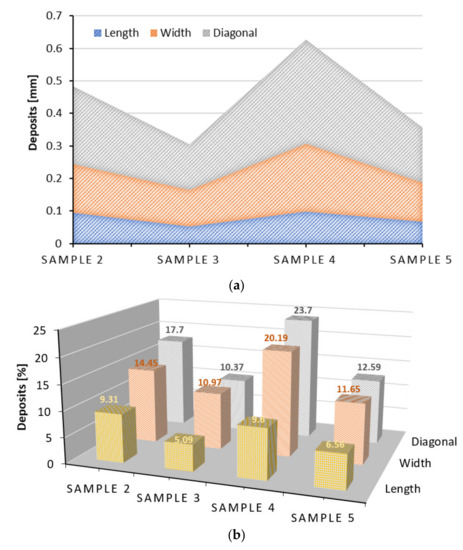
Figure 8.
(a) The deposition along the length, width, and diagonal in samples 2, 3, 4, and 5. (b) The percent deposition in the spent CC compared with the new one.
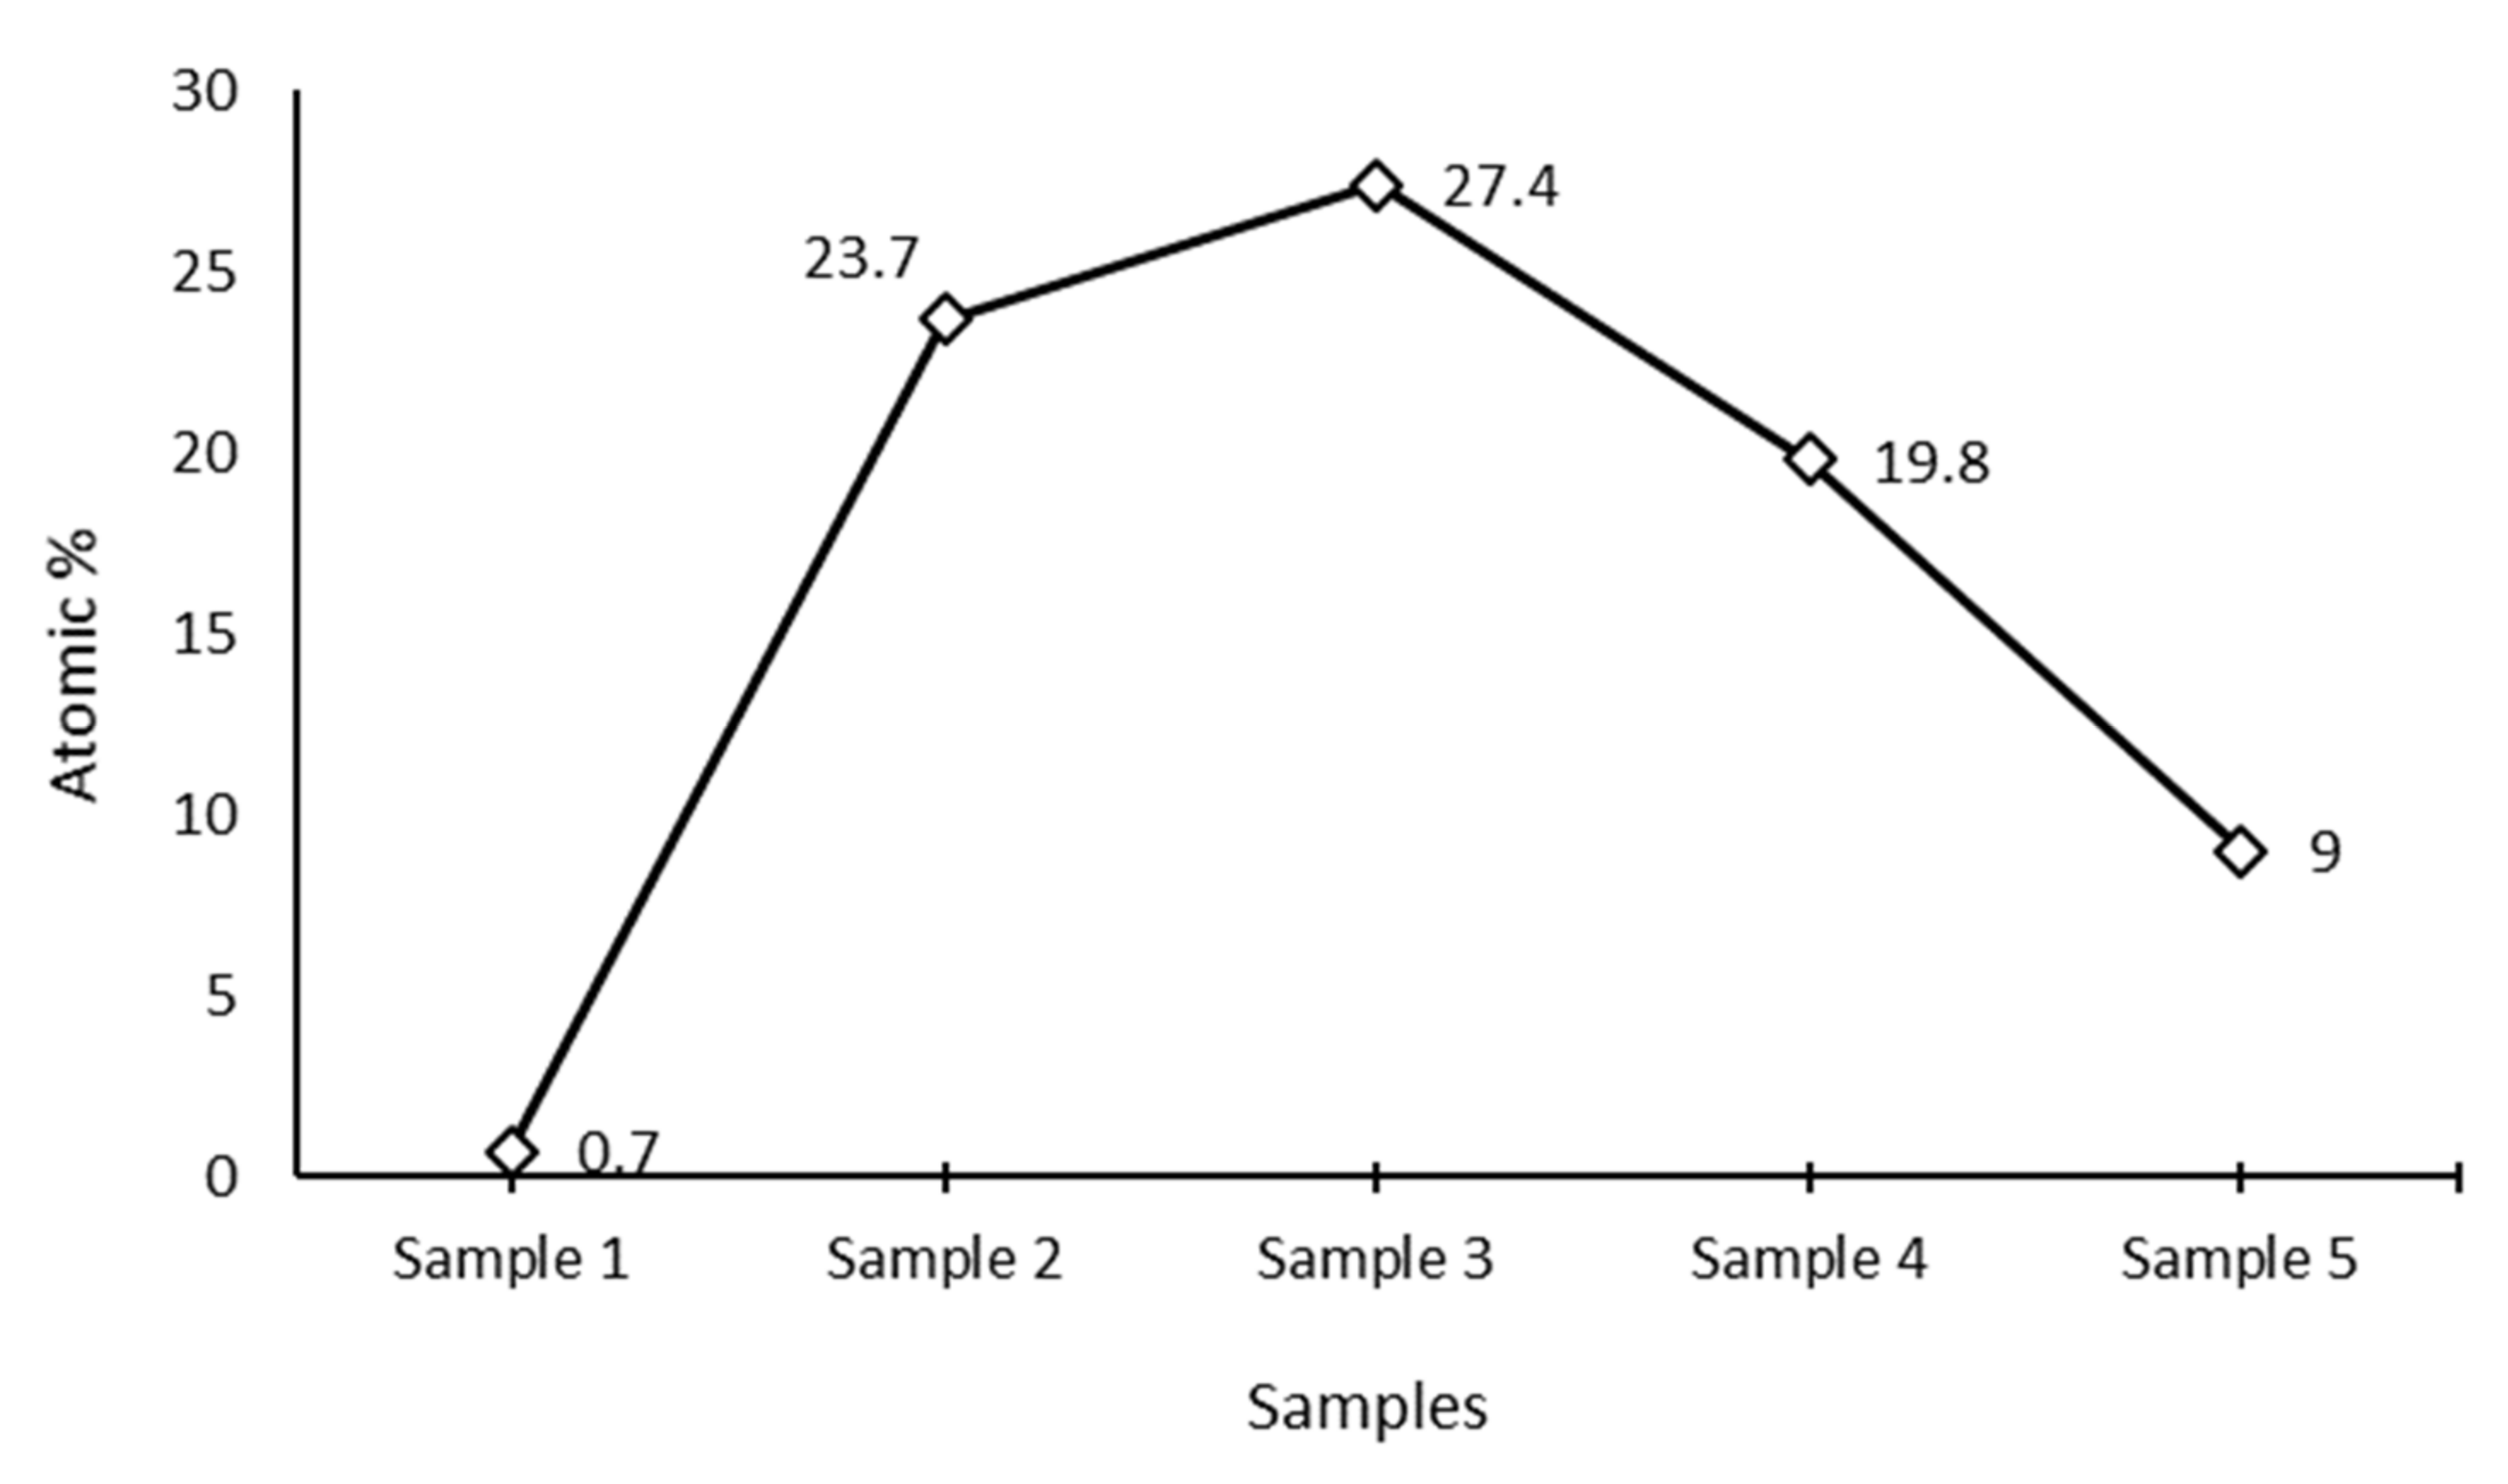
The presence of the elements and their atomic percent were obtained from the EDS results. Carbon (C) atomic percent (At. %) is plotted against the samples in Figure 9. One may observe that the virgin CC had only 0.7 At. % of C while its intensity counts in the EDS peaks (given in Supplementary Materials) was about 5, which was almost negligible on the scale. The virgin CC did not have any C deposit and this minor At. % was probably from the composition of the CC material. In sample 2 (diesel-engine side), the C At. % increased to 23.7 and the intensity count was around 955, due to the absorption of C from unburnt or semi-burnt hydrocarbons (HC) in the exhaust flue gases. On the exhaust side of diesel fuel, the C At. % was highest (27.4 % and intensity count 1052) due to its increased absorption at this end, attributed to: (i) the reduction in pressure as the exhaust flue gases traveled across the CC, and (ii) the reduction in temperature, reducing the saturation amount of HC and increasing its precipitation on the channels of the ceramic bed of the CC. In the case of biodiesel (samples 4 and 5), the C At. % was 19.8 and 9 and the intensity count was 981 and 397 on the engine side and exhaust side, respectively. The C pick-up from the gases increased due to the increase in the effectiveness of the CC with biodiesel at the engine side. Since the amount of C may have been less and the absorption was effective at the engine side of the CC, the C deposit at the exhaust side reduced considerably. The CC was quite effective and rather more efficient with biodiesel.
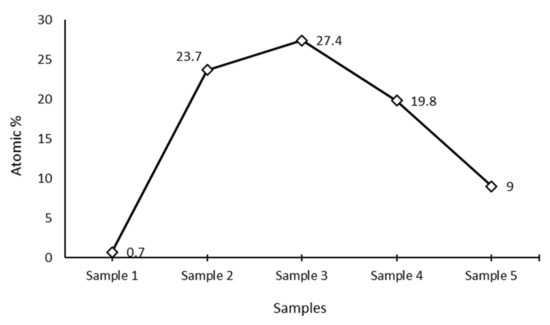
Figure 9.
Carbon values (atomic %) in samples 1, 2, 3, 4, and 5 estimated from EDS.
SEM pictures reveal that the deposition in Pongamia biodiesel-mode CC was greater than in the diesel-mode CC. In the exhaust emission of the Pongamia biodiesel, the amount of water molecules was greater, which led to deposition of more soot particles in the square channel, or these may have been absorbed from the atmosphere. The EDS results indicate that the efficiency of the catalytic converter increased while using B100 Pongamia at the engine side and reduced the deposits of soot and particulate matter at the exhaust side, compared with the diesel. Oxygen level in the Pongamia biodiesel-mode CC was greater compared to the diesel-mode CC, which was due to the presence of 11% more oxygen in the biodiesel increasing the water molecules in the exhaust, or due to the oxygen in combined form, detected from the fresh CC surface exposed at the exhaust side after wear since it was used for 250 h.
4. Conclusions
Characterization studies on spent CCs working on diesel and B100 Pongamia biodiesel using SEM/EDS revealed that the deposition in biodiesel mode was greater than in diesel mode. In the exhaust emission of the Pongamia biodiesel, water molecules were greater, which led to deposition of more suite particles in the square channel of the ceramic bed. The efficiency of the CC increased while using B100 Pongamia, and it arrested more particulate matter compared with diesel. The EDS results show that the carbon level was reduced at the rear side in B100 Pongamia compared to diesel due to improved absorption at the engine side. Oxygen level in the Pongamia biodiesel mode was greater compared to the diesel mode due to more oxygen in the biodiesel, increasing the water molecules in the exhaust, and the combined oxygen present in the metal oxide constituents of the ceramic CC. The C At. % was highest in the exhaust side of the spent CC with diesel fuel, while the minimum C At. % was observed at the exhaust side of the spent CC with B100 Pangamia biodiesel.
Supplementary Materials
The following are available online at https://www.mdpi.com/article/10.3390/su131910729/s1.
Author Contributions
Conceptualization, N.M. and C.R.R., J.V.; methodology, N.M., C.R.R., J.V.; validation, V.T., I.A.B.; formal analysis, C.R.R., T.M.Y.K., V.T.; investigation, N.M. and T.M.Y.K.; writing, V.T. and T.M.Y.K.; writing—review and editing, I.A.B.; supervision, T.M.Y.K.; project administration, I.A.B.; funding acquisition, I.A.B. and T.M.Y.K. All authors have read and agreed to the published version of the manuscript.
Funding
Deanship of Scientific Research at King Khalid University under grant number (R.G.P 2/166/42).
Institutional Review Board Statement
Not applicable.
Informed Consent Statement
Not applicable.
Data Availability Statement
Not applicable.
Acknowledgments
The authors extend their appreciation to the Deanship of Scientific Research at King Khalid University for funding this work through research groups program under grant number (R.G.P. 2/166/42).
Conflicts of Interest
The authors declare no conflict of interest.
References
- Kalghatgi, G. Is it really the end of internal combustion engines and petroleum in transport? Appl. Energy 2018, 225, 965–974. [Google Scholar] [CrossRef]
- Dudley, B. BP Energy Outlook; Report–BP Energy Economics: London, UK, 2018; Volume 9. [Google Scholar]
- Energy Information Administration; Government Printing Office. International Energy Outlook 2016, with Projections to 2040; Government Printing Office: Washington, DC, USA, 2016.
- Gadonneix, P.; Sambo, A.; Tie’nan, L.; Choudhury, A.R.; Teyssen, J.; Vargas Lleras, J.A.; Naqi, A.A.; Meyers, K.; Shin, H.C.; Nadeau, M.-J.; et al. Global Transport Scenarios 2050; Transport; World Energy Council: London, UK, 2011. [Google Scholar]
- OPEC Secretariat. World Oil Outlook, 2013; OPEC Secretariat: Vienna, Austria, 2013. [Google Scholar]
- Podgorny, A.; Varshavsky, I.L.; Makarov, A.A.; Mischenko, A.I. Usage of hydrogen fuel in internal-combustion engines. Preprint 1977, 45, 32. [Google Scholar]
- Chen, Y.; Borken-Kleefeld, J. Real-driving emissions from cars and light commercial vehicles–Results from 13 years remote sensing at Zurich/CH. Atmos. Environ. 2014, 88, 157–164. [Google Scholar] [CrossRef]
- Sakthivel, G.; Nagarajan, G.; Ilangkumaran, M.; Gaikwad, A.B. Comparative analysis of performance, emission and combustion parameters of diesel engine fuelled with ethyl ester of fish oil and its diesel blends. Fuel 2014, 132, 116–124. [Google Scholar] [CrossRef]
- Behçet, R. Performance and emission study of waste anchovy fish biodiesel in a diesel engine. Fuel Process. Technol. 2011, 92, 1187–1194. [Google Scholar] [CrossRef]
- Godiganur, S.M.; Murthy, C.S.; Reddy, R.P. Performance and emission characteristics of a Kirloskar HA394 diesel engine operated on fish oil methyl esters. Renew. Energy 2010, 35, 355–359. [Google Scholar] [CrossRef]
- Appavu, P.M.; Madhavan, V.R.; Venu, H.; Mariadoss, A. Effect of fuel additives and exhaust gas recirculation in biodiesel fuelled CI engine: A review. Int. J. Ambient. Energy 2019, 1–7. [Google Scholar] [CrossRef]
- Bari, S.H.; Hossain, S.N. Performance and emission analysis of a diesel engine running on palm oil diesel (POD). Energy Procedia 2019, 160, 92–99. [Google Scholar] [CrossRef]
- Jahanbakhshi, A.; Salehi, R. Processing watermelon waste using Saccharomyces cerevisiae yeast and the fermentation method for bioethanol production. J. Food Process. Eng. 2019, 42, e13283. [Google Scholar] [CrossRef]
- Banapurmath, N.R.; Tewari, P.G.; Hosmath, R.S. Performance and emission characteristics of a DI compression ignition engine operated on Honge, Jatropha and sesame oil methyl esters. Renew. Energy 2008, 33, 1982–1988. [Google Scholar] [CrossRef]
- Banapurmath, N.R.; Tewari, P.G.; Hosmath, R.S. Experimental investigations of a four-stroke single cylinder direct injection diesel engine operated on dual fuel mode with producer gas as inducted fuel and Honge oil and its methyl ester (HOME) as injected fuels. Renew. Energy 2008, 33, 2007–2018. [Google Scholar] [CrossRef]
- Banapurmath, N.R.; Tewari, P.G. Comparative performance studies of a 4-stroke CI engine operated on dual fuel mode with producer gas and Honge oil and its methyl ester (HOME) with and without carburetor. Renew. Energy 2009, 34, 1009–1015. [Google Scholar] [CrossRef]
- Gumus, M.; Sayin, C.; Canakci, M. The impact of fuel injection pressure on the exhaust emissions of a direct injection diesel engine fueled with biodiesel—Diesel fuel blends. Fuel 2012, 95, 486–494. [Google Scholar] [CrossRef]
- Bhatnagar, A.; Kumari, N.P.; Sahoo, P.K. Reduction 0f NOx Emissions with Three—Way Catalytic Converter for IDI Engine Fuelled With Diesel, JSVO and Their Blends. Int. J. Eng. Res. Technol. 2013, 2, 1–11. [Google Scholar]
- Ramalingam, S.; Rajendran, S.; Ganesan, P. Performance improvement and exhaust emissions reduction in biodiesel operated diesel engine through the use of operating parameters and catalytic converter: A review. Renew. Sustain. Energy Rev. 2018, 81, 3215–3222. [Google Scholar] [CrossRef]
- John, H. Internal Combustion Engine Fundamentals; McGraw-Hill Science: New York, NY, USA, 1988. [Google Scholar]
- Vallinayagam, R.; Vedharaj, S.; Yang, W.M.; Saravanan, C.G.; Lee, P.S.; Chua, S.K.; Choua, S.K. Emission reduction from a diesel engine fuelled by pine oil biofuel using SCR and catalytic converter. Atmos. Environ. 2018, 80, 190–197. [Google Scholar] [CrossRef]
- Durairajan, A.; Kavitha, T.; Rajendran, A.; Kumaraswamidhas, L.A. Design and manufacturing of nano catalytic converter for pollution control in automobiles for green environment. Int. J. Innov. Dev. 2015, 1, 314–319. [Google Scholar]
- Subramaniam, D.; Murugesan, A.; Avinash, A. Performance and emission evaluation of biodiesel fuelled diesel engine abetted with exhaust gas recirculation and Ni coated catalytic converter. J. Renew Sustain. Energy 2013, 5, 1–10. [Google Scholar] [CrossRef]
- Obada, D.; Peter, M.; Kulla, D.M.; Omisanya, N.O.; Atta, A.Y.; Dodoo-Arhin, D. Catalytic abatement of CO species from incomplete combustion of solid fuels used in domestic cooking. Heliyon 2018, 4, e00748. [Google Scholar] [CrossRef] [PubMed] [Green Version]
- Willner, J.; Fornalczyk, A. Dissolution of Ceramic Monolith of Spent Catalytic Converters by Using Hydrometallurgical Methods. Arch. Metall. Mater. 2015, 60, 2498. [Google Scholar]
Publisher’s Note: MDPI stays neutral with regard to jurisdictional claims in published maps and institutional affiliations. |
© 2021 by the authors. Licensee MDPI, Basel, Switzerland. This article is an open access article distributed under the terms and conditions of the Creative Commons Attribution (CC BY) license (https://creativecommons.org/licenses/by/4.0/).

