Article

Evaluation Method of Synergy Degree for Comprehensive Benefits System of Hydropower Projects

1
State Key Laboratory of Hydraulics and Mountain River Engineering, Sichuan University, No. 24 South Section 1, Yihuan Road, Chengdu 610065, China
2
College of Water Resource & Hydropower, Sichuan University, No. 24 South Section 1, Yihuan Road, Chengdu 610065, China
3
Sichuan Vocational and Technical College of Communications, No. 208 East Section, Liutai Avenue, Wenjiang District, Chengdu 611130, China
4
Dam Management Center of Dadu River Hydropower Development Co., Ltd., Chengdu 610093, China
*
Author to whom correspondence should be addressed.
Sustainability 2021, 13(19), 10770; https://doi.org/10.3390/su131910770
Submission received: 22 July 2021 / Revised: 23 September 2021 / Accepted: 24 September 2021 / Published: 28 September 2021

Abstract

:
The hydropower project had comprehensively benefited people from aspects of the economy, society, ecology, etc. The comprehensive benefit is a key indicator for evaluating a project’s performance. However, the existing studies only evaluated the comprehensive benefit and ignored the relationship among different benefits, which is of great significance for the sustainable development of a project. Therefore, in the framework of the complex system composed of economic, social, and ecological benefit subsystems, a synergy degree evaluation method is constructed based on the evaluation index system of the comprehensive benefits, and the compound weight is determined by using the non-linear model and the Lagrange function. Thus, the changing rules of the order degree and the synergy degree for the subsystems in different years can be obtained. The proposed method is applied to a gate dam (named SG) to appraise the relationship among benefits. The results show that the economic, social, and ecological benefits of the SG dam from 2011 to 2018 are gradually to be a better state, but the synergy degrees of the complex system belong to “bottom synergy” and “moderate synergy” level, which indicates that there is no close cooperation among the three benefit subsystems.

1. Introduction

Hydropower projects meet the needs of water supply and storage, energy generation, flood control, and drainage, irrigation, shipping, and environmental improvement, which bring economic, social, and ecological benefits. However, the tendency of attaching importance to the single benefit of hydropower projects is prominent, which leads to an unbalanced and uncoordinated value function. Water conservancy and construction in the agricultural era and the industrial era took “the development of agriculture” and “the energy supply” as the main function, respectively, limited to economic or social benefits, and neglected the balance and promotion of various benefits [1]. In the post-industrial era, water conservancy projects have turned to the theme of “people’s livelihood and water conservancy”, which requires realizing the combination of benefits and harm elimination, and an equal emphasis on disaster prevention and reduction, the ecological balance of power generation, and harmonious coexistence of humans and water [2]. In view of this principle, this study suggests that the key to the management of hydropower projects is to consider the comprehensive benefits of the project and study the intertwined effects among various benefits, so as to realize the positive interactions among them.
At present, the study of benefits evaluation of hydropower projects has changed from the single-factor evaluation to the comprehensive evaluation [3,4,5,6]. Zhu and Fang [7] established an evaluation index system and obtained weights through the analytic hierarchy process (AHP) for evaluating the operational status, which guaranteed the financial balance of water conservancy projects. Gao et al. [8,9] put forward a model based on the θ-improved limited-tolerance relation and an improved genetic algorithm-back propagation (GA-BP) Neural Network model to objectively evaluate the modernization of water-conservancy project management. Zhu et al. [10] evaluated the efficiency of water conservancy by the super-efficiency data envelopment analysis (DEA) model and the Malmquist index. The existing research simply evaluates one aspect of the economic, social, and ecological benefits of hydropower projects; even if the social and ecological benefits are integrated into the evaluation system, the mutual relationship among economic, social, and ecological benefits is not taken into account, which leads to the problem of infinite expansion of certain types of benefits to make up for the lack of other benefits in project management.
Synergy theory was originally founded by Hermann Haken [11]. The theory holds that the total utility produced by the integration of various elements of the system through conscious behavior is greater than the sum of the utility of each part. In other areas, the application of “Synergy Theory” has been beneficial. Bai et al. [12] built a model of synergy degree to measure the synergistic relationship between the project portfolio, strategy, and environment. Huang et al. [13] put forward a synergy evaluation model of disaster prevention and mitigation in coastal cities based on the capacity-coupling coefficient. Jiao et al. [14] studied the synergistic development and orderly evolution trend of sustainable urbanization based on the construction of a sustainable urbanization synergy system. This concept has also been promoted in the water resources sector. Wang et al. [15] applied the calculation model of a coordinated development degree to analyze the coordinated development level of water resources–social economy–ecological environment systems. Zhu et al. [16] provided a quantitative method for synergy degree evaluation to facilitate the hydropower EPC project management synergy. These reflect the superiority of the synergy degree in solving the problems of synergistic management in a composite system. However, there are a few studies on the influencing factors and the linkage method among the collaborative benefits. Using the synergy-degree evaluation method to improve the comprehensive benefits of hydropower projects has become one of the emphases for research.
The objective of this paper is to propose an evaluation method of synergy degree among various subsystems and elements, which can easily identify the collaborative state and the relationships of benefits for hydropower projects. The main contents are as follows: (a) construct an evaluation index and calculate compound weight by the nonlinear model and Lagrange function based on the subjective and objective weight in the complex-benefits system frame of hydropower projects; (b) establish an evaluation method of synergy degree by geometric average and weighted sum methods combined with the evaluation index and compound weight as described above, which describes the degree of coordination and the dynamic feedback relationship among various subsystems and factors; (c) using the SG dam as an example, the effectiveness and applicability are investigated, and the advantages are discussed.

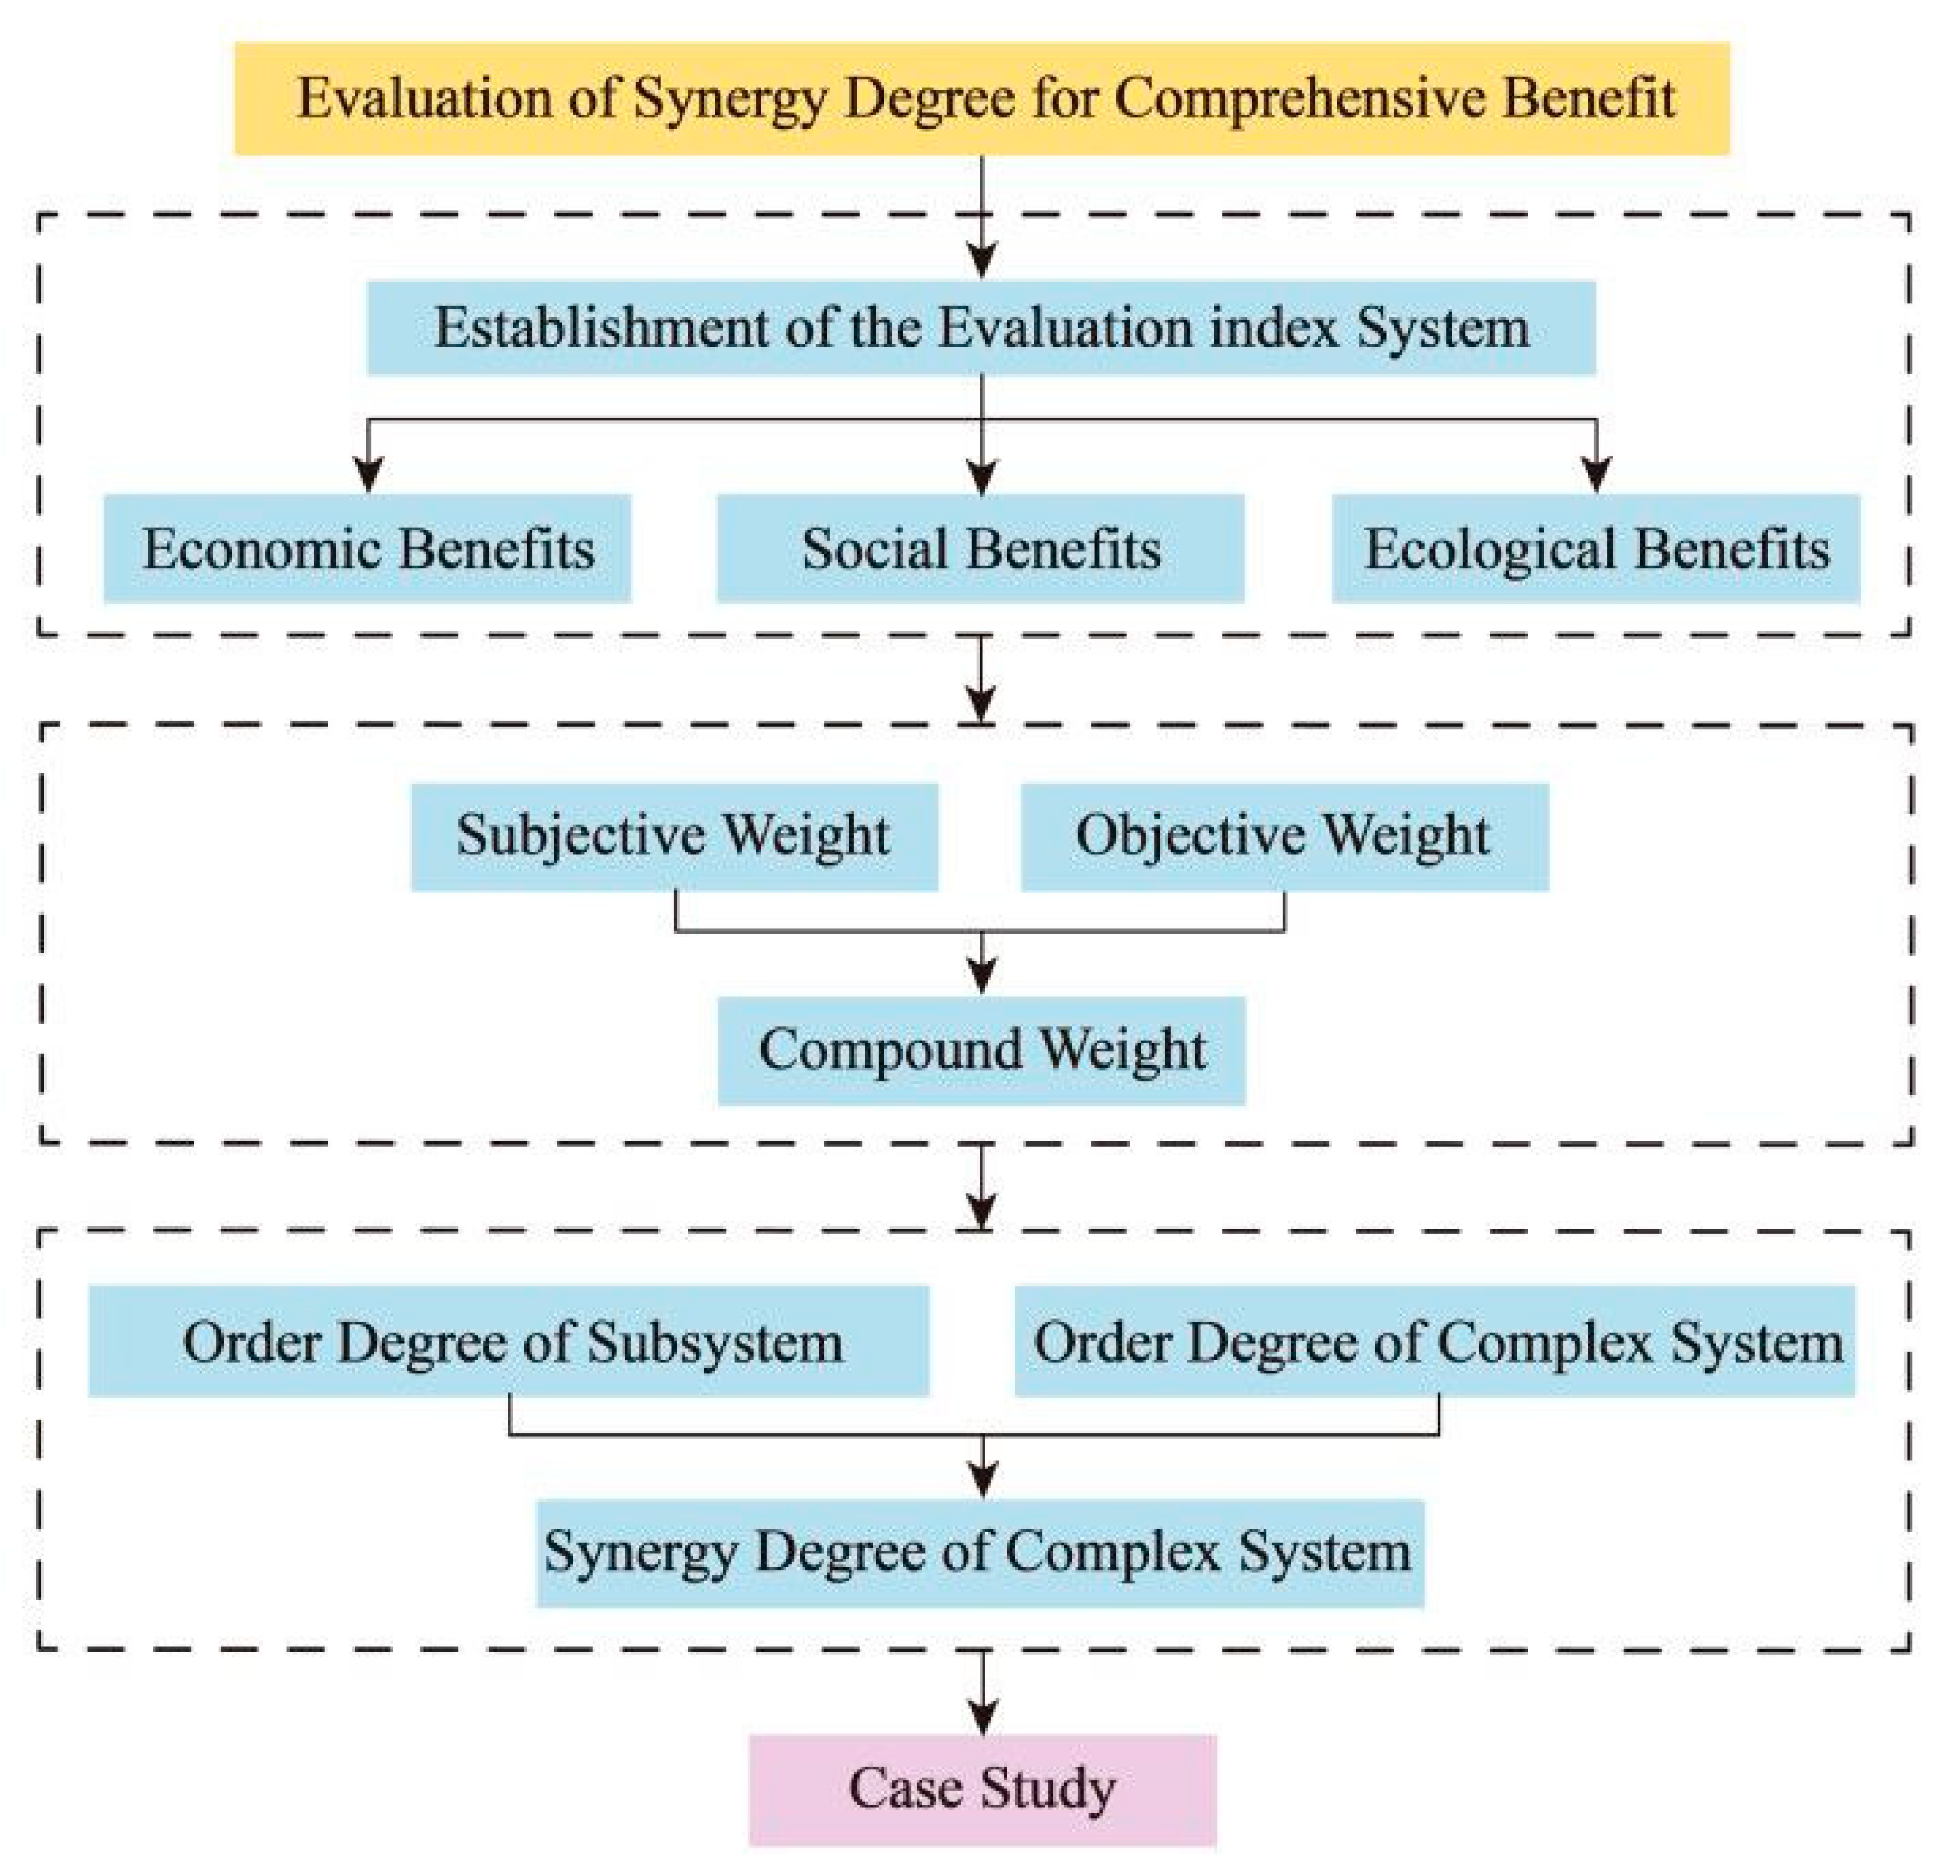
2. Synergy Evaluation Method

2.1. Construction of Complex System and Index System

Hermann Haken put forward the concept of “synergy theory” [11]. Synergetics regards society as a system composed of subsystems or elements, each of which is in an interrelated and influential situation. It means that the overall coordinated operation performance of the system is closely related to the elements (i.e., evaluation index) within each subsystem, and the degree of coordination among elements and subsystems has a decisive effect on the final state and structure of the system, which dominates the evolution process of the system [17].
Based on this theory, this paper regards the comprehensive benefits of the hydropower project as a complex system, which is divided into three benefit subsystems: economic, social, and ecological. Each subsystem can be subdivided into several elements. A complete and scientific index system is established based on the existing research results, the characteristics of the hydropower projects, and the interaction between the various subsystems under the framework of a complex system. In order to avoid information overlap among the economic, social, and ecological benefit indexes, the key indexes with independent attributes should be selected as far as possible to exclude compatibility among the indexes. At the same time, on the premise of satisfying the completeness of the system, the number of indexes should be reduced as much as possible, and the key indexes should be highlighted for practical calculation and analysis to increase the accuracy and scientificity of the evaluation. Therefore, the selection of evaluation indexes that can sensitively reflect the synergy of the system is the first step in the evaluation process.

2.2. Determination of the Weights

The accuracy of the evaluation-index weights directly affects the results of comprehensive benefits evaluation. The AHP and the entropy methods are the commonly used methodologies in analyzing index weights. However, the AHP cannot avoid the unreasonable evaluation caused by subjective opinions of the decision-makers, and the entropy method relies too much on the data and ignores the importance of the index itself. Therefore, calculating the compound weight based on the AHP and the entropy methods can combine the merits of subjective experience (subjective weight) and the objective facts (objective weight), which effectively avoids evaluation bias caused by an imperfect index system.

2.2.1. Subjective Weight

Subjective weight can be calculated by the AHP method [16,18], which is widely used to deal with complex decision-making problems. According to the evaluation index system, this study selected and invited scholars focused on the field of water conservancy and experts who worked in the water-resource industry of government and enterprises to finish the questionnaire. From the total 50 questionnaires issued, 48 were recovered and valid. After consultation with the experts through questionnaires, numbers ranging from 1 to 9 and their reciprocals were used to represent the relative importance of the indexes to benefits in the pairwise comparison (equally important ~1, slightly important ~3, obviously important ~5, very important ~7, extremely important ~9). The corresponding judgment matrix is determined, that is,
D n m = d 11 d 12 d 1 m d 21 d 22 d 2 m d n 1 d n 2 d n m
where D n m represents the judgment matrix; d i j represents the comparative degree of index i and index j.
Based on the judgment matrix, the relative weight vectors of each index are calculated by normalization (as given in Equation (2)), and the maximum eigenvalue and its eigenvector are calculated according to D n m = λ m a x ω j .
ω j = j = 1 m d i j ¯ i = 1 n d i j
where ω j represents the subjective weight; d i j ¯ represents the mean value within the cluster dij; and the ω j should satisfy i = 1 m ω j = 1   ω j 0 .
Judgment matrix also has an important impact on the analysis results, so the consistency test of interval judgment matrix is needed, which is shown as:
C R = C I / R I
C I = λ m a x n n 1
where CR is the consistency ratio; CI is the consistency index; λ m a x is the maximum eigenvalue of the judgment matrix; n is the index number; RI is the random index, as indicated in Table 1.
The criterion for the consistency test is 0.1. If the matrix of consistency test index CR exceeds the standard value and does not satisfy the requirement, then further processing is needed.

2.2.2. Objective Weight

According to the amount of information reflected in the data, the entropy method is used to determine the objective weight, which can evaluate the research projects scientifically and objectively [19,20]. The calculation process is as follows:
Firstly, normalized processing is made. It is assumed that there are n indexes and m dating ages. In order to make the index with different units that can be compared and calculated, the Min-Max normalization method is used to normalize the original data in a dimensionless fashion, which is given in Equation (5).
X i j = x i j m i n x i j , x m j m a x x i j , x m j m i n x i j , x m j P o s i t i v e   i n d e x e s m a x x i j , x m j x i j m a x x i j , x m j m i n x i j , x m j N e g a t i v e   i n d e x e s
where X i j is the value of the normalized evaluation index; xij is the value of the original data.
Secondly, the proportion of the jth index in the ith years is calculated as:
p i j = X i j i = 1 n X i j
where pij is the proportion of the jth index in the ith year; X i j is the value of the normalized evaluation index; and n is the total number of dating ages.
Thirdly, the entropy value of the jth index can be obtained by Equation (7) [20].
e j = 1 l n ( n ) i = 1 n p i j l n ( p i j ) ,   e j [ 0 , 1 ]
where ej is the entropy of the jth index and p i j is the proportion of the jth index in the ith year.
Then, the difference coefficient of the jth index is calculated by Equation (8).
f j = 1 e j
where fj is the difference coefficient of the jth index; and ej the entropy value of the jth index. The smaller the index entropy is, the greater the difference coefficient is, and the greater the weight of the index.
Finally, the weight value of the jth index is obtained according to Equation (9).
ω j = f j j = 1 m f j
where ω j is the weight of the jth index; f j is the difference coefficient of the jth index, and m is the total number of indexes.

2.2.3. Compound Weight

The final weight is a compound weight determined by the subjective and the objective weights, which takes advantage of the AHP and the entropy method and avoids shortcomings of the simple weighting method. The nonlinear model (Equation (10)) and Lagrange function (Equation (11)) are introduced to describe the compound weight [21]:
i = 1 n H = i = 1 n j = 1 m X i j α ω j + β ω j
L = - i = 1 n j = 1 m X i j α ω j + β ω j + γ α 2 + β 2 1
where H is the target value of indexes; α ,   β satisfy the constraint of α 2 + β 2 = 1 , α ,   β 0 ; γ is the multiplier of Lagrange.
And then the compound weight can be given as:
ω j = α ¯ ω j + β ¯ ω j
where ω j is the compound weight of the jth index; α ,   β can be calculated by using the Lagrangian formula; α ¯ , β ¯ can be obtained by the normalized α and β .

2.3. Evaluation Method Based on the Synergy Degree

2.3.1. Order Degree of Subsystems

In this paper, the synergy degree of hydropower project benefits is quantitatively evaluated by using the Synergy theory. In order to evaluate the synergy degree of the system, it is necessary to determine the contribution of each index to the subsystem, which is order degree. The calculation of the order degree of the three benefit subsystems is given by Equation (13), which can be determined by relationships among indexes of each subsystem.
u i T n k i j = k i j b i j a i j b i j P o s i t i v e   e f f e c t s a i j k i j a i j b i j N e g a t i v e   e f f e c t s
where u i T n k i j is the contribution level of the variable k i j to the subsystem order degree at a time T n , reflecting the satisfaction of each index in each subsystem to reach the target; a i j , b i j represents the upper and lower limits of the jth index and the ith year, respectively.
The total contribution of the three subsystems can be calculated by the linear weighting method:
U i T n k i = j = 1 m u i k i j ω j
where ω j is the compound weight of the jth index; U i T n k i is the contribution of each subsystem to the order of the complex system and m is the number of indexes in each subsystem.

2.3.2. Synergy Degree of a Complex System

The synergy degree of a complex system is the result of multiple subsystems, which can reflect the development of benefits from each subsystem in the system.
Firstly, the order degree of the three subsystems is,
L = θ i = 1 3 U i T n k i U i T 1 k i 3
where θ needs to meet the following conditions:
θ = m i n U i T n k i U i T 1 k i 0 m i n U i T n k i U i T 1 k i 0
where T n is the time relative to the initial time T 1 ; L is the order degree of a complex system at the time T n .
Further, the synergy degree is related to the order degree and deviation rate of the whole system. It is calculated by Equation (17) [22] and classified according to Table 2 [23]. The higher the synergy degree, the better the operation of the system is.
M = L T n 1 Q ,   Q = n = 1 7 L T n L T 1 n 1 3 L T n
where M is the synergy degree at a time T n . Q is the deviation rate of order degree of a complex system.

2.4. Computing Steps

Based on the above methods, the computing steps in the paper can be summarized as follows, and the flowchart is shown in Figure 1.
Step 1: Construct the evaluation index system for the hydropower project supported by the complex system framework.
Step 2: Determine the subjective and objective weights based on the AHP and the entropy methods, and then calculate the compound weight.
Step 3: Calculate the order degree of the three subsystems, investigate the synergy degree, and provide the evaluation criterion for the synergy degree.
Step 4: Using a gate dam as an example, verify the efficiency and applicability of the proposed method.

3. Case Study

3.1. Project Specifications

The proposed method is applied to a gate dam (named SG), which is shown in Figure 2. The main tasks of the SG dam are electricity generation, flood prevention, and disaster reduction, and energy-saving, and emission reduction can be obtained as the result of electricity generation. The SG dam has an important impact on the economic, social, and ecological aspects of the region. The total dynamic investment of the project is RMB 5686 billion. The control catchment area of the dam site is 72,900 km2, accounting for 94% of the entire watershed area. The annual average flow at the dam site is 1350 m3/s, the normal storage level is 660 m, the installed capacity is 660 MW, and the annual power generation is 3235 billion kWh. The power generation is 918 million kWh and the average output is 253 MW in the period of the dry season.
The relevant data of the SG dam during 2011–2018 was selected as the research object, and these data of the evaluation of the comprehensive benefits index are obtained in the books of Statistical Yearbook of Y City, S Province (2010–2018), Statistical Bulletin of National Economic and Social Development of Y City, S Province (2010–2018) and Water Conservancy Statistics Bulletin of Y, S Province (2010–2018).

3.2. Benefits Index System and Weights

According to the index construction method above and considering the data availability, comparability, and actual situation of the SG dam, the evaluation of the benefits index system of this study was constructed and which includes the economic, social, and ecological aspects of the project (Table 3).
Based on the evaluation indexes in Table 3, the authors used the AHP. By constructing a judgment matrix to calculate the maximum eigenvalue of the matrix and vector features, the judgment matrix that this paper constructed through the consistency test (CR = 0.024 < 0.1) and the subject weights of each subsystem evaluation index were determined. After the normalization of the raw data, the objective weights of each subsystem evaluation index were calculated by the entropy methods. Then, the compound weight was determined, which is shown in Table 4.

3.3. Analysis of the Order Degree of Subsystems

Since the original data dimensions of each evaluation index are not uniform and incomparable, the Min–Max normalization method was used to standardize the original data by a linear transformation, so that the result value was mapped between 0 and 1 and could be de-dimensionalized to meet the requirement of comparability.
According to Equation (9), the order degree of the evaluation index can be calculated and then the order degree of the economic, social, and ecological benefits subsystem of the SG dam can be determined by Equation (10). The final order degree of each index of the dam project is shown in Table 5, and it was found that:
  • The order degree of the economic benefits subsystem increases after the first drop in 2015 and rises again in 2018. Owing to the interweaving of many factors, such as seasonal power generation (2013–2014), higher management costs (2015–2018), the rapid development of the regional economy, and the adjustment of industrial structure, the order degree of economic benefits subsystem fails to continue to be in a good condition.
  • The order degree of the social benefits subsystem keeps rising from 2011 to 2018, with a significant improvement in the order degree of the social benefits subsystem after 2015. The mutual restriction of each factor, such as the contribution rate of taxation and the direct and indirect employment effect, led to the consistent growth of the social benefits subsystem.
  • The ecological benefits subsystem rises sharply in 2013, and its order maintains a stable state from 2013, in a range of 0.7 and 0.8. During the early period of operation from 2010 to 2011, the soil and water loss caused by the dam construction is under management, and its impact on the quality of the ecosystem and the local microclimate has not been fully manifested. Therefore, the ecological benefits subsystem is in a low state in the early stage.
The above results show that though the order degree of the three benefits subsystems fluctuates in some years, the overall trend stays upward. Compared with the other two subsystems, the ecological benefits subsystem has the highest order degree, particularly in the year of 2014 to 2017, indicating that more attention has been paid to it.

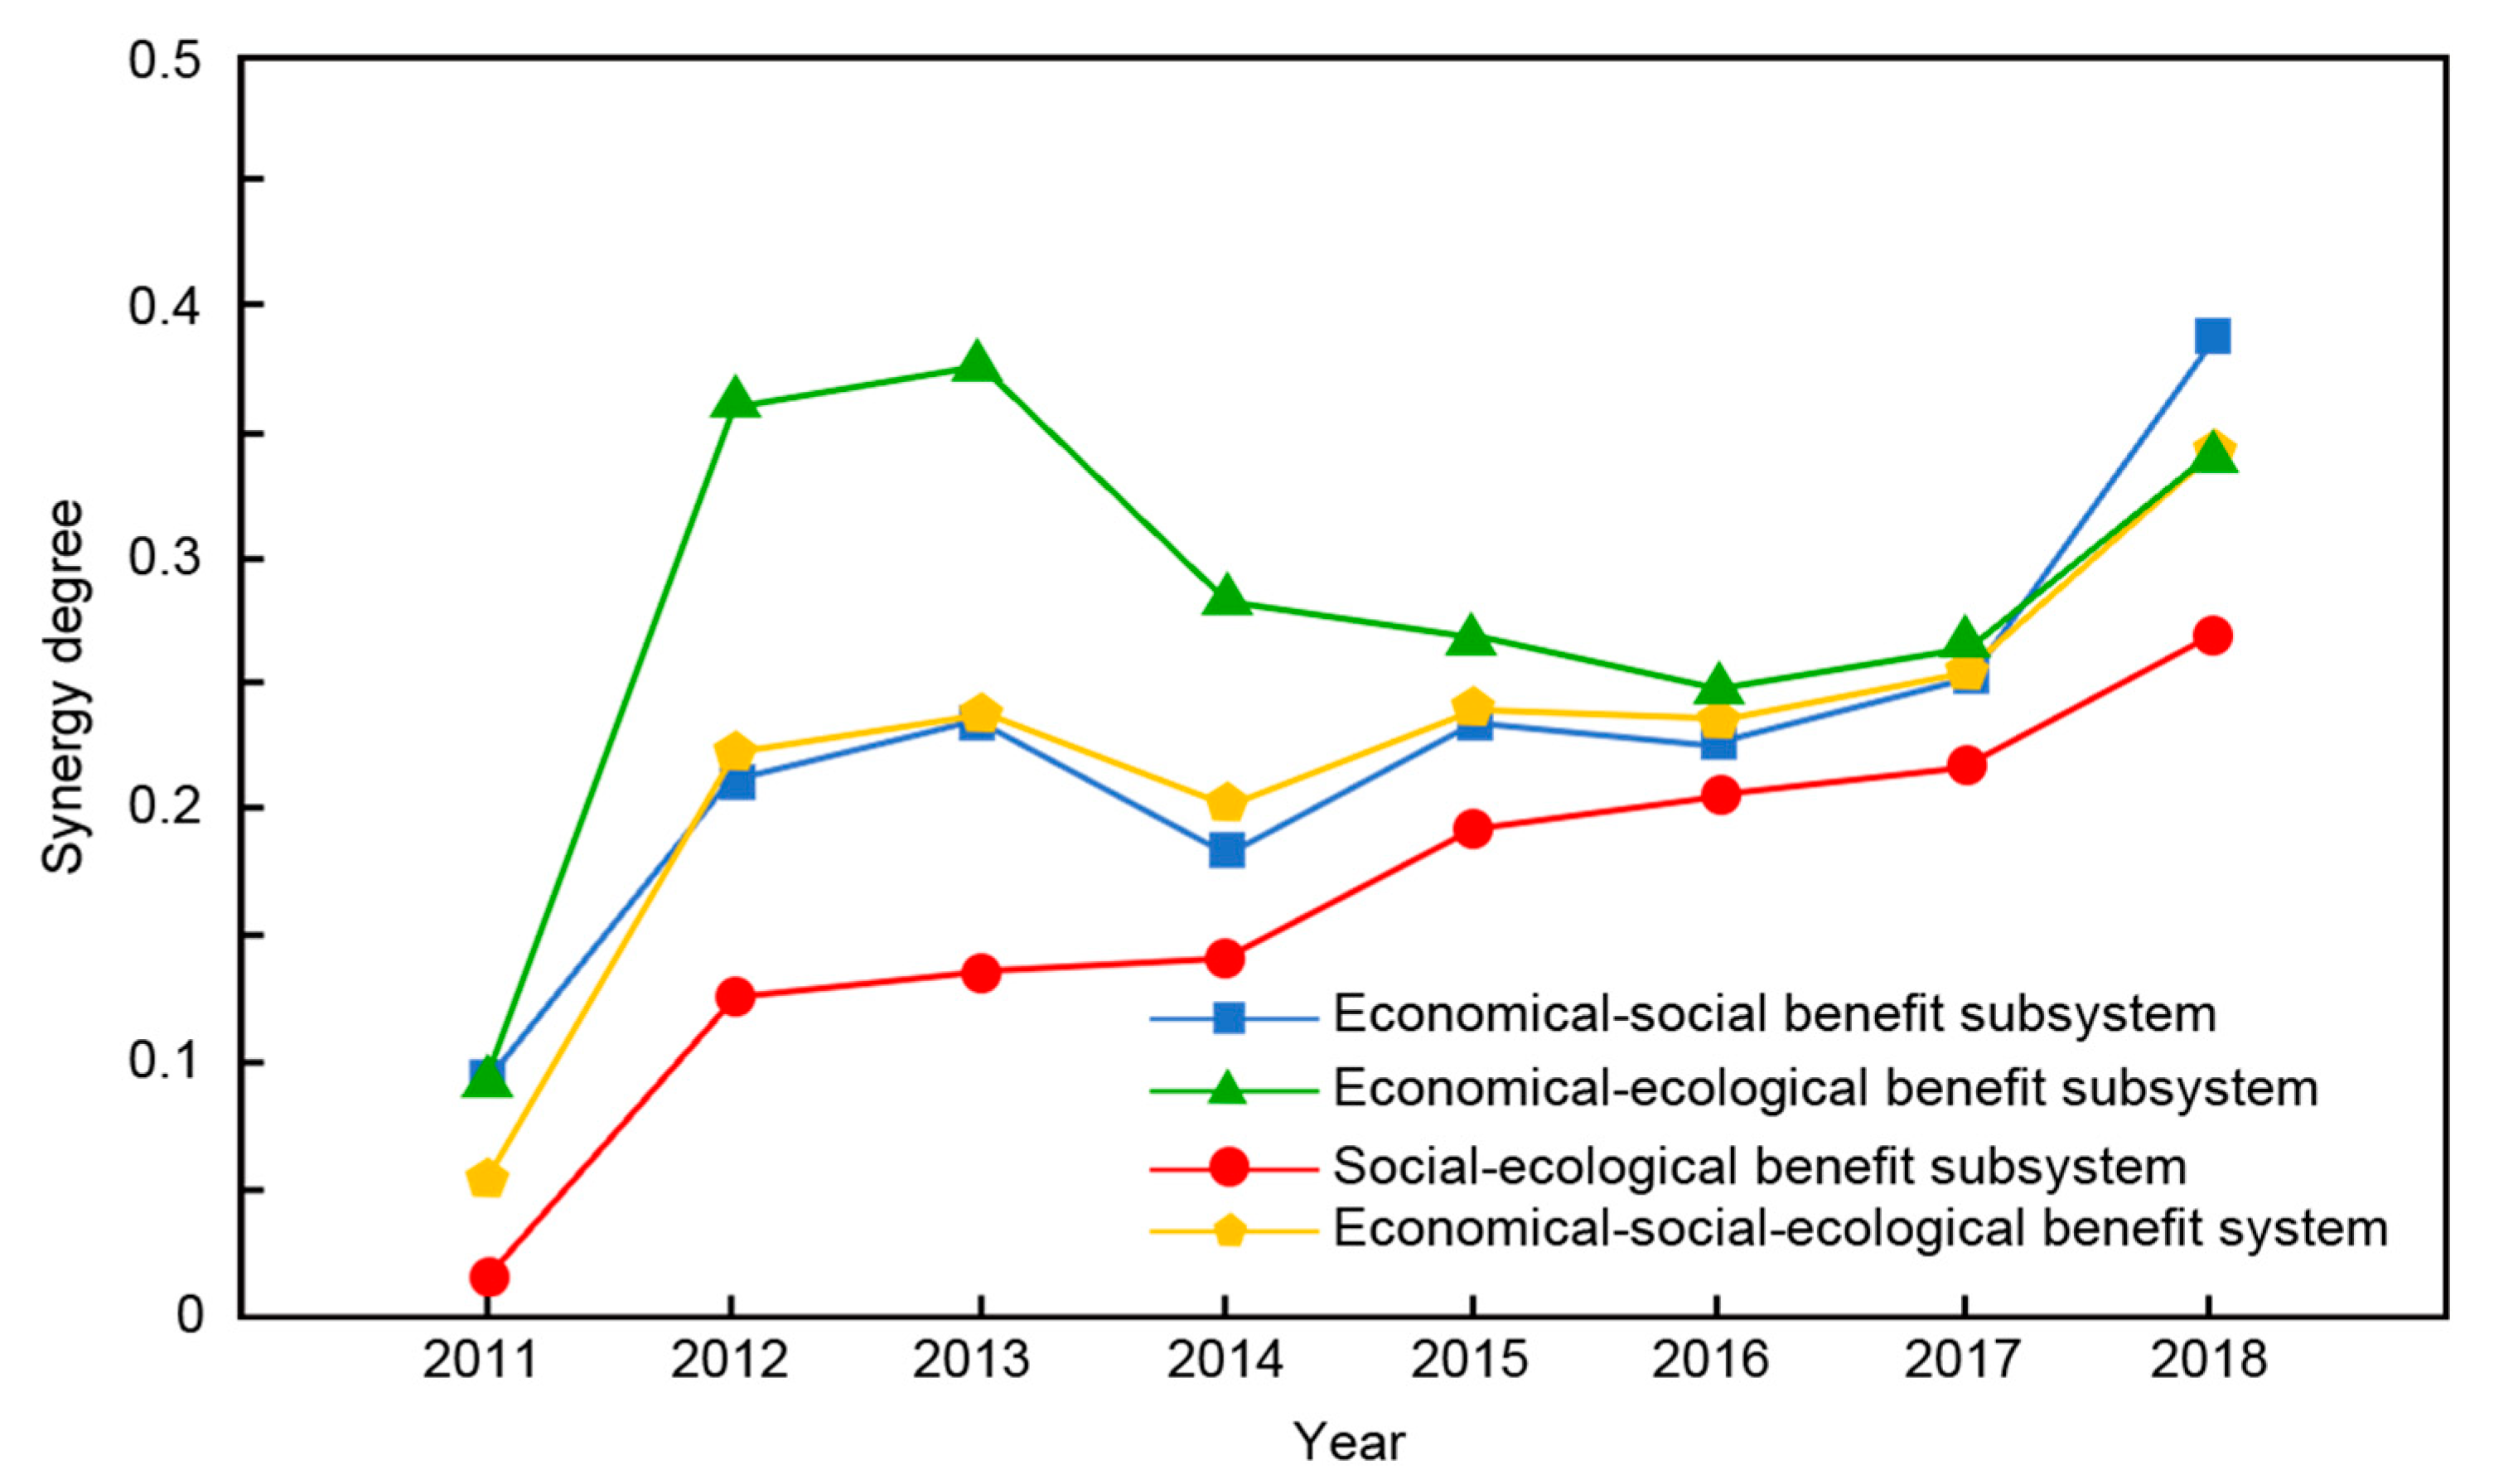
3.4. Analysis of the Synergy Degree of Subsystems

Taking the year of 2010 as the base period, the order degree of economic, social, and ecological benefits is used as intermediate variables to analyze the synergy status of the complex system.
Based on Equations (11) and (12), the synergy degree of economic–social, economic–ecological, social–ecological, and economic–social–ecological comprehensive benefits of the SG dam from 2011 to 2018 can be obtained, which is shown in Figure 3. It can be found that:
  • The order degrees of all subsystems at the time Tn are greater than their order degree at the initial time T1 (2011), indicating that the complex system is in a state of synergistic evolution. The synergy degree fluctuates between 0.053 and 0.342. Its level belongs to “Bottom synergy” between 2011 and 2016, then develops into “Moderate synergy” from 2017 to 2018, showing an “N-shaped” trend: the synergy degree shows an upward trend at first, but it drops for the first time in 2014 and then rises again in 2017.
  • Although the economic–social benefits subsystem has gradually entered a better development state, due to the low level of social–ecological benefits the synergy degree of the complex system is still low. The reason is that the SG dam has the characteristics of single investment channels, low investment efficiency, unstable power generation, dynamic income changes, immature management, and so on. The interactions among these factors will inevitably lead to large fluctuations in the economic, social, and ecological benefits at the initial stage of dam operation. Therefore, decision-makers need to put forward a scientific management program to solve the uneven synergistic relationships of different benefits.
The order degree shows the effectiveness of the economic, social, and ecological benefits of the SG dam. The key to improving the synergy of the comprehensive benefits of the project is to improve the benefits of each subsystem in an all-round way, and the focus is to find out the shortboard that affects the economic, social, and ecological benefits of the subsystems, and to carry out dynamic evaluation and adjustment.

4. Conclusions

Selecting the optimal project management from the perspective of synergy is the key to achieving comprehensive benefits when multiple benefits are executed in parallel. Some conclusions can be drawn as:
  • Starting with the Synergy theory, this article combines the concept of synergy with the field of the comprehensive benefits of the hydropower project and regards it as a complex system, which is subdivided into three subsystems: economic, social, and ecological benefits. Based on the complex system, this paper identifies the indexes that affect the comprehensive benefits of a hydropower project, which establishes the evaluation system.
  • Both subjective weight and objective weight have their advantages and disadvantages. On these bases, the non-linear model and Lagrange function are introduced to determine the compound weight in the evaluation process, which can take both advantages of subjective experience and the objective facts to avoid evaluation bias caused by an imperfect index system.
  • Synergy theory can explain the degree of coordinated development of internal subsystems and elements. A synergy-degree evaluation method for hydropower projects, comprising the order degree of subsystems and the synergy degree of the complex system, is proposed by geometric average and weighted sum methods to analyze the synergistic relationships among the subsystems.
  • The case study conducted a synergy evaluation on the SG dam from 2011 to 2018 and showed that although the SG dam has good economic, social, and ecological benefits individually, the synergy degree of a complex system is in a low and unbalanced state due to the low synergetic effects between the social and ecological benefit subsystems. Results can provide some advice for the management of each benefit subsystem of hydropower projects.
The utilization of synergy for the analysis of the comprehensive benefits of hydropower projects is very valuable. Measuring synergy degree can help projects in improving benefit, which enables projects to achieve sustainable development and integrate economic, social, and ecological benefits.

Author Contributions

Conceptualization, X.Z. and J.C.; methodology, X.Z.; software, X.Z. and J.L.; validation, C.C. and X.L.; formal analysis, X.Z. and Y.L.; investigation, Y.W.; resources, Y.W.; data curation, X.Z. and J.L.; writing—original draft preparation, X.Z.; writing—review and editing, X.Z. and X.L.; visualization, X.Z.; supervision, J.C.; project administration, X.Z.; funding acquisition, J.C. All authors have read and agreed to the published version of the manuscript.

Funding

This research was funded by the National Key R&D Program of China, NO. 2018YFC0407103.

Institutional Review Board Statement

Not applicable.

Informed Consent Statement

Not applicable.

Data Availability Statement

Not applicable.

Conflicts of Interest

The authors declare no conflict of interest.

References

  1. Kan, R.L.; Huang, J.; Zhou, J.; Kung, H.T. Function Change and Heritage Tourism Development of Water Conservancy Project. Resour. Dev. Mark. 2014, 30, 1521–1524. [Google Scholar]
  2. Deng, M.J.; Huang, Q.; Chang, J.X.; Huang, S.Z.; Guo, A.J. Connotation, Process and Dimensionality of Generalized Ecological Water Conservancy. Adv. Water Sci. 2020, 31, 775–792. [Google Scholar]
  3. Guo, Q.Y.; Li, C.H.; Cui, B.S. The impacts of the Laxiwa Dam on the regional eco-environment. J. Nat. Resour. 2003, 18, 50–57. [Google Scholar]
  4. Liu, X.; Xu, C.; Zhang, Z.; Zhang, Y.; Wu, S. Study on the role of eco-environmental impact assessment in performance management assessment of large water conservancy projects. Ekoloji 2019, 28, 1165–1172. [Google Scholar]
  5. Sun, X.P.; He, S.M.; Guo, Y.; Sima, W.P.; Liu, W.F.; Wang, Y.H. Comprehensive Evaluation of The Impact of the Water Conservancy Project in on the Ecosystem of the Yangtze River Basin. Coast. Educ. Res. Found. 2019, 94, 758–762. [Google Scholar] [CrossRef]
  6. Qu, S.; Zhang, Y.; Zhang, Q. Comprehensive assessment of the management mode of small water conservancy projects based on matter-element extension. J. Eng. Sci. Technol. Rev. 2019, 12, 78–83. [Google Scholar]
  7. Zhu, Q.Y.; Fang, G.H. Evaluation index system for positive operation of water conservancy projects. Water Sci. Eng. 2009, 2, 110–117. [Google Scholar]
  8. Gao, Y.Q.; Fang, G.H.; Liu, Y.Q. θ-improved limited tolerance relation model of incomplete information system for evaluation of water conservancy project management modernization. Water Sci. Eng. 2013, 6, 469–477. [Google Scholar]
  9. Gao, Y.Q.; Fang, G.H.; Xu, Y.P.; Zhang, X.; Qu, L.J. Evaluation of Water Conservancy Project Management Modernization Based on Improved intelligent algorithm. Appl. Math. Inf. Sci. 2013, 7, 1173–1179. [Google Scholar] [CrossRef]
  10. Zhu, J.W.; Jing, X.N.; Guo, P.L.; Jiang, J.J. Evaluate the efficiency of water conservancy investment in Shaanxi Province based on super-efficient DEA and malmquis index. IOP Conf. Ser. Earth Environ. Sci. 2019, 344, 012132. [Google Scholar] [CrossRef]
  11. Haken, H. Visions of synergetics. J. Frankl. Inst. 1977, 34, 759–792. [Google Scholar]
  12. Bai, L.B.; Chen, H.L.; Gao, Q.; Luo, W. Project portfolio selection based on synergy degree of composite system. Soft Comput. 2018, 22, 5535–5545. [Google Scholar] [CrossRef]
  13. Huang, X.; Song, J.Y.; Li, X.; Bai, H. Evaluation model of synergy degree for disaster prevention and reduction in coastal cities. Nat. Hazards 2020, 100, 933–953. [Google Scholar] [CrossRef]
  14. Jiao, L.L.; Deng, F.M.; Liang, X.D. Sustainable Urbanization Synergy Degree Measures—A Case Study in Henan Province, China. Sustainability 2018, 10, 9. [Google Scholar] [CrossRef] [Green Version]
  15. Wang, X.K.; Dong, Z.C.; Xu, W.; Luo, Y.; Zhou, T.; Wang, W.Z. Study on Spatial and Temporal Distribution Characteristics of Coordinated Development Degree among Regional Water Resources, Social Economy, and Ecological Environment Systems. Int. J. Environ. Res. Public Health 2019, 16, 4213. [Google Scholar] [CrossRef] [Green Version]
  16. Singh, R.P.; Nachtnebel, H.P. Analytical hierarchy process (AHP) application for reinforcement of hydropower strategy in Nepal. Renew. Sustain. Energy Rev. 2016, 55, 43–58. [Google Scholar] [CrossRef]
  17. Haken, H. An Introduction to Snergetics; Atomic Energy Press: Beijing, China, 1984. [Google Scholar]
  18. Golden, B.L.; Wasil, E.A.; Harker, P.T. The Analytic Hierarchy Process: Applications and Studies; Springer: Berlin/Heidelberg, Germany, 1988. [Google Scholar]
  19. Zhang, X.Q.; Liang, C.S. Application of fuzzy matter-element model based on coefficients of entropy in comprehensive evaluation of water quality. J. Hydraul. Eng. 2005, 36, 1057–1061. [Google Scholar]
  20. Ding, X.W.; Chong, X.; Bao, Z.F.; Xue, Y.; Zhang, S.H. Fuzzy Comprehensive Assessment Method Based on the Entropy Weight Method and Its Application in the Water Environmental Safety Evaluation of the Heshangshan Drinking Water Source Area, Three Gorges Reservoir Area, China. Water 2017, 9, 329. [Google Scholar] [CrossRef] [Green Version]
  21. Wang, M.Y.; Liu, Y.; Li, M.M.; Liu, Y.W.; Shi, W.Q. Construction and application of evaluation model for coordinated degree of regional carbon emission. Syst. Eng.—Theory Pract. 2020, 40, 470–483. (In Chinese) [Google Scholar]
  22. Zhu, J.W.; Gao, H.; Wang, J.R. Analysis of synergy degree and its influencing factors in hydropower EPC project management. Front. Eng. Manag. 2020, 8, 402–411. [Google Scholar] [CrossRef]
  23. Zhang, T.; Tan, Q.; Yu, X.N.; Zhang, S. Synergy assessment and optimization for water-energy-food nexus: Modeling and application. Renew. Sustain. Energy Rev. 2020, 134, 110059. [Google Scholar] [CrossRef]
Figure 1. The flow chart of the synergy evaluation method and its application.
Sustainability 13 10770 g001
Figure 2. The regional location and the surrounding environment of the SG dam.
Sustainability 13 10770 g002
Figure 3. The synergy degree of the system in the SG dam.
Sustainability 13 10770 g003
Table 1. Random index (RI) for n = 3–13.
n345678910111213
RI0.520.891.121.261.361.411.461.491.521.541.56
Table 2. Evaluation criterion for synergy degree.
Level of Synergy DegreeSynergy Degree
Bottom synergy0 < M ≤ 0.25
Moderately synergy0.25 < M ≤ 0.5
Highly synergy0.5 < M ≤ 0.75
Extremely synergy0.75 < M ≤ 1
Table 3. Evaluation indexes of the comprehensive benefits system for the hydropower projects.
SystemSubsystemIndexesInstructions
Comprehensive benefits system AEconomic benefits B1The ratio of operating cost to revenue C1Negative: Percentage of the total annual cost to a total annual income
Earnings power of the real concept C2Positive: Total annual profits as a proportion of total investments
The annual capacity of electric production C3Positive: Production capacity of hydropower projects
GDP arising from hydropower projects C4Positive: GDP added value of hydropower projects, calculated by income method, is an additive combination of the labor compensation, net taxed on production, depreciation of fixed assets and earning surplus.
Stimulating effect from hydropower projects on the economy C5Positive: GDP generated by hydropower projects as a proportion of the added value of the industrial industry
Social benefits B2Fiscal contribution C6Positive: The tax revenue contribution from hydropower projects
Urbanization rate C7Positive: Proportion of urban population in the location of hydropower projects to the total population
The direct and indirect employment effect C8Positive: The number of new jobs created by hydropower projects, provided by the enterprise of the SG dam.
Per capita disposable income C9Positive: Per capita disposable income of residents in the locality of hydropower projects
Ecological benefits B3 Water loss and soil erosion C10Negative: Soil erosion in areas directly affected by hydropower projects
Climatic regulation C11Positive: Rainfall per year from June to September at the site of hydropower projects
Quality of ecosystems C12Positive: Ratio of natural resources such as forest thickets to total ecosystem area in the range of the SG dam
Note: GDP, the gross domestic product. The locality of hydropower projects is depending on the radiation range of the project, the range of the study was defined as the county where the SG dam is located.
Table 4. Weights for the evaluation indexes of comprehensive benefits for the SG dam.
SystemSubsystemIndexSubject
Weight
Objective WeightCompound Weight
Comprehensive benefits systemEconomic benefitsThe ratio of operating cost to revenue0.0970.230.162
Earnings power of the real concept0.1460.1460.146
The annual capacity of electric production0.1770.1020.140
GDP arising from hydropower projects0.1960.1620.180
Stimulating effect from hydropower projects on the economy0.3840.360.372
Social benefitsFiscal contribution0.1670.1640.166
Urbanization rate0.1670.2690.218
The direct and indirect employment effect0.3330.3250.329
Per capita disposable income0.3330.2420.288
Ecological benefitsWater loss and soil erosion0.3330.7270.496
Climatic regulation0.3330.1150.243
Quality of ecosystems0.3330.1580.261
Table 5. Order degree of the three subsystems of the SG dam.
YearEconomic Benefits SubsystemSocial Benefits SubsystemEcological Benefits Subsystem
20110.0420.1850.329
20120.7680.2160.355
20130.7680.3340.715
20140.8230.3530.718
20150.4820.3660.721
20160.4330.5230.725
20170.3640.5650.736
20180.4050.6010.741
Publisher’s Note: MDPI stays neutral with regard to jurisdictional claims in published maps and institutional affiliations.

